Schematic memory components converge within angular gyrus during retrieval
- Radboudumc, The Netherlands
- Radboud University, The Netherlands
- New York University, United States
- University of Edinburgh, United Kingdom
Figures
Figure 1 with 2 supplements

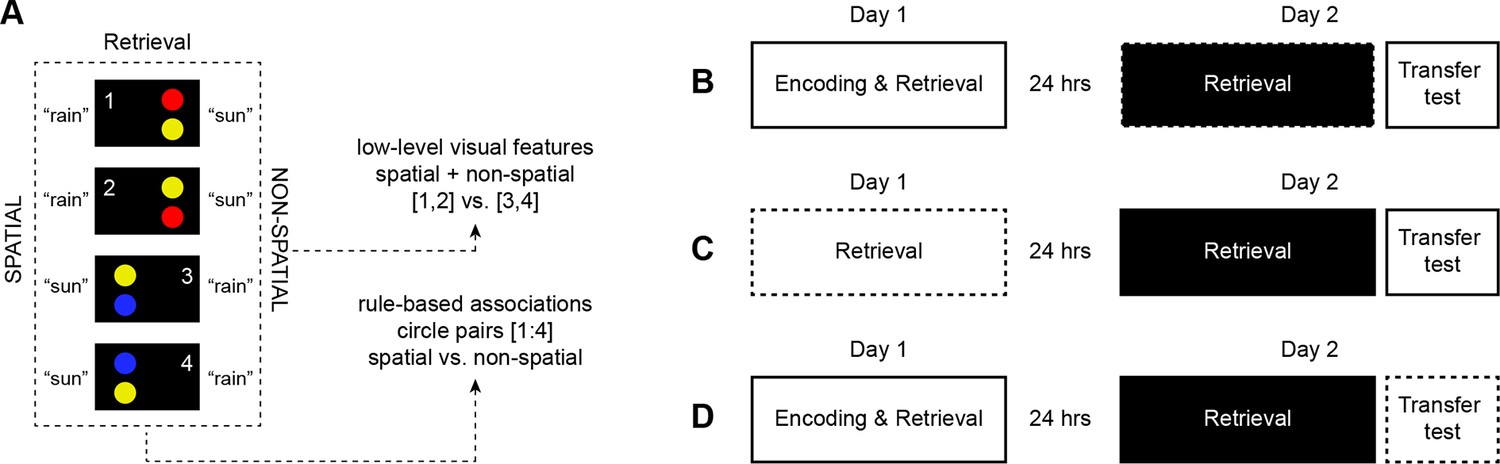
Study timeline and schema material.
(A) Subjects underwent fMRI on two consecutive days, each containing 7 runs (day 1: encoding and retrieval; day 2: retrieval). A transfer test was completed at the end of day 2 and consisted of two runs (encoding and retrieval). (B) Stimulus material during encoding comprised four horizontal circle pairs. Spatial (position) or non-spatial (color) rule-based schemas were used to predict fictive "sun" or "rain" outcomes. Stimulus material during retrieval consisted of four vertical circle pairs (for a detailed description of the experiment, please see Materials and methods, Material and task and Materials and methods, Procedure). We used retrieval trials on day 2 to dissociate the multi-voxel patterns of schema components that consisted of rule-based associations and low-level visual features (Figure 1—figure supplement 1). Figure 1—figure supplement 2 illustrates experimental trials during encoding, retrieval, and during the perceptual baseline condition.
Figure 1—figure supplement 1
Multi-voxel pattern analysis (MVPA).
(A) We used MVPA to discriminate between schema components, which were defined as (1) rule-based associations (spatial vs. non-spatial, while collapsing across circle pairs 1–4), and (2) low-level visual features of the stimulus material (circle pair 1 + 2 vs. 3 + 4, while collapsing across spatial and non-spatial schema conditions). Numbers were not shown to subjects. (B) First, we trained a classifier on day 2 (black) and tested every independent run of the same day (dashed line), using a seven-fold leave-one-run-out cross-validation procedure. (C) Next, we tested the generalization of multi-voxel patterns across days by training a classifier on day 2 (black) and testing it on day 1 (dashed line). (D) Finally, a classifier was trained on day 2 (black) and tested on data from the transfer test (dashed line). For a detailed description of the analysis please see Materials and methods, Multi-voxel pattern analysis.
Figure 1—figure supplement 2
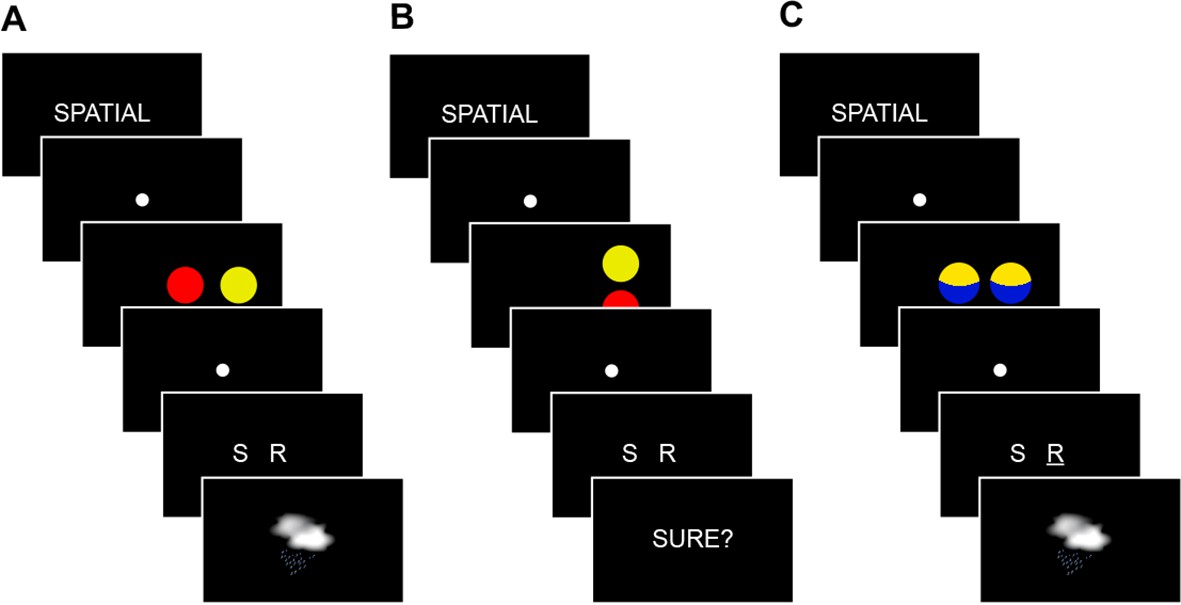
Experimental trials.
(A) During encoding trials, subjects received a cue (2 s) to apply either the spatial or non-spatial schema. Circle pairs were presented (3 s) and a response indicating the outcome was necessary (2 s). The correct feedback was provided (2 s). (B) During retrieval, subjects received a cue (2 s) to apply either the spatial or non-spatial schema. Circle pairs were presented (3 s) and a response indicating the outcome (2 s), and a confidence rating (2 s) were necessary. (C) Perceptual baseline trials matched the structure and timing of encoding and retrieval trials. They were independent of the rule-based schemas and a response option was marked (Materials and methods, Material and task and Material and task, Procedure).
Figure 2
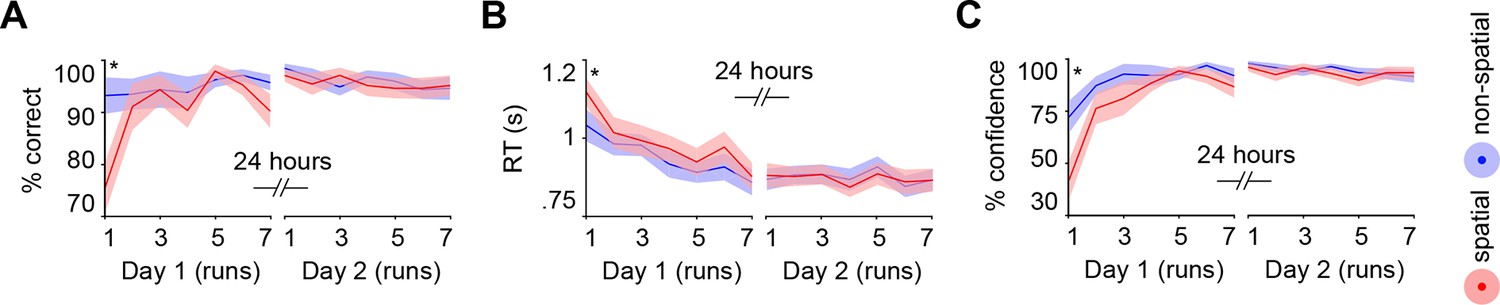
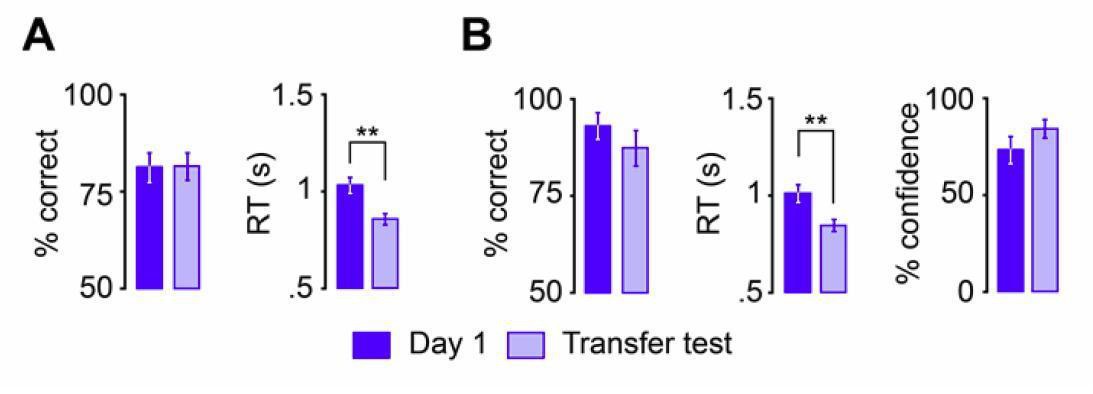
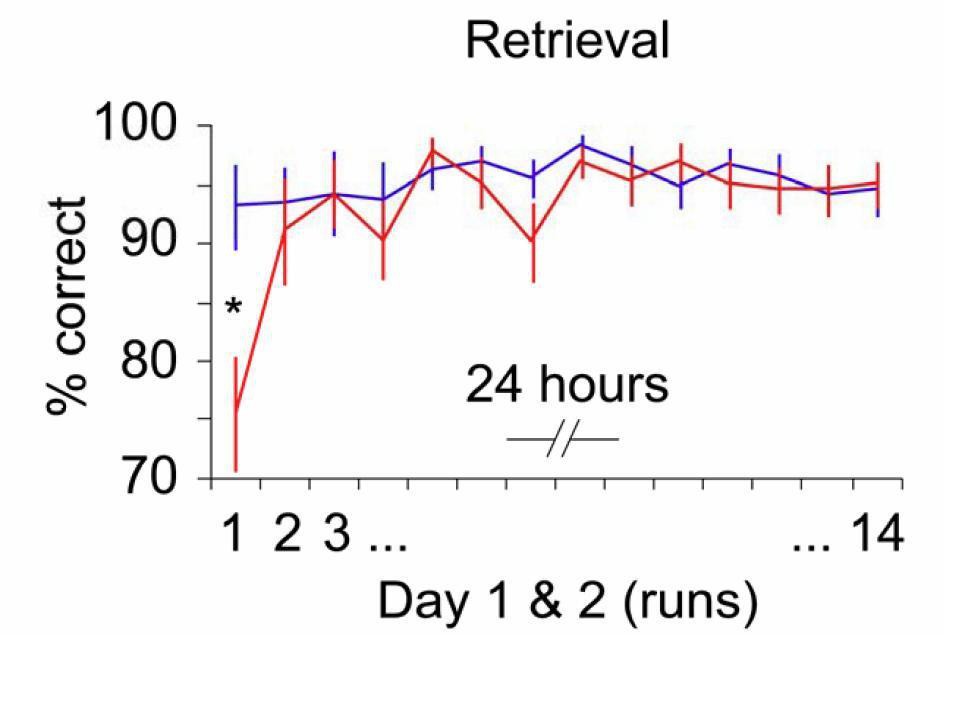
Behavioral performance during schema retrieval.
(A) Data represents the % of correct responses, (B) the average reaction time (s), and (C) the % of high-confident ratings (i.e. “sure”-responses). Shaded error bars denote ± standard error of the mean (s.e.m.). * marks a significant (P < 0.05) difference between the schema conditions within the first run of day 1.
Figure 3
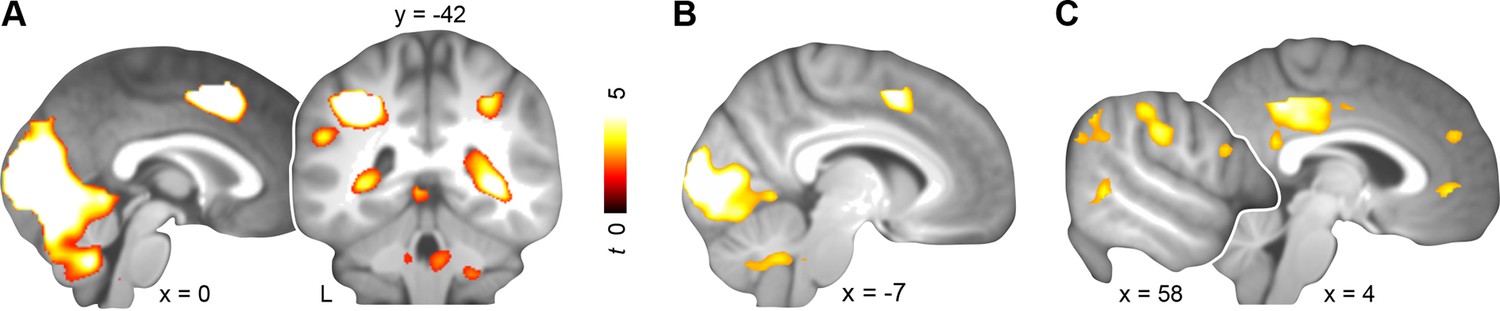
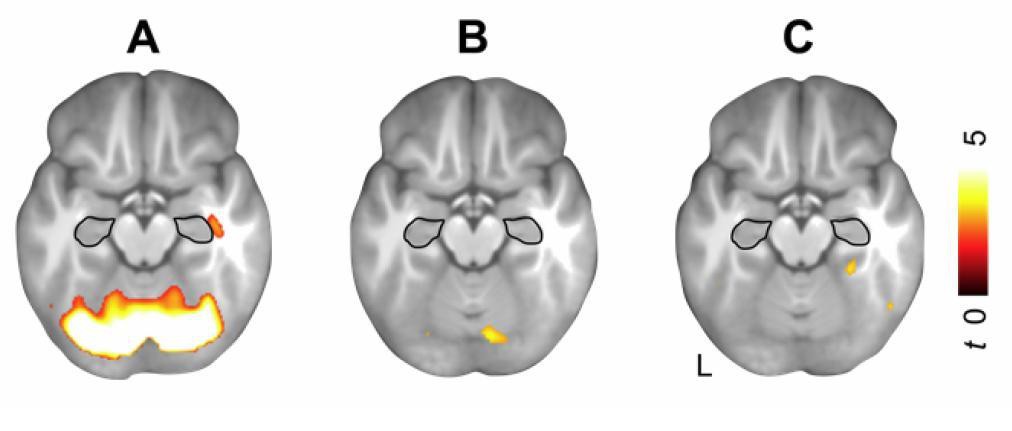
Activation during schema retrieval.
(A) Increased BOLD responses during rule-based schema retrieval across both days (schema retrieval > perceptual baseline), (B) during rule-based schema retrieval on day 1 (day 1 > day 2), and (C) after an initial consolidation of 24 hours (day 2 > day 1). Contrasts B and C include runs 5 to 7 from day 1, and the first run from day 2. For display purposes, results were resliced to a voxel dimension of 0.5 mm isotropic and are shown at P < 0.001, uncorrected. Significant clusters are noted in Table 1. Results are superimposed onto the average structural scan derived from all subjects. L–left.
Figure 4
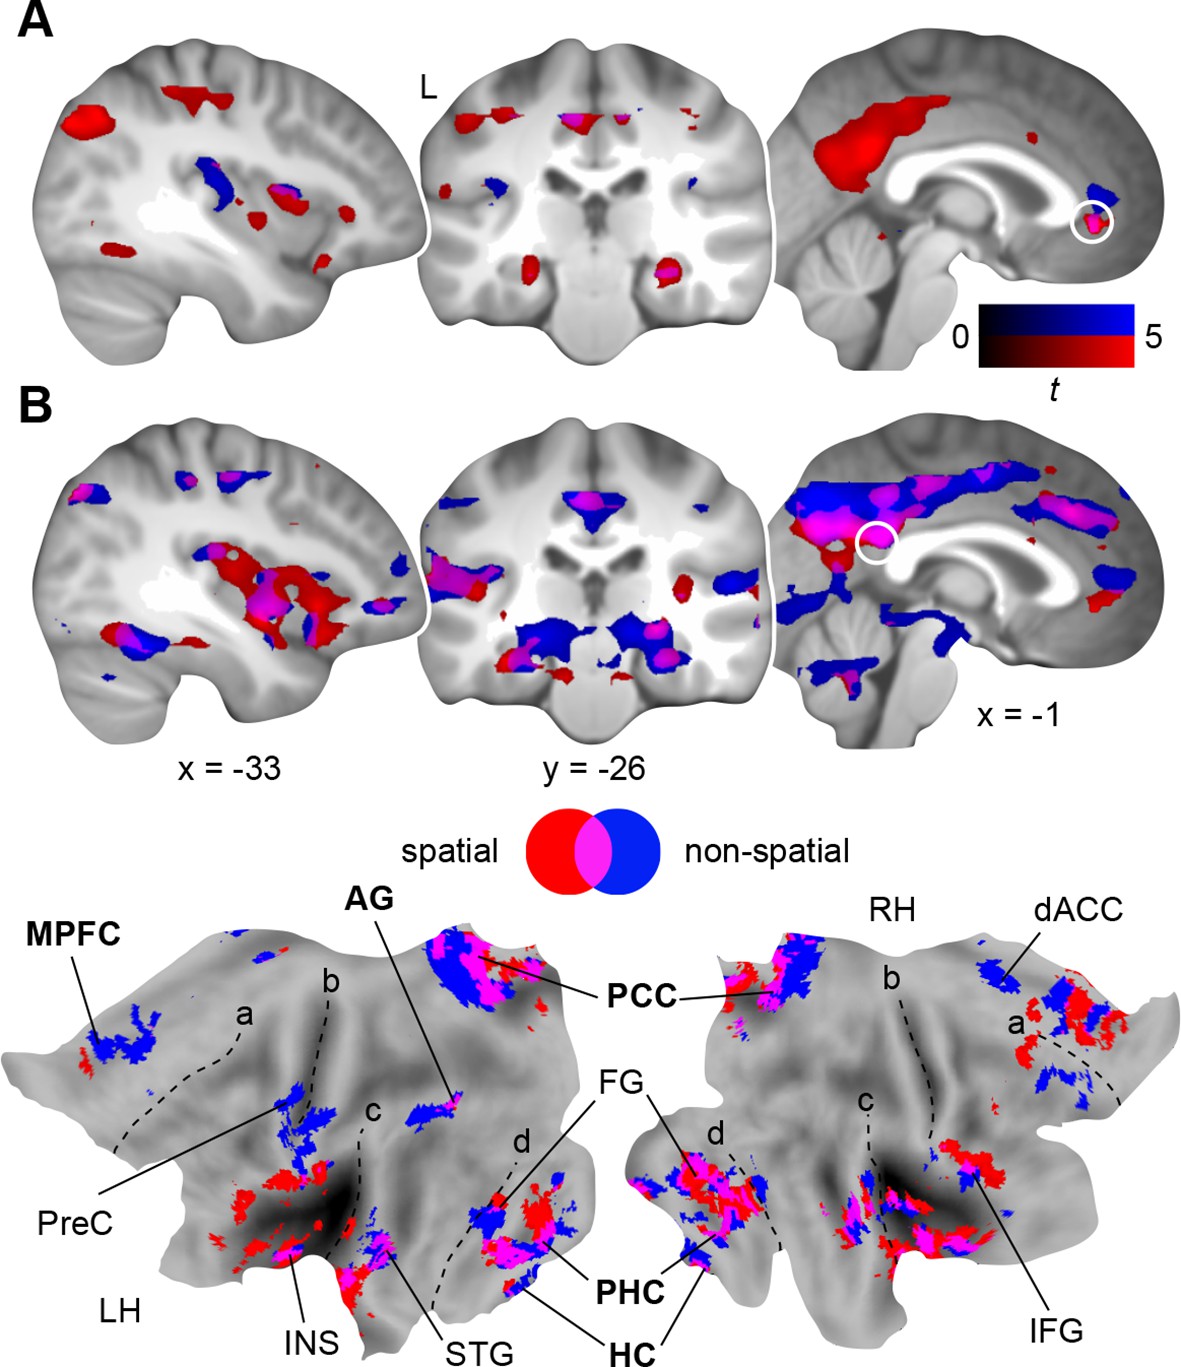
Schema retrieval networks: MPFC and PCC.
(A) MPFC seed (x = -2, y = 35, z = -2; based on the contrast day 2 > day 1, Figure 3C; here marked in white). (B) PCC seed (x = 2, y = -45, z = 22; based on the same contrast; here marked in white). General retrieval effects are shown in purple (schema retrieval > perceptual baseline). For display purposes, connectivity maps were resliced to a voxel dimension of 0.5 mm isotropic and are shown at P < 0.001, uncorrected. Significant clusters are noted in Table 2. L – right. Additionally, connectivity results (PCC seed) are projected onto a surface-based flatmap. Relevant structures are labeled: AG, angular gyrus; dACC, dorsal anterior cingulate cortex; FG, fusiform gyrus; HC, hippocampus; IFG, inferior frontal gyrus; INS, insula; MPFC, medial prefrontal cortex; PCC, posterior cingulate cortex; PHC, parahippocampal cortex; PreC, precentral gyrus; STG, superior temporal gyrus. Regions of the retrieval network are highlighted in bold font. Dashed lines are inserted to aid orientation: a, border between medial and lateral prefrontal cortices; b, central sulcus; c, superior temporal gyrus; d, border between ventromedial and -lateral temporal cortices. LH – left hemisphere, RH – right hemisphere.
Figure 5

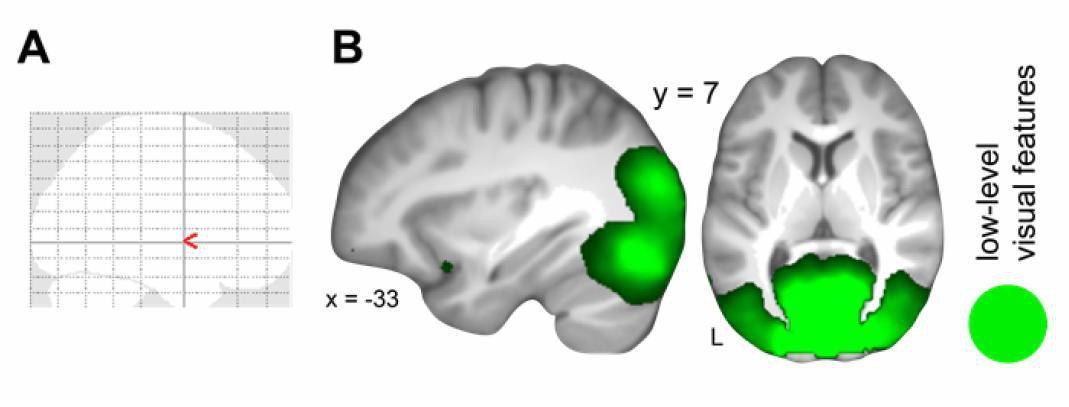
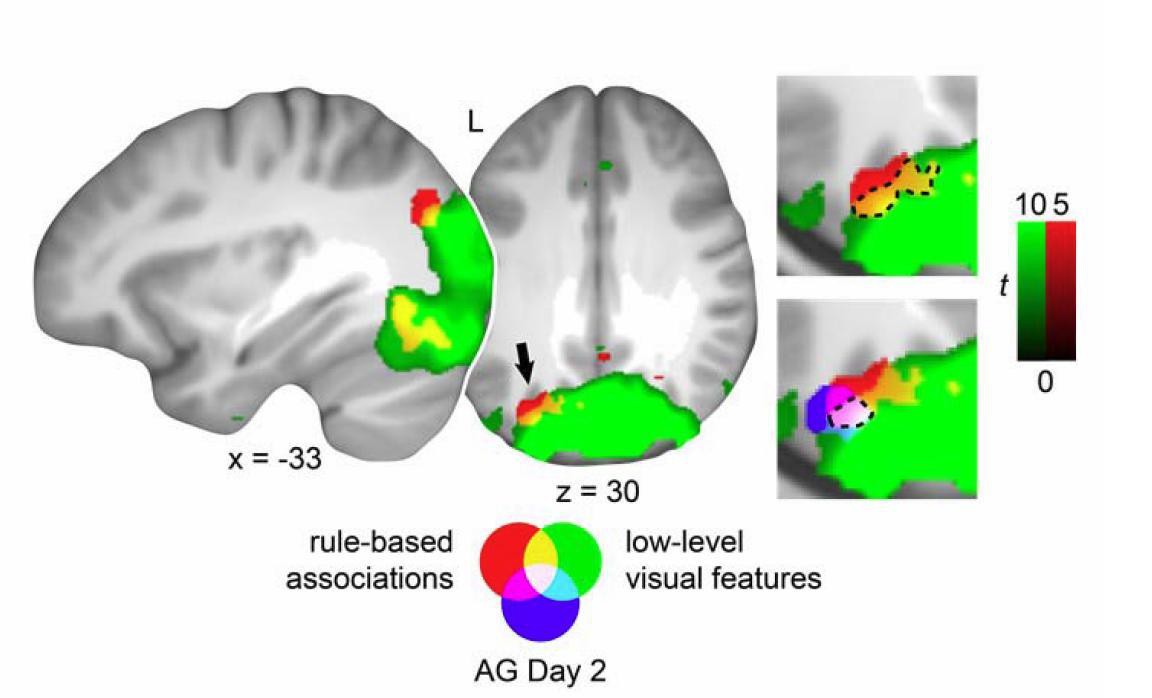
Multi-voxel representations of schema components.
(A) The searchlight MVPA revealed distributed representations of both schema components (rule-based associations, low-level visual features). These representational levels converged within the AG (yellow). Three horizontal slices are shown as cut-outs and are magnified to appreciate the overlap (Table 3). (B) Only the multi-voxel patterns of low-level visual features were shared between day 1 and day 2. For display purposes, all maps were resliced to a voxel dimension of 0.5 mm isotropic and are shown at P < 0.001, uncorrected. Significant clusters are noted in Table 3. L – left.
Figure 6

Schema convergence networks.
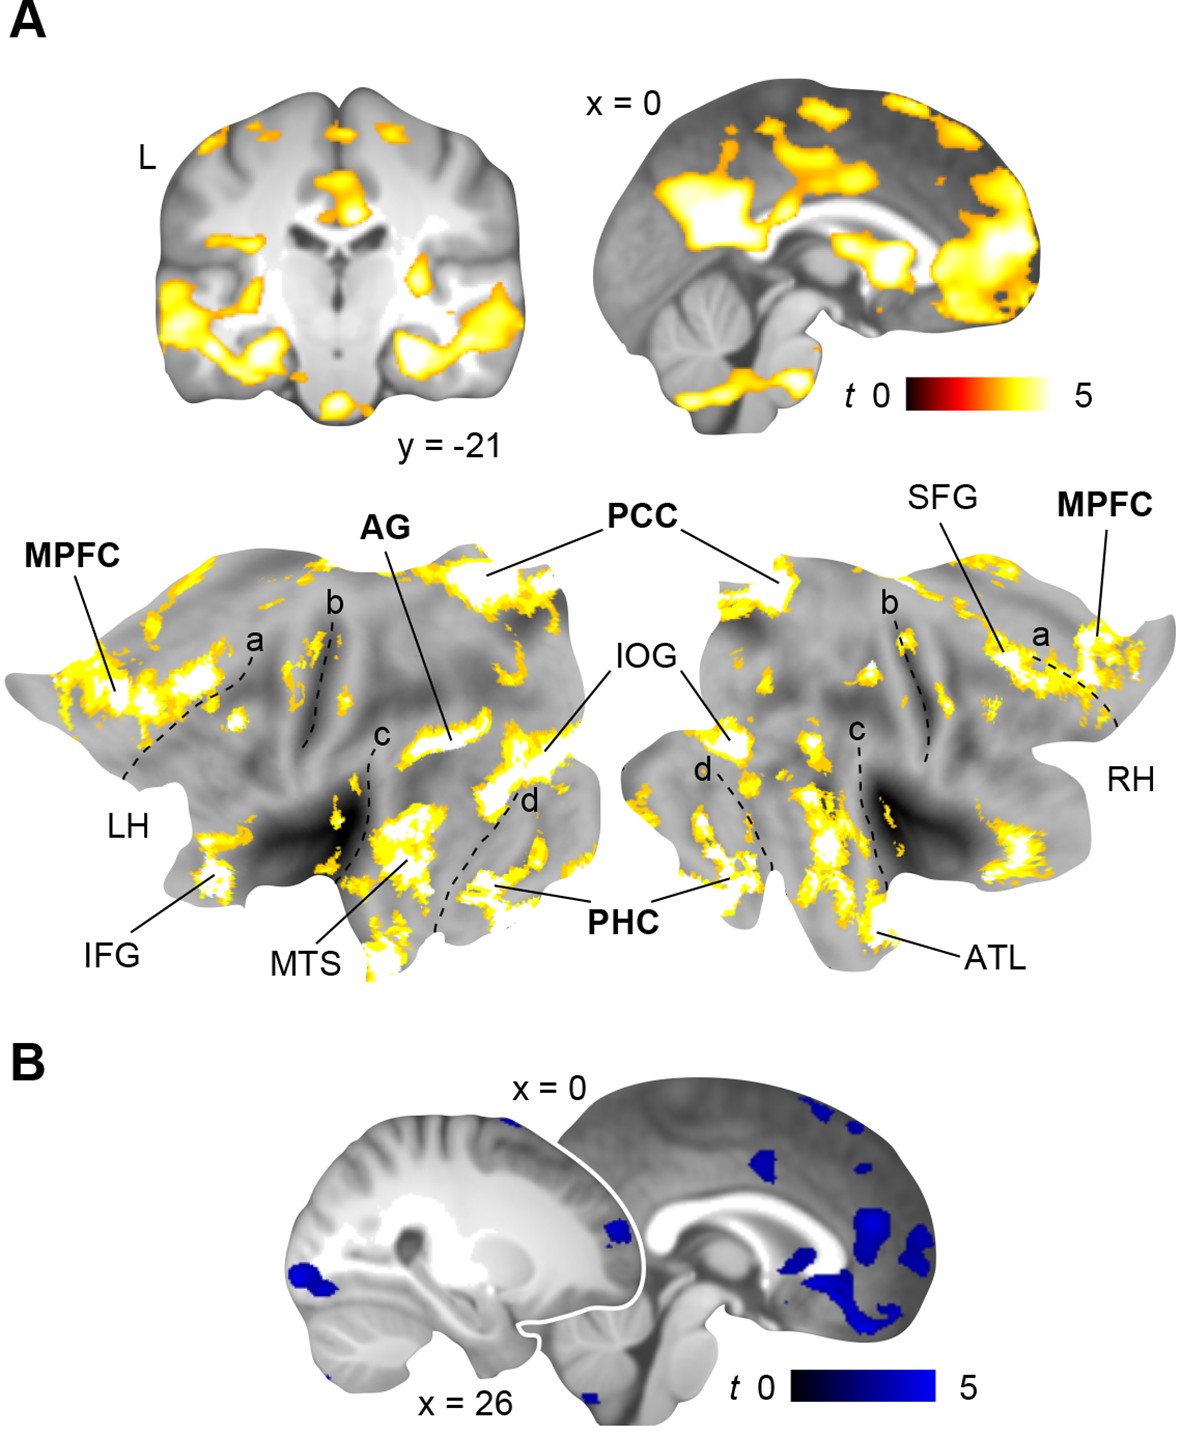
Functional connectivity of the left AG seed (defined as cluster of overlapping schema components; based on our MVPA result, Figure 5A, here marked in white) during schema retrieval (compared to the perceptual baseline). General retrieval effects are shown in purple. For display purposes, maps were resliced to a voxel dimension of 0.5 mm isotropic and are shown at P < 0.001, uncorrected. L – left. Significant clusters are noted in Table 4. Additionally, connectivity results are projected onto a surface-based flatmap. Relevant structures are labeled: AG, angular gyrus; FG, fusiform gyrus; IFG, inferior frontal gyrus; INS, insula; MPFC, medial prefrontal cortex; PCC, posterior cingulate cortex; PHC, parahippocampal cortex; STG, superior temporal gyrus. Regions of the retrieval network are highlighted in bold font. Dashed lines are inserted to aid orientation: a, border between medial and lateral prefrontal cortices; b, central sulcus; c, superior temporal gyrus; d, border between ventromedial and -lateral temporal cortices. LH – left hemisphere, RH – right hemisphere.
Figure 7
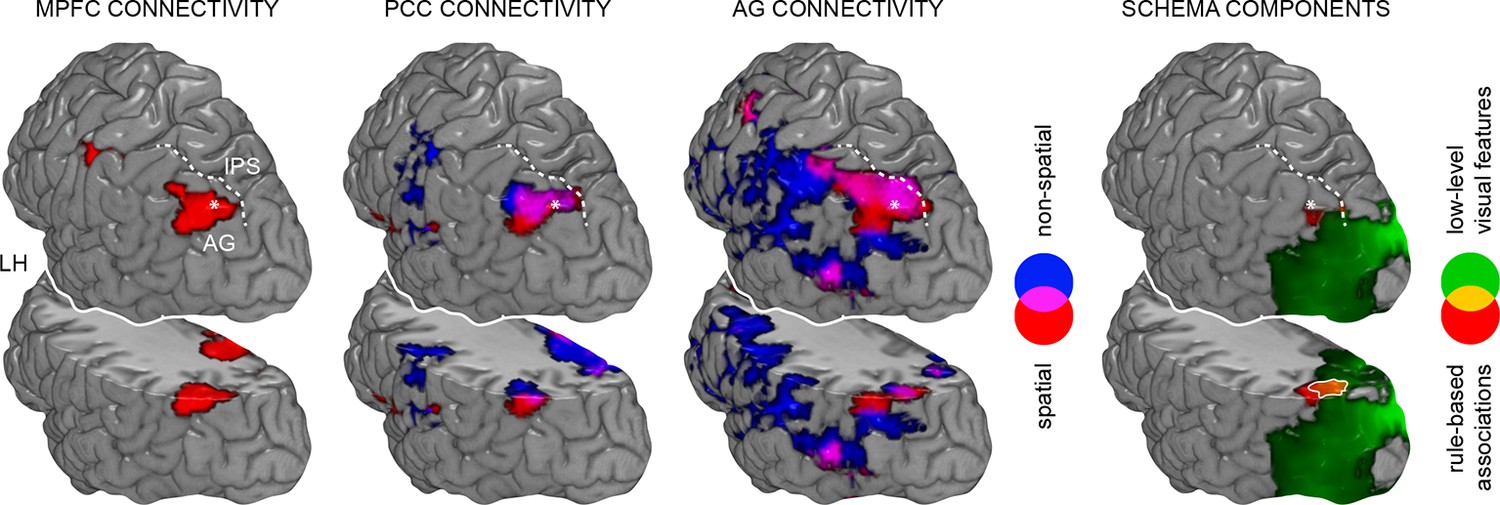
Spatial relationship between schema retrieval networks and schema component representations.
Results from connectivity analyses (seeds MPFC, PCC, AG), and MVPA are shown as a 3D rendering. During schema retrieval, MPFC and PCC were functionally connected with the same AG region (left part). Furthermore, MVPA revealed distributed representations of different schema components that converged within the left AG during retrieval (right and surrounded in white). To aid orientation, dashed lines schematically indicate the intraparietal sulcus (IPS). Asterisks mark identical locations within the AG across the different methodological approaches. Additionally, we show a horizontal cut at the level of the AG to demonstrate sub-surface effects. LH – left hemisphere.
Figure 8
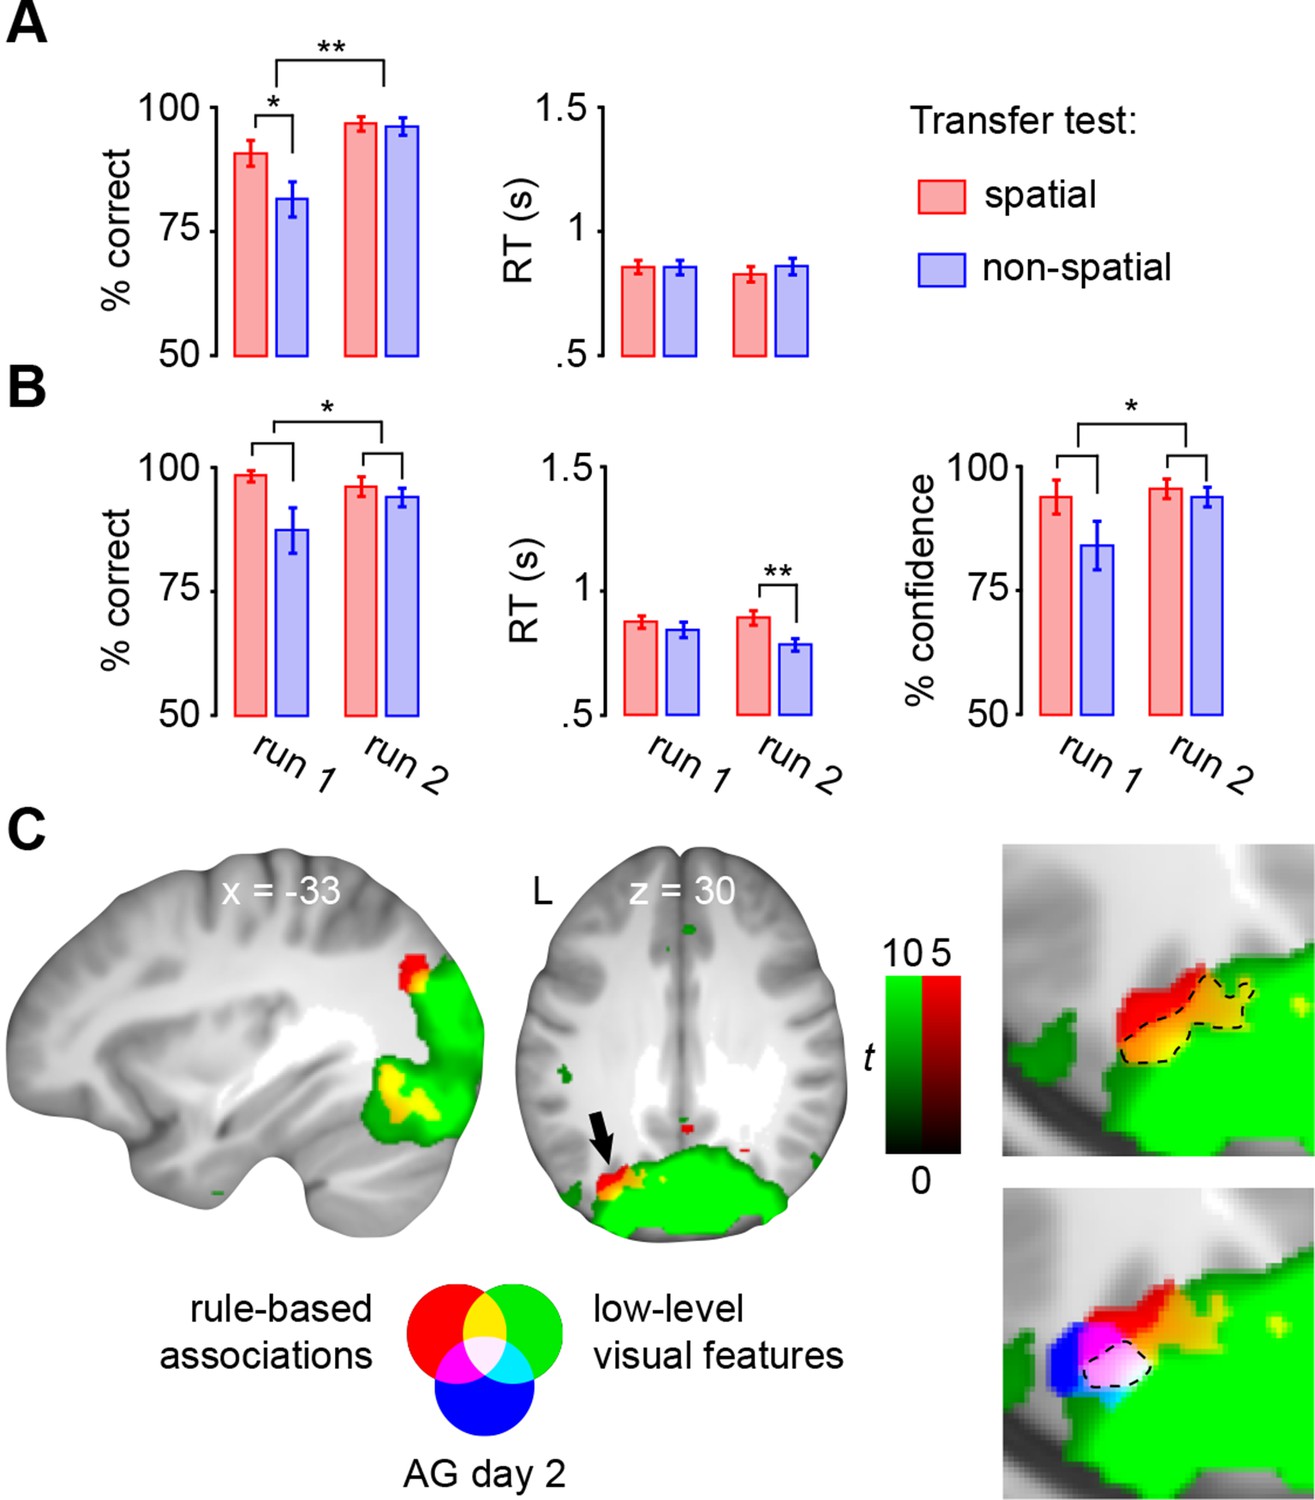
Transfer test.
(A) Schema encoding: left, % of correct responses; right, average reaction time (s). (B) Schema retrieval: left, % of correct responses; middle, average reaction time (s); right, % of high-confident ratings (i.e. “sure”-responses). Error bars denote ± s.e.m. * marks significance at P < 0.05, ** marks significance at P < 0.001. (C) Multi-voxel patterns of rule-based associations and low-level visual features were shared between day 2 and the transfer test. Magnified cut-outs of the horizontal slice are provided to appreciate the overlap between schema components. The AG cluster showing schema convergence during day 2 is depicted in blue (Figure 5A). For display purposes, all maps were resliced to a voxel dimension of 0.5 mm isotropic and are shown at P < 0.001, uncorrected. Significant clusters are noted in Table 5. L – left.
Figure 9
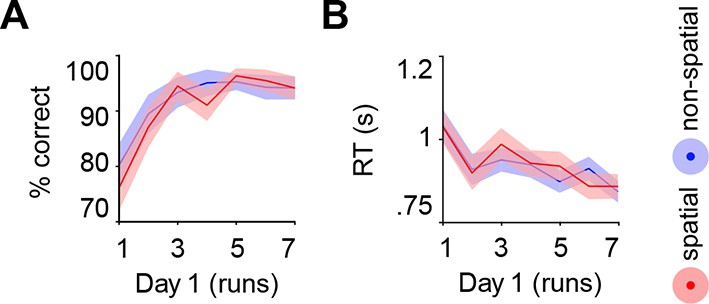
Behavioral performance during schema encoding.
(A) Data represents the % of correct responses, and (B) the average reaction time (s). Shaded error bars denote ± s.e.m.
Figure 10
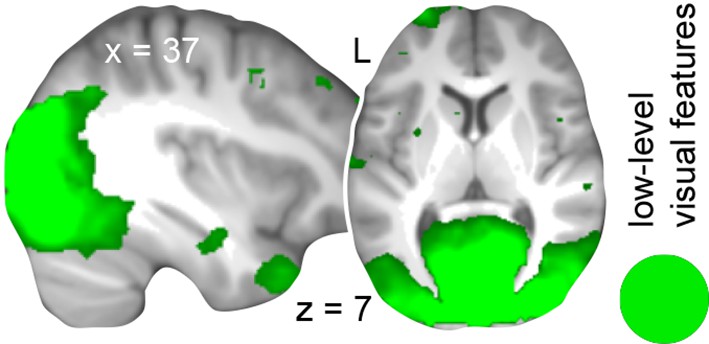
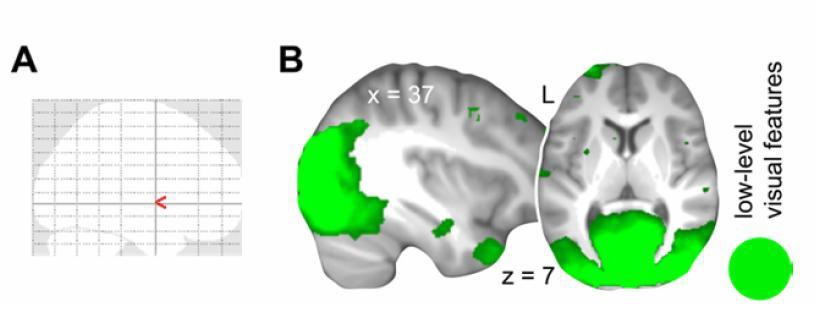
Multi-voxel representations of low-level visual features on day 1.
Additional searchlight MVPA revealed distributed representations of low-level visual features, but not rule-based associations, during schema retrieval on day 1 (Materials and methods, Complementary analysis: AG involvement in schema retrieval on day 1). For display purposes, the map was resliced to a voxel dimension of 0.5 mm isotropic and is shown at P < 0.001, uncorrected. Significant clusters are noted in Table 6. L – left.
Figure 11
Hippocampal connectivity during schema retrieval.
(A) Hippocampal connectivity during general schema retrieval (compared to the perceptual baseline) across both days (day 1 & day 2). Additionally, connectivity results are projected onto a surface-based flatmap. Relevant structures are labeled: AG, angular gyrus; ATL, anterior temporal lobe; IFG, inferior frontal gyrus; IOG, inferior occipital gyrus; MPFC, medial prefrontal cortex; MTS, medial temporal sulcus; PCC, posterior cingulate cortex; PHC, parahippocampal cortex; SFG, superior frontal gyrus. Regions of the retrieval network are highlighted in bold font. Dashed lines are inserted to aid orientation: a, border between medial and lateral prefrontal cortices; b, central sulcus; c, superior temporal gyrus; d, border between ventromedial and -lateral temporal cortices. LH – left hemisphere, RH – right hemisphere. (B) Decreased hippocampal-neocortical coupling during schema retrieval from day 1 to day 2 (day 1 > day 2). For display purposes, all maps were resliced to a voxel dimension of 0.5 mm isotropic and are shown at P < 0.001, uncorrected. Significant clusters are noted in Table 7. L – left.
Author response image 1
Hippocampal activation during schema retrieval (z = -17).
(A) Increased BOLD responses during schema memory retrieval across both days (schema retrieval > perceptual baseline), (B) during rule-based schema retrieval on day 1 (day 1 > day 2), and (C) after an initial consolidation of 24 hours (day 2 > day 1). Contrasts include runs 5 to 7 from day 1, and run 1 from day 2. For display purposes, results were resliced to a voxel dimension of 0.5 mm isotropic and are shown at P < 0.001, uncorrected. Significant clusters are noted in Table 6 (updated manuscript). Results are superimposed onto the average structural scan derived from all subjects. The hippocampus is schematically outlined in black (based on the anatomical definition of the AAL atlas). L – left.
Author response image 2
Non-spatial schema performance, RTs and retrieval confidence compared to day 1, run 1.
(A) Schema Encoding: left, % of correct responses; right, average reaction time (s). (B) Schema retrieval: left, % of correct responses; middle, average reaction time (s); right, % of high-confident ratings (i.e. “sure”-responses). Error bars denote ± standard error of the mean (s.e.m.). ** marks significance at P < 0.001.
Author response image 3
Generalization of schema component representations from day 2 to day 1.
(A) Multi-voxel patterns of rule-based associations did not generalize across days. (B) Multi-voxel patterns of low-level visual features were shared across days. For display purposes, all maps were resliced to a voxel dimension of 0.5 mm isotropic and are shown at P < 0.001, uncorrected. Significant clusters are noted in Table 3 (updated manuscript). L – left. This figure is incorporated in updated Figure 5.
Author response image 4
Generalization of schema component representations from day 2 to the transfer test.
Multi-voxel patterns of rule-based associations and low-level visual features were shared across study phases. Cut-outs of the horizontal slice are magnified to appreciate the overlap of schema components. Blue depicts the left AG cluster showing overlap of schema component during day 2. For display purposes, all maps were resliced to a voxel dimension of 0.5 mm isotropic and are shown at P < 0.001, uncorrected Table 5 (updated manuscript). L – left. This figure is incorporated in updated Figure 8.
Author response image 5
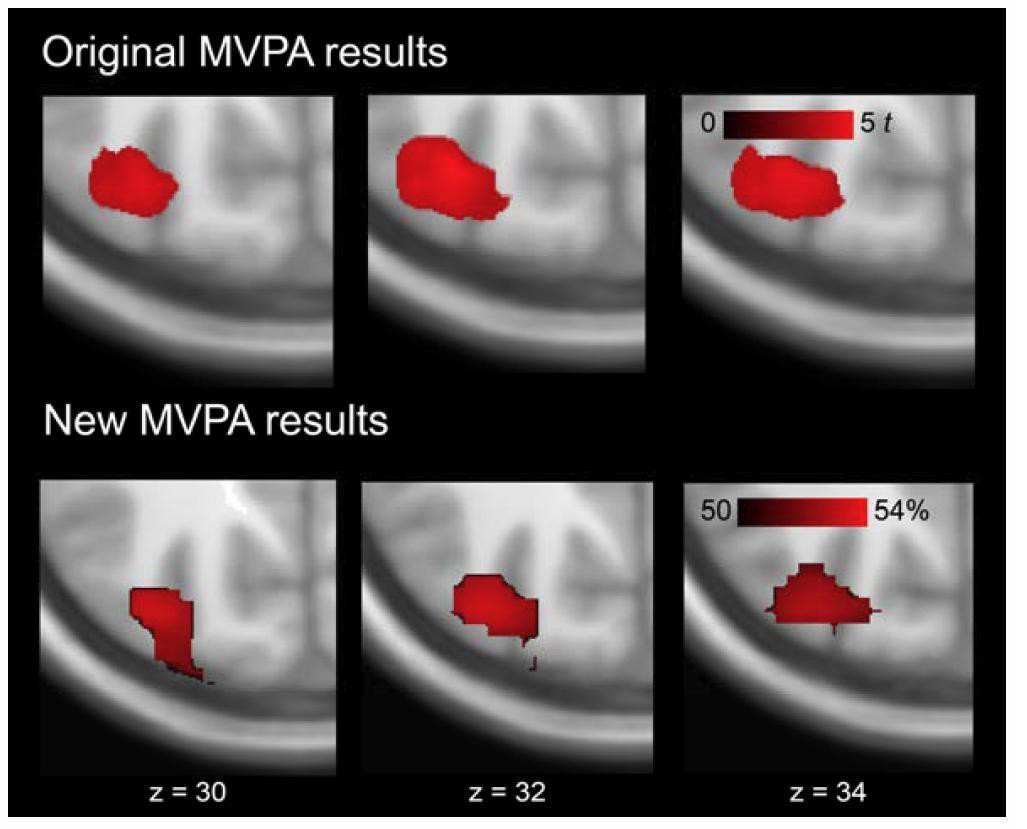
Multi-voxel representations of schema components within left AG.
The image shows magnified, horizontal cut-outs at the level of AG. Data represents significant discrimination of rule-based associations. Upper row: original MVPA results as reported in the manuscript (Results, Multi-voxel representations of schema components). Effects were tested for significance using cluster-inference with a cluster-defining threshold of P < 0.001 and a cluster-probability of P < 0.05 family-wise error (FWE) corrected for multiple comparisons (Table 3). Lower row: new MVPA results using the permutation framework. No cluster correction was applied. Both approaches yielded representations of rule-based associations within left AG.
Author response image 6
Schema retrieval across days.
Data represents the % of correct responses. Error bars denote ± Standard Error of the Mean (SEM). * marks a significant (P < 0.05) difference between the schema conditions within the first run of day 1.
Author response image 7

Changes in activation as a function of run on day 1.
Increases in activation are shown in warm colors, decreases in cool colors. For display purposes, all maps were resliced to a voxel dimension of 0.5 mm isotropic and are shown at P < 0.001, uncorrected. Significant clusters are noted in Author response table 1. LH – left hemisphere; RH – right hemisphere; L – left.
Author response image 8
Multi-voxel representations of schema components on day 1.
(A) We did not find any significant representations of rule-based associations during retrieval on day 1. (B) Representations of low-level visual features were located within occipital regions, extending into the AG, as well as within the right anterior temporal lobe. For display purposes, all maps were resliced to a voxel dimension of 0.5 mm isotropic and are shown at P < 0.001, uncorrected. Significant clusters are noted in Table 6 (updated manuscript). L – left. This figure is incorporated in Figure 10.
Tables
Table 1
Activation during schema retrieval.
MNI | |||||
|---|---|---|---|---|---|
| Brain region | x | y | z | Z value | Cluster size |
| Day 1 & day 2 | |||||
| L superior frontal gyrus | -5 | 5 | 52 | 766 | |
| L superior parietal gyrus | -22 | -60 | 40 | 9440 | |
| L middle frontal gyrus | -28 | -5 | 45 | 938 | |
| R middle frontal gyrus | 32 | -2 | 48 | 260 | |
| L insular cortex | -32 | 20 | 8 | 5.53 | 126 |
| Day 1 > day 2 | |||||
| L cuneus | -2 | -95 | 10 | 2814 | |
| L superior frontal gyrus | -5 | 5 | 52 | 6.14 | 165 |
| Cerebellum | -35 | -50 | -32 | 4.37 | 161 |
| Day 2 > day 1 | |||||
| L cingulate gyrus | 0 | -40 | 42 | 5.38 | 593 |
| R supramarginal gyrus | 55 | -22 | 30 | 4.32 | 156 |
| R superior frontal gyrus | 5 | -45 | -2 | 3.93 | 95 |
| R middle temporal gyrus | 58 | -50 | 0 | 3.85 | 106 |
-
Clusters that showed significant BOLD increases during retrieval of rule-based schema memories across days, before, and after a 24-hour-delay. Bold font indicates contrasts. Retrieval was compared to the perceptual baseline. MNI coordinates represent the location of peak voxels. We report the local maximum of each cluster. Effects were tested for significance using cluster-inference with a cluster-defining threshold of P < 0.001 and a cluster-probability of P < 0.05 family-wise error (FWE) corrected for multiple comparisons (critical cluster size: 86). L – left, R – right.
Table 2
Schema retrieval networks: MPFC and PCC.
MNI | |||||
|---|---|---|---|---|---|
| Brain region | x | y | z | Z value | Cluster size |
| Seed MPFC, spatial > perceptual baseline | |||||
| R superior frontal gyrus | 10 | 58 | 5 | 5.11 | 362 |
| L angular gyrus | -45 | -72 | 35 | 4.84 | 206 |
| R parahippocampal gyrus | 28 | -35 | -10 | 4.69 | 126 |
| L precuneus | -10 | -60 | 20 | 4.66 | 1008 |
| L precentral gyrus | -52 | -12 | 45 | 4.11 | 96 |
| L parahippocampal gyrus | -28 | -38 | -10 | 3.82 | 141 |
| Seed MPFC, non-spatial > perceptual baseline | |||||
| L cingulate gyrus | -5 | 38 | 8 | 4.26 | 314 |
| Seed PCC, spatial > perceptual baseline | |||||
| L cingulate gyrus | -10 | -45 | 8 | 5.07 | 1746 |
| R cingulate gyrus | 12 | 30 | 20 | 4.68 | 685 |
| L precentral gyrus | -55 | 8 | 2 | 4.64 | 1002 |
| R insular cortex | 35 | -22 | 8 | 4.62 | 120 |
| L parahippocampal gyrus | -32 | -35 | -15 | 4.49 | 553 |
| R inferior frontal gyrus | 52 | 18 | 12 | 4.44 | 279 |
| L angular gyrus | -48 | 70 | 40 | 4.42 | 106 |
| R superior temporal gyrus | 45 | -2 | -12 | 4.30 | 663 |
| Cerebellum | 12 | -72 | -28 | 4.23 | 142 |
| Cerebellum | -15 | -58 | -35 | 4.00 | 164 |
| Seed PCC, non-spatial > perceptual baseline | |||||
| L precuneus | -2 | -65 | 30 | 5.49 | 3597 |
| L precentral gyrus | -55 | -8 | 45 | 4.89 | 680 |
| R middle temporal gyrus | 65 | -18 | -8 | 4.58 | 716 |
| R superior frontal gyrus | 12 | 25 | 28 | 4.27 | 587 |
| L angular gyrus | -48 | -70 | 38 | 4.19 | 184 |
| Cerebellum | -20 | -68 | -28 | 4.03 | 282 |
| R middle frontal gyrus | 18 | 65 | 12 | 3.81 | 156 |
-
Clusters that showed a significant increase in connectivity during schema retrieval: MPFC (x = -2, y = 35, z = -2) and PCC (x = 2, y = -45, z = 22). Bold font indicates contrasts. Retrieval was compared to the perceptual baseline. MNI coordinates represent the location of peak voxels. We report the local maximum of each cluster. Effects were tested for significance using cluster-inference with a cluster-defining threshold of P < 0.001 and a cluster-probability of P < 0.05 family-wise error (FWE) corrected for multiple comparisons (critical cluster sizes; MPFC seed: spatial, 89 voxels; non-spatial, 95 voxels; PCC seed: 89 voxels for both conditions). L – left, R – right.
Table 3
Multi-voxel representations of schema components.
MNI | |||||
|---|---|---|---|---|---|
| Brain region | x | y | z | Z value | Cluster size |
| MVPA day 2, rule-based associations | |||||
| R lateral orbitofrontal gyrus | 42 | 42 | -18 | 4.14 | 75 |
| L middle occipital gyrus | -30 | -75 | 32 | 4.13 | 102 |
| L angular gyrus | -38 | -70 | 32 | 3.73 | |
| MVPA day 2, low-level visual features | |||||
| L cuneus | 0 | -82 | 8 | 16630 | |
| MVPA day 1, low-level visual features | |||||
| R lingual gyrus | 2 | -78 | -2 | 15599 | |
-
Clusters that significantly discriminated schema component representations (rule-based associations, low-level visual features). Bold font indicates the type of MVPA analysis (day 1, training the classifier on day 2 and testing it on day 1; day 2, training the classifier on day 2 and testing it on day 2 using cross-validation; Materials and methods, Multi-voxel pattern analysis). MNI coordinates represent the location of peak voxels. We report the first two local maxima (> 8 mm apart) within each cluster (rule-based associations), and the local maximum for the low-level visual feature MVPAs. Effects were tested for significance using cluster-inference with a cluster-defining threshold of P < 0.001 and a cluster-probability of P < 0.05 family-wise error (FWE) corrected for multiple comparisons (critical cluster sizes: day 2, rule-based associations, 74 voxels; day 2, low-level visual features, 72 voxels; day 1, low-level visual features, 70 voxels). L – left, R – right.
Table 4
Schema convergence networks.
MNI | |||||
|---|---|---|---|---|---|
| Brain region | x | y | z | Z value | Cluster size |
| Spatial > perceptual baseline | |||||
| L middle occipital gyrus | -30 | -80 | 32 | 5.90 | 553 |
| R middle frontal gyrus | 42 | 22 | 45 | 5.37 | 182 |
| L middle frontal gyrus | -32 | 18 | 52 | 5.19 | 380 |
| Cerebellum | 15 | -75 | -28 | 4.96 | 1553 |
| R inferior temporal gyrus | 55 | -58 | -12 | 4.94 | 259 |
| L inferior frontal gyrus | -40 | 20 | 2 | 4.61 | 922 |
| R angular gyurs | 42 | -65 | 50 | 4.56 | 701 |
| L fusiform gyrus | -32 | -35 | -25 | 4.50 | 352 |
| L middle frontal gyrus | -18 | 45 | 28 | 4.50 | 509 |
| L superior parietal gyrus | -15 | -60 | 18 | 4.39 | 261 |
| R superior parietal gyrus | 20 | -55 | 18 | 4.19 | 109 |
| R precuneus | 8 | -55 | 40 | 4.12 | 152 |
| R insular cortex | 38 | -8 | 0 | 4.08 | 95 |
| R superior temporal gyrus | 65 | -18 | 2 | 4.03 | 107 |
| R inferior frontal gyrus | 52 | 35 | 22 | 3.95 | 456 |
| Non-spatial > perceptual baseline | |||||
| L superior frontal gyrus | 0 | -5 | 48 | 5.87 | 22582 |
| L inferior frontal gyrus | -38 | 15 | 5 | 5.77 | |
| Cerebellum | -15 | -75 | -38 | 5.76 | |
| L angular gyrus | -32 | -78 | 42 | 5.63 | |
| R fusiform gyrus | 48 | -55 | -22 | 5.54 | |
| L inferior frontal gyrus | -35 | 28 | 2 | 5.52 | |
| R middle temporal gyrus | 62 | -12 | -12 | 5.43 | |
| R fusiform gyrus | 45 | -45 | -22 | 5.42 | |
| L middle frontal gyrus | -38 | 12 | 52 | 5.42 | |
| R superior frontal gyrus | 2 | 28 | 52 | 5.42 | |
| L superior temporal gyrus | -52 | -5 | -8 | 5.40 | |
| R superior frontal gyrus | 8 | 8 | 52 | 5.32 | |
| Cerebellum | -25 | -60 | -35 | 5.32 | |
| L middle temporal gyrus | -62 | -58 | 2 | 5.31 | |
| R superior frontal gyrus | 8 | 28 | 40 | 5.30 | |
-
Clusters that showed a significant increase in AG connectivity during schema retrieval. Retrieval was compared to the perceptual baseline. The seed was defined as overlap between schema components, as determined with MVPA (Figure 5A). Bold font indicates contrasts. MNI coordinates represent the location of peak voxels. We report the local maximum of each cluster. For the non-spatial schema condition we report the first 15 local maxima (> 8 mm apart). Effects were tested for significance using cluster-inference with a cluster-defining threshold of P < 0.001 and a cluster-probability of P < 0.05 family-wise error (FWE) corrected for multiple comparisons (critical cluster sizes: spatial, 88 voxels; non-spatial, 83 voxels). L – left, R – right.
Table 5
Transfer test: multi-voxel representations of schema components.
MNI | |||||
|---|---|---|---|---|---|
| Brain region | x | y | z | Z value | Cluster size |
| MVPA transfer test, rule-based associations | |||||
| L superior occipital gyrus | -15 | -78 | 22 | 3.63 | 211 |
| L angular gyrus | -35 | -72 | 35 | 3.57 | |
| L superior occipital gyrus | -12 | -90 | 20 | 3.23 | |
| MVPA transfer test, low-level visual features | |||||
| L lingual gyrus | -12 | -82 | 8 | 11692 | |
-
Clusters that significantly discriminated schema component representations (rule-based associations, low-level visual features) during the transfer test. Bold font indicates the type of MVPA analysis. MNI coordinates represent the location of peak voxels. We report the first three local maxima (>8 mm apart) within each cluster (rule-based associations), and the local maximum for the low-level visual features analysis. Effects were tested for significance using cluster-inference with a cluster-defining threshold of P < 0.005 (rule-based associations) or P < 0.001 (low-level visual features) and a cluster-probability of P < 0.05 family-wise error (FWE) corrected for multiple comparisons (critical cluster sizes: rule-based associations, 172 voxels; low-level visual features, 60 voxels). L – left, R – right.
Table 6
Multi-voxel representations of low-level visual features on day 1.
MNI | |||||
|---|---|---|---|---|---|
| Brain region | x | y | z | Z value | Cluster size |
| MVPA day 1, all trials, N = 23 | |||||
| R middle occipital gyrus | 12 | -88 | 10 | 16470 | |
| R inferior temporal gyrus | 40 | 12 | -40 | 3.92 | 180 |
| MVPA day 1, correct and high confidence trials, N = 14 | |||||
| R middle occipital gyrus | 12 | -88 | 10 | 6.24 | 12975 |
| L postcentral gyrus | -52 | -22 | 40 | 4.32 | 83 |
| L insular cortex | -35 | 10 | 2 | 4.27 | 75 |
| R inferior frontal gyrus | 50 | 5 | 0 | 3.88 | 91 |
-
Clusters that significantly discriminated the low-level visual features during retrieval on day 1. Bold font indicates the type of MVPA analysis (day 1, training and testing the classifier on day 1 using cross-validation; Materials and methods, Complementary analysis: AG involvement in schema retrieval on day 1). MNI coordinates represent the location of peak voxels. We report the local maximum of each cluster. Effects were tested for significance using cluster-inference with a cluster-defining threshold of P < 0.001 and a cluster-probability of P < 0.05 family-wise error (FWE) corrected for multiple comparisons (critical cluster sizes: upper part, 80 voxels; lower part, 65 voxels). L – left, R – right.
Table 7
Hippocampal connectivity during schema retrieval.
MNI | |||||
|---|---|---|---|---|---|
| Brain region | x | y | z | Z value | Cluster size |
| Day 1 & day 2 | |||||
| R precuneus | 2 | -55 | 18 | 7.06 | 18139 |
| Cerebellum | -5 | -52 | -45 | 6.04 | 602 |
| R angular gyrus | 52 | -60 | 30 | 4.84 | 339 |
| R superior parietal gyrus | 28 | -38 | 58 | 4.62 | 139 |
| L insular cortex | -32 | -20 | 20 | 4.57 | 90 |
| R middle occipital gyrus | 32 | -80 | 40 | 3.94 | 111 |
| Day 1 > day 2 | |||||
| R cingulate gyrus | 2 | 22 | -5 | 5.12 | 162 |
| R middle occipital gyrus | 35 | -90 | 0 | 4.91 | 279 |
| L middle occipital gyrus | -38 | -88 | -2 | 4.43 | 295 |
| R superior frontal gyrus | 28 | 5 | 70 | 4.23 | 108 |
| R middle frontal gyrus | 22 | 58 | 18 | 4.01 | 144 |
| R cingulate gyrus | 5 | 40 | 15 | 4.01 | 87 |
-
Clusters that showed a significant increase in hippocampal connectivity during schema retrieval (Materials and methods, Complementary analysis: hippocampal connectivity during schema retrieval). Bold font indicates contrasts. Retrieval (collapsed across spatial and non-spatial schema conditions) was compared to the perceptual baseline. MNI coordinates represent the location of peak voxels. We report the local maximum of each cluster. Effects were tested for significance using cluster-inference with a cluster-defining threshold of P < 0.001 and a cluster-probability of P < 0.05 family-wise error (FWE) corrected for multiple comparisons (critical cluster size = 76 voxels). L – left, R – right.
Author response table 1
Changes in activation as a function of run on day 1. Retrieval (collapsed across spatial and non-spatial schema conditions) was compared to the perceptual baseline. Bold font indicates contrasts. MNI coordinates represent the location of peak voxels. We report the first two local maxima (> 8 mm apart) within each cluster. Effects were tested for significance using cluster-inference with a cluster-defining threshold of P < 0.001 and a cluster-probability of P < 0.05 family-wise error (FWE) corrected for multiple comparisons (critical cluster size = 68 voxels). L – left, R – right.
MNI | |||||
|---|---|---|---|---|---|
Brain region | x | y | z | Z value | Cluster size |
Increase, run 1 to 7 | |||||
L cingulate gyrus | -5 | -48 | 20 | 4.37 | 95 |
L superior frontal gyrus | -8 | 48 | 35 | 4.33 | 473 |
R superior frontal gyrus | 5 | 60 | 18 | 4.31 | |
R superior frontal gyrus | 15 | 58 | 0 | 4.21 | |
L angular gyrus | -52 | -62 | 22 | 3.74 | 68 |
L angular gyrus | -38 | -58 | 28 | 3.57 | |
Decrease, run 1 to 7 | |||||
R middle occipital gyrus | 35 | -70 | 30 | 4.69 | 313 |
R angular gyrus | 35 | -58 | 45 | 3.87 | |
R superior parietal gyrus | 35 | -45 | 42 | 3.85 | |
L supramarginal gyrus | -42 | -40 | 38 | 4.45 | 122 |
L superior parietal gyrus | -45 | -45 | 58 | 4.27 | |
cerebellum | 12 | -60 | -15 | 4.23 | 301 |
cerebellum | 0 | -48 | -10 | 4.22 | |
R fusiform gyrus | 32 | -40 | -18 | 3.92 | |
L inferior occipital gyrus | -32 | -68 | -18 | 4.17 | 199 |
cerebellum | -38 | -65 | -28 | 4.02 |
Download links
A two-part list of links to download the article, or parts of the article, in various formats.
Downloads (link to download the article as PDF)
Open citations (links to open the citations from this article in various online reference manager services)
Cite this article (links to download the citations from this article in formats compatible with various reference manager tools)
Schematic memory components converge within angular gyrus during retrieval
eLife 4:e09668.
https://doi.org/10.7554/eLife.09668


