Contesting the presence of wheat in the British Isles 8,000 years ago by assessing ancient DNA authenticity from low-coverage data
- Max Planck Institute for Developmental Biology, Germany
- Max Planck Institute for Evolutionary Anthropology, Germany
Figures
Figure 1

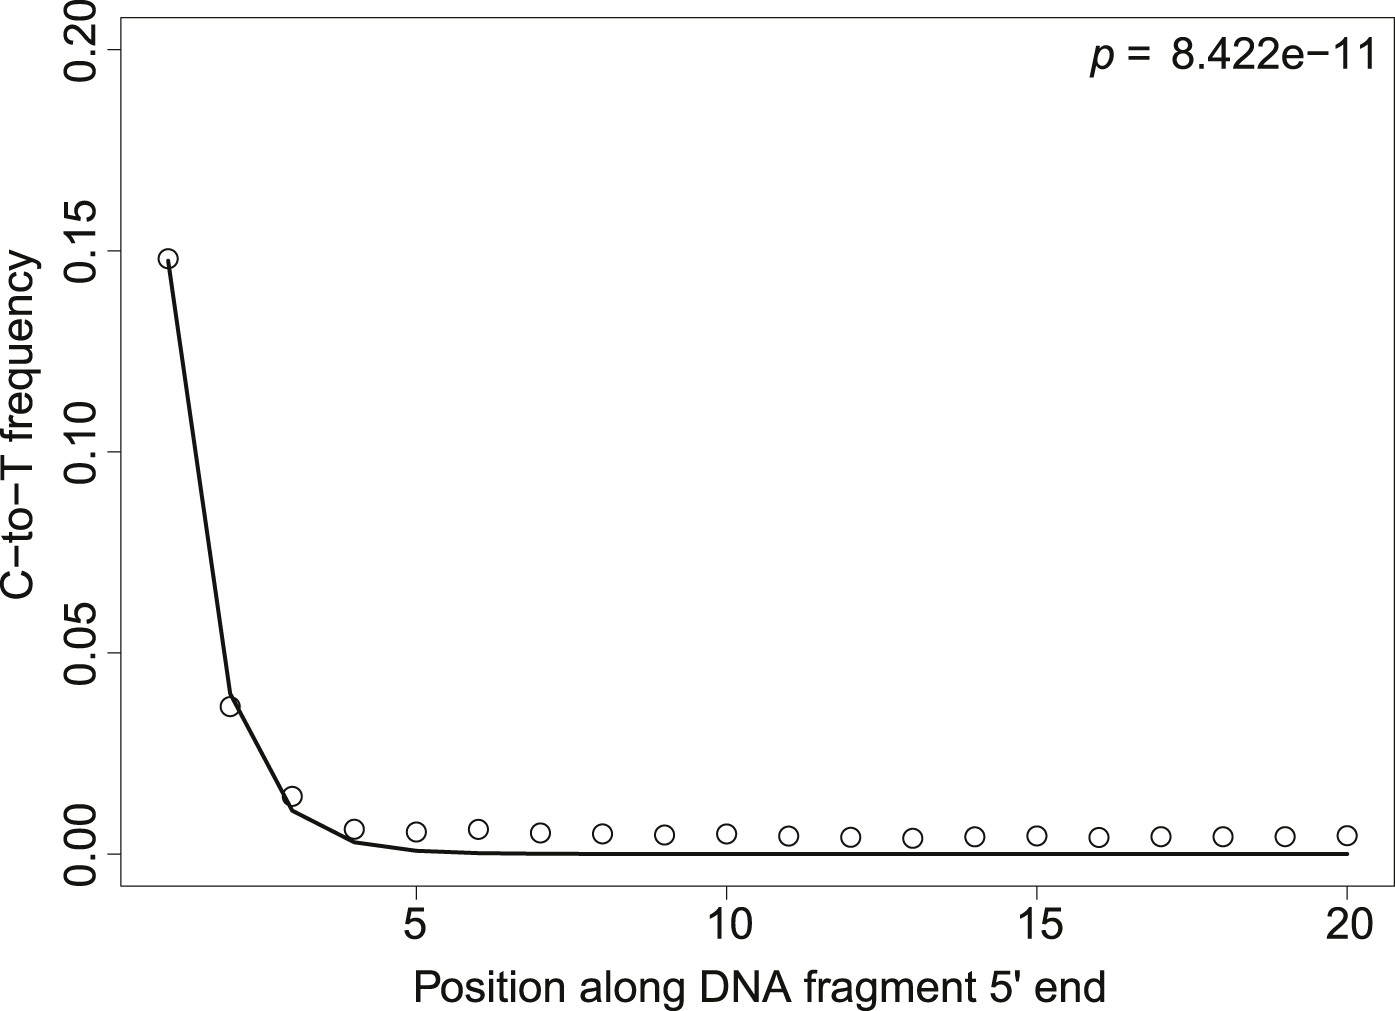
Patterns of cytosine to thymine (C-to-T) substitutions at the 5′end of known modern and ancient DNA.
(A) C-to-T substitutions at the 5′ end from a whole library of historic Solanum tuberosum (ancient DNA). The line shows the fit with the exponential distribution and the box the goodness-of-fit p-value. (B) C-to-T substitutions at the 5′ end from a whole library of present-day Triticum aestivum (modern DNA). Line and box as in (A).
Figure 2 with 2 supplements

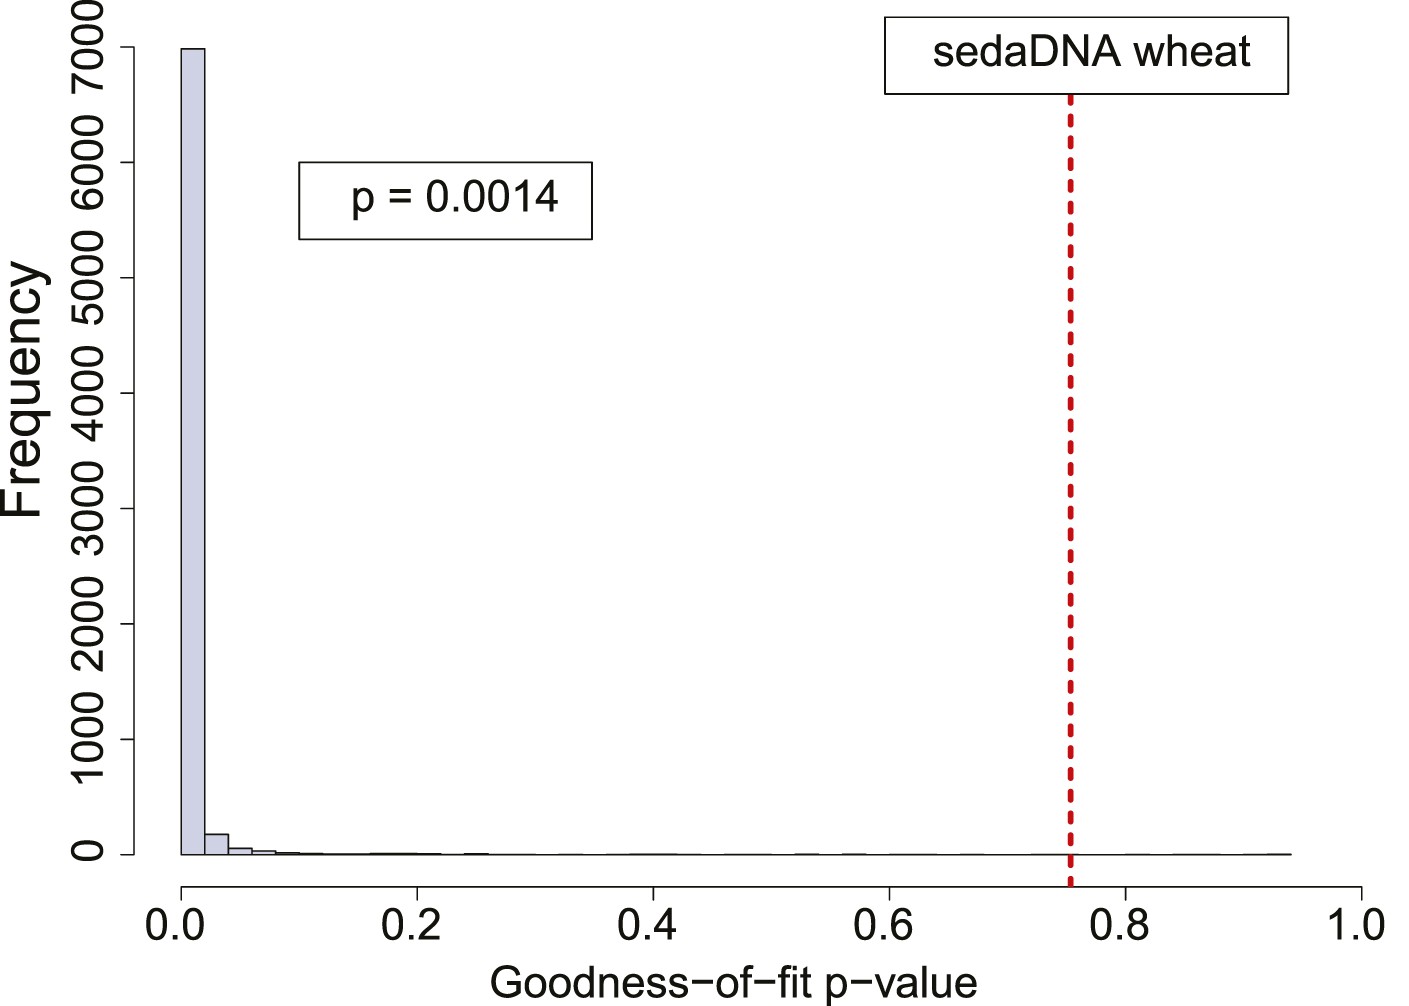
Authenticity test of DNA reads assigned to Triticum by Smith et al.
(A) The histograms in the center panel show the empirical distributions of goodness-of-fit p-values of subsamples of 150 reads from ancient and modern DNA (same libraries as in Figure 1). The dotted red line indicates the location of the goodness-of-fit p-value from reads assigned to wheat in sedimentary ancient DNA. The four surrounding panels show cytosine to thymine (C-to-T) substitutions at the 5′ end extracted from different point of the goodness-of-fit p-value distributions, and from the reads assigned to wheat in sedimentary ancient DNA. (B) Variation of the empirical p-value of the test depending on the goodness-of-fit p-value of the whole library used to generate the empirical distribution. Numbers adjacent to the points indicate the percentage of C-to-T substitutions at first base. Red arrow indicates the aDNA library used as test in Figure 3A. Purple arrow indicates the library used to generate the empirical distribution of goodness-of-fit p-values in Figure 3A–C.
Figure 2—figure supplement 1
Patterns of cytosine to thymine (C-to-T) substitutions at the 5′end from a 7.000-year-old Mesolithic human from La Braña site in Northern Iberia.
The line shows the fit with the exponential distribution. The goodness-of-fit p-value is indicated in the upper right corner.
Figure 2—figure supplement 2
Authenticity test of DNA reads assigned to Triticum by Smith et al.
The histograms shows the empirical distributions of goodness-of-fit p-values of subsamples of 150 reads from a 7.000-year-old Mesolithic human from La Braña site in Northern Iberia. The dotted red line indicates the location of the goodness-of-fit p-value from reads assigned to wheat in sedimentary ancient DNA.
Figure 3
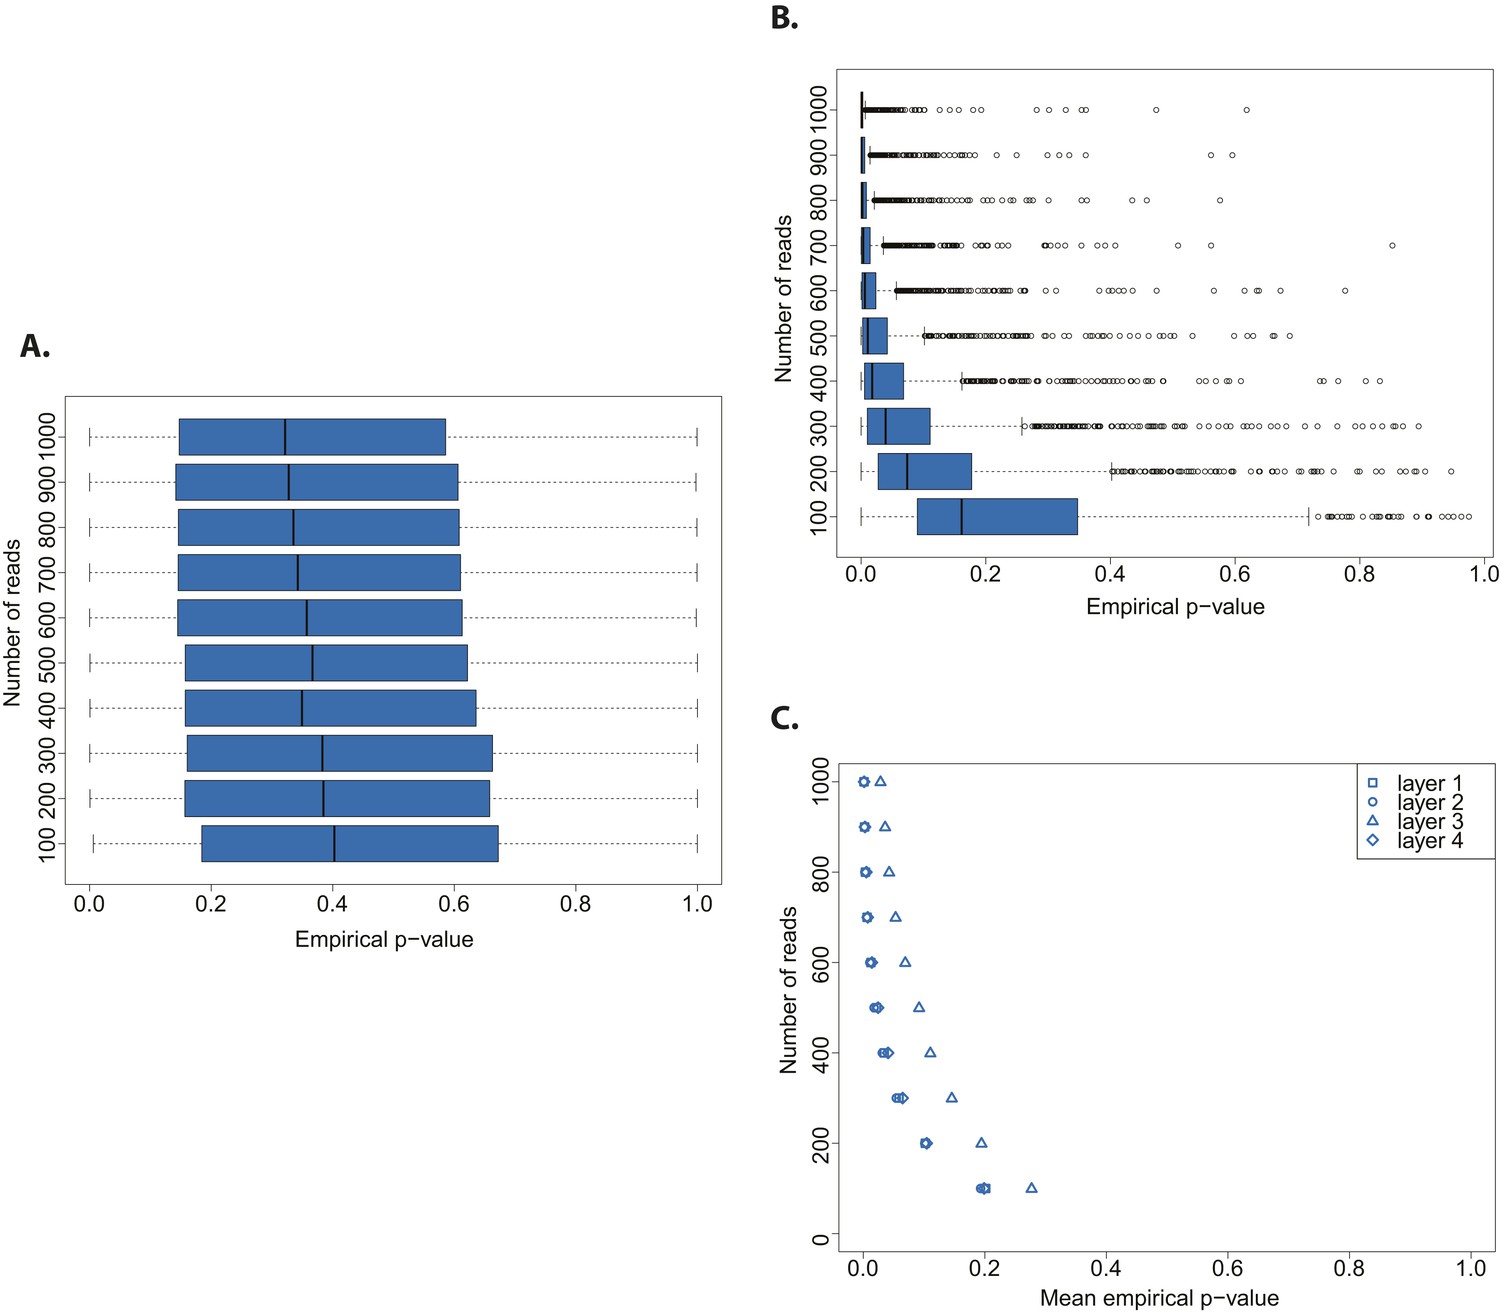
Evaluation of test performance.
(A) Variation of the empirical p-value of the test depending on the number of reads sampled from an ancient DNA library (indicated with red arrow in Figure 2B). (B) Variation of the empirical p-value of the test depending on the numbers of reads subsampled from modern DNA Triticum aestivum library (same library used to generate the distribution of empirical goodness-of-fit p-values in Figure 2A). (C) Variation of the empirical p-value of the test depending on the size of sample sets from sedimentary ancient DNA reads mapped directly to the T. aestivum genome. Box-and-whisker plots were built based on 1000 tests. Layers as reported in Smith et al. i.e. layer 1 (most superficial), layer 4 (more deep).
Author response image 1
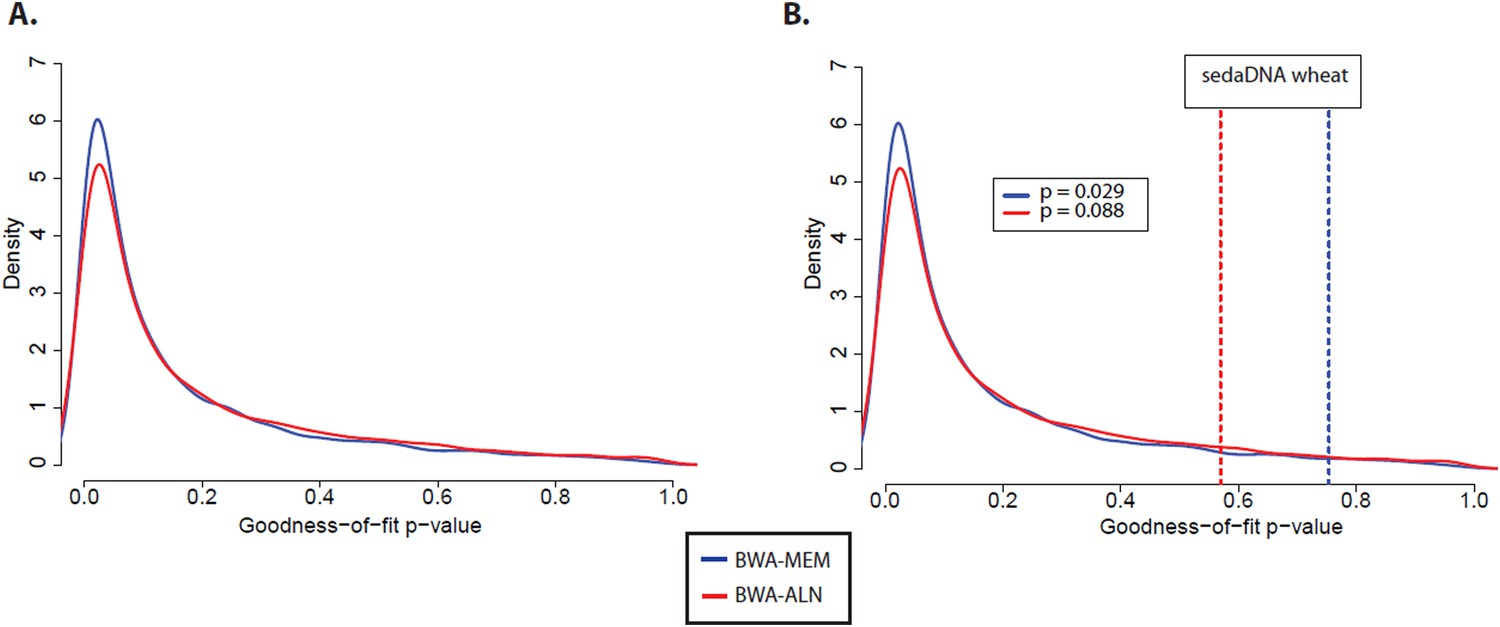
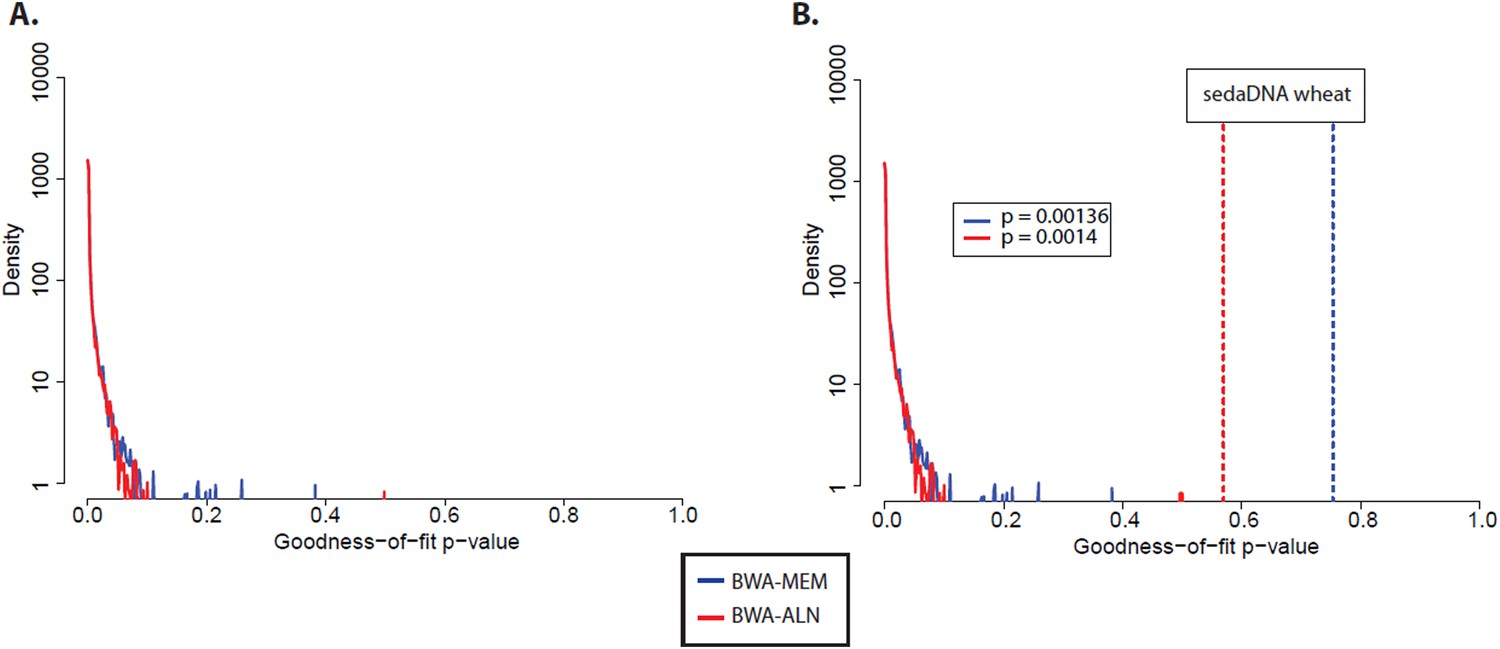
Effect of aligner choice on the distribution of goodness-of-fit p-values and on the authenticity test.
(A) Empirical distributions of goodness-of-fit p-values of subsamples of 150 reads from a 169-years-old Solanum tuberosum library. Reads were mapped using BWA-MEM and BWA-ALN. (B) Authenticity test of DNA reads assigned to Triticum by Smith et al. using same empirical distributions as in A. The dotted lines indicate the location of the goodness-of-fit p-value from reads assigned to wheat in sedimentary ancient DNA. The box encloses the empirical p-values of the authenticity tests.
Author response image 2
Effect of aligner choice on the distribution of goodness-of-fit p-values and on the authenticity test.
(A) Empirical distributions of goodness-of-fit p-values of subsamples of 150 reads from a 7000-years-old human Mesolithic sample. Reads were mapped using BWA-MEM and BWA-ALN. To have a better visualization the y-axis is shown in a logarithmic scale. (B) Authenticity test of DNA reads assigned to Triticum by Smith et al. using same empirical distributions as in A. The dotted lines indicate the location of the goodness-of-fit p-value from reads assigned to wheat in sedimentary ancient DNA. The box enclosed the empirical p-values of the authenticity tests.
Tables
Table 1
Provenance of samples
| Species | Type of DNA | Age | Reference | Study ID | Sample/run ID |
|---|---|---|---|---|---|
| Metagenomics sample | Sedimentary | 8030-7908* | Smith et al., 2015 | PRJEB6766‡ | ERR567364‡ |
| Metagenomics sample | Sedimentary | 8030-7908* | Smith et al., 2015 | PRJEB6766‡ | ERR567365‡ |
| Metagenomics sample | Sedimentary | 8030-7908* | Smith et al., 2015 | PRJEB6766‡ | ERR567366‡ |
| Metagenomics sample | Sedimentary | 8030-7908* | Smith et al., 2015 | PRJEB6766‡ | ERR567367‡ |
| Metagenomics sample | Sedimentary | 8030-7908* | Smith et al., 2015 | PRJEB6766‡ | ERR732642‡ |
| T. aestivum | Modern | NA | Chapman et al., 2015 | PRJNA250383‡ | SRR1170664‡ |
| S. tuberosum | Ancient | 135† | Yoshida et al., 2013 | PRJEB1877‡ | ERR267886‡ |
| S. tuberosum | Ancient | 137† | Yoshida et al., 2013 | PRJEB1877‡ | ERR267882‡ |
| S. tuberosum | Ancient | 149† | Yoshida et al., 2013 | PRJEB1877‡ | ERR330058‡ |
| S. tuberosum | Ancient | 165† | Yoshida et al., 2013 | PRJEB1877‡ | ERR267872‡ |
| S. tuberosum | Ancient | 166† | Yoshida et al., 2013 | PRJEB1877‡ | ERR267868‡ |
| S. tuberosum | Ancient | 166† | Yoshida et al., 2013 | PRJEB1877‡ | ERR957324‡ |
| S. tuberosum | Ancient | 167† | Yoshida et al., 2013 | PRJEB1877‡ | ERR267868‡ |
| S. lycopersicum | Ancient | 136† | Yoshida et al., 2013 | PRJEB1877‡ | ERR267884‡ |
| S. lycopersicum | Ancient | 139† | Yoshida et al., 2013 | PRJEB1877‡ | ERR267878‡ |
| G. gorilla | Ancient | 83† | Sawyer et al., 2012 | NA | 107¶ |
| G. gorilla | Ancient | 100† | Sawyer et al., 2012 | NA | 109¶ |
| G. gorilla | Ancient | 100† | Sawyer et al., 2012 | NA | 110¶ |
| G. gorilla | Ancient | 103† | Sawyer et al., 2012 | NA | 114¶ |
| Homo sapiens | Ancient | 7000* | Olalde et al., 2014 | PRJNA230689‡ | SRR1045127 |
-
*
B.P. (before present years).
-
†
Calculated from collection date (in years).
-
‡
IDs from the European Nucleotide Archive.
-
¶
IDs from Sawyer et al., 2012.
Additional files
-
Supplementary file 1
Sequencing strategy.
- https://doi.org/10.7554/eLife.10005.009
Download links
A two-part list of links to download the article, or parts of the article, in various formats.
Downloads (link to download the article as PDF)
Open citations (links to open the citations from this article in various online reference manager services)
Cite this article (links to download the citations from this article in formats compatible with various reference manager tools)
Contesting the presence of wheat in the British Isles 8,000 years ago by assessing ancient DNA authenticity from low-coverage data
eLife 4:e10005.
https://doi.org/10.7554/eLife.10005


