Pathway activation model for personalized prediction of drug synergy
- Department of Medical Epidemiology and Biostatistics, Karolinska Institutet, Sweden
- Department of Health Statistics, School of Public Health, Weifang Medical University, China
- Department of Oncology Pathology, Karolinska Institutet, Science for Life Laboratory, Sweden
- Institute for Molecular Medicine Finland, University of Helsinki, Finland
- Department of Medicine Huddinge, Karolinska Institutet, Unit for Hematology, Karolinska University Hospital Huddinge, Sweden
- Department of Medical Sciences, Hematology, Uppsala University Hospital, Sweden
Figures
Figure 1

Overview of Drug synergy Interaction Prediction (DIPx).
(a) The AstraZeneca-Sanger (AZS) omics data were used to train and validate the model. The test set was split into two subsets: Test Set 1 contained combinations found in the training set, while Set 2 comprised combinations not found in the training set. The model was also externally validated using the O'Neil dataset. (b) A cartoon illustration of the ERBB pathway in a breast cancer cell line treated with the combination of Capivasertib + Sapitinib. Capivasertib targets the AKT gene, whereas Sapitinib targets the ERBB genes. Pathway genes were classified into upstream and downstream genes relative to the position of the target genes in the network. (c) The drug synergy prediction model was trained using pathway activation scores (PASs) of the upstream, downstream, and driver genes. (d) The predicted and observed Loewe scores of a cell line achieved the median Spearman’s correlation in Test Set 1 of the AZS dataset. The color of each bar shows the confidence score information with the threshold of 0.75. (e) The main pathways that contribute to the prediction of the synergy of the Capivasertib + Sapitinib combination. (f) The proportion of validated high synergistic predictions (Loewe score ) increases with higher confidence scores. The x-axis presents four groups defined by quartiles of confidence scores. This figure was created using BioRender.com.
Figure 2 with 1 supplement
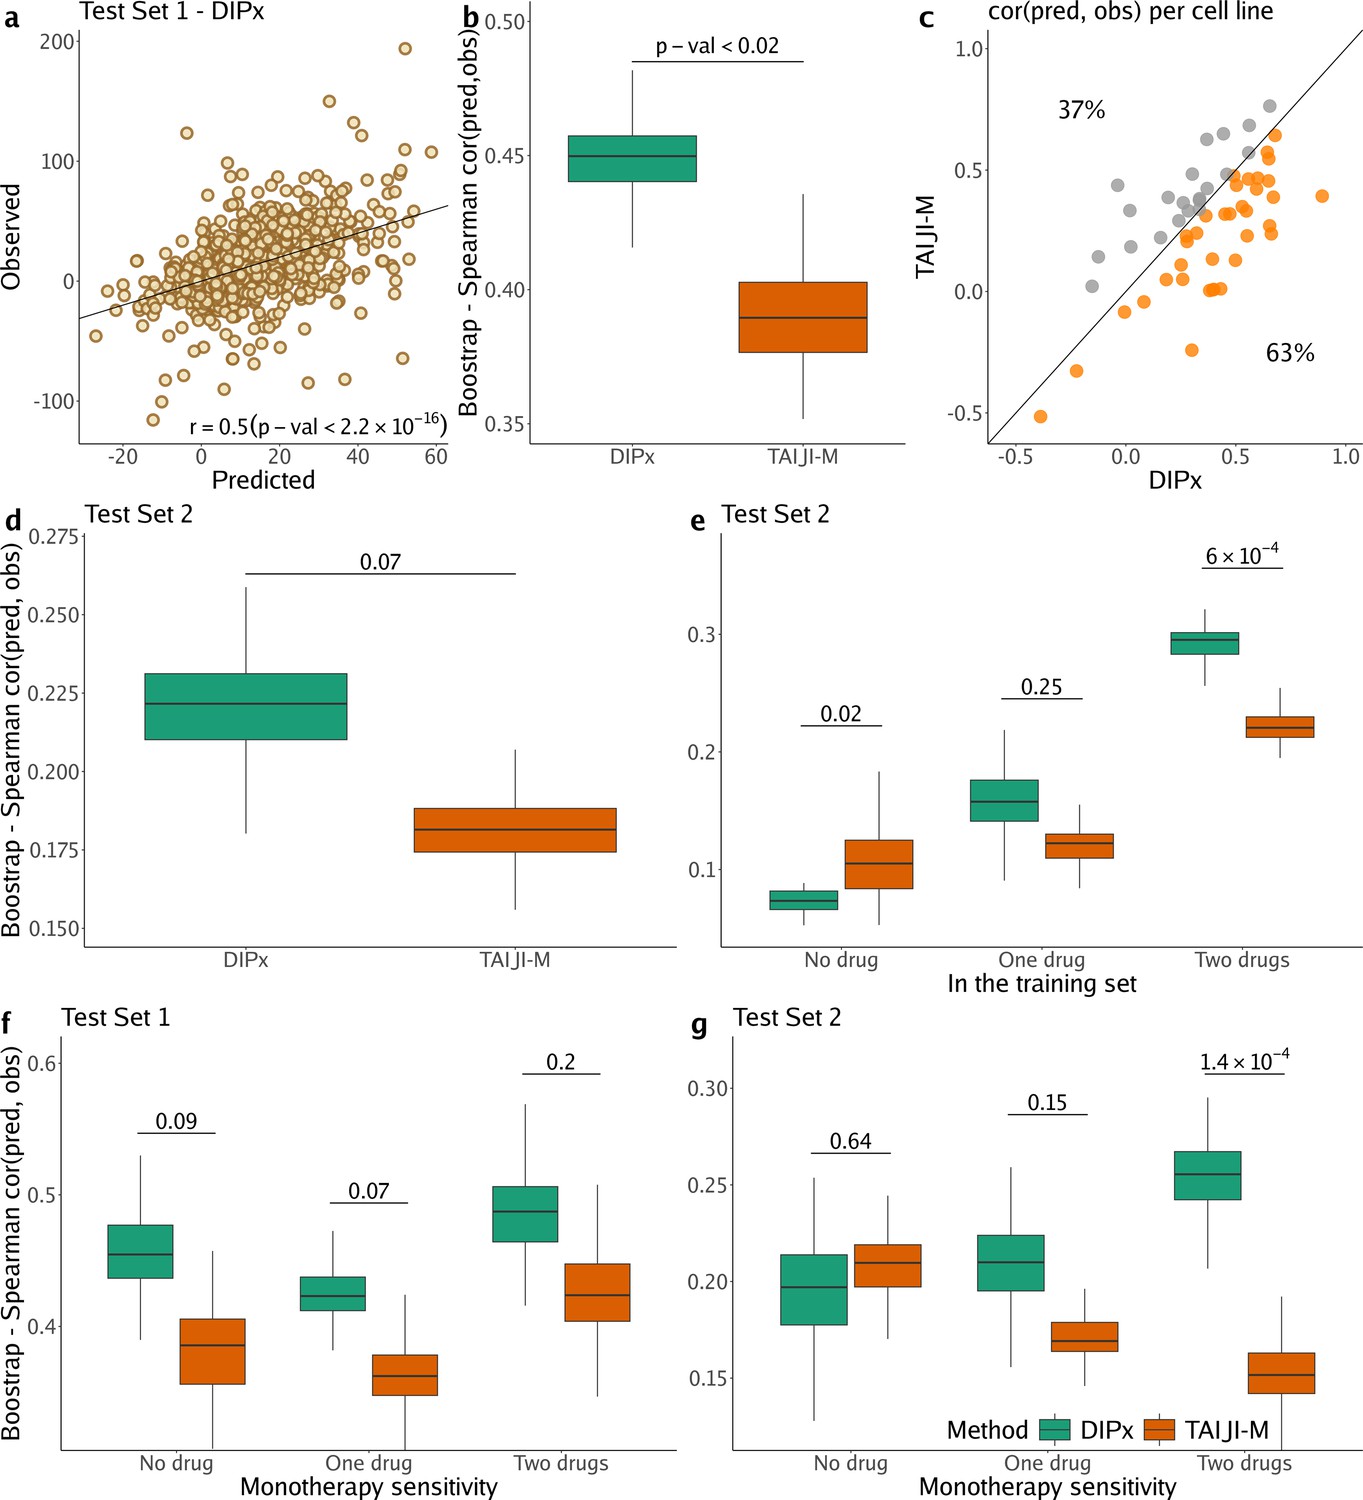
Performance of Drug synergy Interaction Prediction (DIPx) in the AstraZeneca-Sanger (AZS) dataset.
This includes both Test Set 1 (panels a, b, c, f) and Test Set 2 (panels d, e, g). (a) Comparison of predicted vs observed synergy scores for all experiments in Test Set 1. (b) Comparison of DIPx vs TAIJI-M in terms of the correlation between predicted and observed synergy scores from all experiments in Test Set 1. Each box plot shows the results based on 100 bootstrap replicates of the training set. (c) Comparison of DIPx and TAIJI-M performance across cell lines in Test Set 1. Each point represents the correlation between the predicted and observed synergy for a given cell line. (d) Comparison of DIPx vs TAIJI-M in Test Set 2. Each box plot displays the correlations between the predicted and observed values obtained from 100 bootstrap replicates of the training set. (e) Comparison of performance between DIPx and TAIJI-M in Test Set 2 in relation to the number of drugs in common (x-axis) between the combinations in the test set and the training set. (f and g) DIPx vs TAIJI-M in three groups classified by monotherapy sensitivity of two drugs in a combination in Test Set 1 (f) and Test Set 2 (g).
Figure 2—figure supplement 1
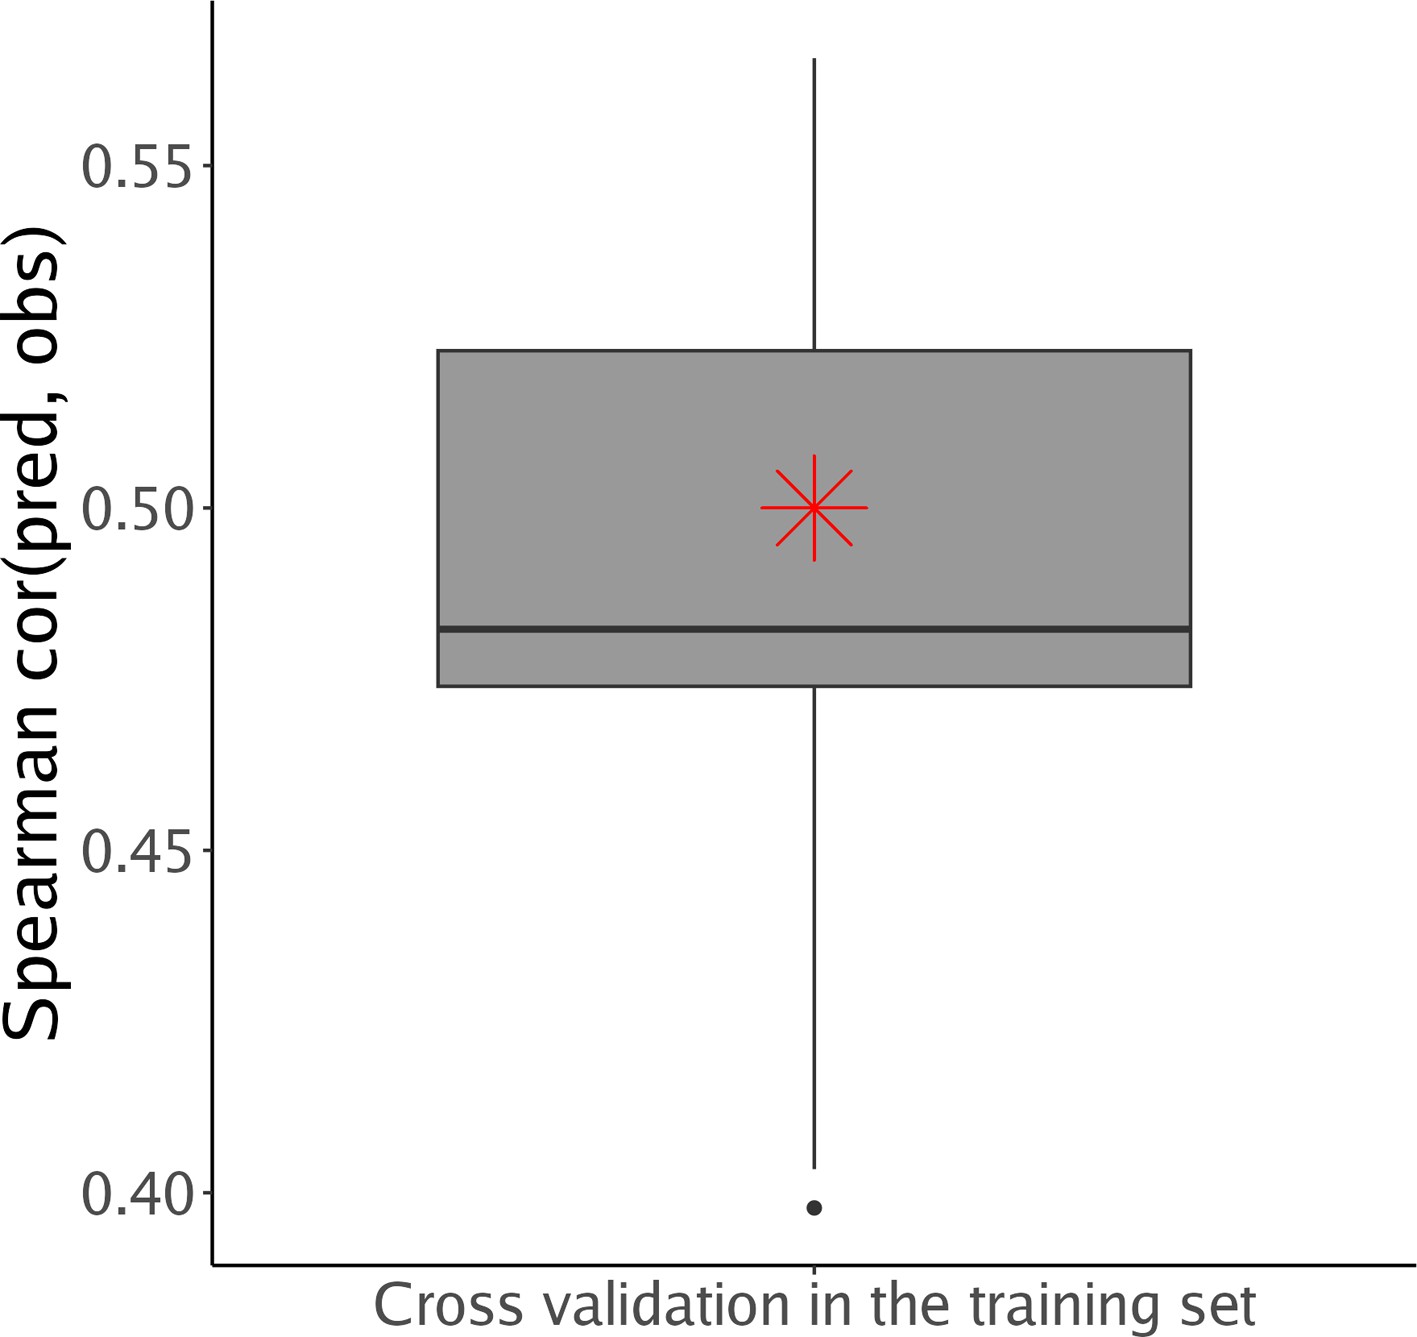
10-fold cross-validation of Drug synergy Interaction Prediction (DIPx) in the training set of the ASZ DREAM dataset.
Cross-validation of DIPx on the training set of the ASZ DREAM dataset. The y-axis of the box plot represents the Spearman’s correlation between predicted and observed values across 10 folds. The red star indicates the corresponding DIPx correlation achieved in Test Set 1.
Figure 3 with 1 supplement
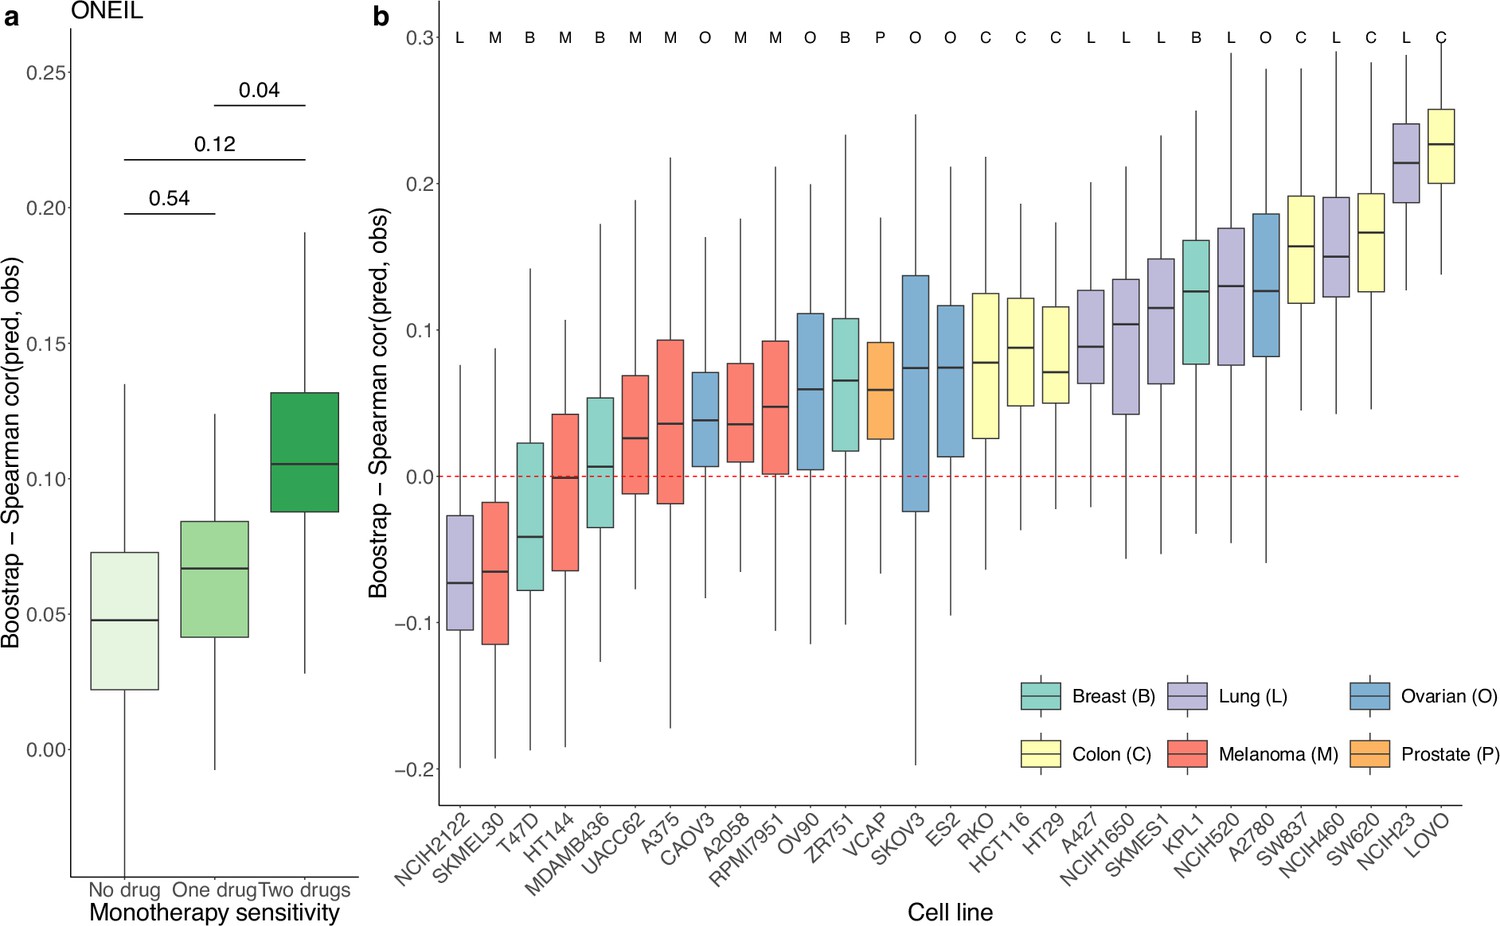
Prediction performance of Drug synergy Interaction Prediction (DIPx) in the O’Neil dataset.
(a) Monotherapy sensitivity, (b) 29 cell lines from six cancer tissues. The y-axis in all box plots shows the Spearman’s correlation between predicted and observed values in 100 bootstrap replicates.
Figure 3—figure supplement 1

Prediction performance of Drug synergy Interaction Prediction (DIPx) in the O’Neil dataset, grouped by unseen combinations in the training set (x-axis).
The y-axis in all box plots shows the Spearman’s correlation between predicted and observed values in 100 bootstrap replicates.
Figure 4 with 5 supplements
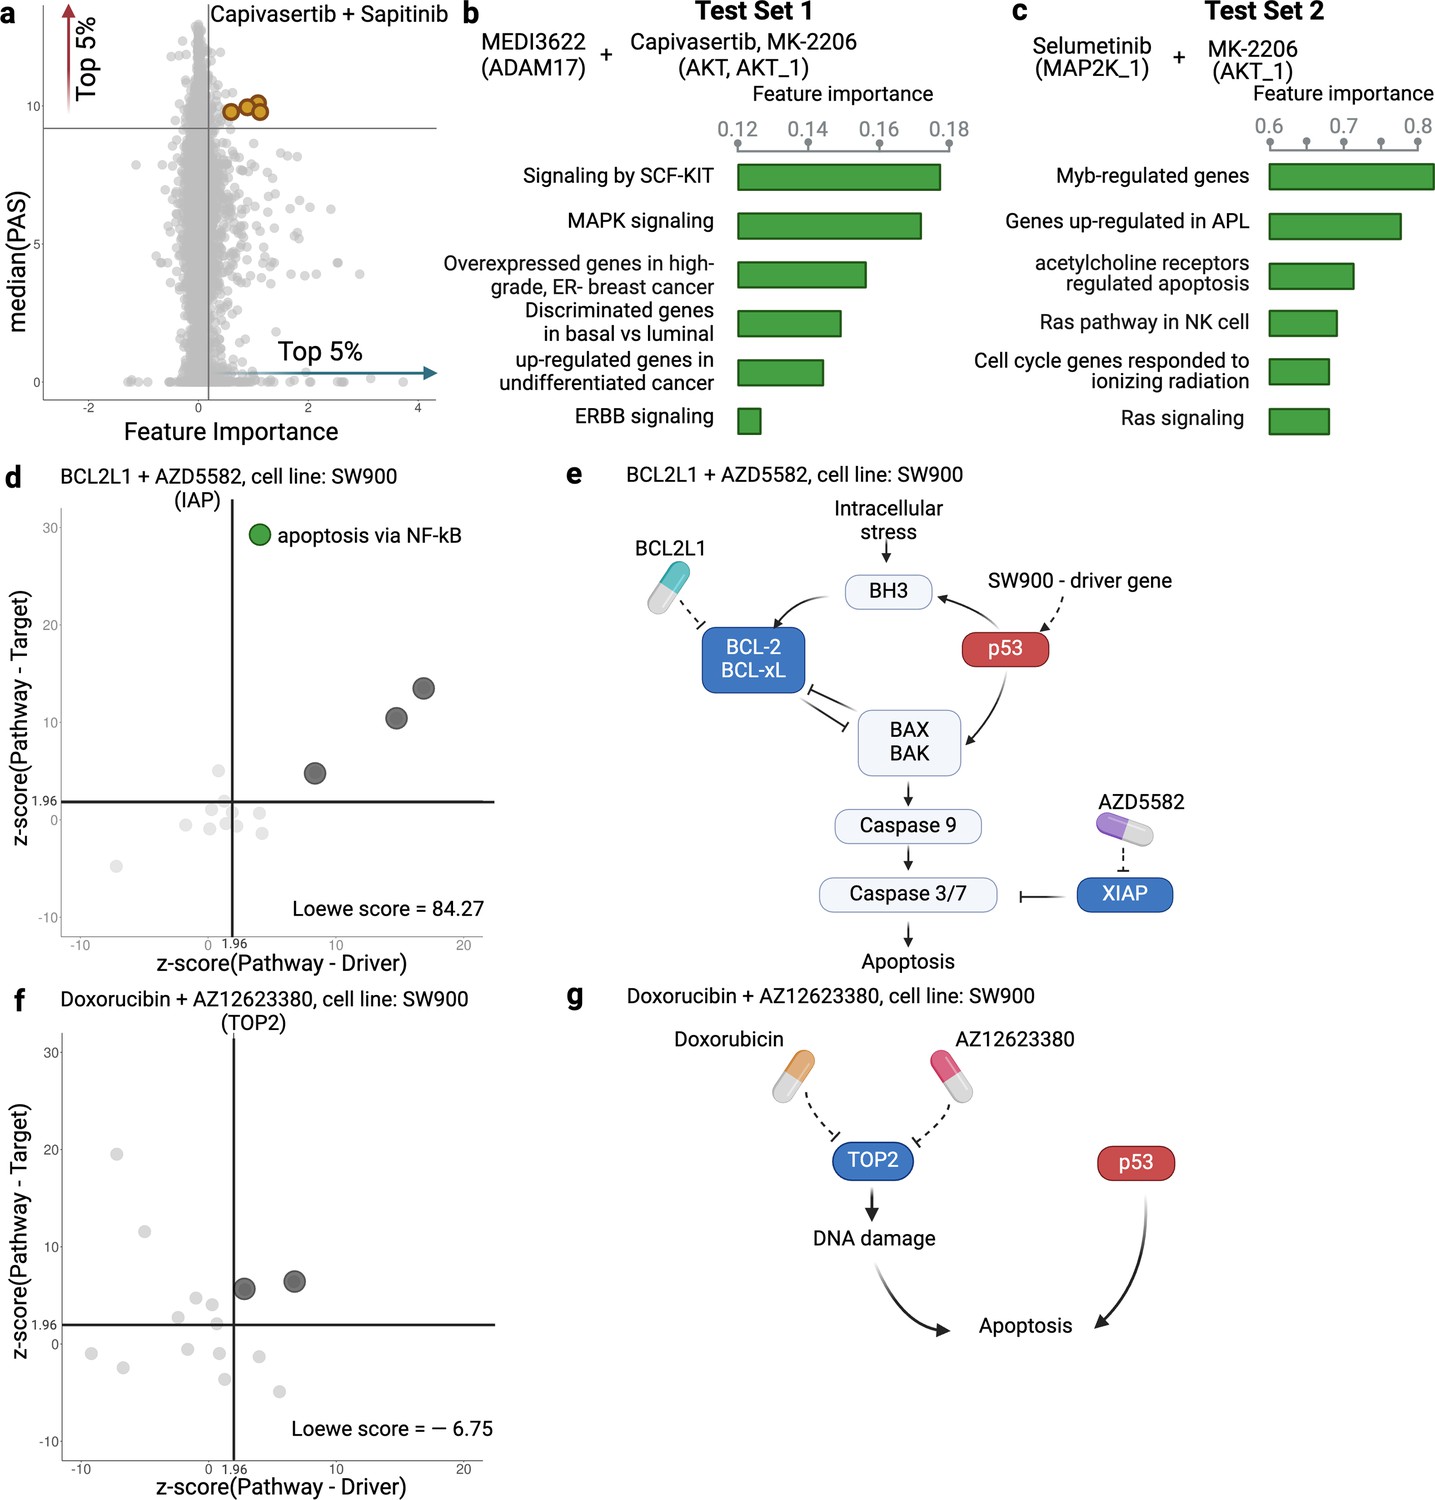
Inference of pathway importance scores in the AstraZeneca-Sanger (AZS) dataset.
(a) Scatter plot showing feature importance (x-axis) vs pathway activation score (PAS) (y-axis) for the Capivasertib + Sapitinib combination. Pathways with high PAS and feature importance (top 5%) are of particular interest. (b, c) Top pathways contributing to the prediction of the combinations in Test Set 1 (b) and Test Set 2 (c). For each pathway, the bar plots show its feature importance. (d, f) Functional interaction between the pathway vs driver genes (x-axis) and the pathway vs target genes (y-axis) of the top pathways suggested by Drug synergy Interaction Prediction (DIPx) in the SW900 cell line treated with synergistic combination BCL2L1 + AZD5582 (d) and the non-synergistic combination Doxorubicin + AZ12623380 (f). The z-score from network enrichment analysis (NEA) is a measure of functional interaction between two gene sets. A higher z-score indicates a stronger interaction compared to a random permutation of the network. The upper right quadrant (z-score > 1.96) represents pathways that are potentially interesting. (e, g) Cartoon illustration of the potential pathways mediated by the synergistic combination of BCL2L1 + AZD5582 (e) and the non-synergistic combination Doxorubicin + AZ12623380 (g).This figure was created using BioRender.com.
Figure 4—figure supplement 1

A cartoon illustration of the RAS pathway mediated by the Selumetinib + MK-2206 combination.
Figure 4—figure supplement 2
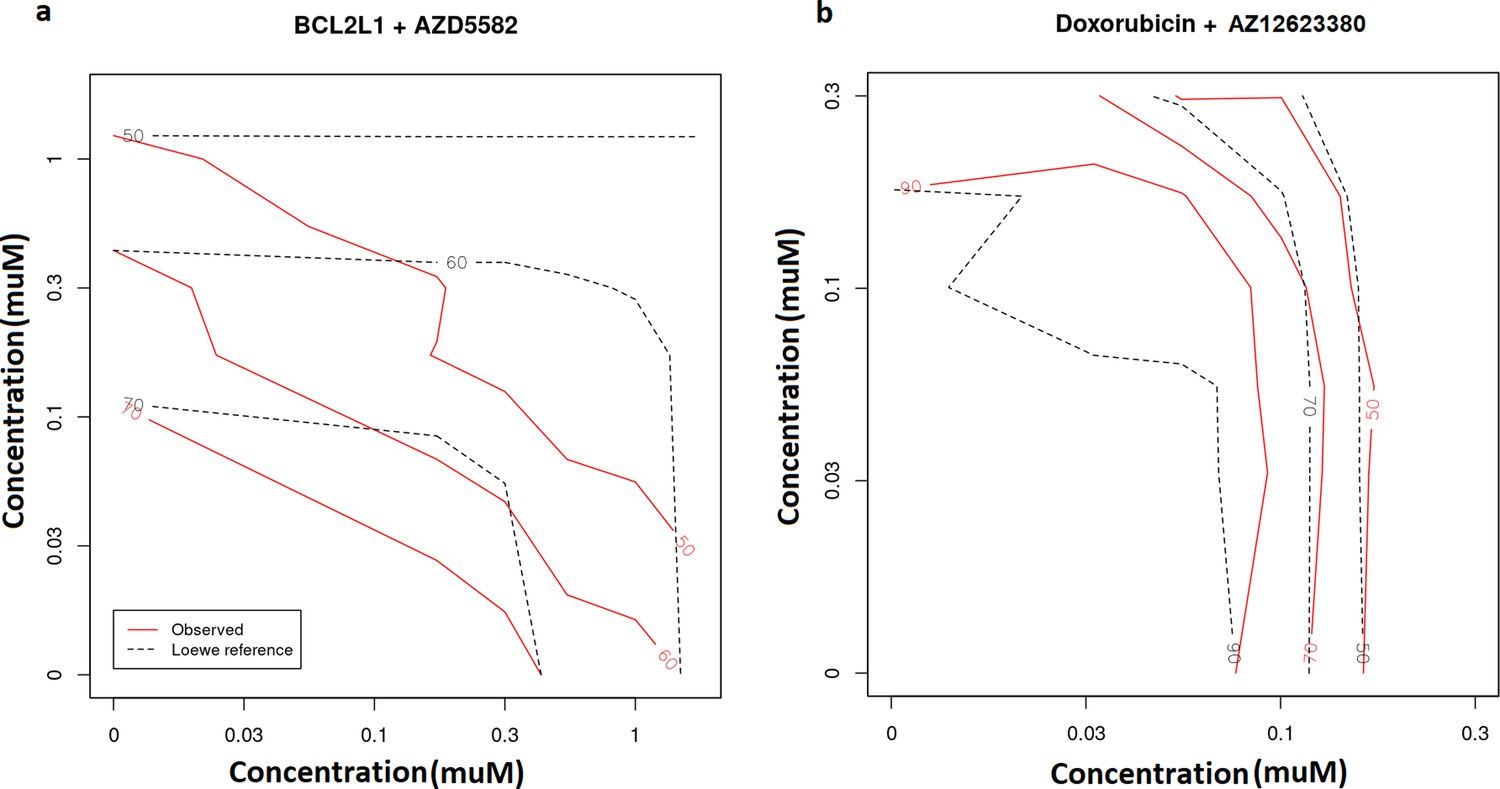
Observed (red lines) vs predicted inhibition (black, dash lines) from the Loewe reference model in the SW900 cell line treated by the synergistic BCL2L1 + AZD5582 combination (a) and the non-synergistic Doxorubicin + AZ12623380 combination (b).
The number in each line presents the percentage of inhibition.
Figure 4—figure supplement 3
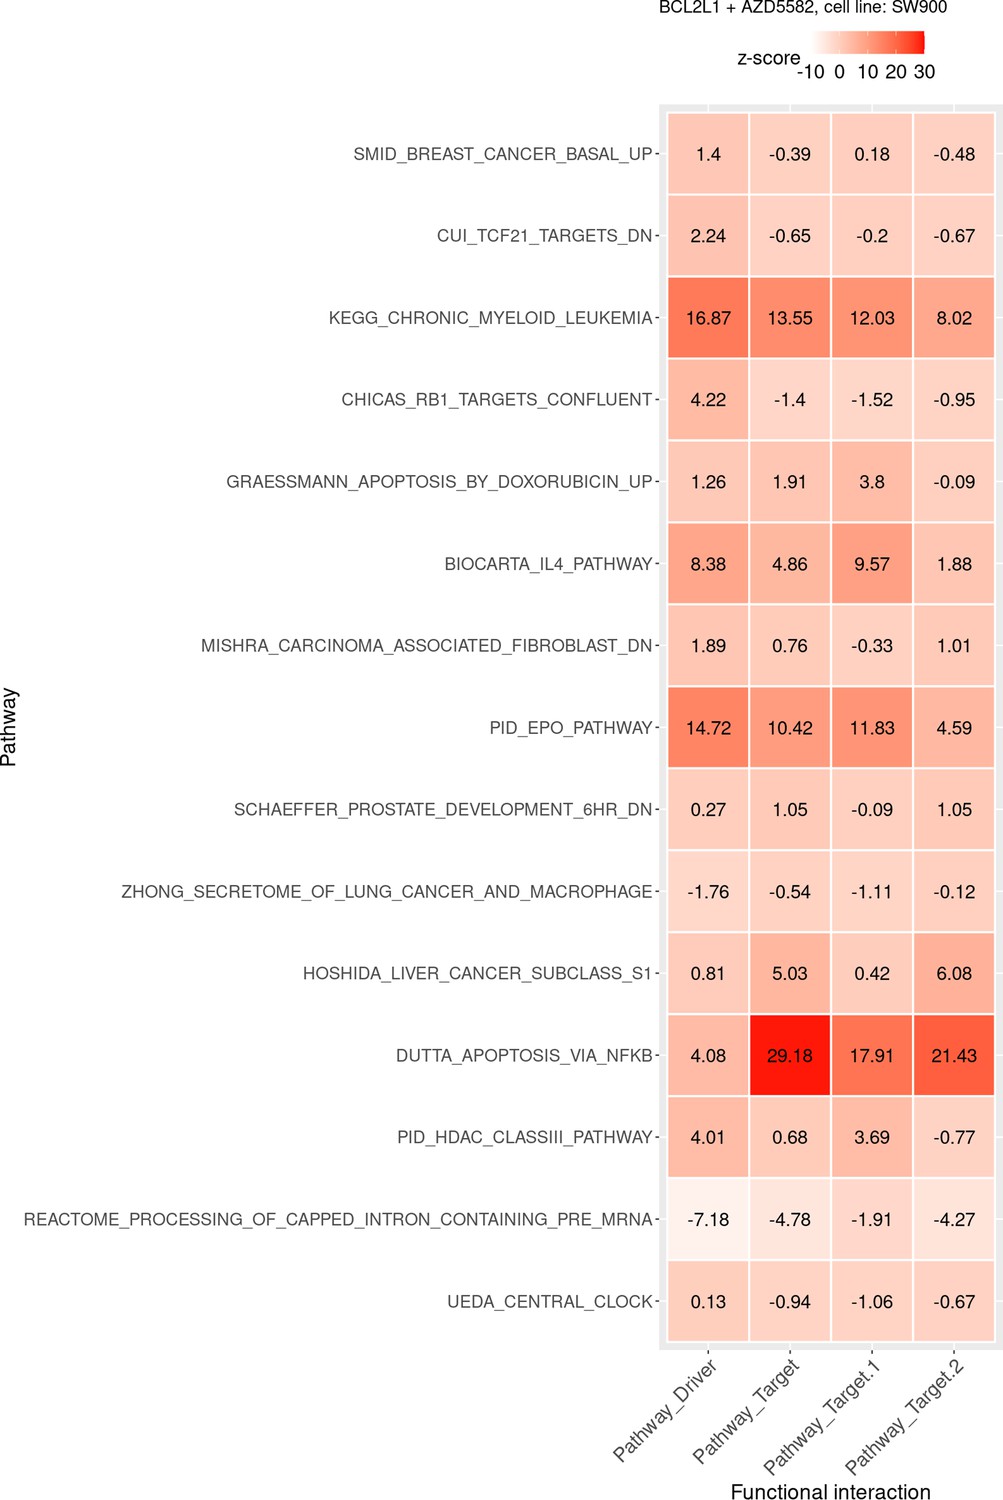
Functional interaction (x-axis) between the pathway vs driver genes (first column), the pathway vs all target genes (second), the pathway vs BCL2L1 target genes (third), and the pathway vs AZD5582 target genes (fourth) of the top pathways suggested by Drug synergy Interaction Prediction (DIPx) in the SW900 cell line treated with synergistic combination BCL2L1 + AZD5582.
Figure 4—figure supplement 4
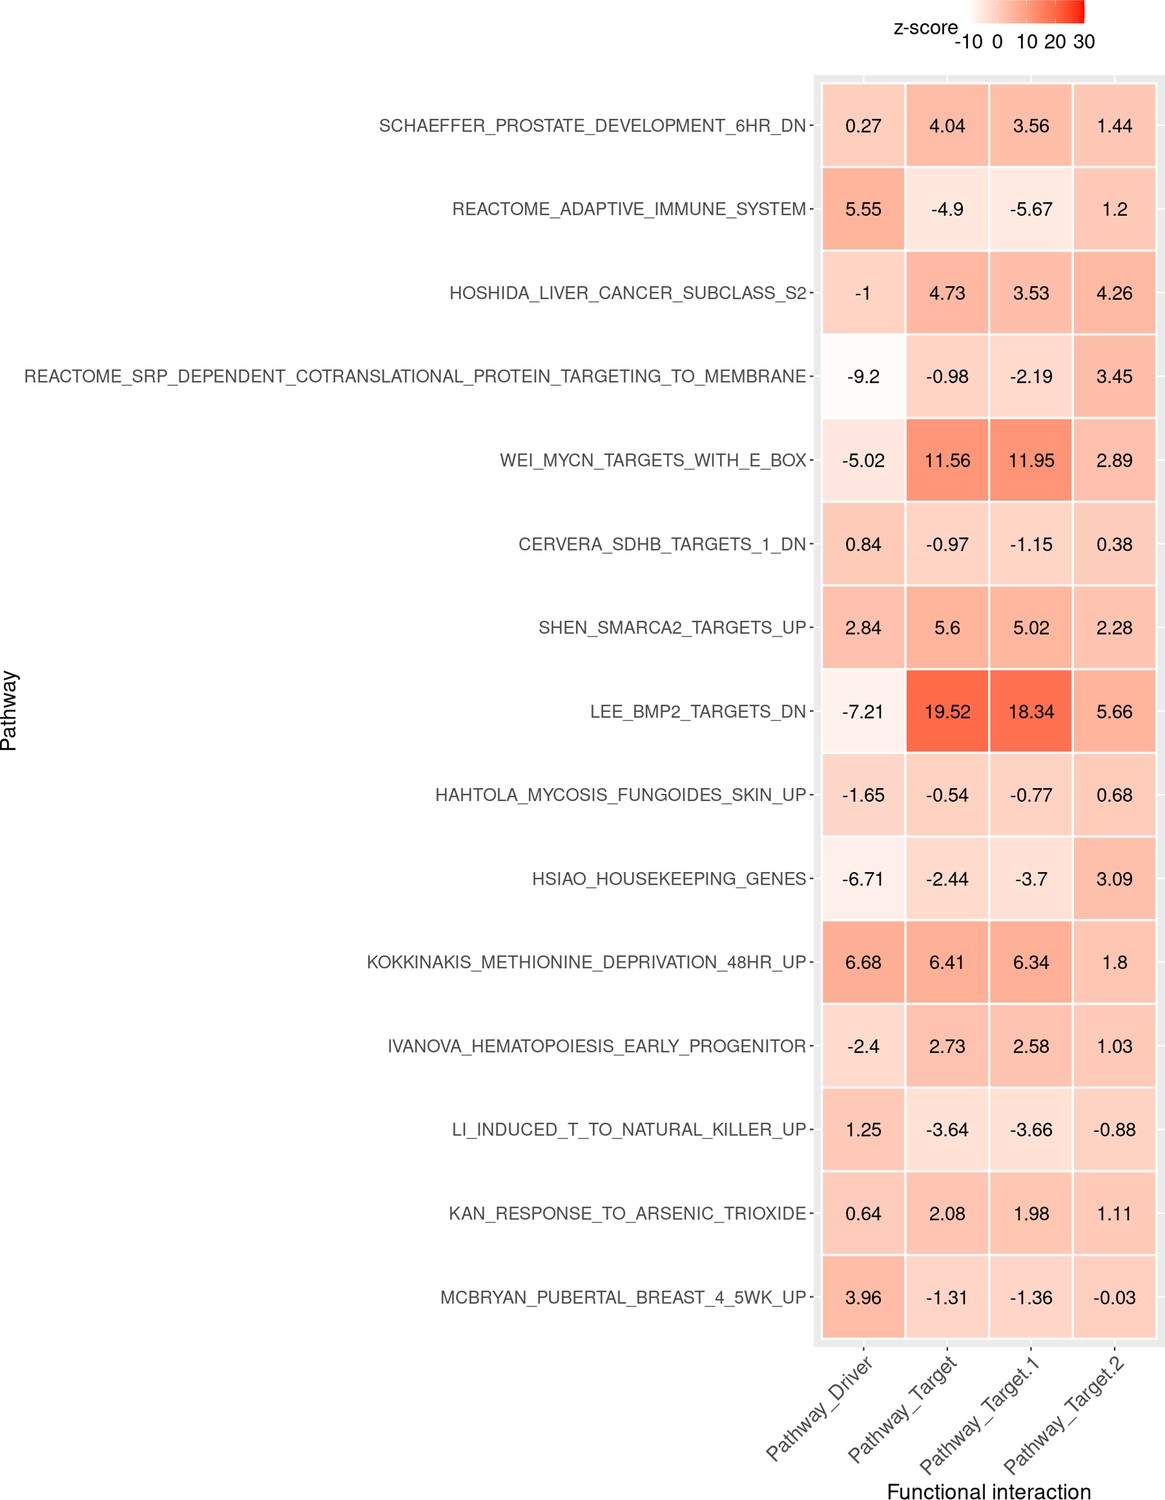
Functional interaction (x-axis) between the pathway vs driver genes (first column), the pathway vs all target genes (second), the pathway vs Doxorubicin target genes (third), and the pathway vs AZ12623380 target genes (fourth) of the top pathways suggested by Drug synergy Interaction Prediction (DIPx) in the SW900 cell line treated with non-synergistic combination Doxorubicin + AZ12623380.
Figure 4—figure supplement 5
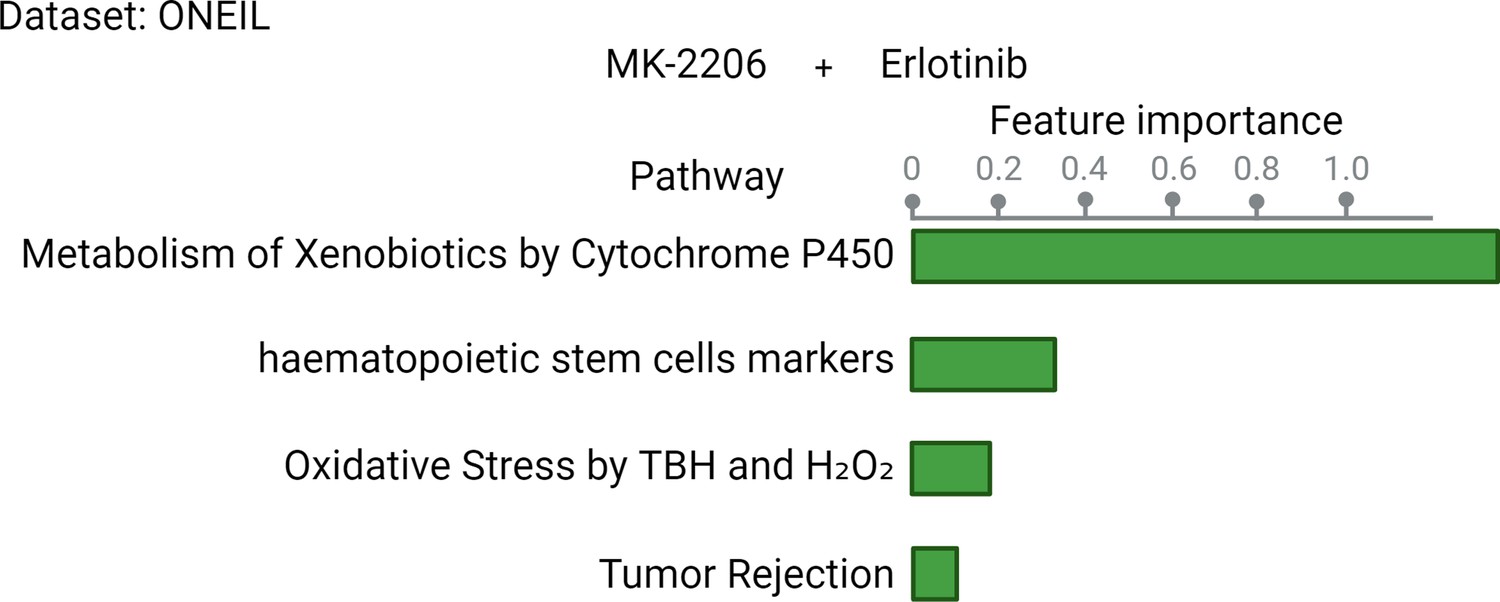
Top pathways contributing to the prediction of the MK2206 + Erlotinib combination in the O'Neil dataset.
Figure 5
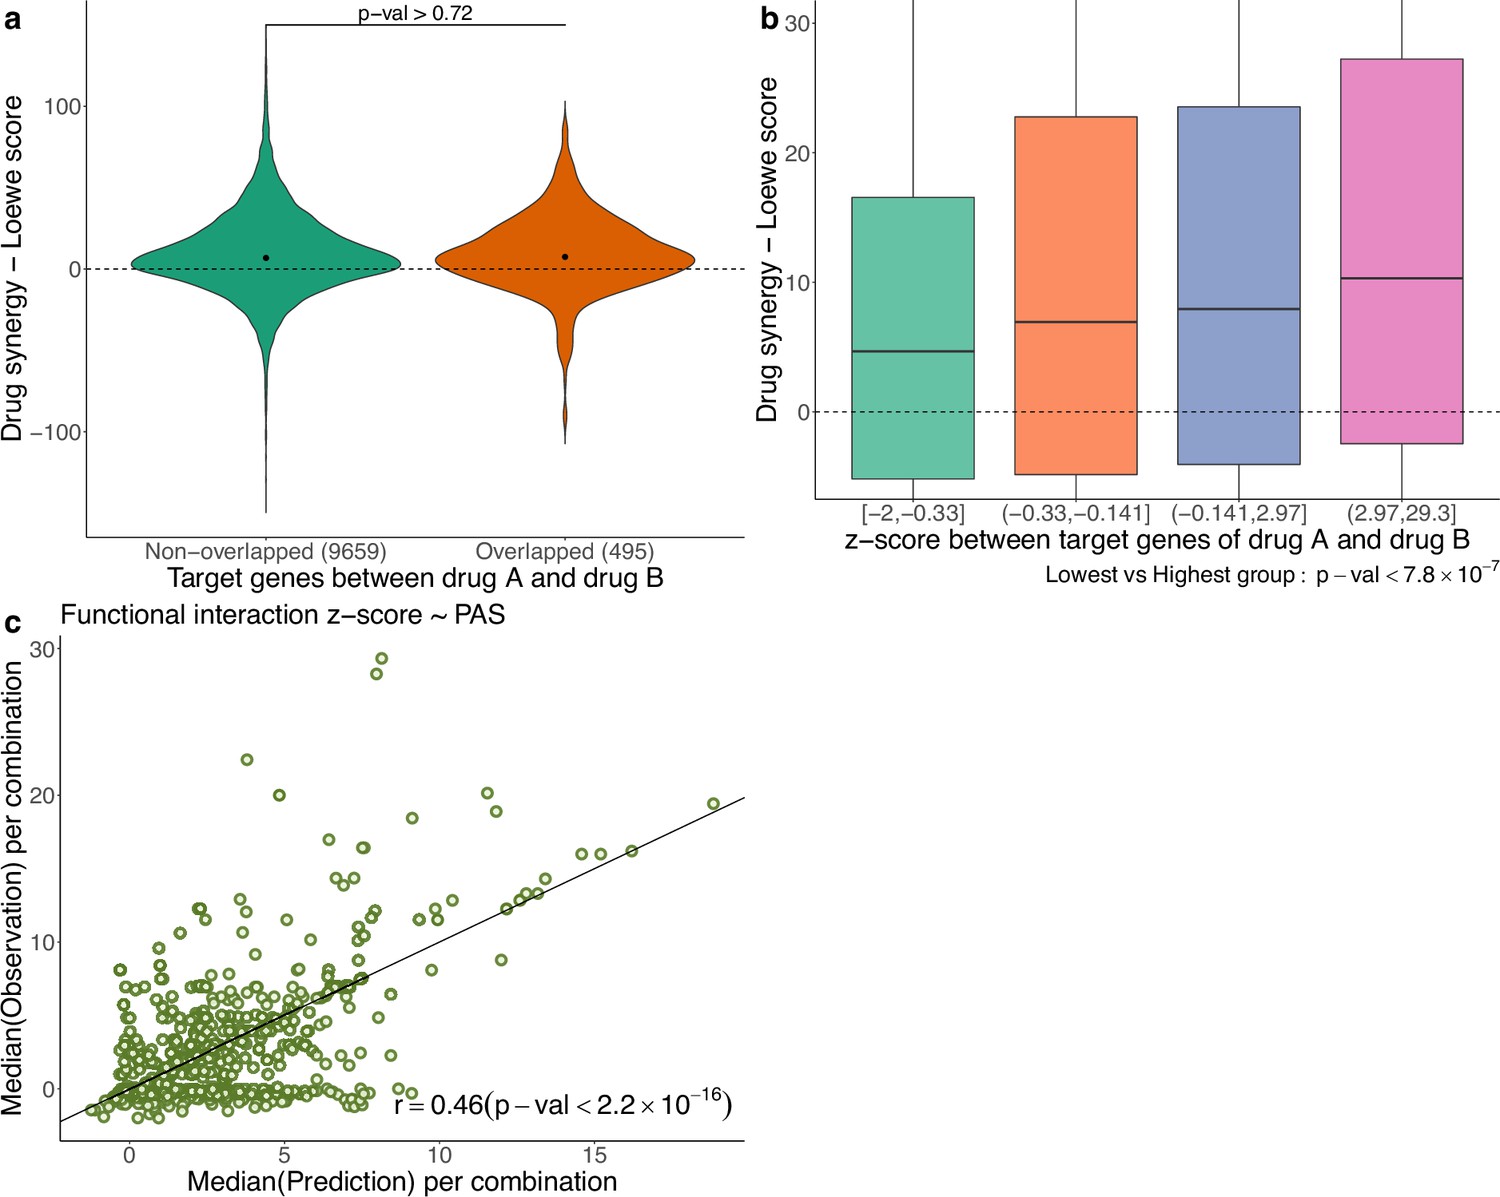
Functional interaction of drug targets in drug synergy and PAS.
(a) Comparison of drug synergy between combinations (drug A+drug B) with vs without overlapping target genes. The numbers in parentheses show the sample sizes of each group. (b) Drug synergy between four groups in relation to increased functional interaction between the target genes of the two drugs. (c) Comparison between the observed functional interaction (z-score in the network enrichment analysis) and the predicted z-score by pathway activation score (PAS).
Additional files
-
MDAR checklist
- https://cdn.elifesciences.org/articles/100071/elife-100071-mdarchecklist1-v1.pdf
-
Supplementary file 1
Supplementary tables.
- https://cdn.elifesciences.org/articles/100071/elife-100071-supp1-v1.xlsx
Download links
A two-part list of links to download the article, or parts of the article, in various formats.
Downloads (link to download the article as PDF)
Open citations (links to open the citations from this article in various online reference manager services)
Cite this article (links to download the citations from this article in formats compatible with various reference manager tools)
Pathway activation model for personalized prediction of drug synergy
eLife 13:RP100071.
https://doi.org/10.7554/eLife.100071.4


