One N-glycan regulates natural killer cell antibody-dependent cell-mediated cytotoxicity and modulates Fc γ receptor IIIa/CD16a structure
- Department of Biochemistry and Molecular Biology, University of Georgia, United States
- Complex Carbohydrate Research Center, University of Georgia, United States
- Department of Chemistry, University of Georgia, United States
Figures
Figure 1 with 1 supplement
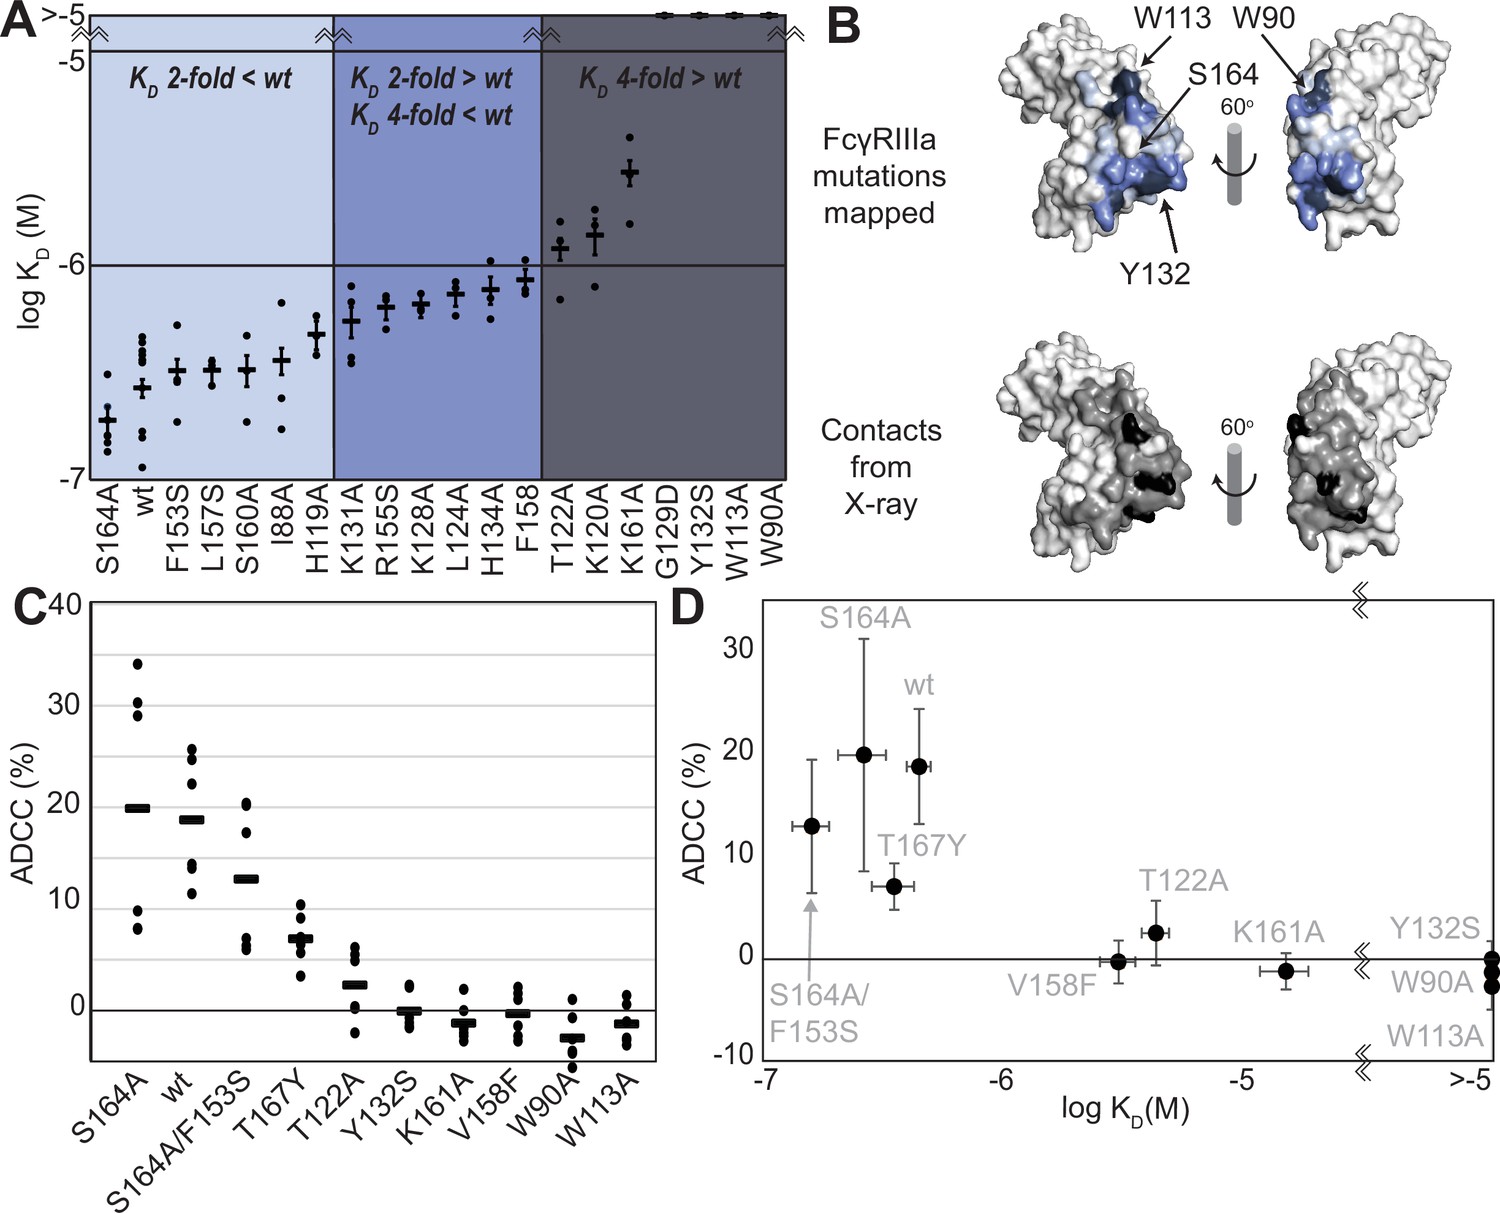
FcγRIIIa antibody-binding affinities correlate with antibody-dependent cell-mediated cytotoxicity (ADCC) potency.
(A) Affinities of FcγRIIIa amino acid variants determined by SPR are binned into impact: twofold lower (light blue), between two- and fourfold (blue), or greater than fourfold lower than V158 (dark blue). (B) Plotting these values onto a surface representation of FcγRIIIa, using the same coloring scheme as in (A)., reveals two critical areas for binding centered around W113 and Y132 (top panel). These values provide more detail in contrast to the interface defined by X-ray crystallography with contacts shown <3 Å (black surface) and <5 Å (gray surface). (C) ADCC of YTS cells transduced to express a panel of FcγRIIIa variants. Horizontal black bars represent average ADCC values, with individual point representing individual assays. Experiments were completed in triplicate and the figure includes data from multiple experiments collected on multiple days. (D) A comparison of ADCC values from panel (C) and binding affinity from panel (A) shows a correlation. Scale bars in D represent n=6 ADCC assays and n>=3 affinity measurements.
Figure 1—figure supplement 1
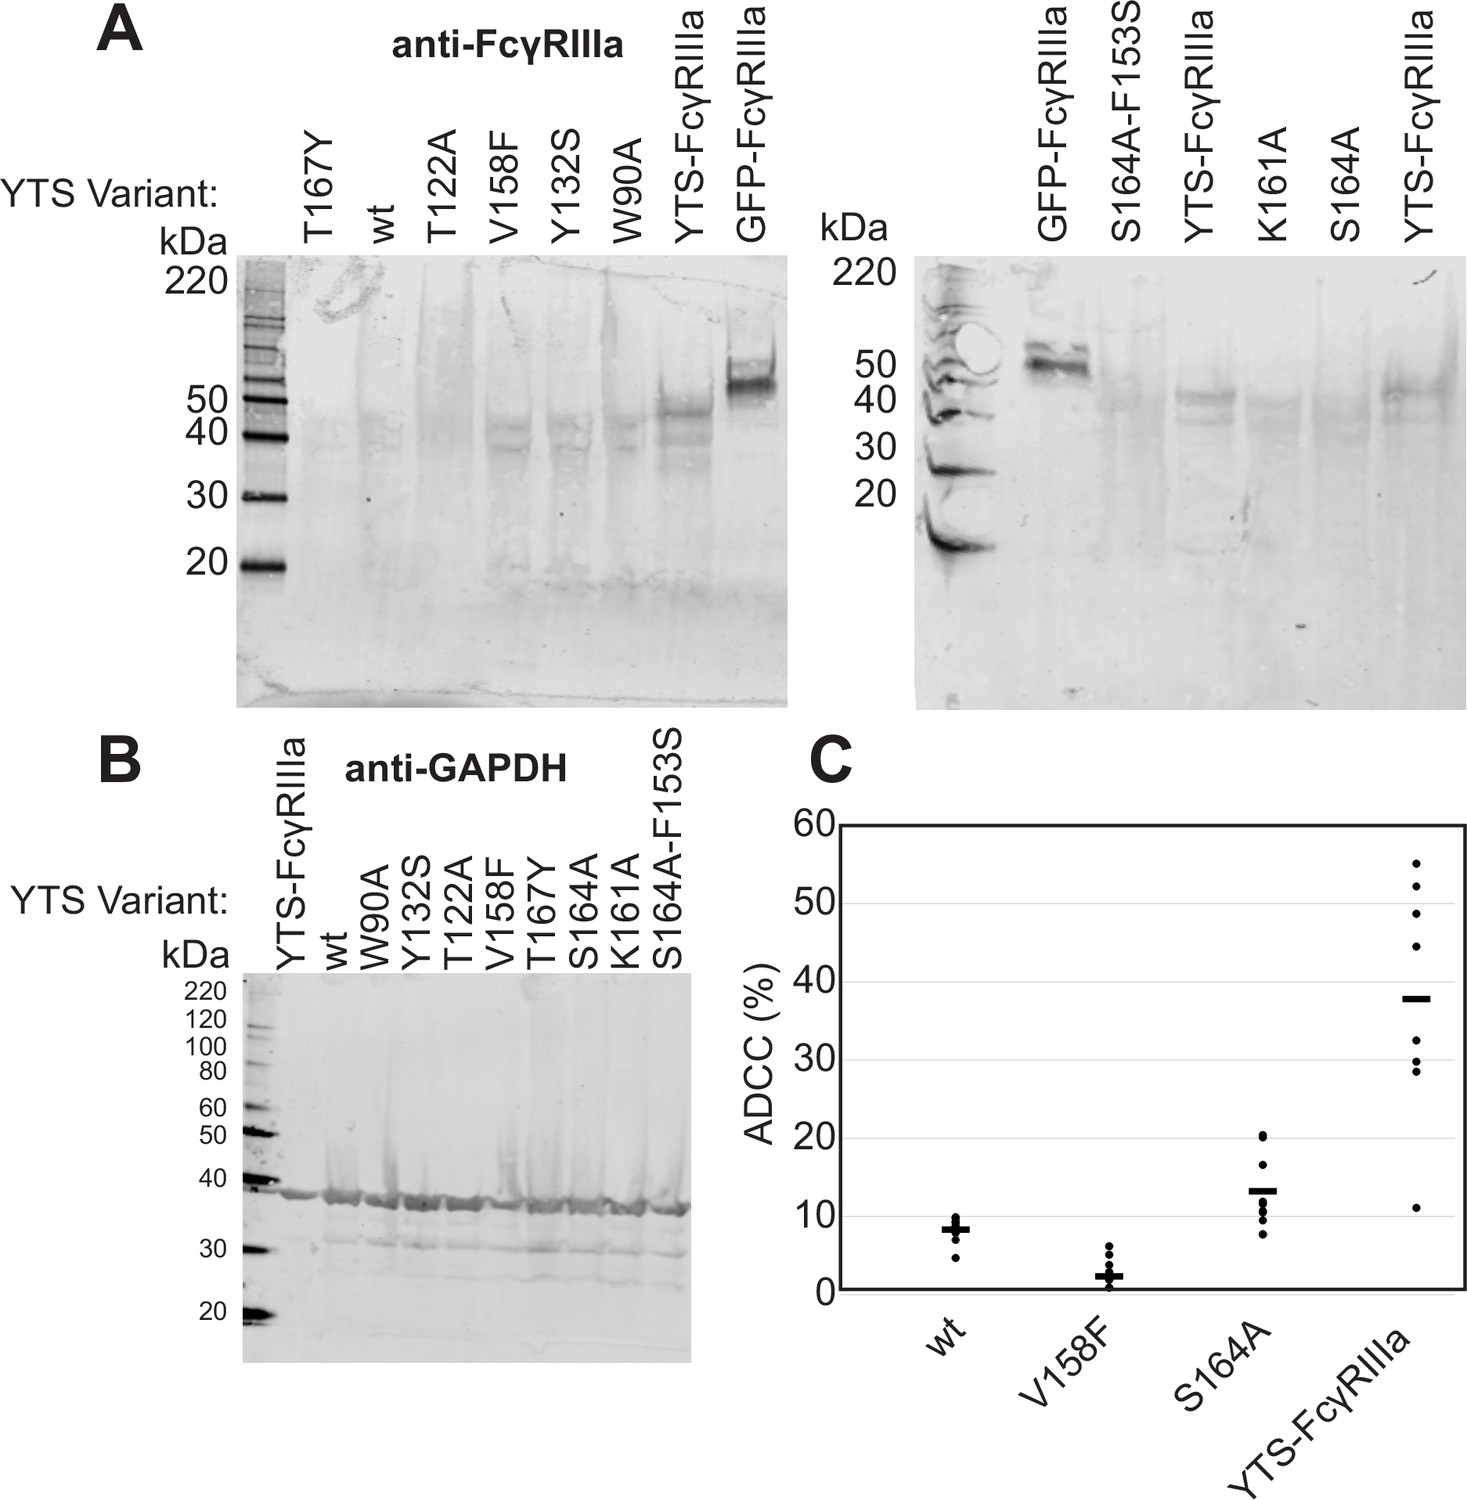
Comparison of expression and antibody-dependent cell-mediated cytotoxicity (ADCC) of the previously established YTS-FcγRIIIa natural killer (NK) cell line and the lentivirus-transduced cell lines prepared herein.
(A) Western blots showing expression levels compared to 40 ng of recombinant GFP-FcγRIIIa protein. ‘YTS-FcγRIIIa’ refers to the previously established ‘YTS-FcγRIIIa’ cell line in contrast to the lentivirus transduced YTS cells expressing various FcγRIIIa variants described herein. (B) GAPDH expression levels of the YTS cells. (C) The ADCC of the YTS-FcγRIIIa cell line is greater than our YTS cells transduced with FcγRIIIa V158. Data shown include three independent experiments collected on different days, each with three replicates.
-
Figure 1—figure supplement 1—source data 1
Original image file containing the original west blots for Figure 1—figure supplement 1.
- https://cdn.elifesciences.org/articles/100083/elife-100083-fig1-figsupp1-data1-v1.zip
-
Figure 1—figure supplement 1—source data 2
Image file containing the original west blots for Figure 1—figure supplement 1, indicating the relevant bands and treatments.
- https://cdn.elifesciences.org/articles/100083/elife-100083-fig1-figsupp1-data2-v1.zip
Figure 2 with 1 supplement
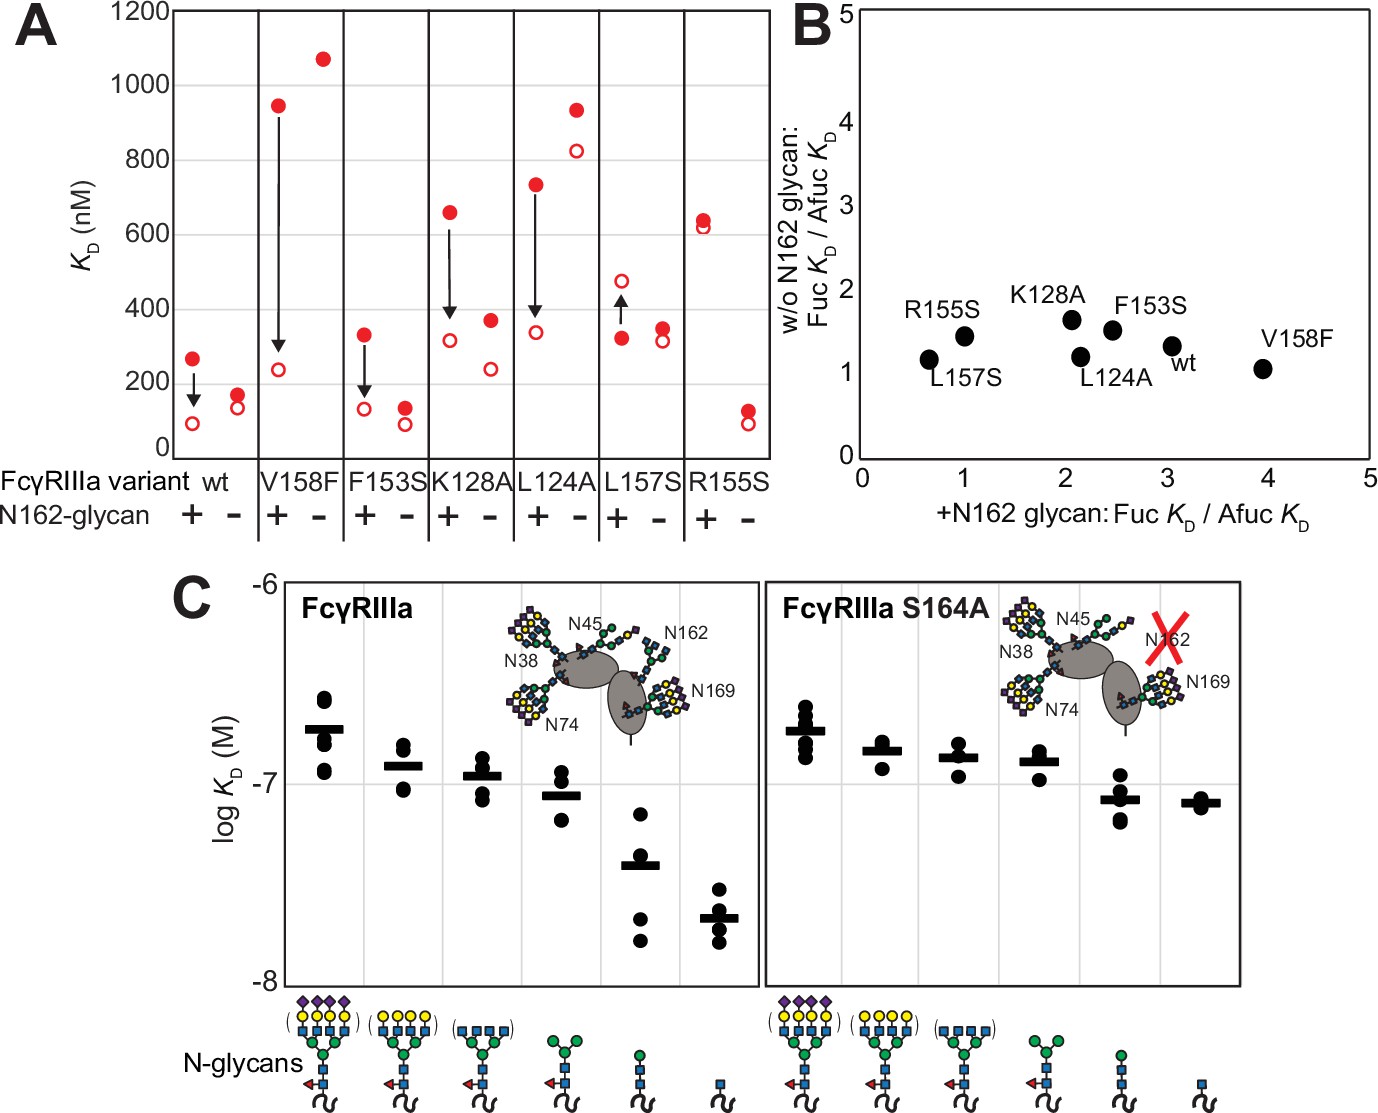
The FcγRIIIa N162 glycan regulates affinity toward fucosylated and afucosylated IgG1 Fc.
(A) FcγRIIIa variants demonstrate higher affinity toward without IgG1 Fc core-fucosylation (open circles) than with this modification (red circles). The affinity increase is demarcated with a vertical arrow. When the N162 glycan was removed through the S164A mutation, the fucose sensitivity greatly diminished. (B) Comparison of the fold affinity increase in panel (A) due to removing IgG1 Fc fucose. Averages for the fold increase with the N162 glycan present and absent are noted on the x- and y-axes, respectively. (C) The affinities of six different FcγRIIIa glycoforms were measured with and without the N162 glycan (wt and S164A, respectively). Horizontal black bars represent the means and individual measurements are shown with closed black circles. Cartoon models utilize the SNFG nomenclature and represent the possible N-glycan compositions for each species.
Figure 2—figure supplement 1

Glycosidase digestions visualized by SDS-PAGE.
GFP-FcγRIIIa was treated with various glycosidases, revealing a stepwise increase in migration rate on a reducing SDS-PAGE gel. N = neuraminidase treated. NG = treatment with neuraminidase and galactosidase. NGG = treatment with neuraminidase, galactosidase and N-acetylglucosaminidase. Analyses of endoglycosidase F products are characterized elsewhere (Lampros et al., 2022).
-
Figure 2—figure supplement 1—source data 1
Original image file containing the SDS-PAGE analysis for Figure 2—figure supplement 1.
- https://cdn.elifesciences.org/articles/100083/elife-100083-fig2-figsupp1-data1-v1.zip
-
Figure 2—figure supplement 1—source data 2
Image file containing the SDS-PAGE analysis for Figure 2—figure supplement 1, indicating the relevant bands and treatments.
- https://cdn.elifesciences.org/articles/100083/elife-100083-fig2-figsupp1-data2-v1.zip
Figure 3
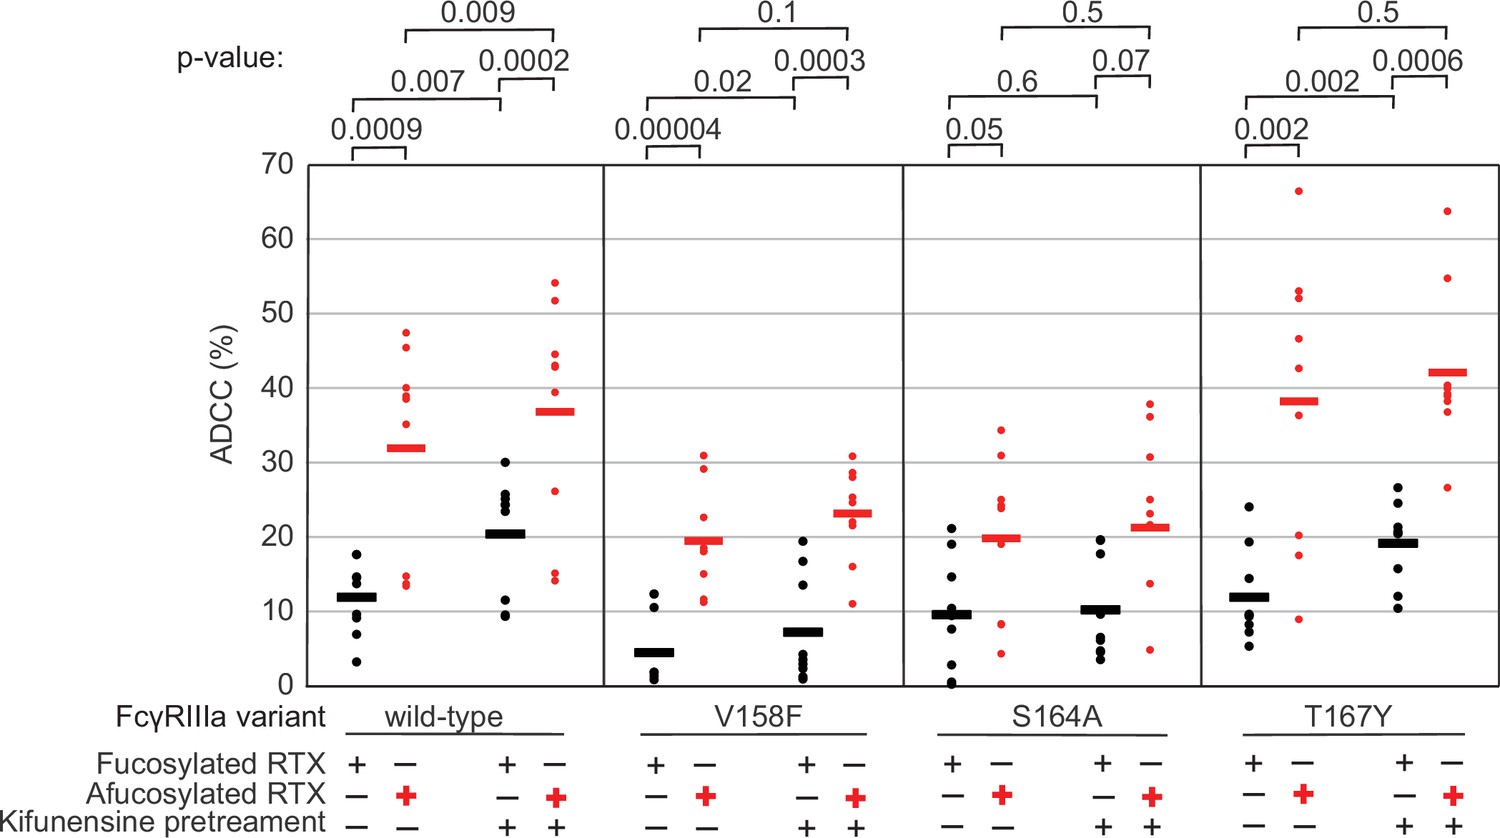
The FcγRIIIa N162 glycan regulates natural killer (NK) cell antibody-dependent cell-mediated cytotoxicity (ADCC).
The ADCC of NK cells increases significantly following 20 µM kifunensine for YTS cells expressing FcγRIIIa that retains the N162 glycan (wildtype, V158F, T167Y). Removing the N162 glycan with the S164A mutation eliminates this increase. In addition to kifunensine, these cells demonstrate significant ADCC increases from afucosylated rituximab (RTX) compared to fucosylated RTX. The YTS cells FcγRIIIa S164A cells likewise demonstrate no increased ADCC following kifunensine treatment when using afucosylated RTX, unlike YTS cells expressing the wildtype FcγRIIIa. Observations made using an afucosylated antibody are shown in red. Data shown include three independent experiments collected on three different days, each with three replicates (n=9). p-Values from two-tailed t-tests are shown at the top. Raw ADCC values supporting this figure are presented in Supplementary file 2.
Figure 4 with 2 supplements
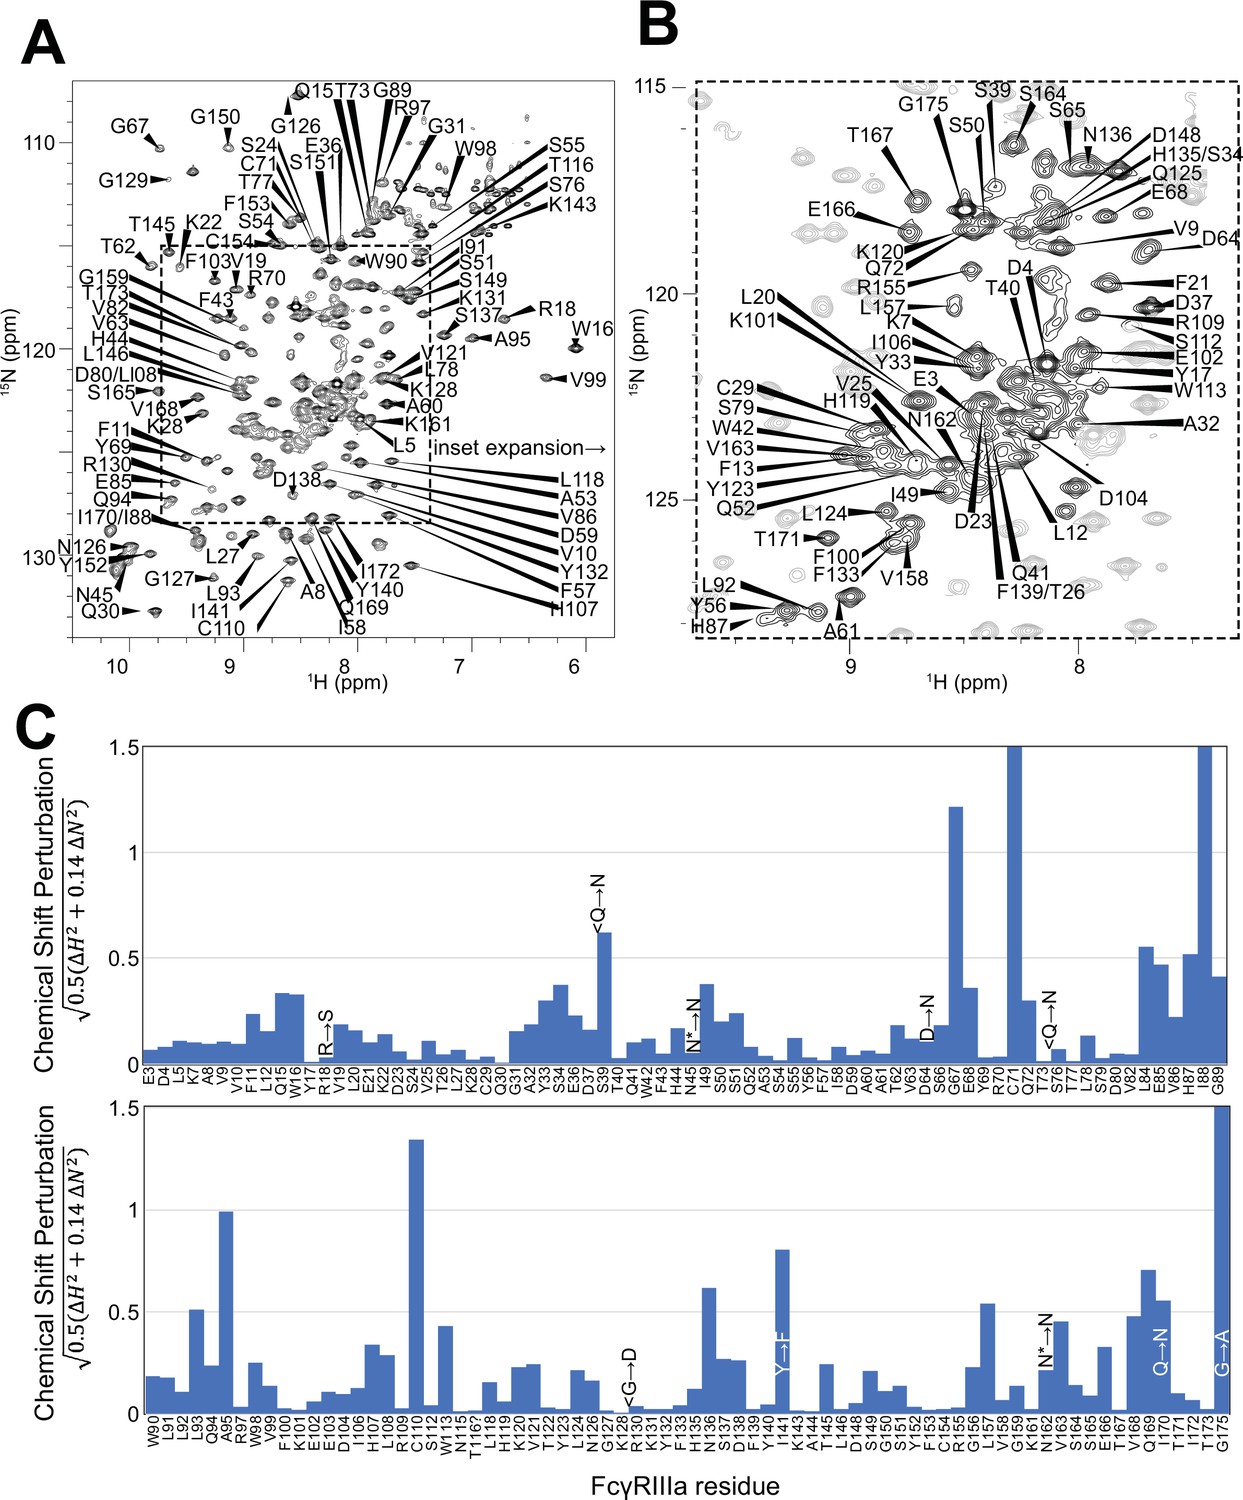
Backbone resonance assignment of FcγRIIIa with N-glycans at N45 and N162.
Amino acid position within the sequence of 175 residues and the residue type are shown. (A) The entire 1H-15N HSQC-TROSY spectrum. (B) Expansion and additional assignments within the inset. (C) A comparison of the assigned 1H and 15N resonances from the glycosylated FcγRIIIa to FcγRIIIb expressed from E. coli that contains no N-glycans. Sequence differences are noted in the figure, with the bottom letter denoting the FcγRIIIa residue. N* = a glycosylated asparagine residue.
Figure 4—figure supplement 1
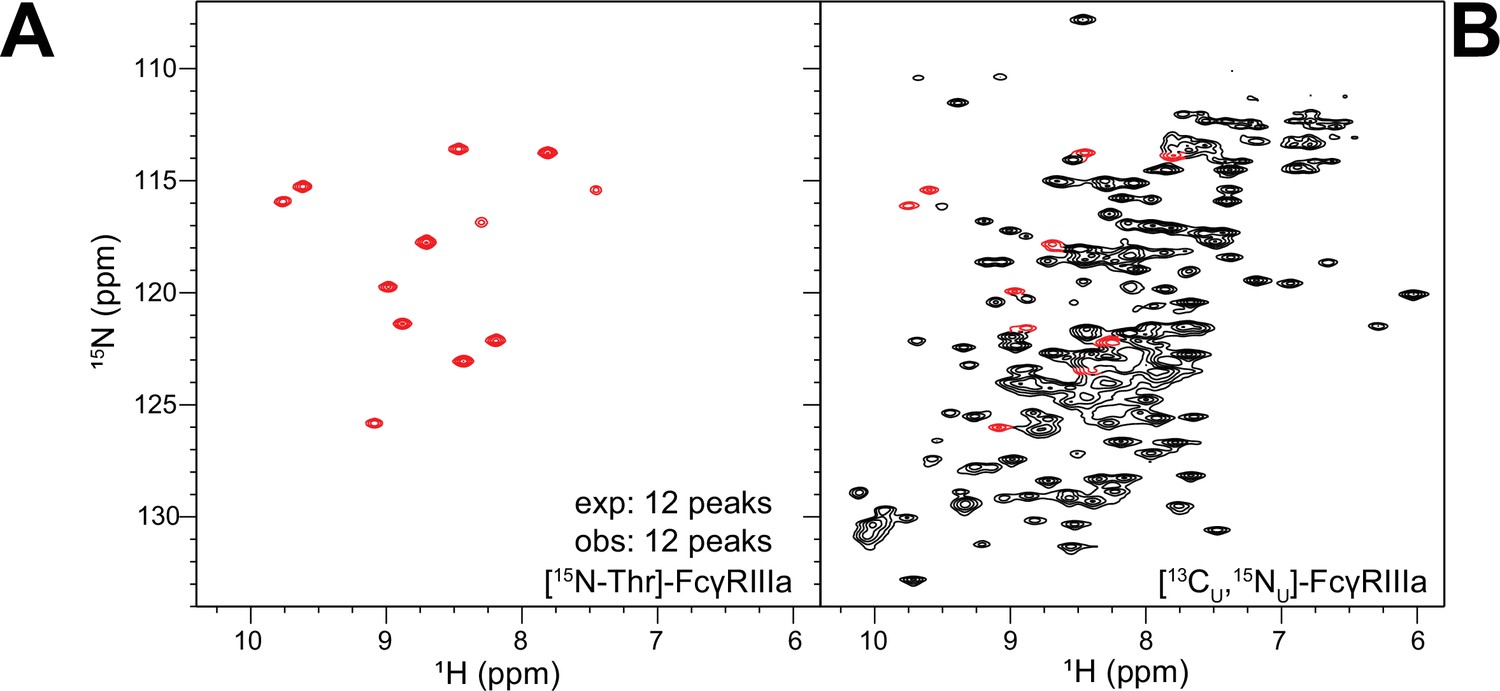
Residue-specific labeling of the glycosylated FcγRIIIa.
(A) FcγRIIIa with two N-glycans expressed from HEK293F cells grown in medium supplemented with [15N]-Threonine. (B) Peaks in the spectrum of [13C,15N]-FcγRIIIa corresponding to threonine residues (red contours).
Figure 4—figure supplement 2
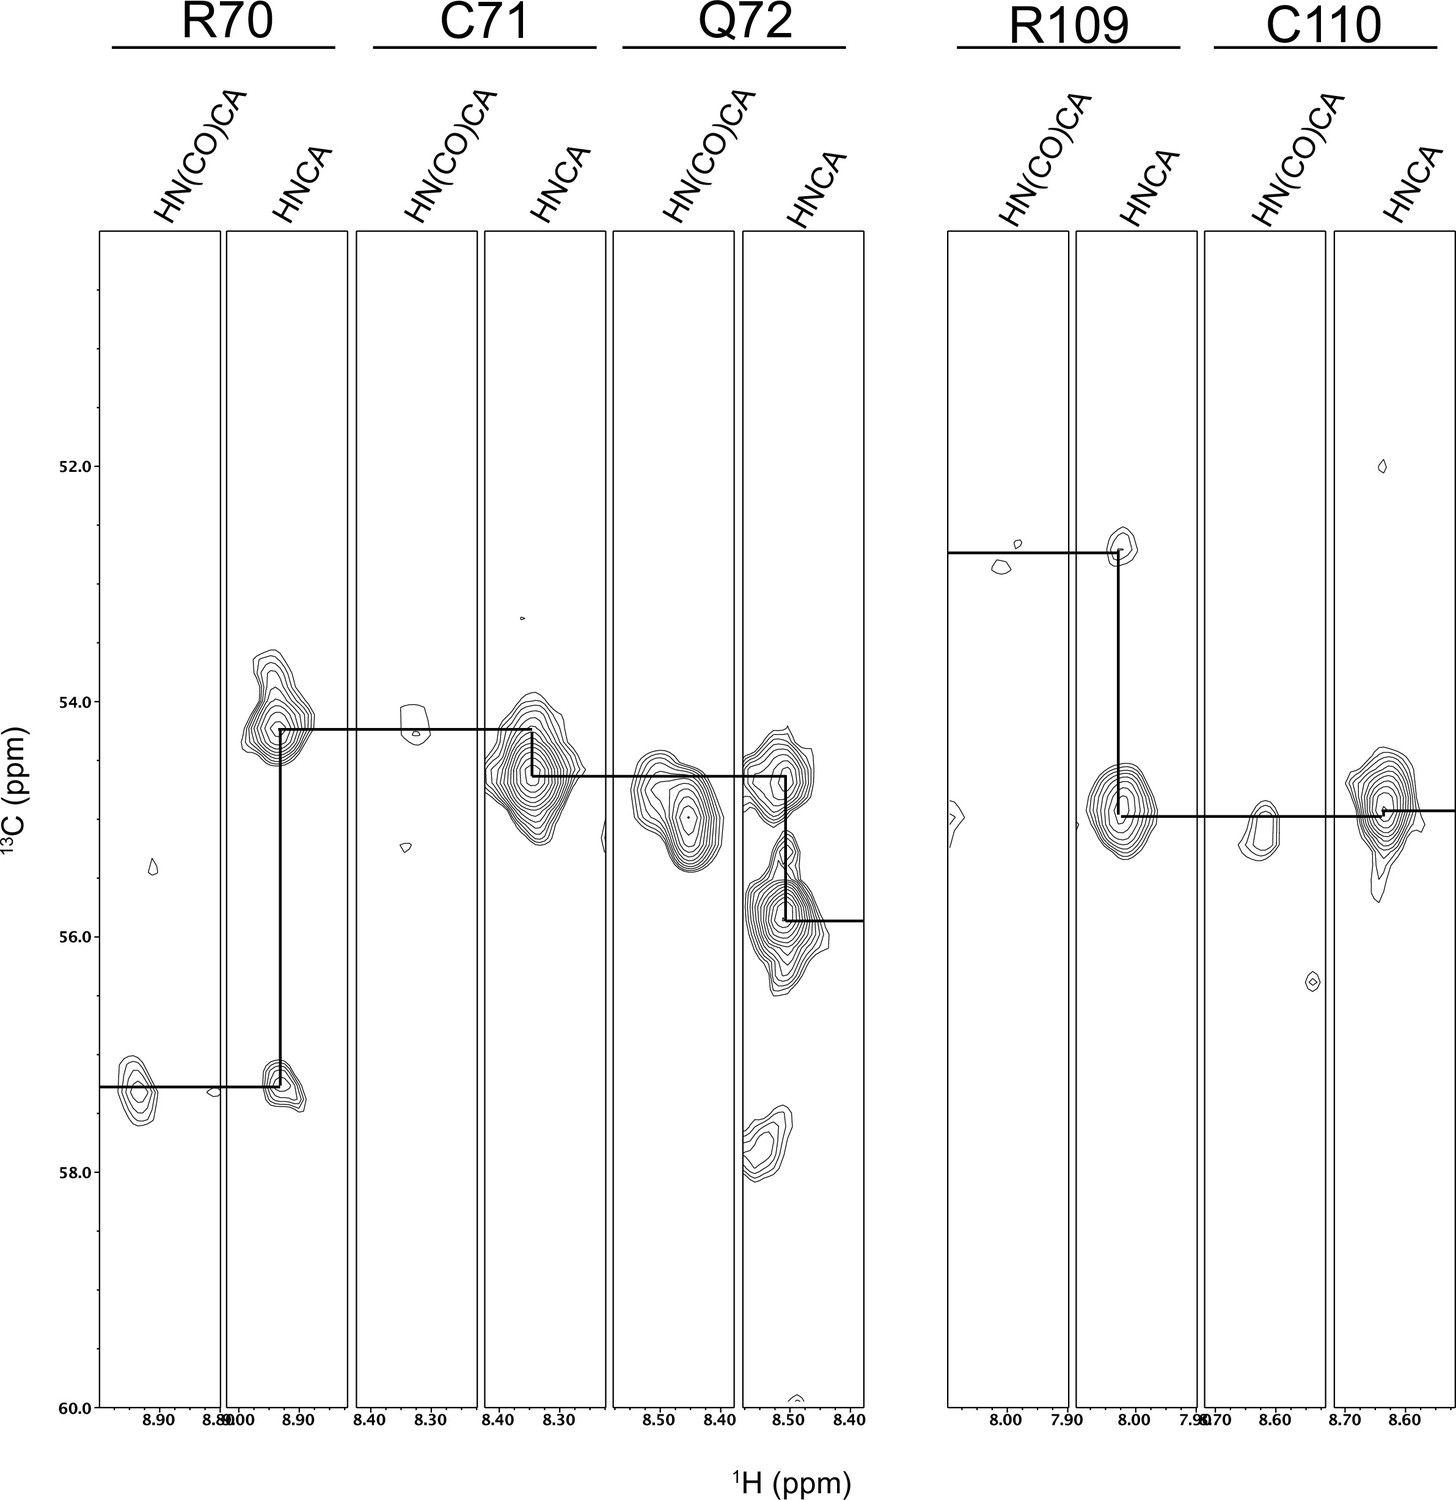
Strip plots from triple resonance HNCA and HN(CO)CA experiments showing the assignments of the C71 and C110 resonances.
The resonances for H111 were not identified. Residue connectivities are shown with a black line.
Figure 5 with 1 supplement
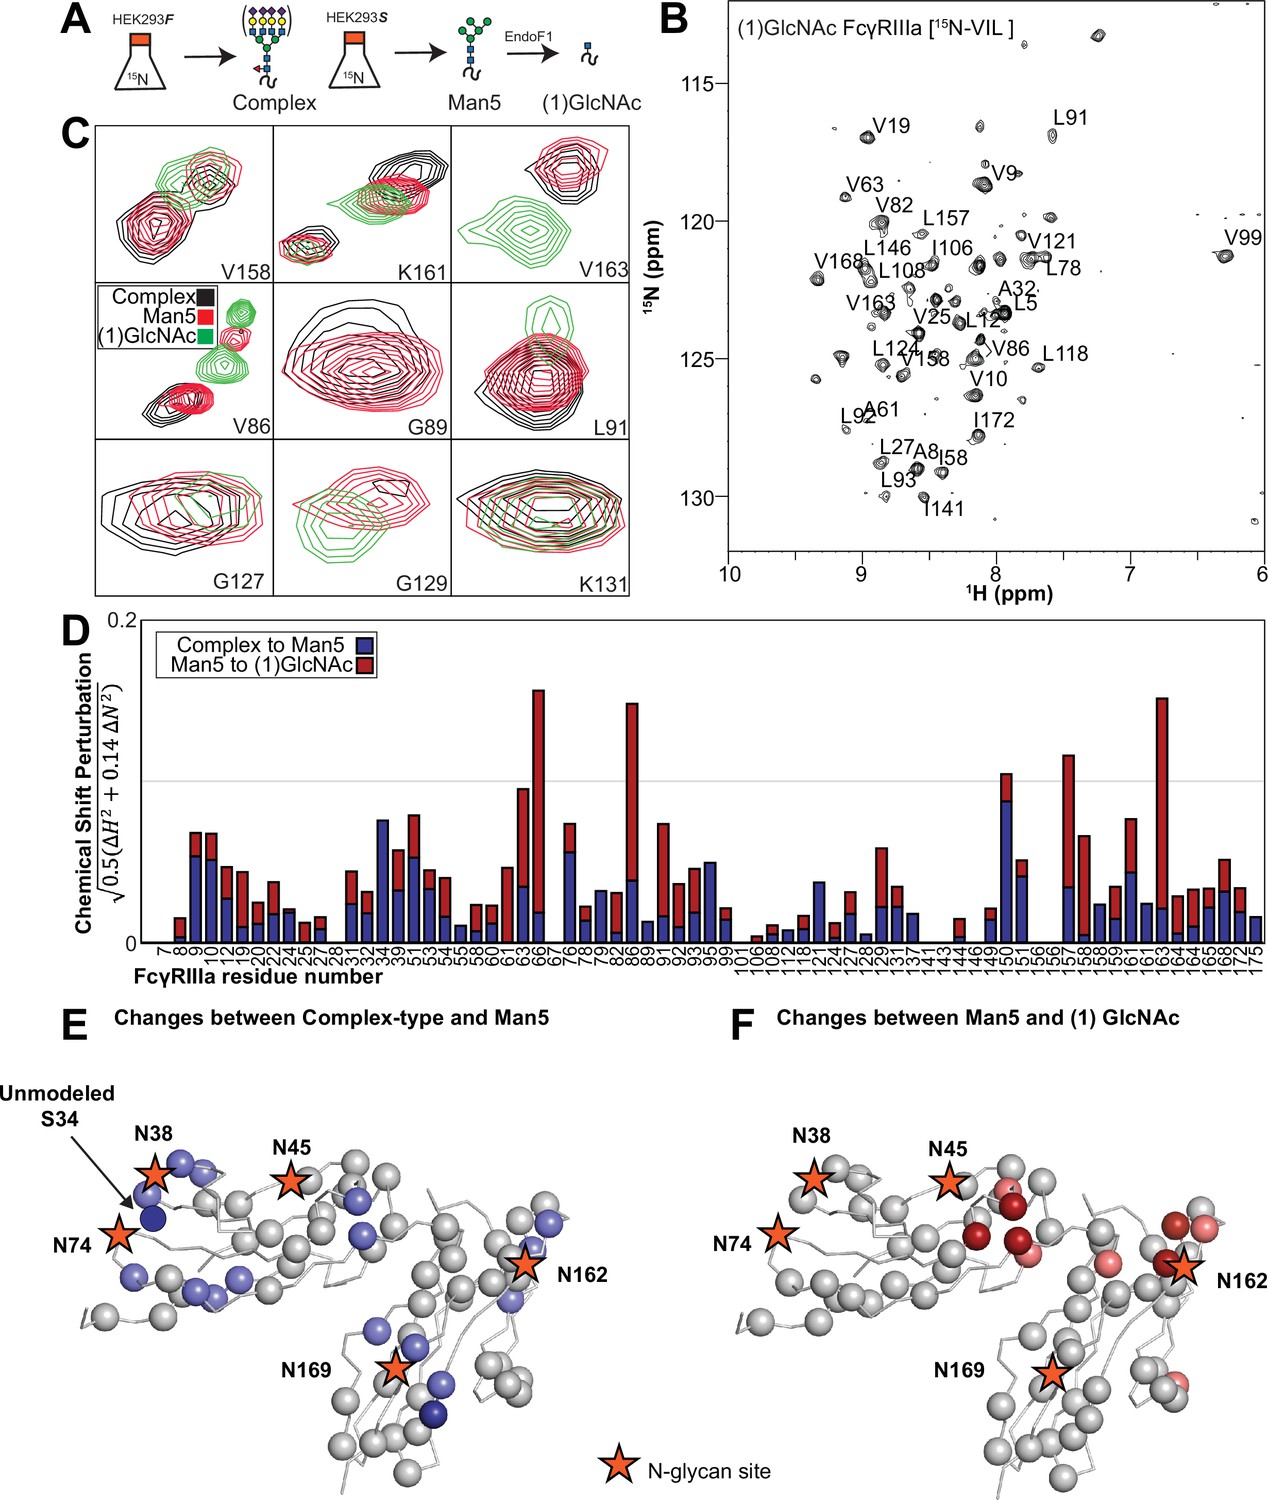
Glycan composition changes the FcγRIIIa backbone conformation.
(A) Diagram of the protein expression, labeling, and glycan remodeling procedures. (B) Example HSQC-TROSY spectrum of FcγRIIIa with the truncated (1)GlcNAc N-glycan labeled with 15N-(Val,Leu,Ile) during expression. (C) Isolated peaks show differences in position between different glycoforms. (D) The observed Chemical Shift Perturbation (CSP) between complex-type and Man5 N-glycans (blue) or Man5 and (1)GlcNAc N-glycans (red) is shown by residue number. (D, E) CSPs > 0.03 (light) and >0.06 (dark) mapped to a ribbon model of FcγRIIIa. Truncation to (1)GlcNAc causes CSPs near the Fc-binding interface that is proximal to N162.
Figure 5—figure supplement 1
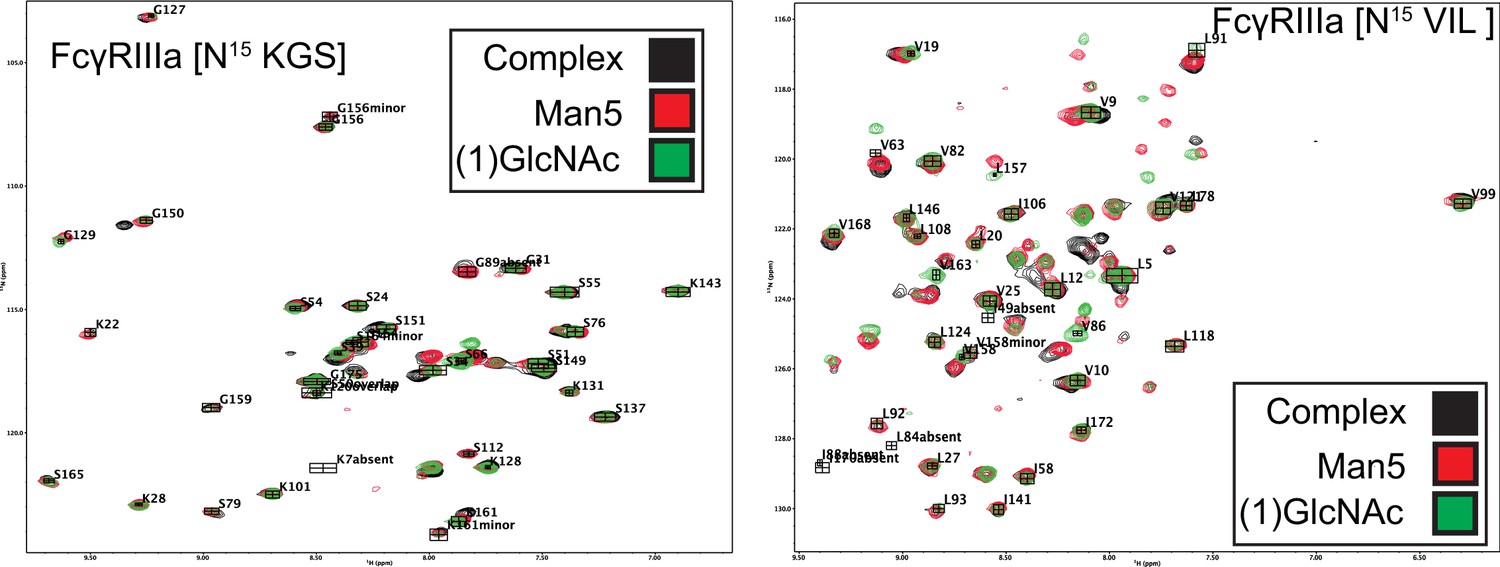
Overlayed HSQC-TROSY spectra of 15N-labeled FcγRIIIa with complex-type (black) 5-mannose (red) or (1)GlcNAc (green) N-glycans.
Figure 6 with 1 supplement
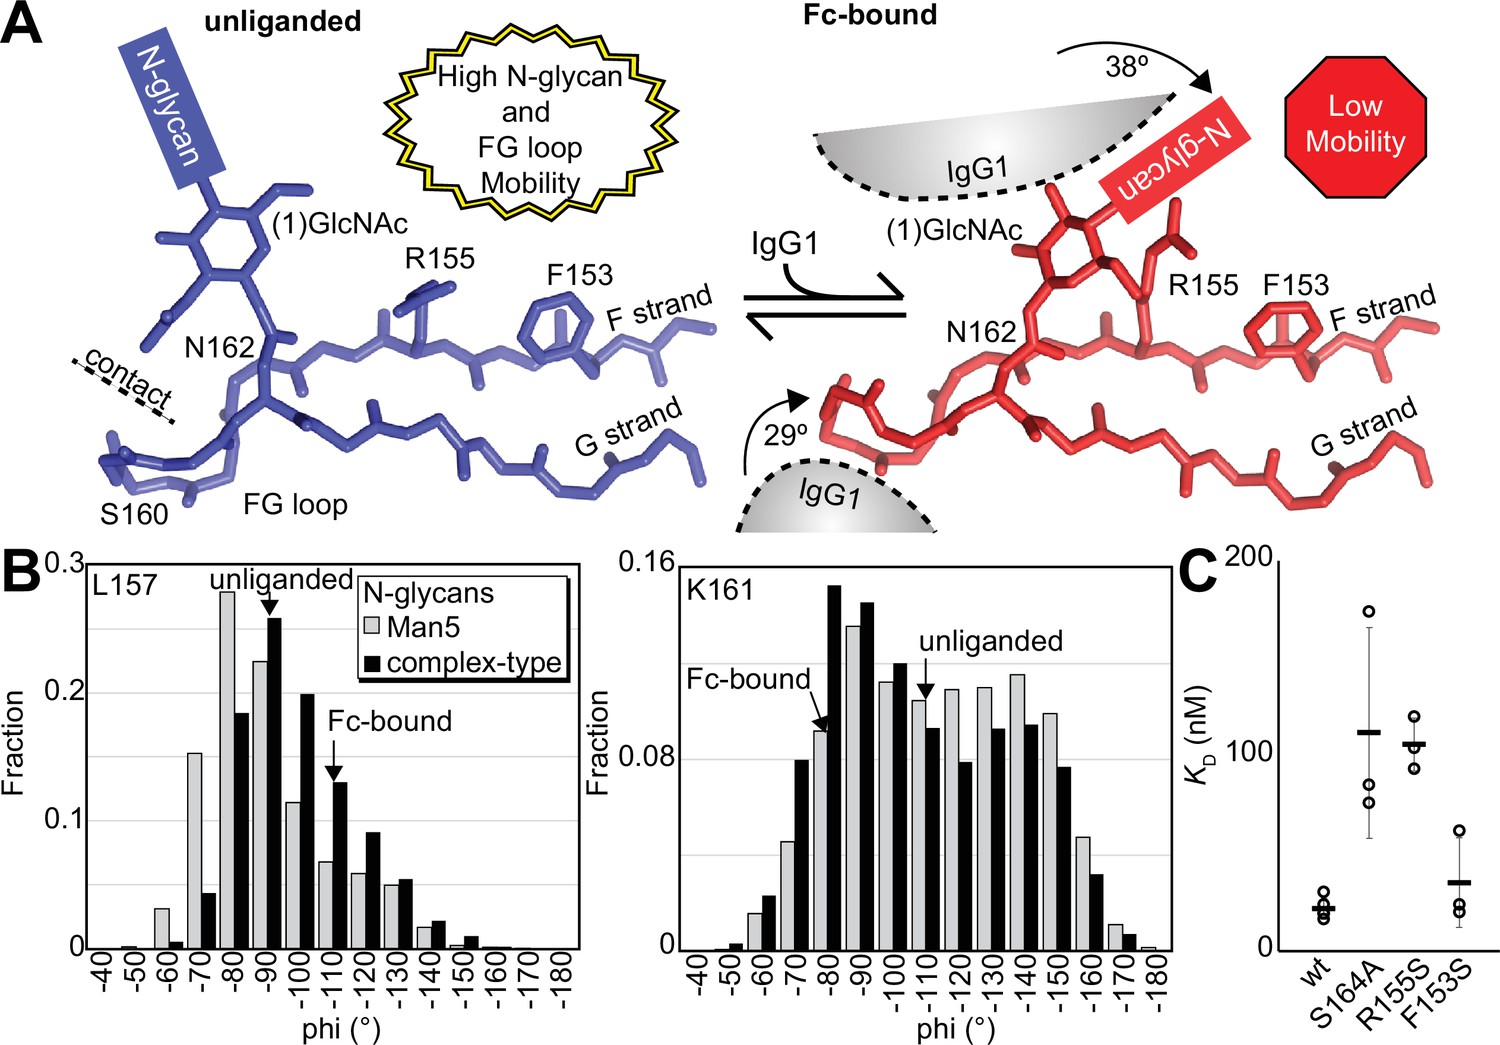
Binding antibody induces an FcγRIIIa conformational change.
(A) Two conformations of the FG loop previously captured by X-ray crystallography (pbd 7seg, 5vu0). Both the FG loop and the N-glycan become restricted to accommodate IgG1 Fc. The conformational entropy of a complex-type N-glycan, with more rotatable bonds, is greater as is the loss of entropy upon binding compared to smaller N-glycans. (B) Evidence for conformational sampling in the unliganded FcγRIIIa revealed by all-atom molecular dynamics simulations. Each data set shows the average of two independent 1 µs trajectories, with separate experiments for FcγRIIIa with Man5 N-glycans or complex-type N-glycans. (C) Binding affinity of FcγRIIIa variants following EndoF1 digestion, displaying a truncated (1)GlcNAc N-glycan. Scale bars represent errors for n=3 measurements.
Figure 6—figure supplement 1
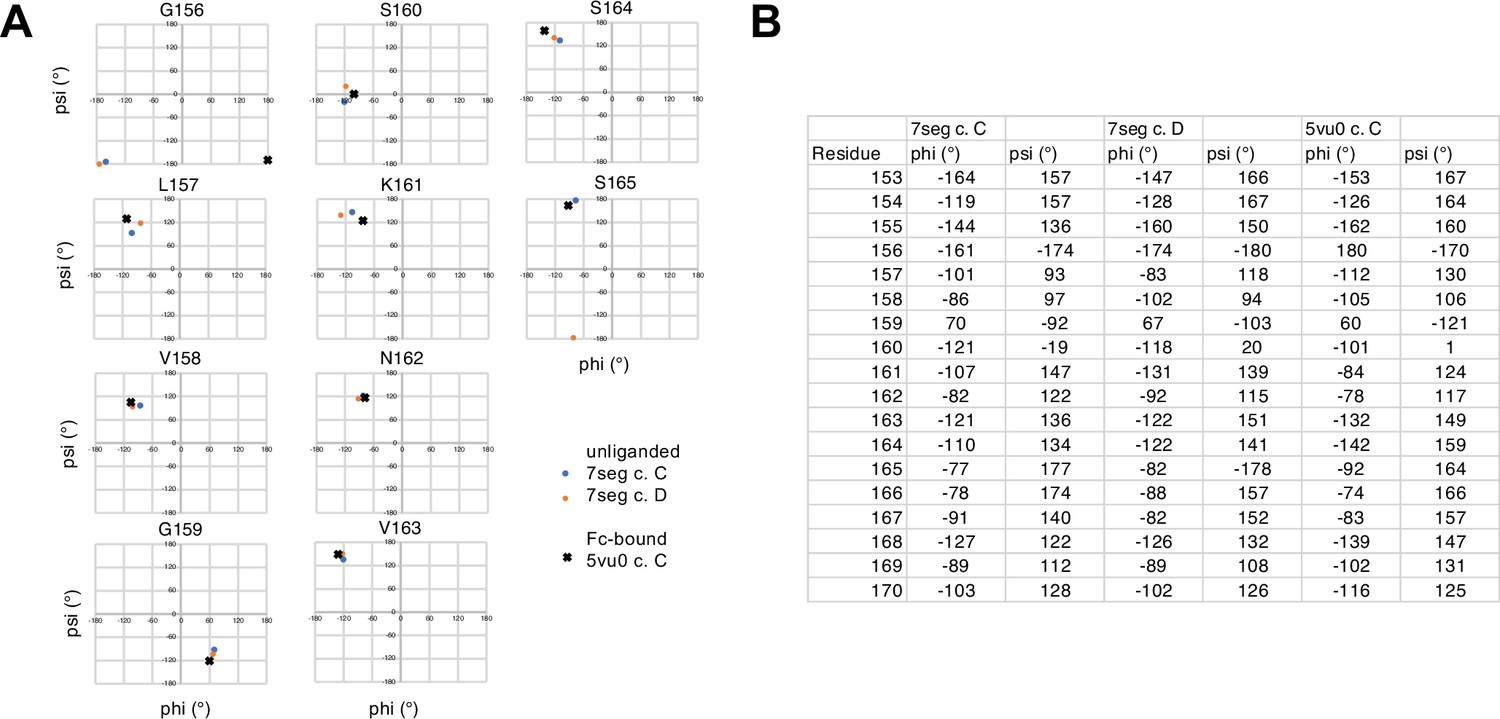
Backbone dihedral angles from two FcγRIIIa X-ray crystallography structures.
(A) Phi-Psi angle plots for select residues in the FG loop. (B) Table of Phi-Psi angles for select FcγRIIIa residues. 7seg and 5vu0 are PDB IDs for the two datasets analyzed.
Additional files
-
Supplementary file 1
Binding affinity measurements for each FcγRIIIa variant.
- https://cdn.elifesciences.org/articles/100083/elife-100083-supp1-v1.xlsx
-
Supplementary file 2
Raw ADCC data from the lentivirus transduced YTS cells.
V158 = wt; aRTX = afucosylated rituximab; K = kifunensine treatment.
- https://cdn.elifesciences.org/articles/100083/elife-100083-supp2-v1.xlsx
-
MDAR checklist
- https://cdn.elifesciences.org/articles/100083/elife-100083-mdarchecklist1-v1.docx
Download links
A two-part list of links to download the article, or parts of the article, in various formats.
Downloads (link to download the article as PDF)
Open citations (links to open the citations from this article in various online reference manager services)
Cite this article (links to download the citations from this article in formats compatible with various reference manager tools)
One N-glycan regulates natural killer cell antibody-dependent cell-mediated cytotoxicity and modulates Fc γ receptor IIIa/CD16a structure
eLife 13:RP100083.
https://doi.org/10.7554/eLife.100083.3


