The effect of transcutaneous auricular vagus nerve stimulation on cardiovascular function in subarachnoid hemorrhage patients: A randomized trial
- Department of Neurosurgery, Washington University School of Medicine, United States
- Department of Biomedical Engineering, Washington University in St. Louis, United States
- Department of Neuroscience, Washington University in St. Louis, United States
- Department of Neurology, Washington University in St. Louis, United States
Figures
Figure 1
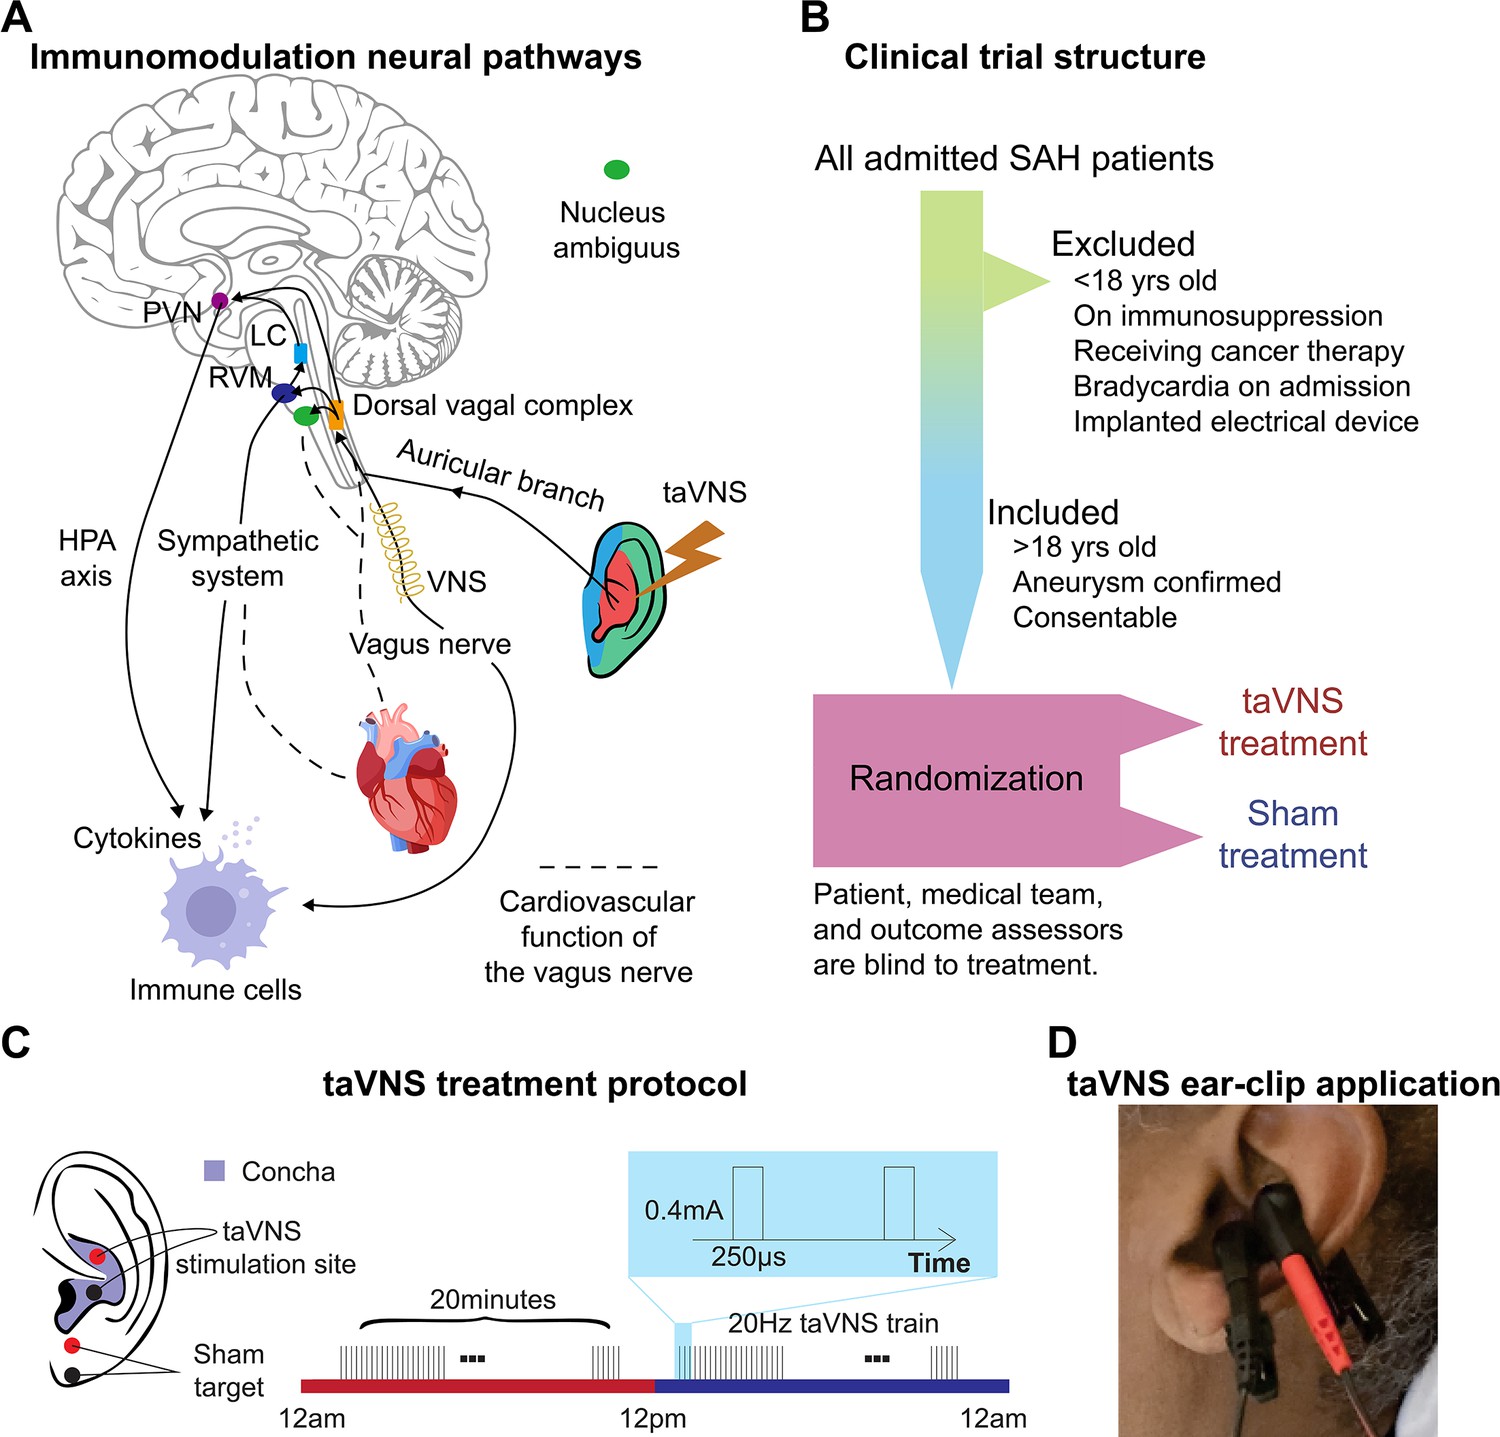
Study rationale and clinical trial design.
(A) Immunomodulation neural pathways associated with vagus nerve stimulation include cholinergic anti-inflammatory pathway, sympathetic nervous system, and hypothalamic–pituitary–adrenal (HPA) axis. Immunogenic stimuli activate vagal afferents terminating primarily in the dorsal vagal complex. Ascending projections from the dorsal vagal complex reach the paraventricular nucleus (PVN) and rostral ventromedial medulla (RVM), activating the HPA axis and sympathetic system, respectively, to regulate the immune response. Transcutaneous auricular vagus nerve stimulation (taVNS) can affect cardiovascular function through the sympathetic system or efferent vagus nerve. (B, C) Clinical trial structure and treatment protocol. Patients in the taVNS group received electrical stimulation (0.4 mA, 250 µs pulse width, 20 Hz) for 20 min twice daily. Sham group patients wore the ear clip on the earlobe for the same duration. (D) Ear clip application for taVNS treatment.
Figure 2 with 2 supplements
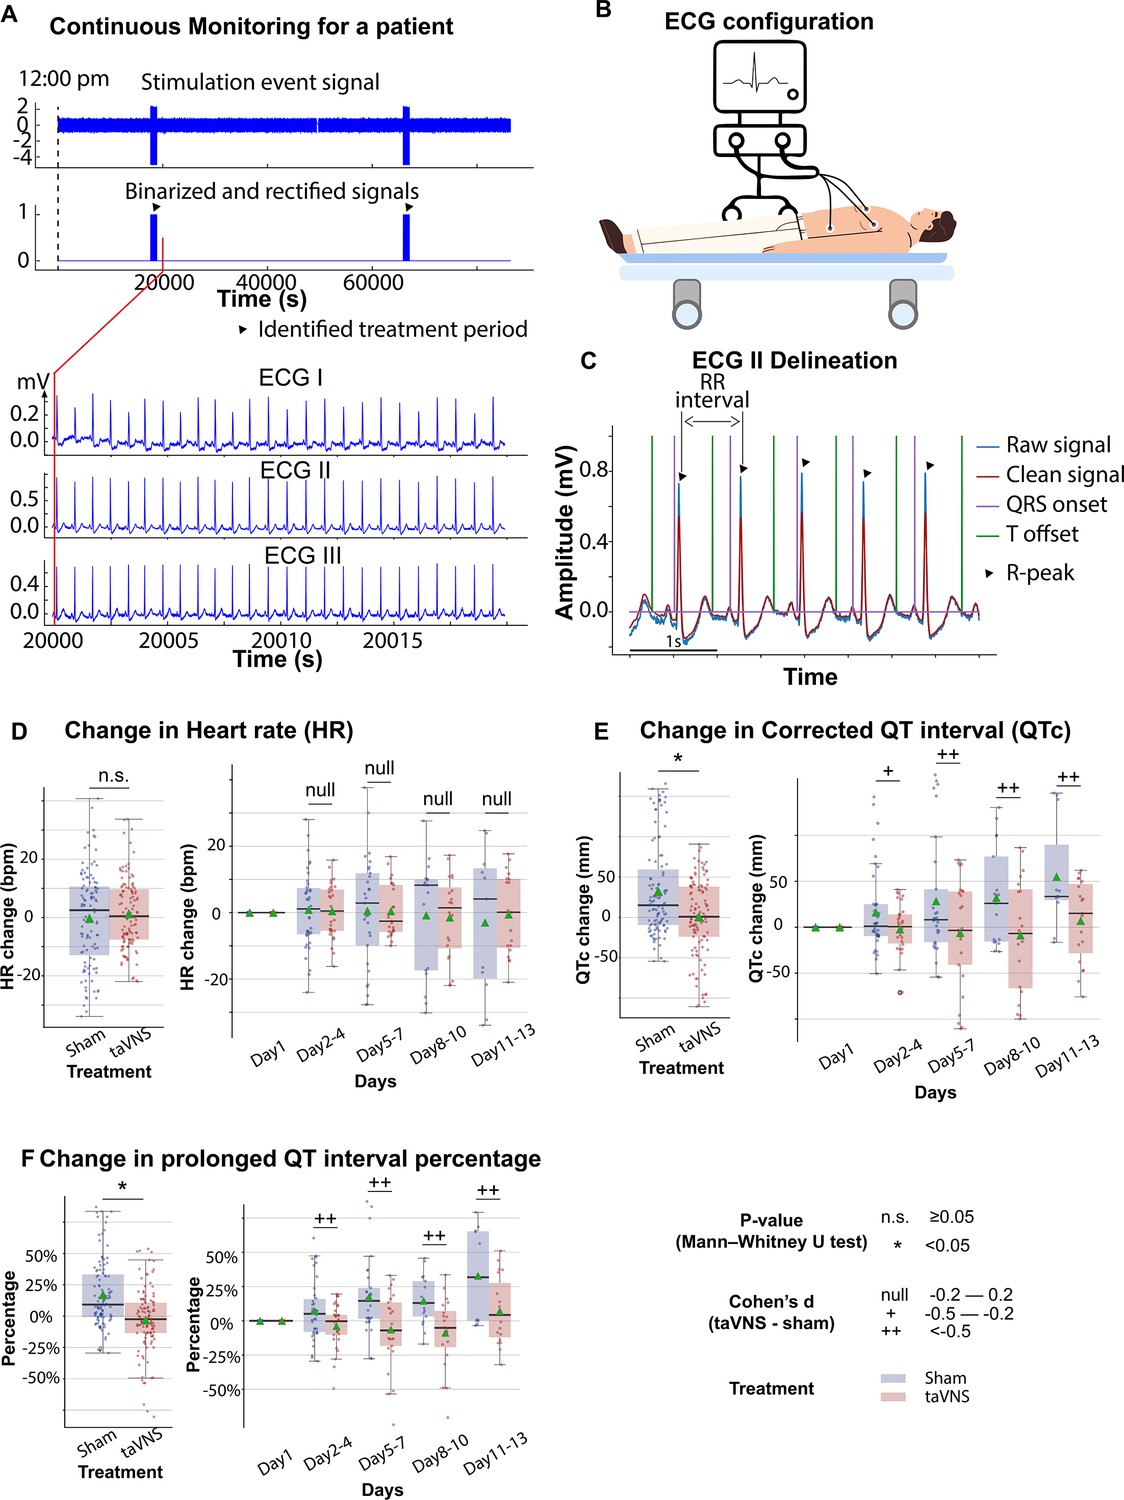
The effects of transcutaneous auricular vagus nerve stimulation (taVNS) on cardiac function.
(A) Signals encoding treatment period and electrocardiogram (ECG) signals in a representative patient. (B) 3-lead ECG configuration in the intensive care unit. (C) P wave, T wave, and QRS complex are delineated from clean ECG II signals. (D, E) Heart rate and corrected QT interval changes from the first hospitalized day in the two treatment groups. (F) Changes in the percentage of prolonged QT from the first hospitalized day in the two treatment groups.
Figure 2—figure supplement 1
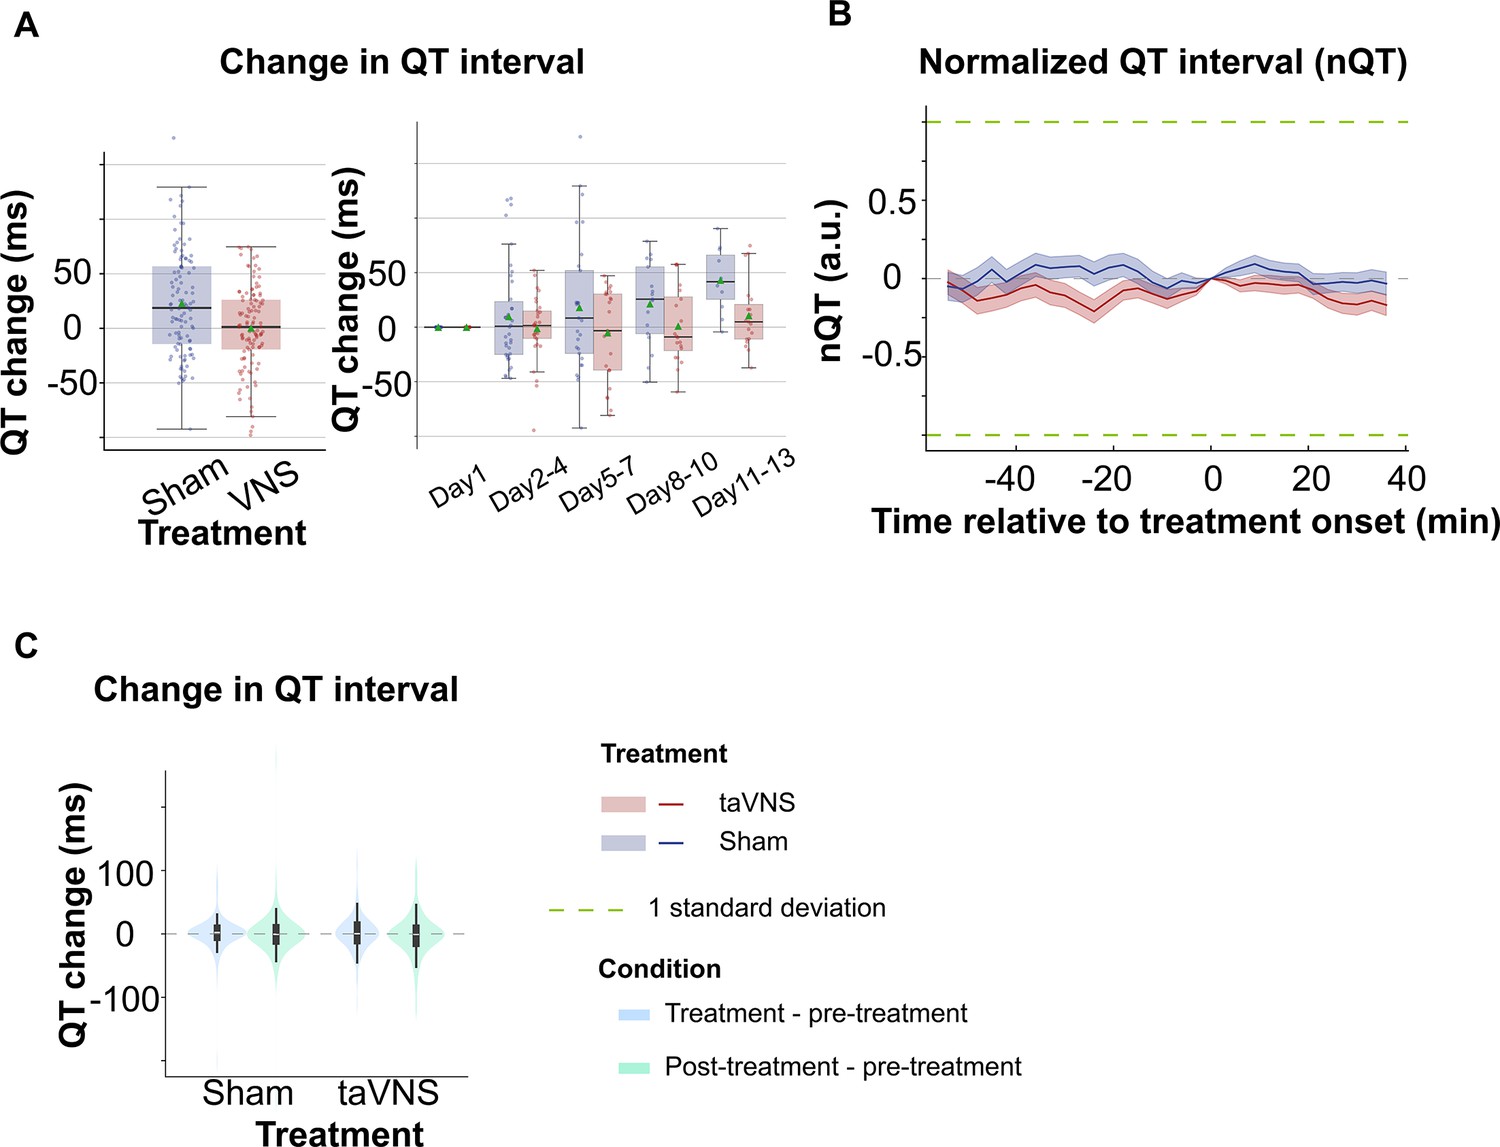
The effect of repetitive and acute transcutaneous auricular vagus nerve stimulation (taVNS) on uncorrected QT interval.
(A) QT interval changes from the first hospitalized day in the two treatment groups. (B) Normalized QT interval aligned at the treatment onset over time for the two treatment groups. The QT interval is normalized based on the mean and standard error of heart rate for each day. (C) The difference in QT intervals between the treatment period, post-treatment period, and pre-treatment period for the two treatment groups.
Figure 2—figure supplement 2
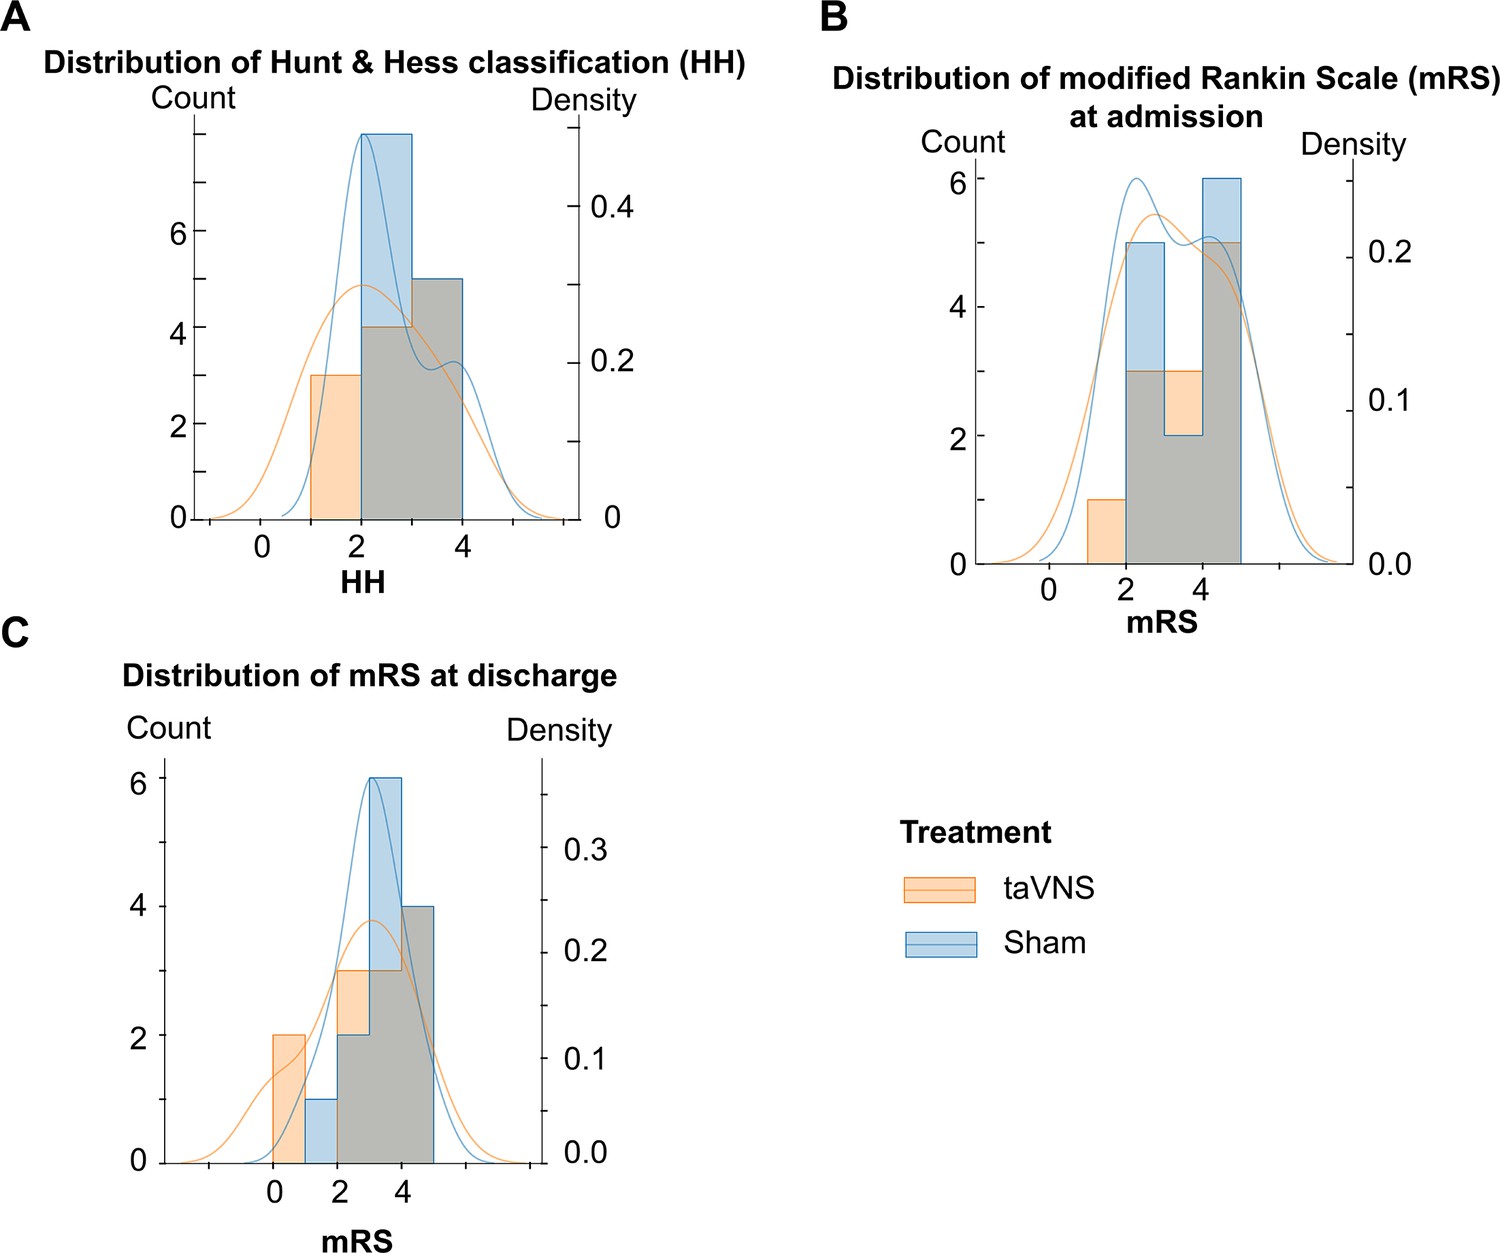
The distribution of Hunt & Hess classification and modified Rankin Scale for transcutaneous auricular vagus nerve stimulation (taVNS) and Sham groups.
(A) Hunt & Hess classification for both groups. (B–C) mRS at admission (B) and discharge (C) for patients in both groups. In each panel, the height of each histogram bar indicates the count (left y-axis). The overlaid curve represents the kernel density (right y-axis).
Figure 3 with 4 supplements
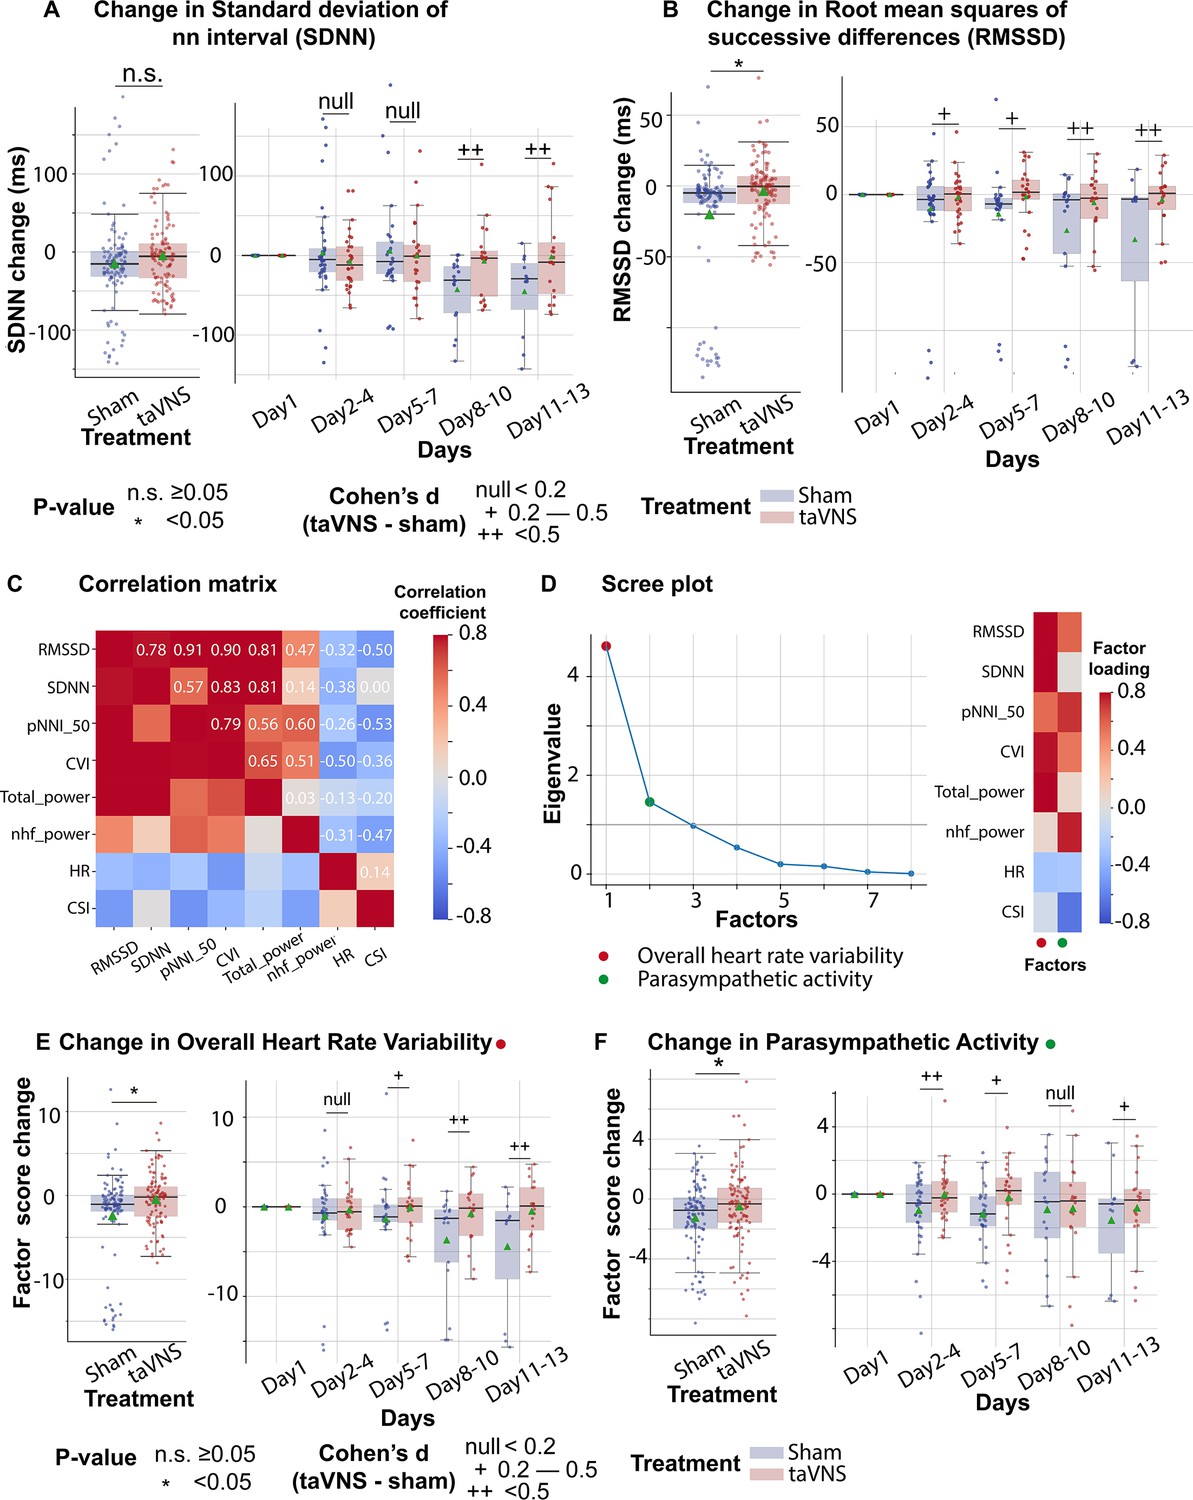
The effects of transcutaneous auricular vagus nerve stimulation (taVNS) on overall heart rate variability and parasympathetic activity.
(A, B) Changes in standard deviation of NN interval (SDNN) changes and root mean squares of successive differences over time for the two treatment groups. The color represents the treatment group. Green triangles represent the mean. (C) Correlation between standard electrocardiogram (ECG) features underlying autonomic activities. (D) Factor analysis showed that there are two factors underlying the standard ECG features. The first factor is referred to as overall heart rate variability. The second factor is referred to as parasympathetic activity. (E, F) The effect of taVNS on the two factors. pNNI_50: percentage of number of successive NN intervals that differ by more than 50 ms. CVI: cardiac vagal index. Total power: total power below 0.4 Hz of normal RR interval. nhf_power: relative power of the high-frequency band (0.15–0.4 Hz). CSI: cardiac sympathetic index.
Figure 3—figure supplement 1
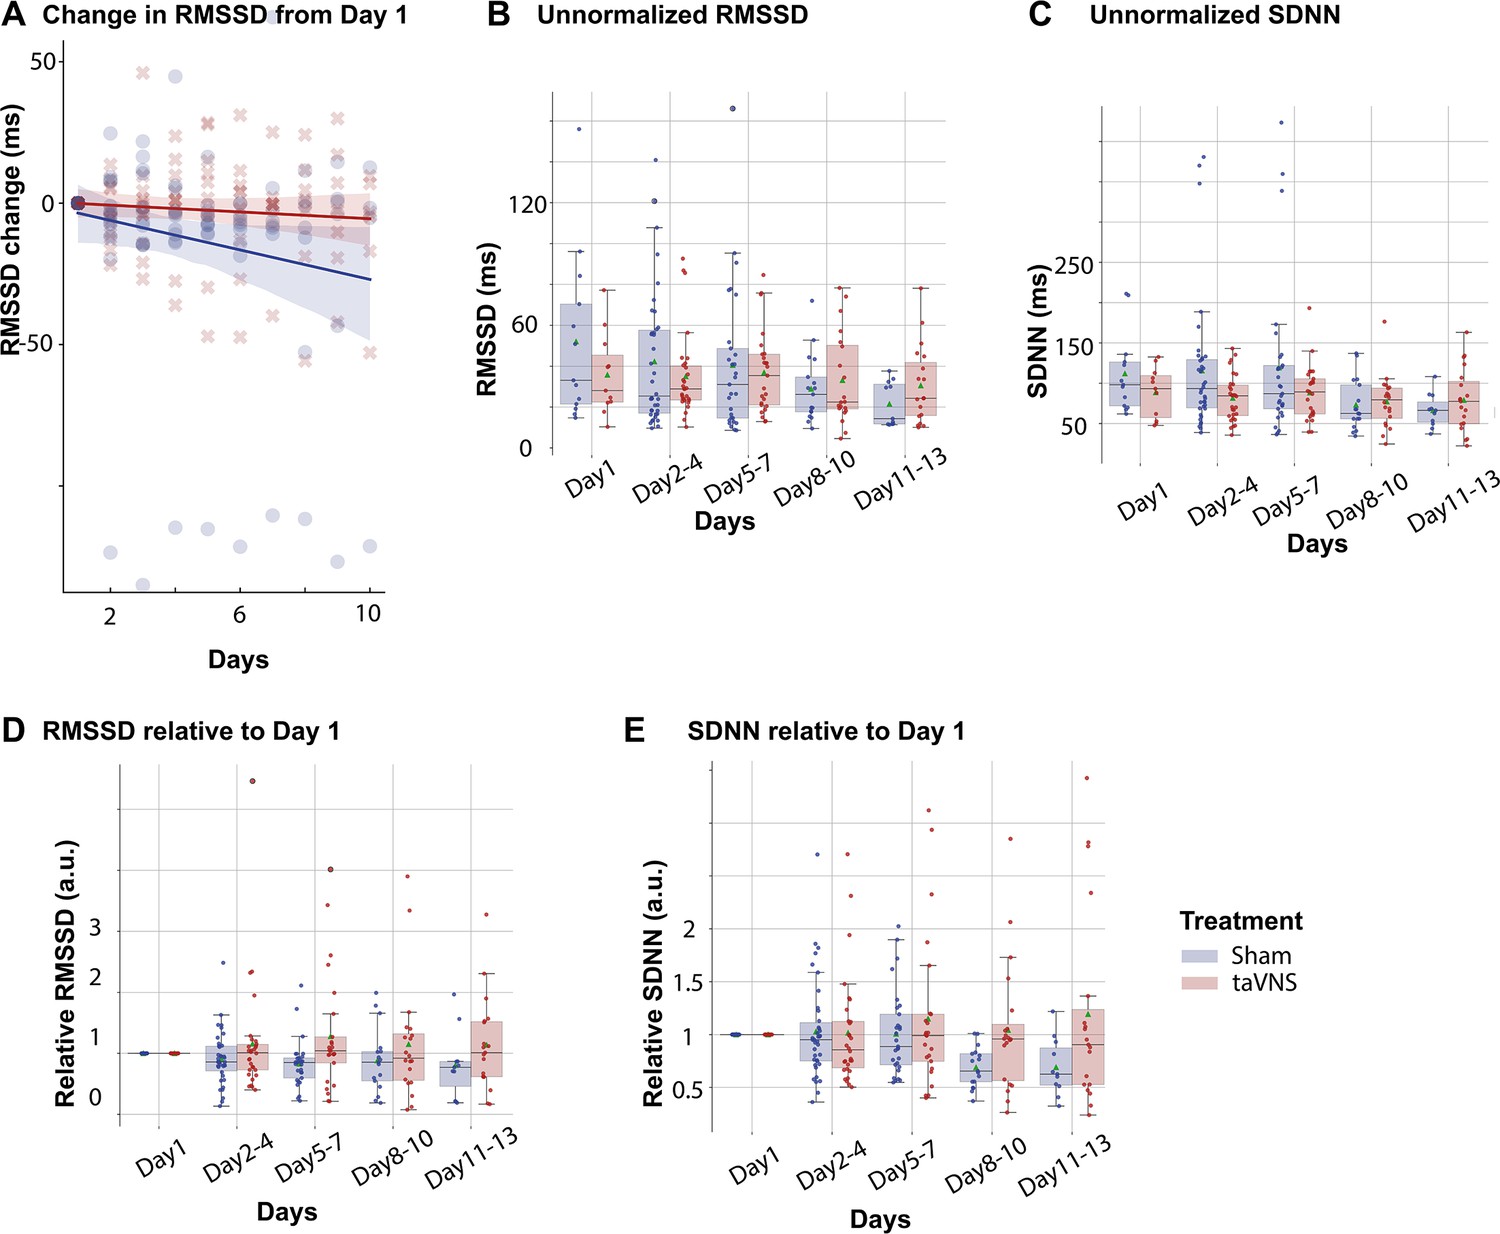
Heart rate variability in transcutaneous auricular vagus nerve stimulation (taVNS) and Sham treatment groups.
(A) In the linear regression model (RMSSD change ~ Day * Treatment), the coefficient for interaction effect is 2.01 (p = 0.21), the coefficient for Day is −2.61 (p = 0.02), and the coefficient for Treatment is 1.38 (p = 0.88). RMSSD: root mean square of successive differences of normal RR intervals. SDNN: standard deviation of normal RR intervals. (B) Unnormalized RMSSD over time for the two treatment groups. (C) Unnormalized SDNN over time for the two treatment groups. (D) Relative RMSSD over time for the two treatment groups. (E) Relative SDNN over time for the two treatment groups.
Figure 3—figure supplement 2
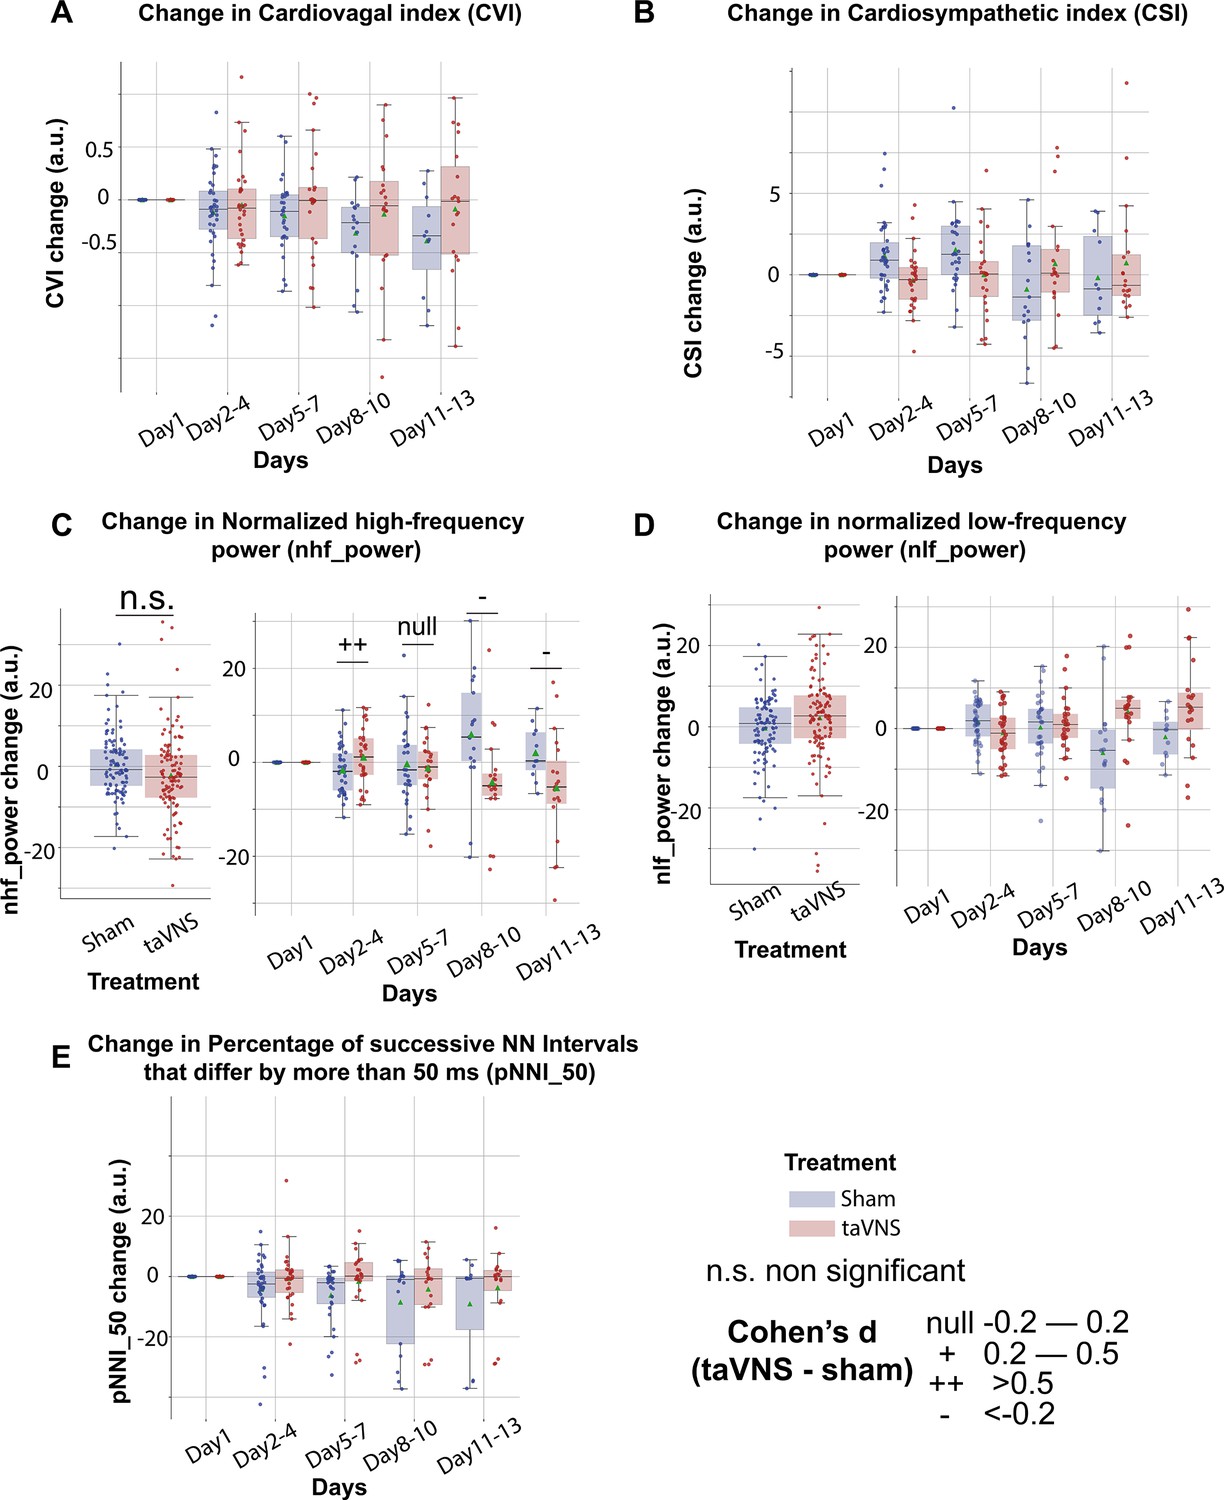
Time- and frequency-domain cardiac measures in transcutaneous auricular vagus nerve stimulation (taVNS) and Sham treatment groups.
(A-E) show the changes of heart rate variability metrics following SAH. These standard heart rate variability metrics were used to perform factor analysis.
Figure 3—figure supplement 3
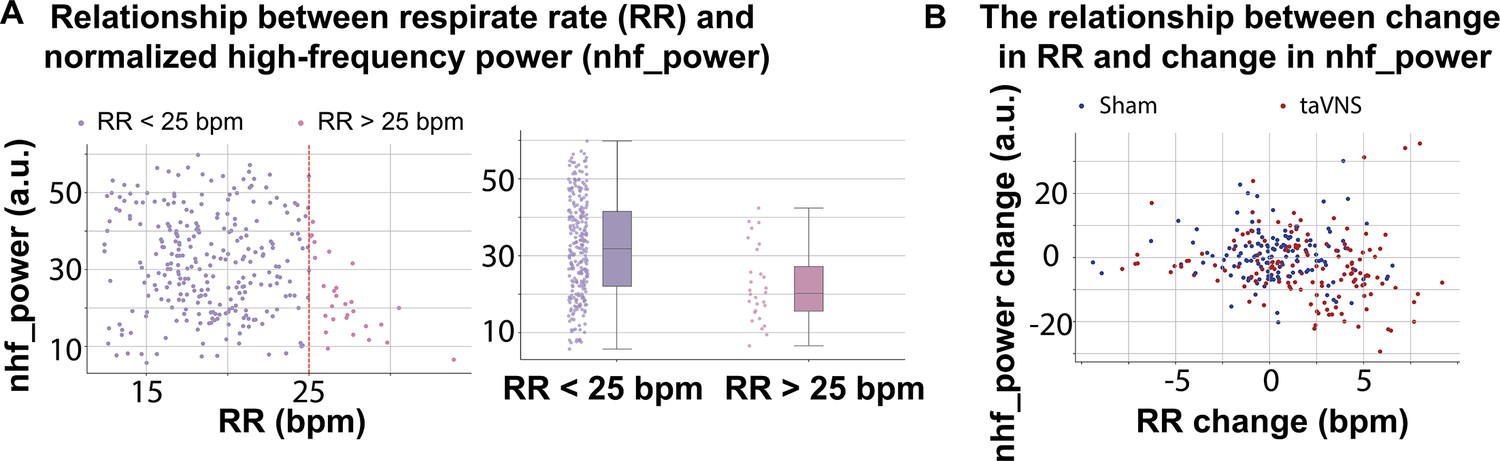
The normalized high-frequency power may not fully represent parasympathetic activity when the respiration rate exceeds 25 bpm.
(A) The relationship between frequency-domain HRV measures and respiration rate. (B) Increase in RR in the transcutaneous auricular vagus nerve stimulation (taVNS) treatment group was associated with reduction in normalized high-frequency power.
Figure 3—figure supplement 4
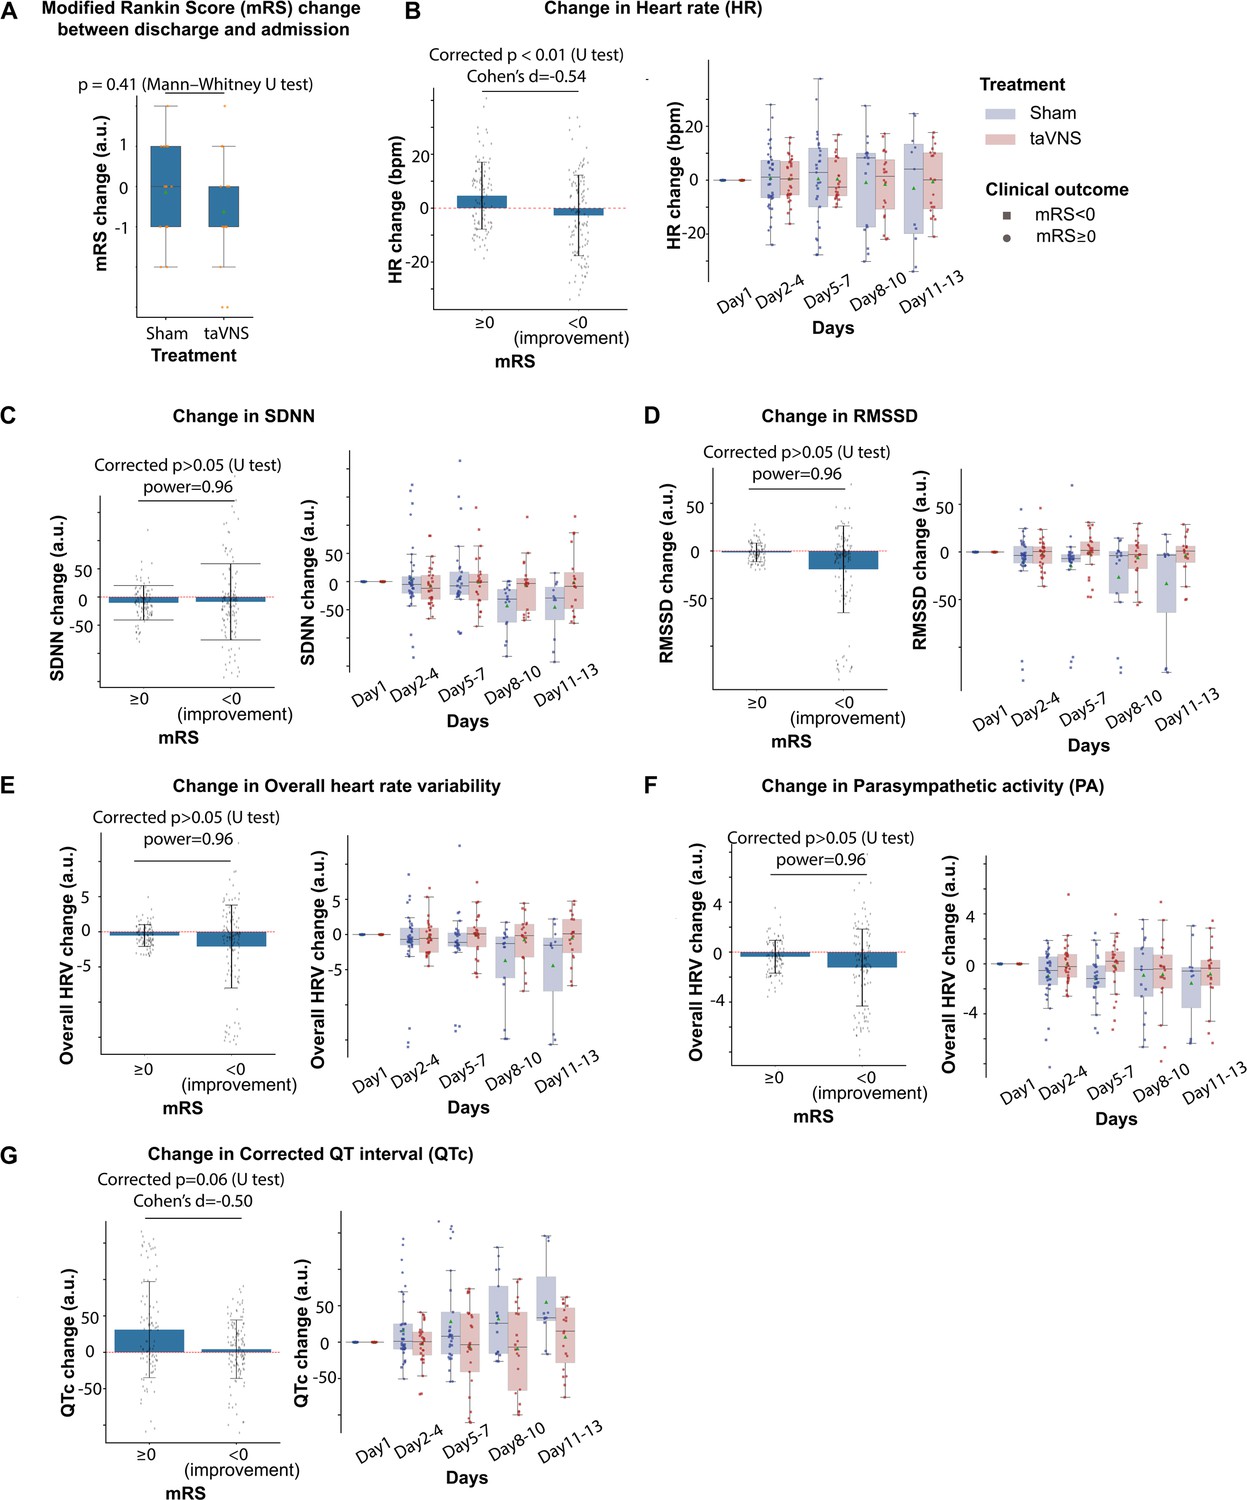
The impact of clinical outcome on heart rate variability.
(A) The change in modified Rankin Score (mRS) was similar between the transcutaneous auricular vagus nerve stimulation (taVNS) and Sham treatment groups. (B) Change in heart rate during treatment for both treatment groups, as compared to first hospitalized day, was lower in patients with improved mRS upon discharge (i.e., mRS change <0). (C–G) The relationship between improved mRS and changes in cardiovascular metrics. N(mRS < 0) = 122, N(mRS > 0) = 98.
Figure 4 with 1 supplement
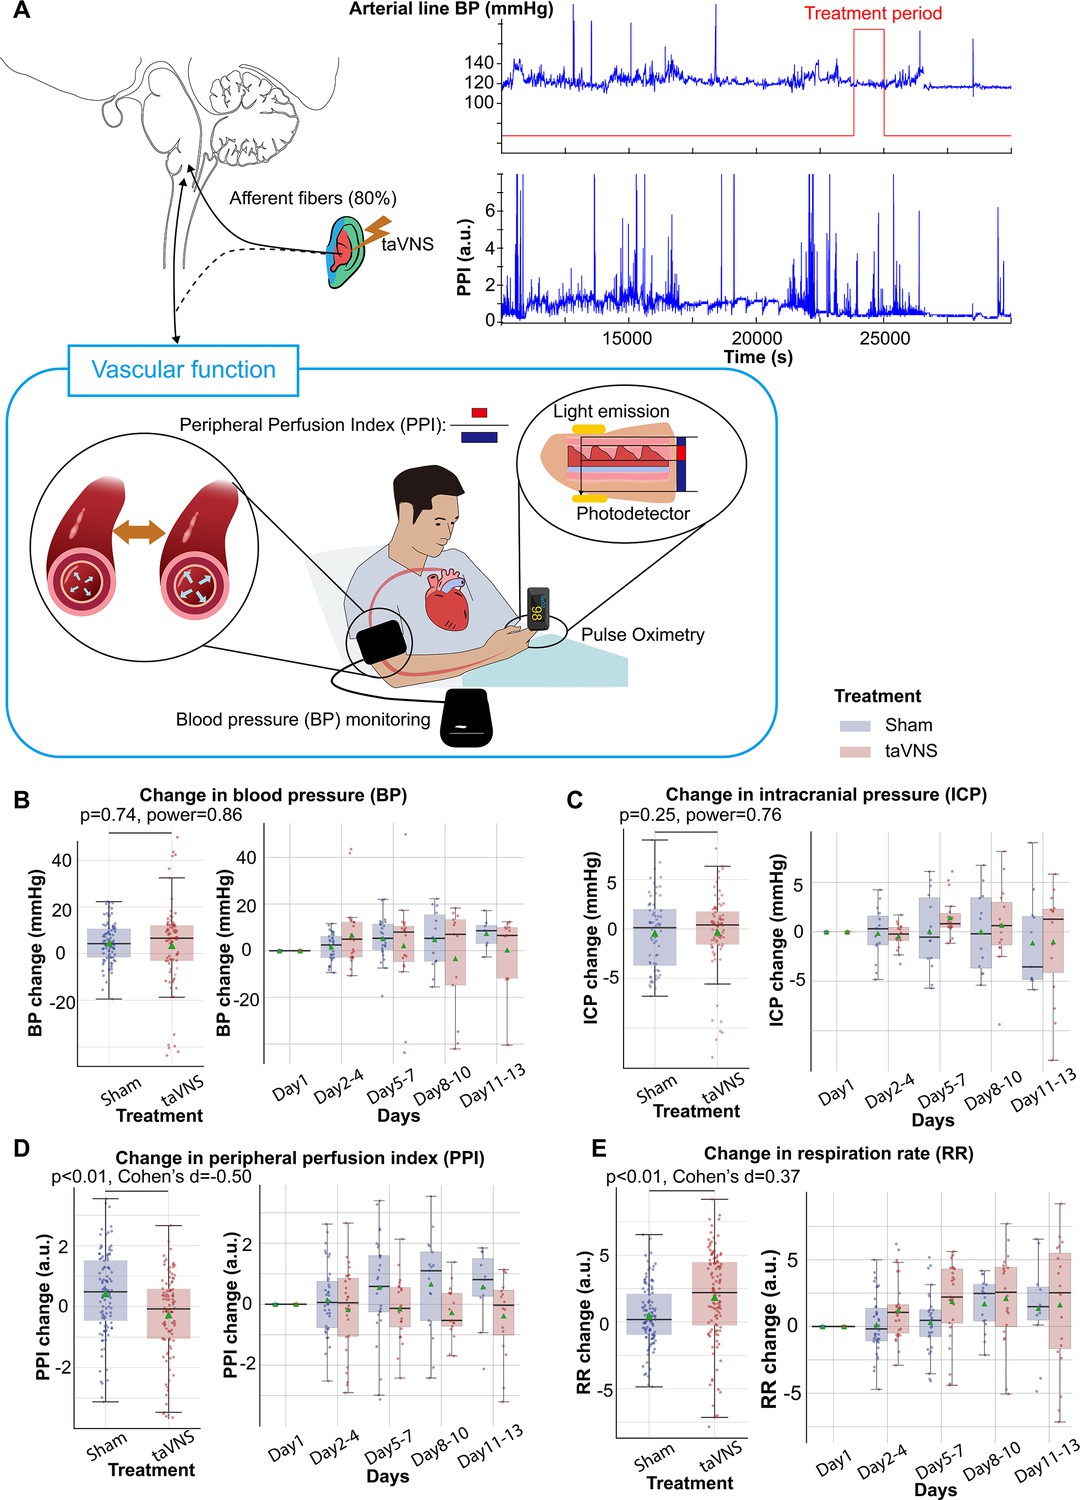
Effects of repetitive transcutaneous auricular vagus nerve stimulation (taVNS) on vascular function.
(A) Representative vital signs and their physiology. Arterial line blood pressure (see Figure 4—figure supplement 1), intracranial pressure (ICP), and mean blood pressure measured regularly by nurses (BP) were recorded. Blood pressure is an index of vasodilation. Peripheral perfusion index (PPI) is the ratio between the pulsatile and the non-pulsatile blood flow, reflecting the cardiac output. (B, C) Mean BP and ICP changes from the first hospitalization day did not differ significantly between the treatment groups. (D, E) PPI change from the first hospitalized day was lower in the taVNS treatment group, while RR change was higher.
Figure 4—figure supplement 1
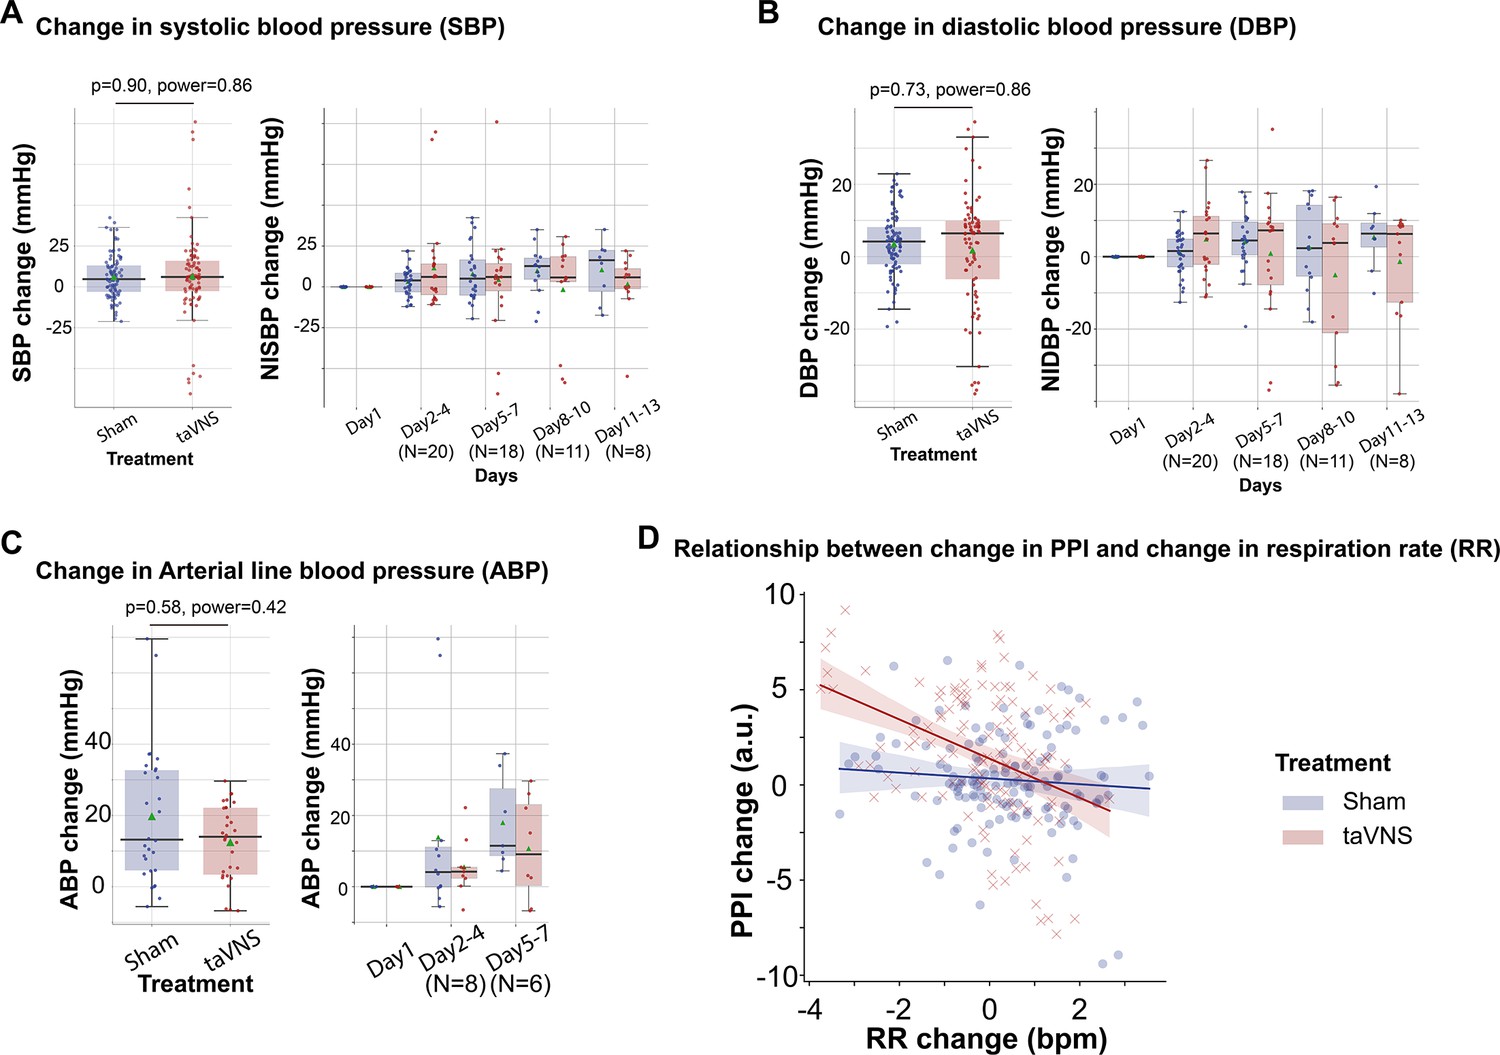
The effect of transcutaneous auricular vagus nerve stimulation (taVNS) on arterial line blood pressure monitoring and noninvasive blood pressure monitoring.
(A-C) Changes in systolic blood pressure (A), diastolic blood pressure (B), and arterial line blood pressure (C) from the first hospitalized day for the two treatment groups. (D) The relationship between changes in peripheral perfusion index (PPI) and changes in respiration rate (RR) for the two treatment groups. Mann–Whitney U tests were used to compare changes in blood pressure between treatment groups.
Figure 5 with 3 supplements
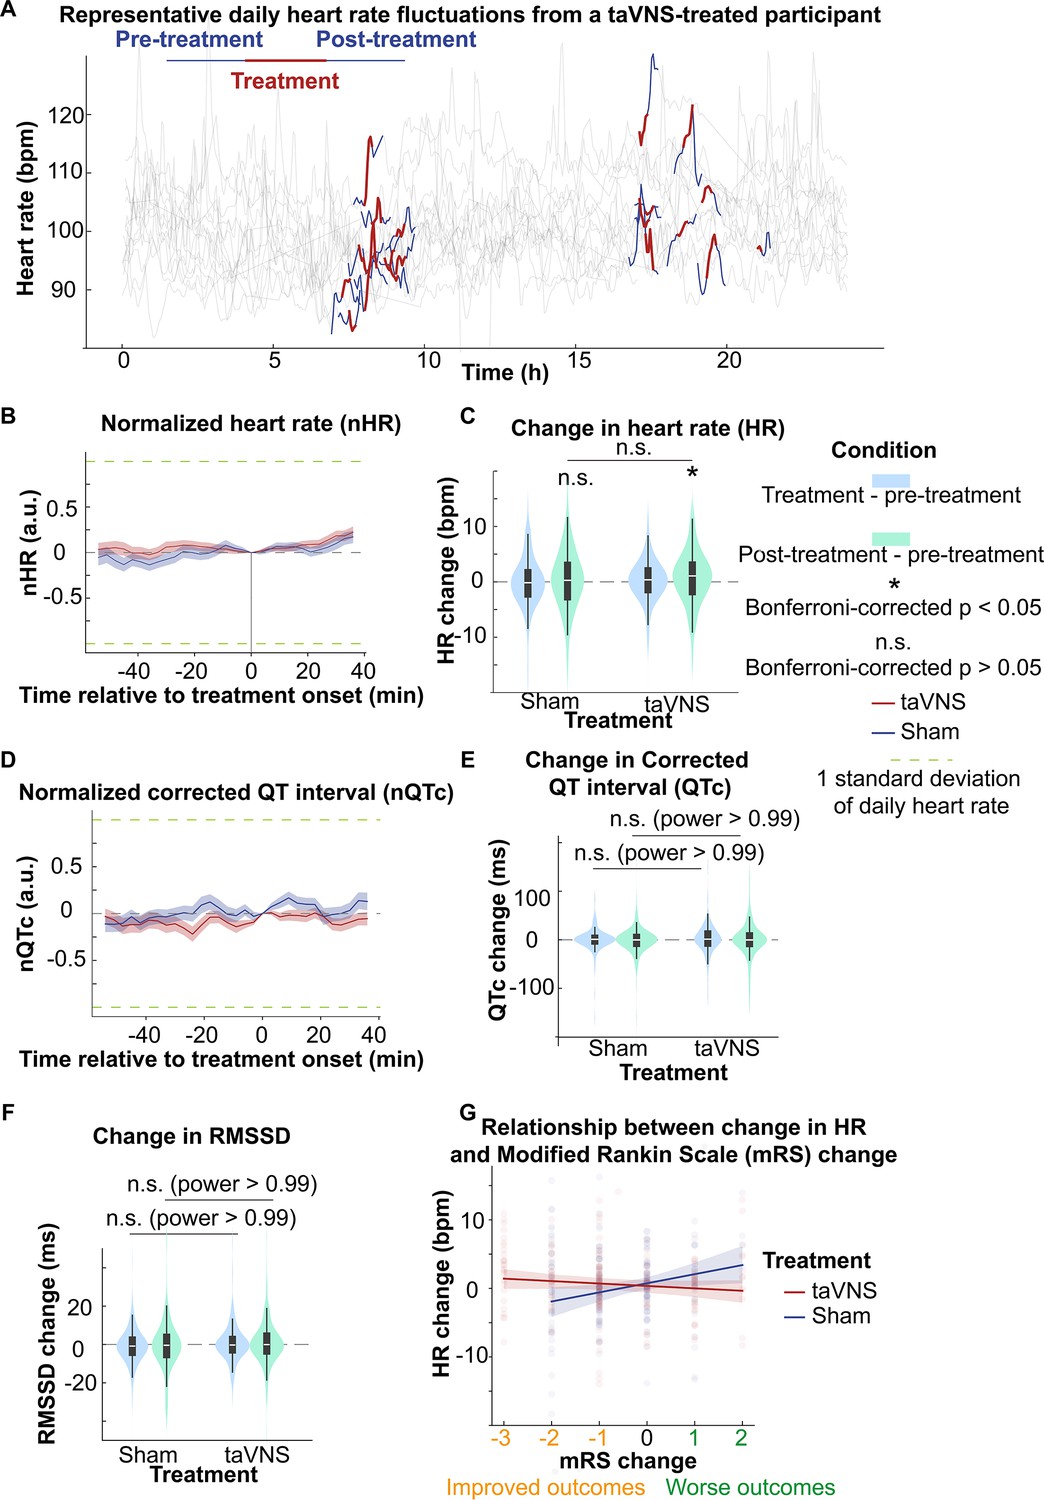
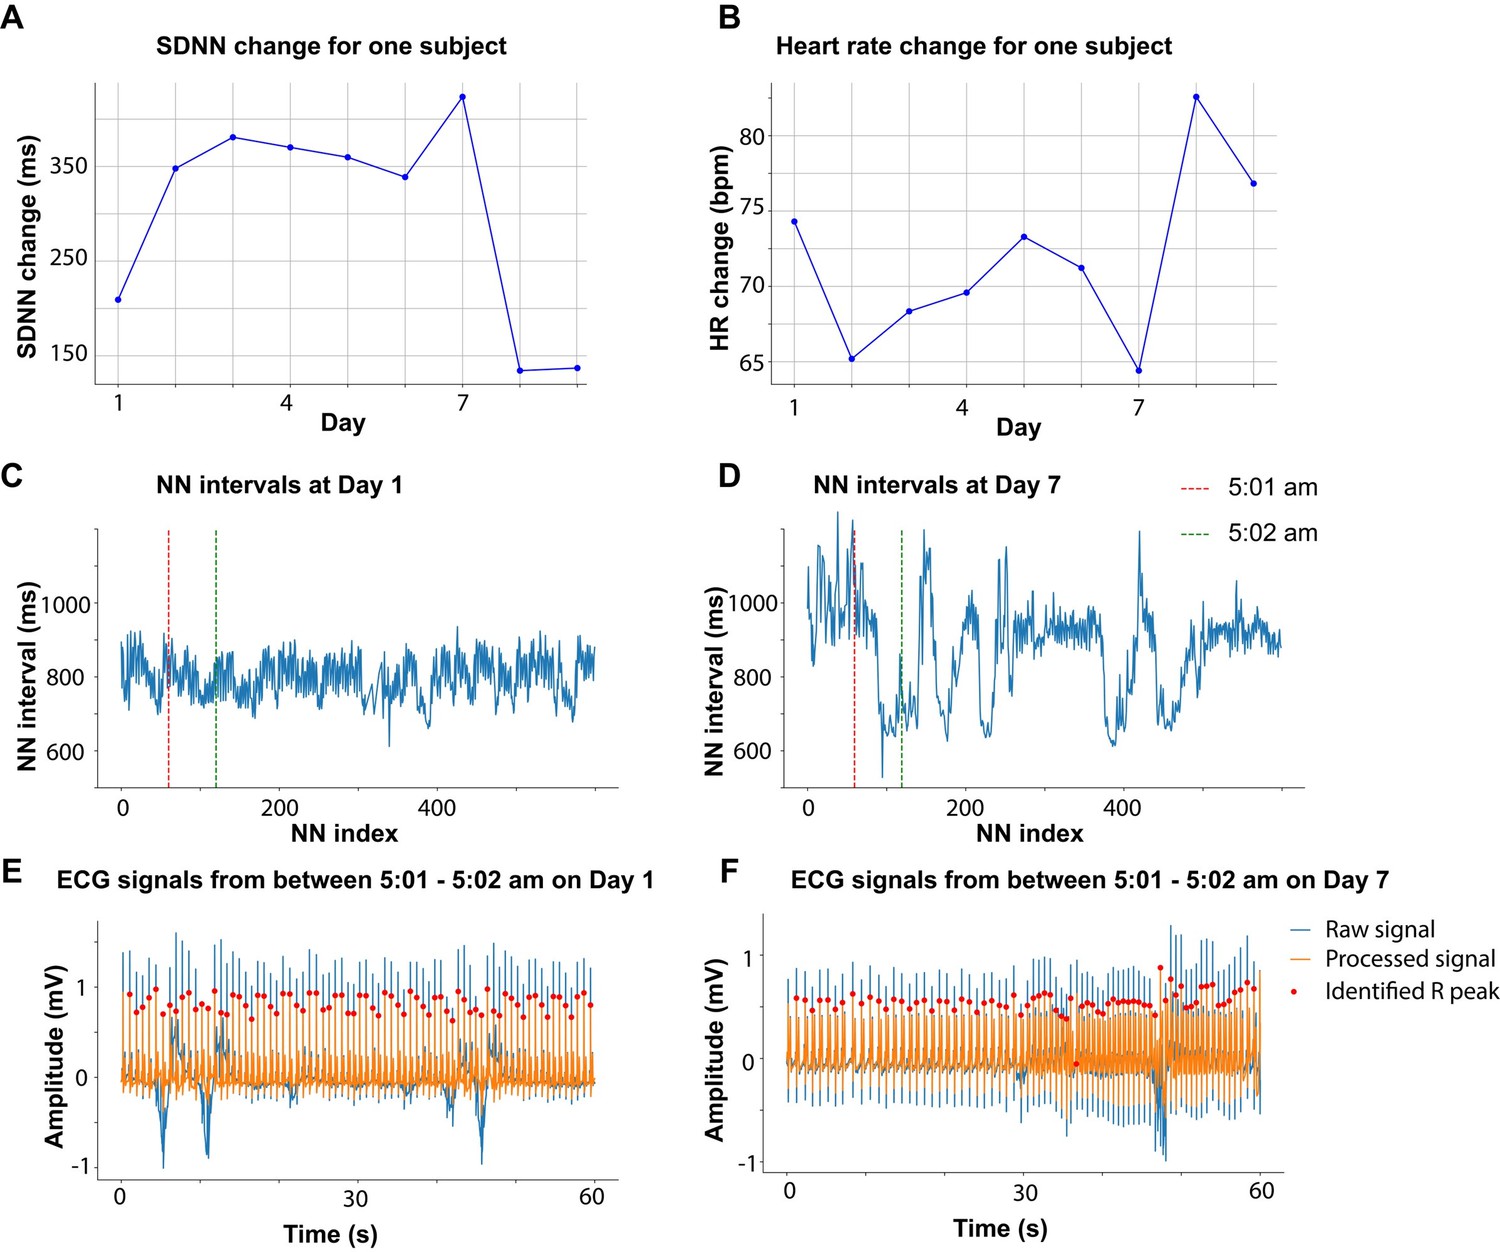
The acute effects of transcutaneous auricular vagus nerve stimulation (taVNS) on cardiac function.
(A) Daily fluctuation of heart rate of a subject receiving VNS treatment. The treatment period, a 20-min period before and after treatment, is highlighted. Note that a small proportion of electrocardiogram (ECG) signals to derive heart rate was missing due to the expected cyclical restarting of the monitoring system. (B, D) Normalized heart rate (QTc) aligned at the treatment onset over time for the two treatment groups. The heart rate (QTc) is normalized based on the mean and standard error of heart rate for each day. (C) The difference in HR between the treatment period, post-treatment period, and pre-treatment period for the two groups. Wilcoxon signed-rank test was used to test if the HR difference is statistically different from 0 in the VNS treatment group. Bonferroni-corrected p-value for HR difference between post-treatment and treatment period is 0.03 (N = 188, Cohen’s d = 0.1). Mann–Whitney U tests were used to compare cardiac function metric differences between the two treatment groups. (E, F) The difference in QTc and RMSSD between the treatment period, post-treatment period, and pre-treatment period for the two groups (G) The relationship between heart rate changes following acute taVNS and functional outcome.
Figure 5—figure supplement 1
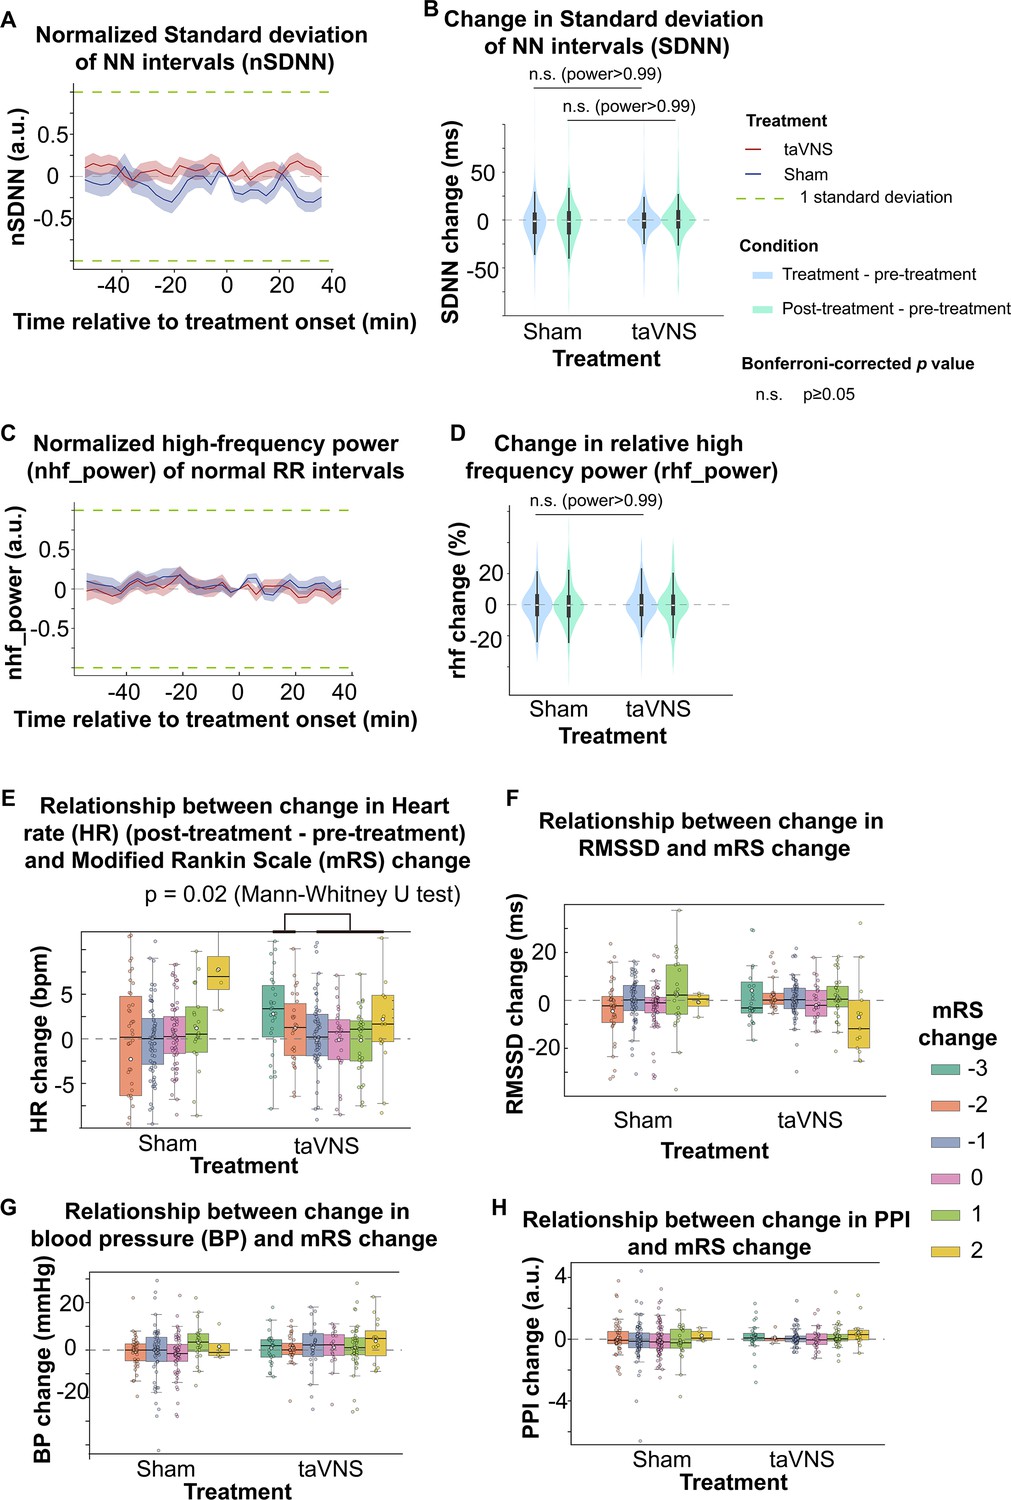
Cardiac effects of acute transcutaneous auricular vagus nerve stimulation (taVNS).
(A, C) Temporal dynamics of normalized SDNN (high-frequency power). Normalized SDNN (high-frequency power) for the two treatment groups at the treatment onset was set to 0. The data is presented as a mean ± standard error. (B, D). Comparison of change in SDNN (relative high-frequency power) values from pre-treatment to treatment period (blue) and post-treatment period (green) between treatment groups. No significant differences were observed between treatment groups based on Mann–Whitney U tests. (E, F) The relationship between changes in the modified Rankin Scale (mRS) scores and changes in differential measures of cardiovascular parameters from pre-treatment to post-treatment periods. (G,H) The relationship between changes in mRS scores and changes in blood pressure (G) and PPI (H) for the two treatment groups.
Figure 5—figure supplement 2
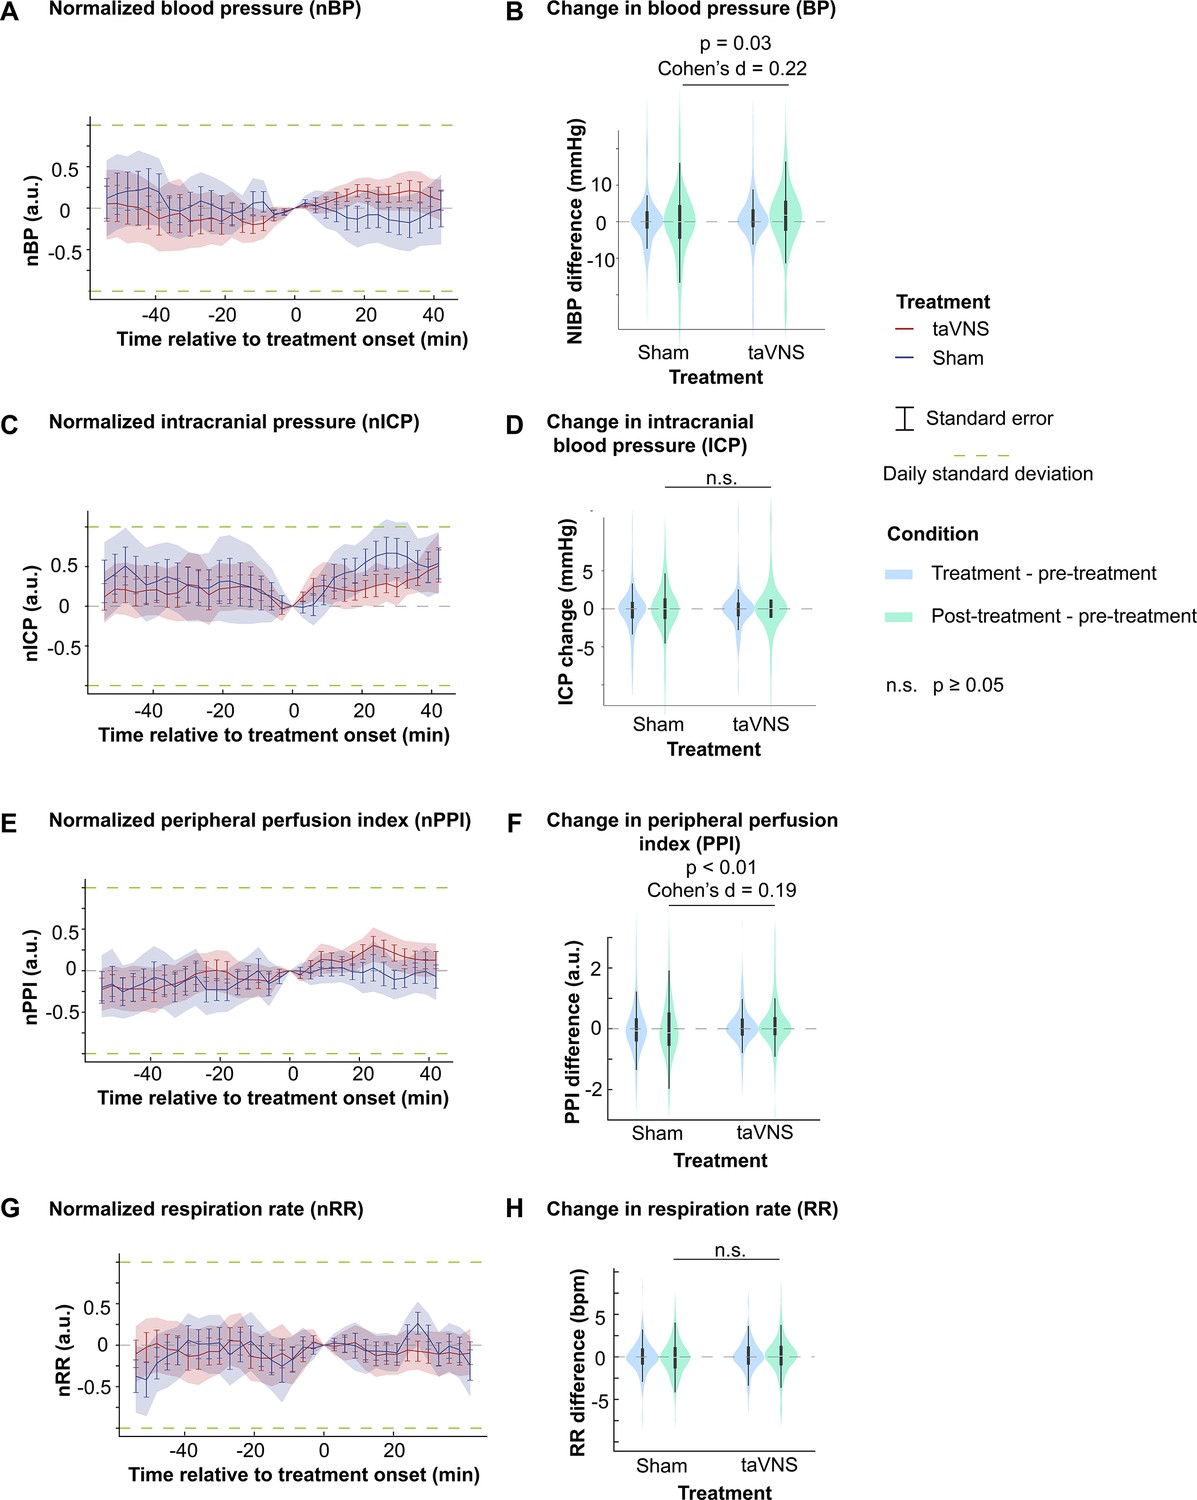
Vascular effects of acute transcutaneous auricular vagus nerve stimulation (taVNS).
(A, C, E, G) (left) Temporal dynamics of normalized blood pressure (BP), intracranial blood pressure (ICP), peripheral perfusion index (PPI), and respiration rate (RR) in both treatment groups, aligned with the treatment onset. (B, D, F, H) (right) Comparison of change in BP, ICP, PPI, and RR from pre-treatment to treatment (blue) and post-treatment (green) periods. Mann–Whitney U tests were used to compare the change in vital signs between groups. The powers are >0.99 for RR and 0.98 for ICP.
Figure 5—figure supplement 3
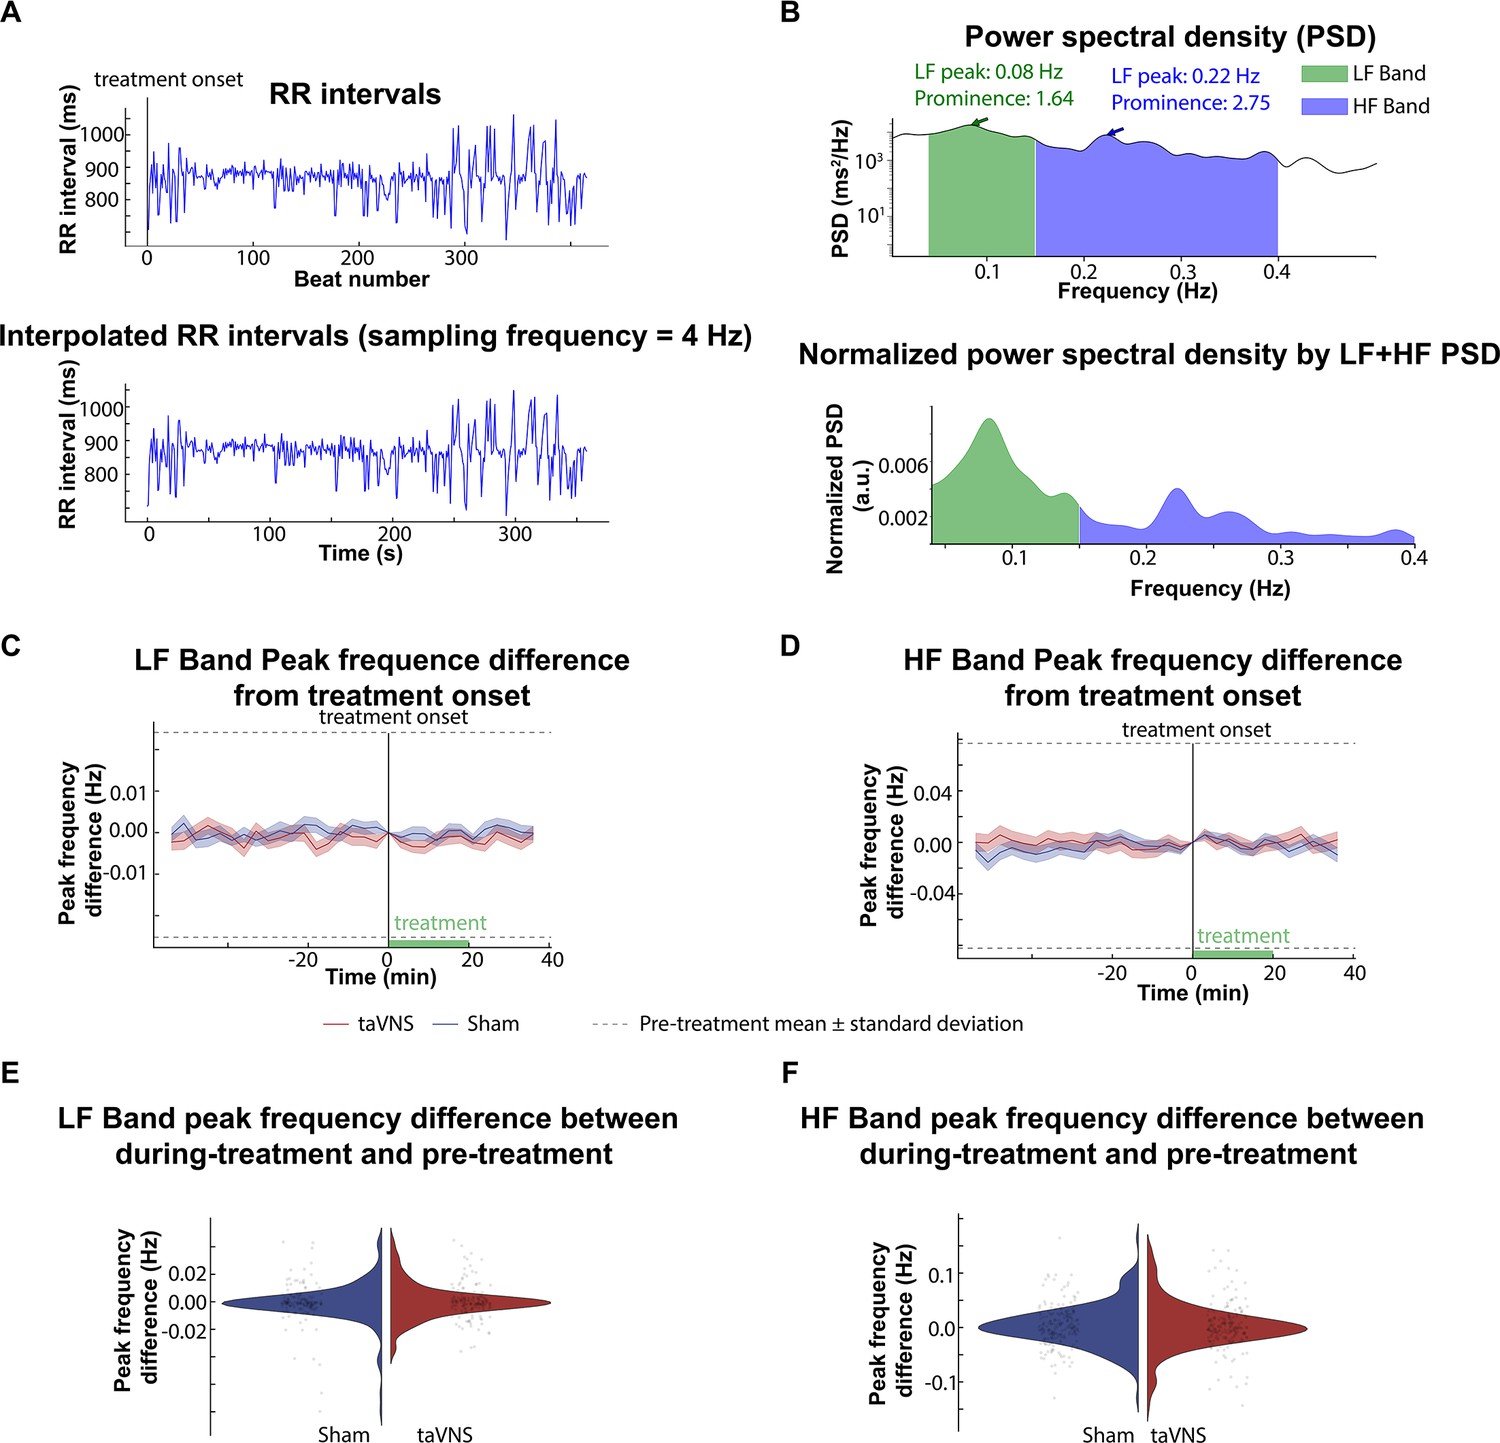
The effect of acute transcutaneous auricular vagus nerve stimulation (taVNS) on peak frequencies within the high-frequency (HF) and the low-frequency (LF) bands.
To investigate the potential effects of acute taVNS treatment on the autonomic system, we analyzed the peak frequency of the HF and LF bands. (A). representative RR intervals over 6 min were linear interpolated for frequency-domain analysis. Ectopic beats and outliers were identified and corrected. (B). The power spectral density (PSD) of the interpolated RR intervals time series. Peak frequencies within the HF and LF bands and their prominence were calculated from the normalized power spectral density. (C, D) Changes in LF and HF peak frequencies over time, with peak frequencies at treatment onset (time 0) set as the baseline (0). (E, F) Comparison of the changes in peak frequencies between the during- and pre-treatment periods across treatment groups (LF band peak frequency: p = 0.54, Cohen’s d = –0.07; HF band peak frequency: p-value = 0.67, Cohen’s d = 0.04, t-test).
Author response image 1
Tables
Table 1
Patient demography.
HH: Hunt & Hess classification. mRS: modified Rankin Scale. Y: yes. N: no.
| Patient | Decade of life | Gender | Race | HH | mRS(admission) | mRS(discharge) | Vasospasm treated by blood pressure goal augmentation | Indwelling arterial lines | ICP monitoring |
|---|---|---|---|---|---|---|---|---|---|
| 1 | 70s | M | White | 3 | 5 | 5 | Y | Y | Y |
| 2 | 50s | M | Black/African American | 3 | 4 | 3 | N | Y | Y |
| 3 | 50s | F | White | 2 | 2 | 3 | N | N | N |
| 4 | 60s | M | White | 2 | 3 | 4 | Y | N | N |
| 5 | 60s | F | White | 2 | 2 | 3 | Y | N | N |
| 6 | 70s | F | White | 2 | 3 | 2 | N | Y | N |
| 7 | 60s | M | White | 4 | 5 | 4 | N | Y | Y |
| 8 | 60s | F | White | 4 | 5 | 2 | N | Y | Y |
| 9 | 70s | F | White | 2 | 3 | 0 | Y | N | N |
| 10 | 70s | F | White | 2 | 3 | 3 | Y | Y | N |
| 11 | 40s | M | Black/African American | 4 | 5 | 4 | Y | Y | Y |
| 12 | 40s | F | White | 2 | 4 | 3 | N | N | N |
| 13 | 50s | F | Black/African American | 2 | 2 | 1 | Y | N | N |
| 14 | 80s | F | White | 1 | 3 | 3 | Y | N | N |
| 15 | 70s | F | Black/African American | 4 | 5 | 3 | N | N | Y |
| 16 | 40s | F | Black/African American | 2 | 2 | 3 | N | N | N |
| 17 | 60s | F | White | 2 | 1 | 0 | N | N | N |
| 18 | 30s | F | White | 3 | 4 | 2 | N | N | Y |
| 19 | 60s | F | White | 3 | 4 | 2 | N | N | Y |
| 20 | 80s | F | White | 2 | 2 | 3 | N | Y | Y |
| 21 | 50s | F | White | 3 | 4 | 4 | N | Y | Y |
| 22 | 70s | F | White | 1 | 2 | 4 | N | N | N |
| 23 | 40s | F | Black/African American | 2 | 2 | 4 | N | Y | N |
| 24 | 60s | M | White | 4 | 5 | 5 | Y | Y | Y |
Table 2
Relationship between HR changes following acute transcutaneous auricular vagus nerve stimulation (taVNS) and clinical outcomes.
| Model | |||
|---|---|---|---|
| Coefficient | p-value | 95% confidence interval | |
| 0.73 | 0.211 | −0.41 to 1.87 | |
| −0.29 | 0.737 | −1.95 to 1.38 | |
| 1.47 | 0.006 | 0.43 to 2.51 | |
| −1.85 | 0.005 | −3.12 to 0.57 | |
-
Bold values denote statistical significance at the p < 0.05 level.
Table 3
Summary of effects of acute and repetitive transcutaneous auricular vagus nerve stimulation (taVNS) on cardiovascular function in subarachnoid hemorrhage (SAH) patients.
Metrics for cardiovascular function include heart rate variability, heart rate, QT interval, blood pressure, intracranial pressure, peripheral perfusion index, and respiration rate.
| Positive findings | Null findings | Implications | ||
|---|---|---|---|---|
| Repetitive | Cardiac function | Increased HRV | QT interval Heart rate | Increased parasympathetic activity |
| Vascular function | Reduced peripheral perfusion index Increased respiration rate | Blood pressure Intracranial pressure | Compensatory mechanisms to maintain autonomic balance | |
| Acute | Cardiac function | Heart rate Heart rate variability QT interval | No to small acute effect | |
| Vascular function | Increased peripheral perfusion index | Intracranial pressure Respiration rate |
Appendix 2—table 1
Summary of statistical tests.
Bolded values were used to make inferences in this paper.
| Test name | Variable | Distribution A | Distribution B | N(A) | N(B) | p | Statistics | Effect size |
|---|---|---|---|---|---|---|---|---|
| T | RMSSD change | taVNS | Sham | 94 | 95 | 0.004 | t = 2.91 | 0.42 |
| T | SDNN change | taVNS | Sham | 94 | 95 | 0.48 | t = 0.71 | 0.10 |
| Mann–Whitney U | HR change | taVNS | Sham | 94 | 95 | 0.69 | U(A) = 4317 | –0.01 |
| Equivalence test (two one-sided t-tests) | HR change | taVNS | Sham | 94 | 95 | 0.006 (lower), 0.004 (upper) | 2.53 (lower) –2.72 (upper) | –0.01 |
| Mann–Whitney U | QTc change | taVNS | Sham | 94 | 95 | <0.01 | U(A) = 3539 | –0.57 |
| Equivalence test (two one-sided t-tests) | QTc change margin: 30 ms | taVNS | Sham | 94 | 95 | 0.50 (lower), 1.45*10−13 (upper) |
| –0.57 |
| Mann–Whitney U | Percentage of prolonged QT | taVNS | Sham | 94 | 95 | <0.01 | U(A) = 2885 | –0.72 |
| Mann–Whitney U | Overall HRV change | taVNS | Sham | 94 | 95 | 0.04 | U(A) = 5237 | 0.37 |
| Mann–Whitney U | Parasympathetic activity change | taVNS | Sham | 94 | 95 | 0.04 | U(A) = 5238 | 0.29 |
| Mann–Whitney U | ICP change | taVNS | Sham | 66 | 52 | 0.61 | U(A) = 1972 | 0.25 |
| Equivalence test (two one-sided t-tests) | ICP change margin: 2 mmHg | taVNS | Sham | 66 | 52 | 3.66*10−13 (lower), 3.33*10−10 (upper) | 8.07 (lower) –6.73 (upper) | 0.12 |
| Mann–Whitney U | BP change | taVNS | Sham | 66 | 81 | 0.73 | U(A) = 2842 | –0.11 |
| Equivalence test (two one-sided t-tests) | BP change margin: 2 mmHg | taVNS | Sham | 66 | 81 | 0.07 (lower), 0.002 (upper) | 1.51 (lower) –3.00 (upper) | –0.12 |
| Mann–Whitney U | SBP change | taVNS | Sham | 66 | 81 | 0.90 | U(A) = 2719 | –0.07 |
| Mann–Whitney U | DBP change | taVNS | Sham | 66 | 81 | 0.73 | U(A) = 2846 | –0.17 |
| Mann–Whitney U | ABP change | taVNS | Sham | 28 | 24 | 0.46 | U(A) = 295 | –0.48 |
| Mann–Whitney U | PPI change | taVNS | Sham | 83 | 95 | 0.002 | U(A) = 2877 | –0.49 |
| Mann–Whitney U | RR change | taVNS | Sham | 94 | 95 | 0.004 | U(A) = 5530 | 0.37 |
| Mann–Whitney U | HR difference (post–pre) | taVNS | Sham | 188 | 199 | 0.28 | U(A) = 17,527 | 0.10 |
| Wilcoxon signed rank | HR difference (post–pre) | taVNS | 188 | 0.02 | 7525 | 0.11 | ||
| Mann–Whitney U | QTc difference (post–pre) | taVNS | Sham | 188 | 198 | 0.86 | U(A) = 18,412 | 0.02 |
| Mann–Whitney U | RMSSD difference (post–pre) | taVNS | Sham | 188 | 199 | 0.31 | U(A) = 17,581 | 0.14 |
| Mann–Whitney U | SDNN difference (post–pre) | taVNS | Sham | 188 | 199 | 0.48 | U(A) = 17,923 | 0.03 |
| Mann–Whitney U | HR difference (post–pre) | mRS change <−1 | mRS change ≥−1 | 53 | 122 | 0.01 | U(A) = 4019 | 0.38 |
| Mann–Whitney U | BP difference (post–pre) | taVNS | Sham | 159 | 180 | 0.03 | U(B) = 12,400 | 0.21 |
| Mann–Whitney U | ICP difference (post–pre) | taVNS | Sham | 146 | 114 | 0.82 | U(B) = 12,400 | 0.09 |
| Mann–Whitney U | PPI difference (post–pre) | taVNS | Sham | 186 | 227 | 0.002 | U(B) = 17,386 | 0.19 |
| Mann–Whitney U | RR difference (post–pre) | taVNS | Sham | 214 | 224 | 0.10 | U(B) = 21,806 | 0.11 |
Appendix 3—table 1
Clinical characteristics and cardiovascular metrics of the two arms.
Values in this table represent the median.
| taVNS | Sham | |
|---|---|---|
| Age | 67 | 53 |
| % of female | 63.6% | 84.6% |
| % with known hypertension | 90.9% | 46.2% |
| % with known diabetes mellitus | 18.2% | 7.7% |
| % with arrhythmia PTA | 9.1% | 7.7% |
| % with coronary artery disease PTA | 0% | 15.4% |
| % on beta blockers PTA | 27.3% | 38.5% |
| % on calcium channel blockers PTA | 27.3% | 7.7% |
| % on angiotensin-converting enzyme inhibitors PTA | 27.3% | 15.4 |
| Heart rate (bpm) | 86.0 | 78.8 |
| Change from pre- to post-treatment | 1.1 | 0.3 |
| Change from pre- to during-treatment | 0.4 | –0.2 |
| QTc (ms) | 509.9 | 483.6 |
| Change from pre- to post-treatment | –0.4 | –0.2 |
| Change from pre- to during-treatment | 1.3 | 1.0 |
| SDNN (ms) | 72.7 | 77.1 |
| Change from pre- to post-treatment | –0.4 | –1.7 |
| Change from pre- to during-treatment | –1.0 | –1.4 |
| RMSSD (ms) | 24.8 | 24.5 |
| Change from pre- to post-treatment | –0.1 | –0.4 |
| Change from pre- to during-treatment | –0.3 | –0.8 |
| Relative power of high-frequency band (%) | 30.4 | 30.7 |
| Change from pre- to post-treatment | –0.4 | –0.7 |
| Change from pre- to during-treatment | –0.5 | –0.3 |
| Blood pressure (mmHg) | 92.4 | 95.3 |
| Change from pre- to post-treatment | 1.8 | 0.0 |
| Change from pre- to during-treatment | 0.0 | 0.0 |
| PPI (a.u.) | 1.6 | 2.3 |
| Change from pre- to post-treatment | 0.0 | –0.1 |
| Change from pre- to during-treatment | 0.0 | –0.1 |
| ICP (mmHg) | 6 | 6.3 |
| Change from pre- to post-treatment | 0.0 | 0.0 |
| Change from pre- to during-treatment | 0.0 | 0.0 |
| Respiration rate (bpm) | 20.1 | 18.3 |
| Change from pre- to post-treatment | 0.1 | 0.1 |
| Change from pre- to during-treatment | 0.0 | 0.0 |
-
QTc: corrected QT interval; PPI: peripheral perfusion index; ICP: intracranial pressure; PTA: prior to admission.
Appendix 4—table 1
Effect of taVNS on cardiac metrics adjusted for age.
The regression formula is: cardiac metric ~ Treatment + Age.
| Coefficient | p-value | 95% CI | |
|---|---|---|---|
| Heart rate change from Day 1 (F = 9.49, p < 0.01 for the overall model) | |||
| taVNS treatment | 1.87 | 0.21 | [–1.05, 4.80] |
| Age | –0.26 | <0.01 | [–0.37, –0.14] |
| QTc change from Day 1 (F = 14.23, p < 0.01 for the overall model) | |||
| taVNS treatment | –30.79 | <0.01 | [–42.16, –19.43] |
| Age | 0.19 | 0.40 | [–0.26, 0.65] |
| SDNN change from Day 1 (F = 29.40, p < 0.01 for the overall model) | |||
| taVNS treatment | 15.43 | <0.01 | [5.14, 25.72] |
| Age | –1.56 | <0.01 | [–1.97, –1.15] |
| RMSSD change from Day 1 (F = 25.09, p < 0.01 for the overall model) | |||
| taVNS treatment | 16.90 | <0.01 | [10.02, 23.78] |
| Age | –0.83 | <0.01 | [–1.10, –0.56] |
Additional files
Download links
A two-part list of links to download the article, or parts of the article, in various formats.
Downloads (link to download the article as PDF)
Open citations (links to open the citations from this article in various online reference manager services)
Cite this article (links to download the citations from this article in formats compatible with various reference manager tools)
The effect of transcutaneous auricular vagus nerve stimulation on cardiovascular function in subarachnoid hemorrhage patients: A randomized trial
eLife 13:RP100088.
https://doi.org/10.7554/eLife.100088.3


