Imaging of brain electric field networks with spatially resolved EEG
- University of California, San Diego, United States
- University of Victoria, Canada
- Nathan Kline Institute, United States
- Feinstein Institute for Medical Research, United States
Figures
Figure 1
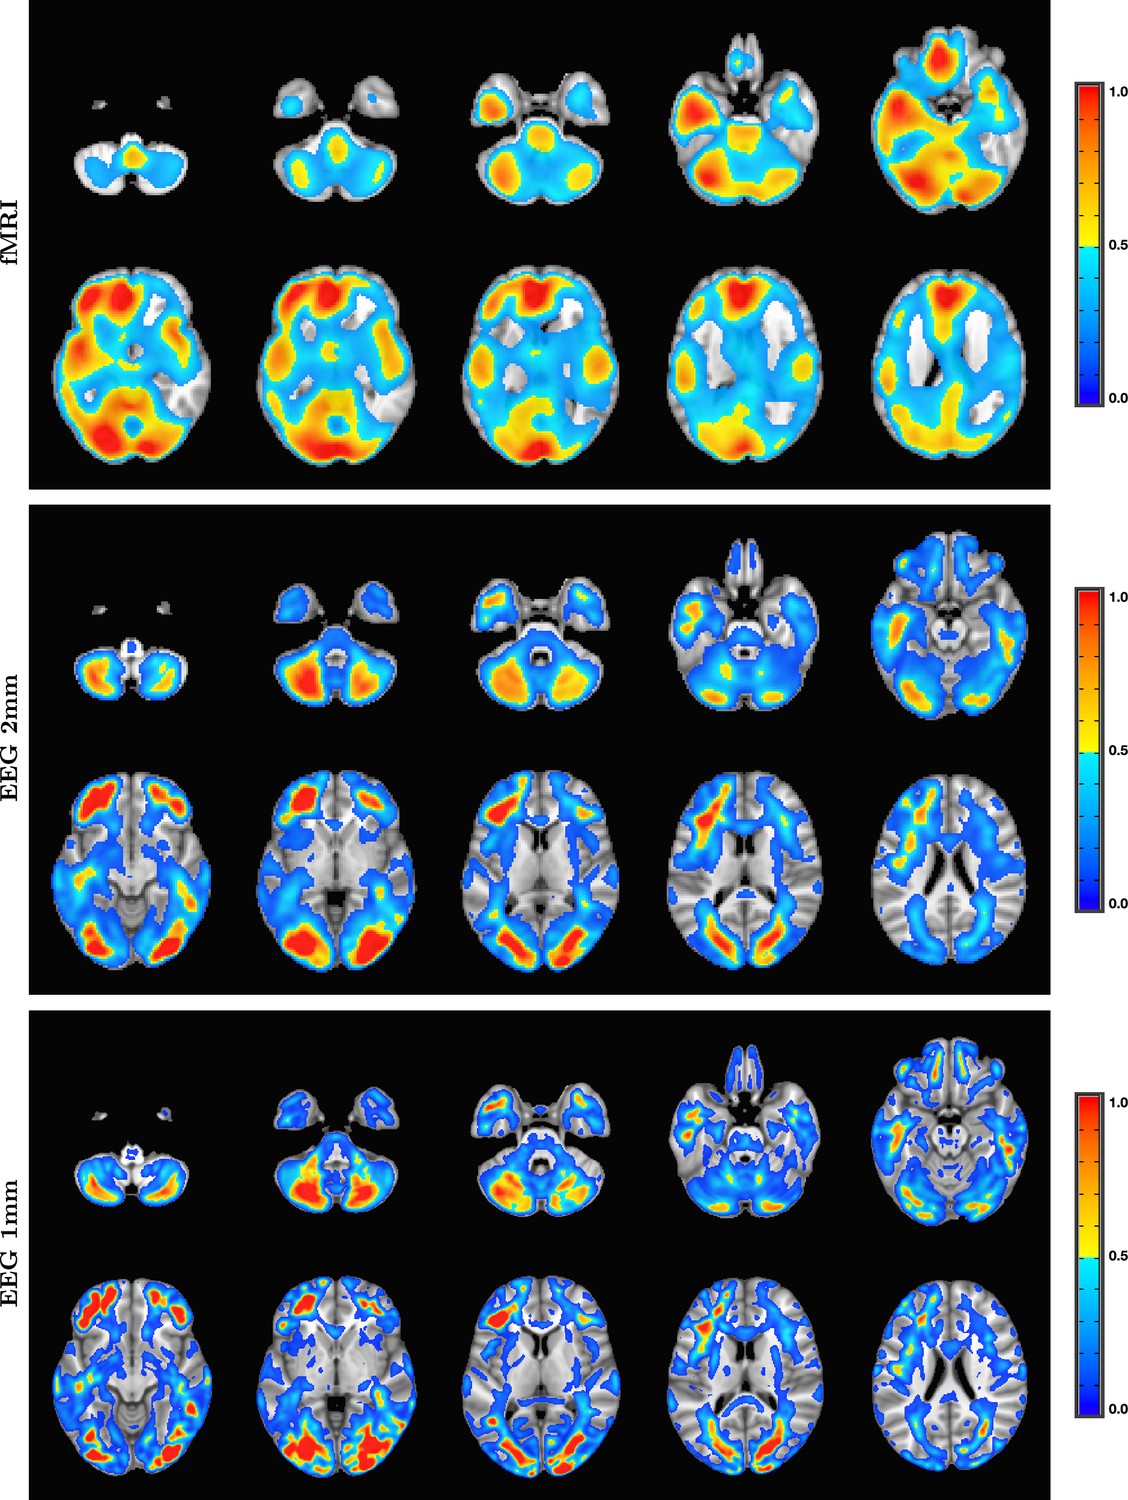
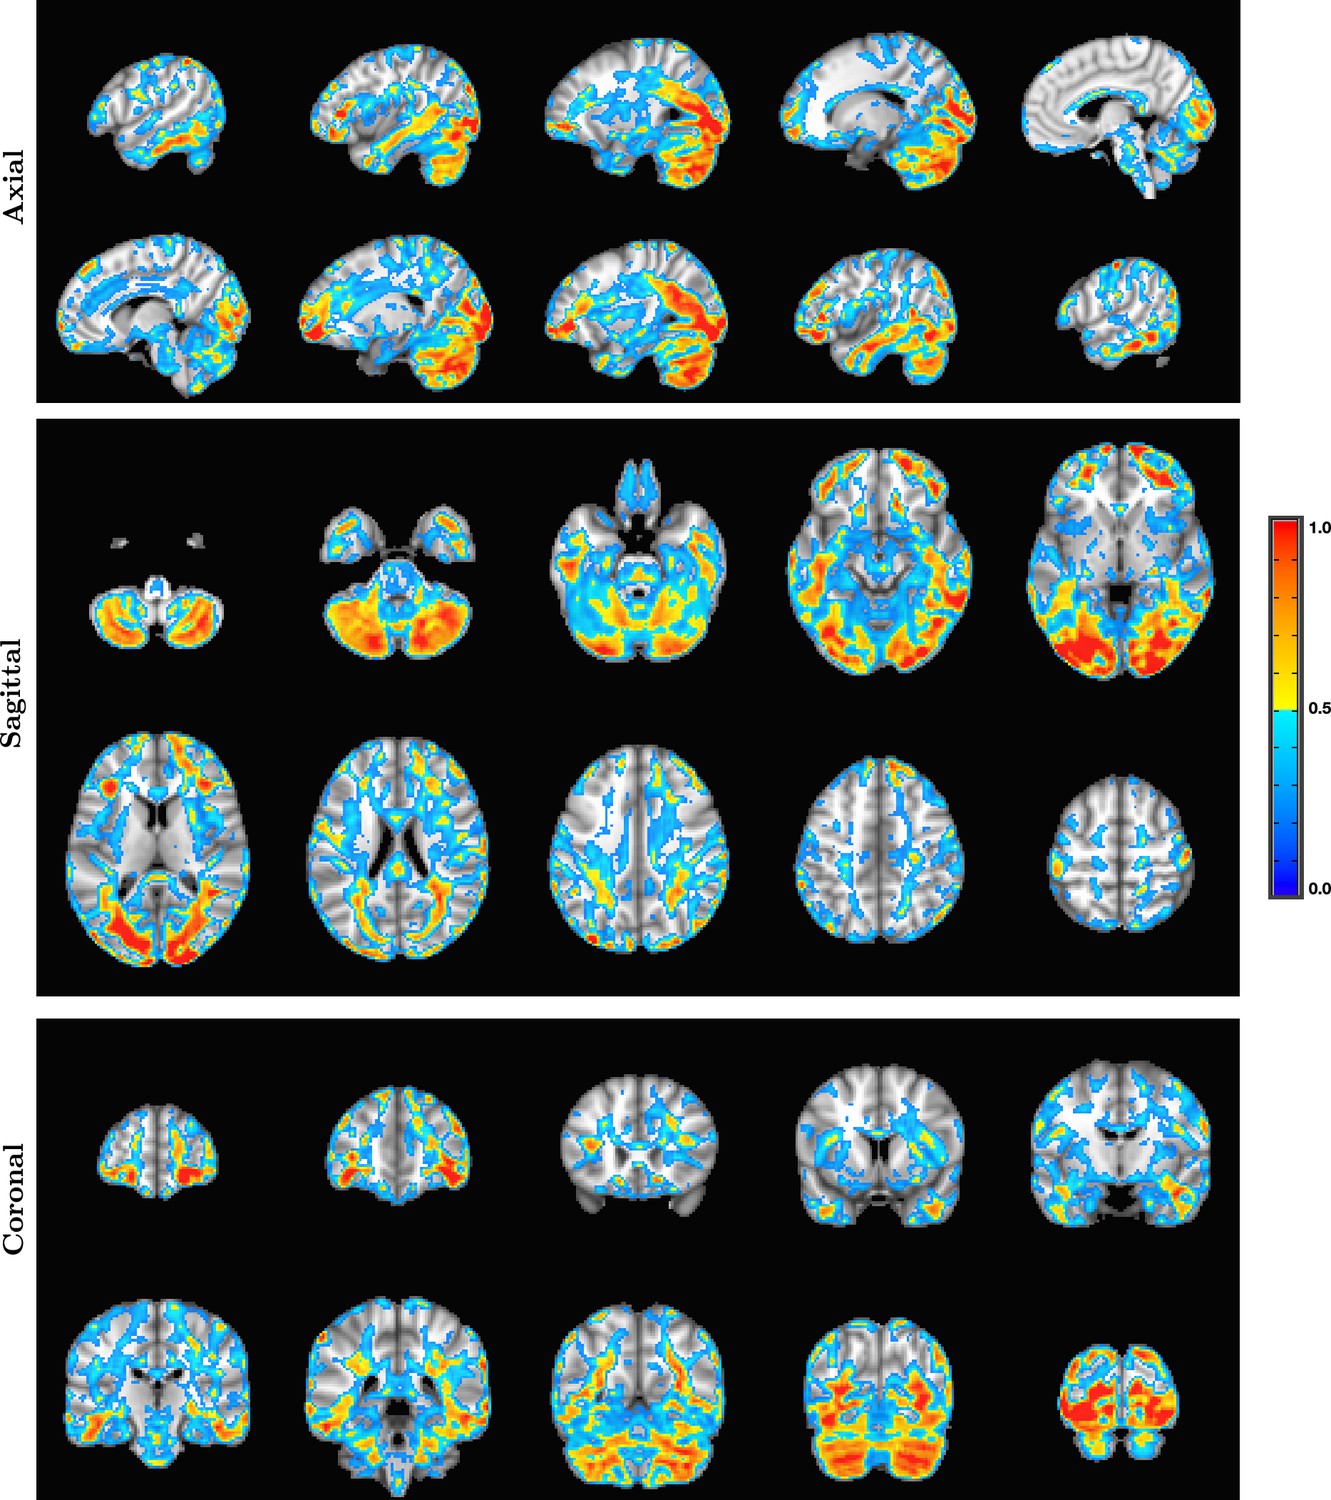
Comparison of entropy field decomposition (EFD) reconstructed functional MRI (fMRI) activity (top) with SPatially resolved EEG Constrained with Tissue properties by Regularized Entropy (SPECTRE) electroencephalography (EEG) reconstruction in the frequency band 0–1 Hz at both 2 mm (middle) and 1 mm (bottom) spatial resolution (axial view) from a single representative subject from an open-source study with simultaneous fMRI and EEG (Telesford et al., 2023).
In both cases, the weighted sum of the power over all modes is shown. The task was a simple 8 Hz flashing checkerboard with 4 on/off cycles. The nonlinear registration of the fMRI to the anatomical template in the fMRI data (top) is imperfect because of significant field-induced nonlinear geometric distortions in the fMRI data. The colors are the weighted sum over all estimated amplitudes of the activation modes. Intensities are scaled between 0 and 1, and thresheld at 0.6.
Figure 2
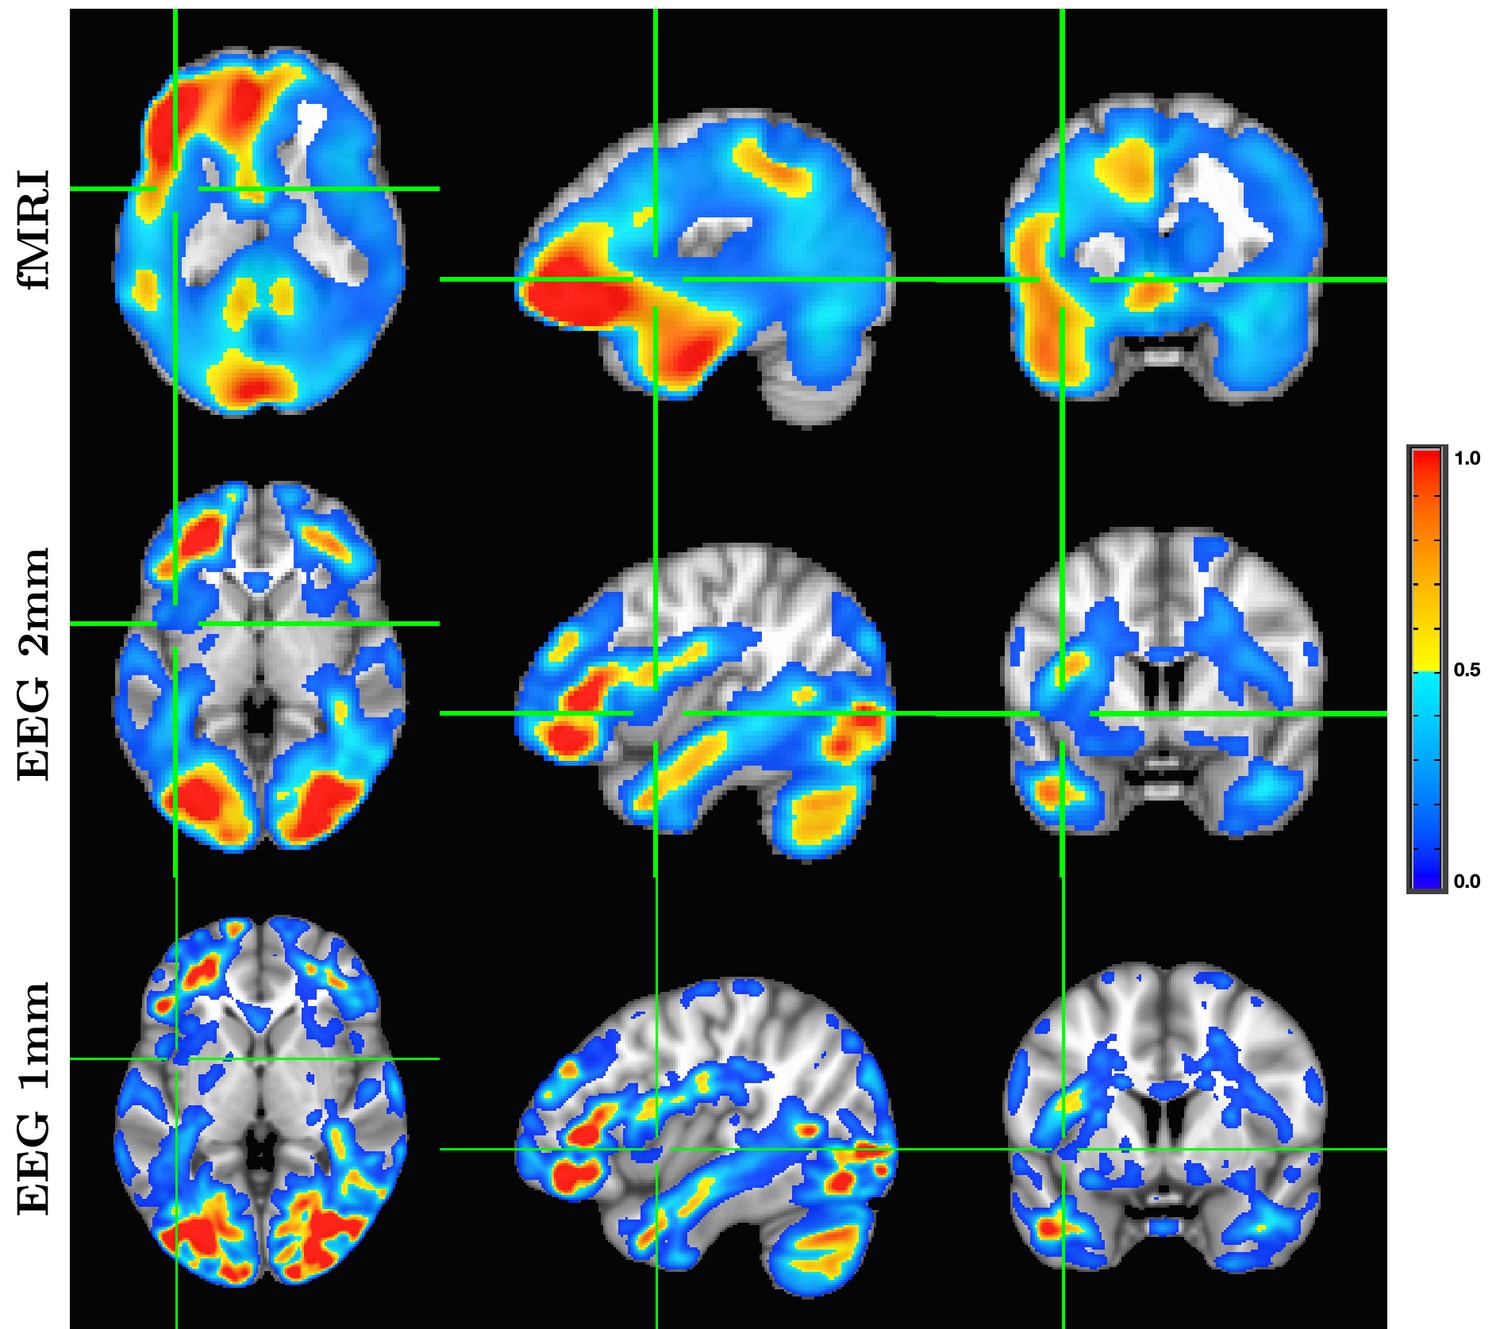
A detailed visualization of three orthogonal views of data in Figure 1 demonstrating the fine spatial resolution produced by SPatially resolved EEG Constrained with Tissue properties by Regularized Entropy (SPECTRE), and the ability to reconstruct activations in regions prone to severe distortions in functional MRI (fMRI), such as the frontal lobes and cerebellum.
The colors are the weighted sum over all estimated amplitudes of the activation modes. Intensities are scaled between 0 and 1, and thresheld at 0.6.
Figure 3

Correlation coefficient in each axial slice (from inferior to superior) between the activation patterns estimated by SPatially resolved EEG Constrained with Tissue properties by Regularized Entropy (SPECTRE) electroencephalography (EEG) and the functional MRI (fMRI) for the data in Figure 1.
Regions of high correlation indicate the similarity in activation patterns detected between the two completely different neuroimaging methods (SPECTRE and fMRI). Reduction of the correlations in the superior regions of the brain, possibly due to the increased distortions in that region in this fMRI dataset.
Figure 4
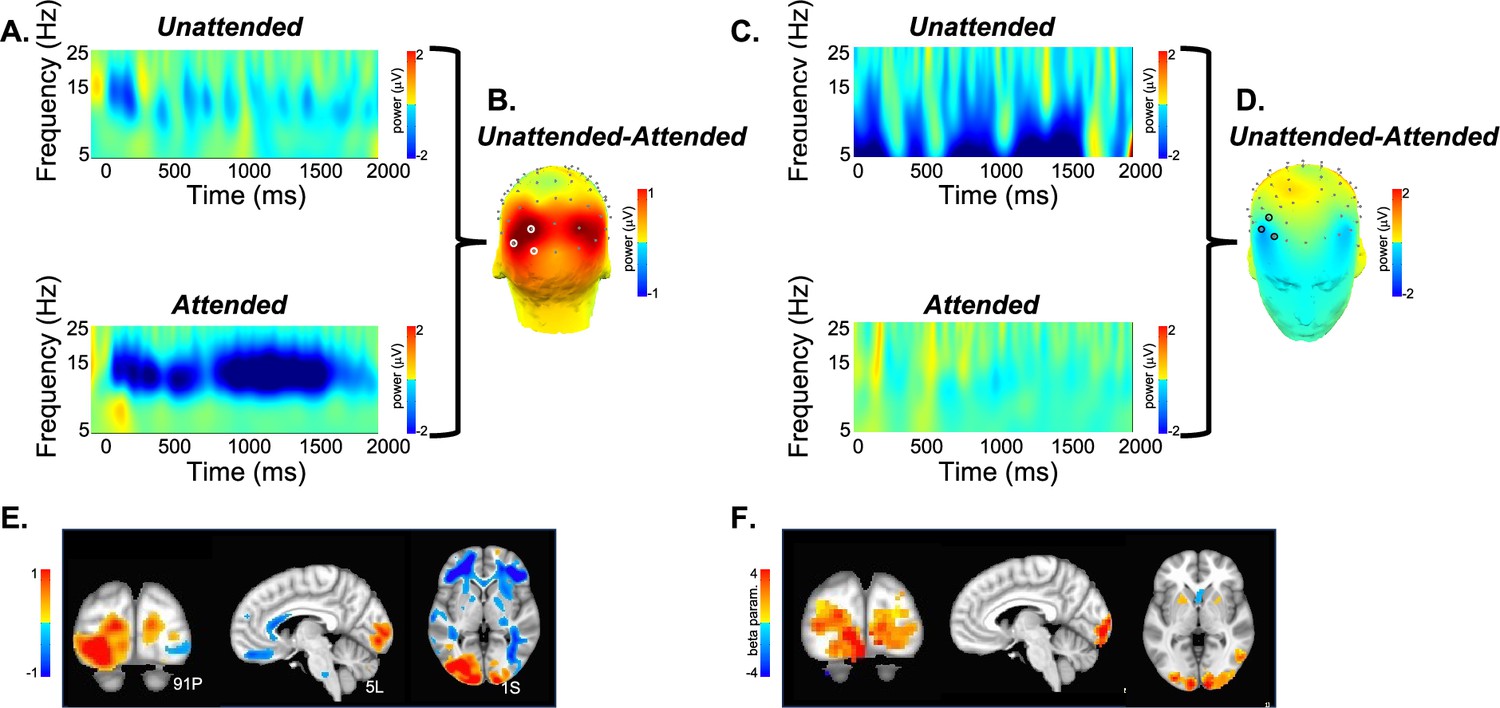
Validation of SPECTRE against standard EEG spatial and frequency mapping and simultaneously acquired fMRI.
(A) Baseline-corrected electroencephalography (EEG) activity from a single subject elicited by unattended (top) and attended (bottom) visual stimuli averaged across the cluster of three occipital electrode sites (PO7, PO3, O1) denoted in B by white circles. Over the broad alpha frequency band (7–16 Hz), there was a reduction in total power (from the pre- to poststimulus latency interval) which was greater for attended, compared to unattended, visual stimuli. (B) Scalp topography of the mean difference in oscillatory (8–12 Hz) activity for unattended minus attended visual stimuli across the 0–2000 ms latency interval. As expected, attention modulated (reduced) the power of these oscillations over the visual cortex. (C) As in A for three frontal electrode sites (F6, F8, AF6) denoted in D by black circles. In contrast to visual cortex, in bilateral frontal regions, unattended visual stimuli elicited a greater reduction of oscillatory activity between 5 and 10 Hz (theta-alpha frequency). (D) Frontal view of the unattended minus attended difference topography between 0 and 2000 ms in the 8–12 Hz frequency band. (E) SPatially resolved EEG Constrained with Tissue properties by Regularized Entropy (SPECTRE) Power estimates derived from mean (baseline-corrected) oscillatory power between 0 and 2000 ms and across 8–12 Hz for the same subject shown in panels A–D, superimposed on the MRI Montreal Neurological Institute (MNI) template brain. Hot colors (yellow to red) indicate greater attention-related modulation (reduction) of activity, and the inverse for warm colors (light to dark blue). (F) Blood oxygenation level-dependent (BOLD) signal (beta parameter estimate) contrasting activation to visual stimuli when attended vs activation to the same stimulus when unattended. Attention-related enhancement of the BOLD signal in visual cortex mirrors the reduction in alpha power obtained in the same subject using EEG.
Figure 5
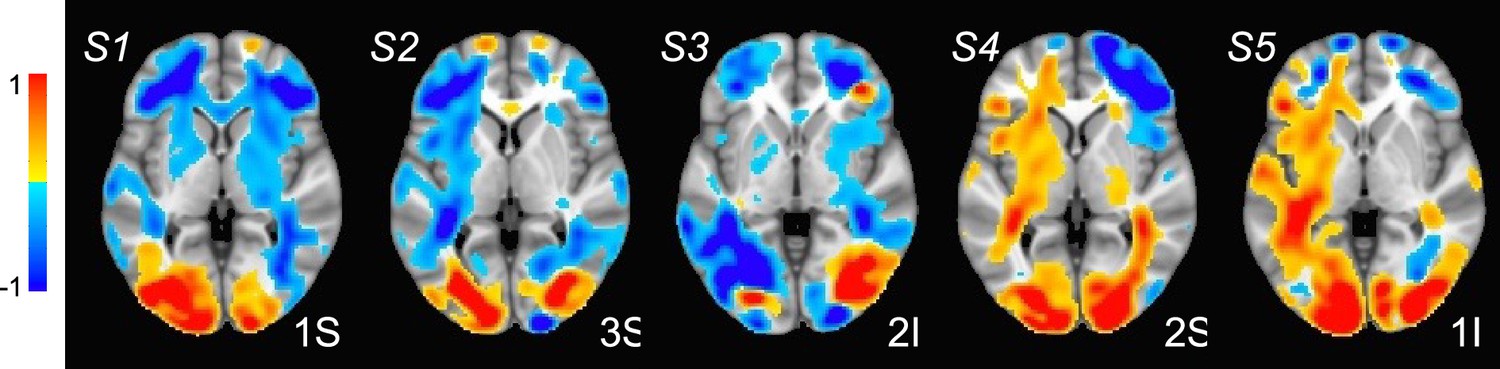
Estimated localization of neural activity for 8–12 Hz oscillatory activity (unattended minus attended; 0–2000 ms) for five participants (S1-S5).
Colors are as in Figure 4E. A prominent bilateral occipital source associated with increased attentional modulation is observable in all participants. A bilateral source localized in the middle frontal cortex and indicating less modulation is also consistently observed across participants. Note that these are difference maps from the weighted sum over all estimated amplitudes of the activation modes, so that the intensities are scaled between –1 and 1, and thresheld at absolute value 0.6.
Figure 6

Direct comparison of activation maps from two participants (Subject A, left; Subject B, right) in the bimodal (auditory + visual) stimulation paradigm described for Figures 3 and 4.
In each subject, two brain regions - the cerebellum and the occipital pole (top and bottom rows, respectively) - were delineated based on the MRI Montreal Neurological Institute (MNI) atlas, and entropy field decomposition (EFD) activation maps were correlated across these entire regions. Correlation coefficients were as follows: for Subject A, cerebellum=0.74, occipital pole=0.70; for Subject B, cerebellum=0.70, occipital pole=0.84. Correlations were computed only for regions exhibiting activation levels above 0.1. In contrast to functional MRI (fMRI), the SPatially resolved EEG Constrained with Tissue properties by Regularized Entropy (SPECTRE) technique identified robust activations in bilateral middle and inferior frontal cortex (indicated by yellow arrows) and middle temporal cortex (red arrows). It also discerned activations along the superior temporal cortex, including areas encompassing the primary auditory cortex (green arrows).
Figure 7
Orthogonal slices from whole-brain electric field activation maps from a 2 mm SPatially resolved EEG Constrained with Tissue properties by Regularized Entropy (SPECTRE) reconstruction of electroencephalography (EEG) data from a single subject in the attention study.
The colors are the weighted sum over all estimated amplitudes of the activation modes.
Figure 8
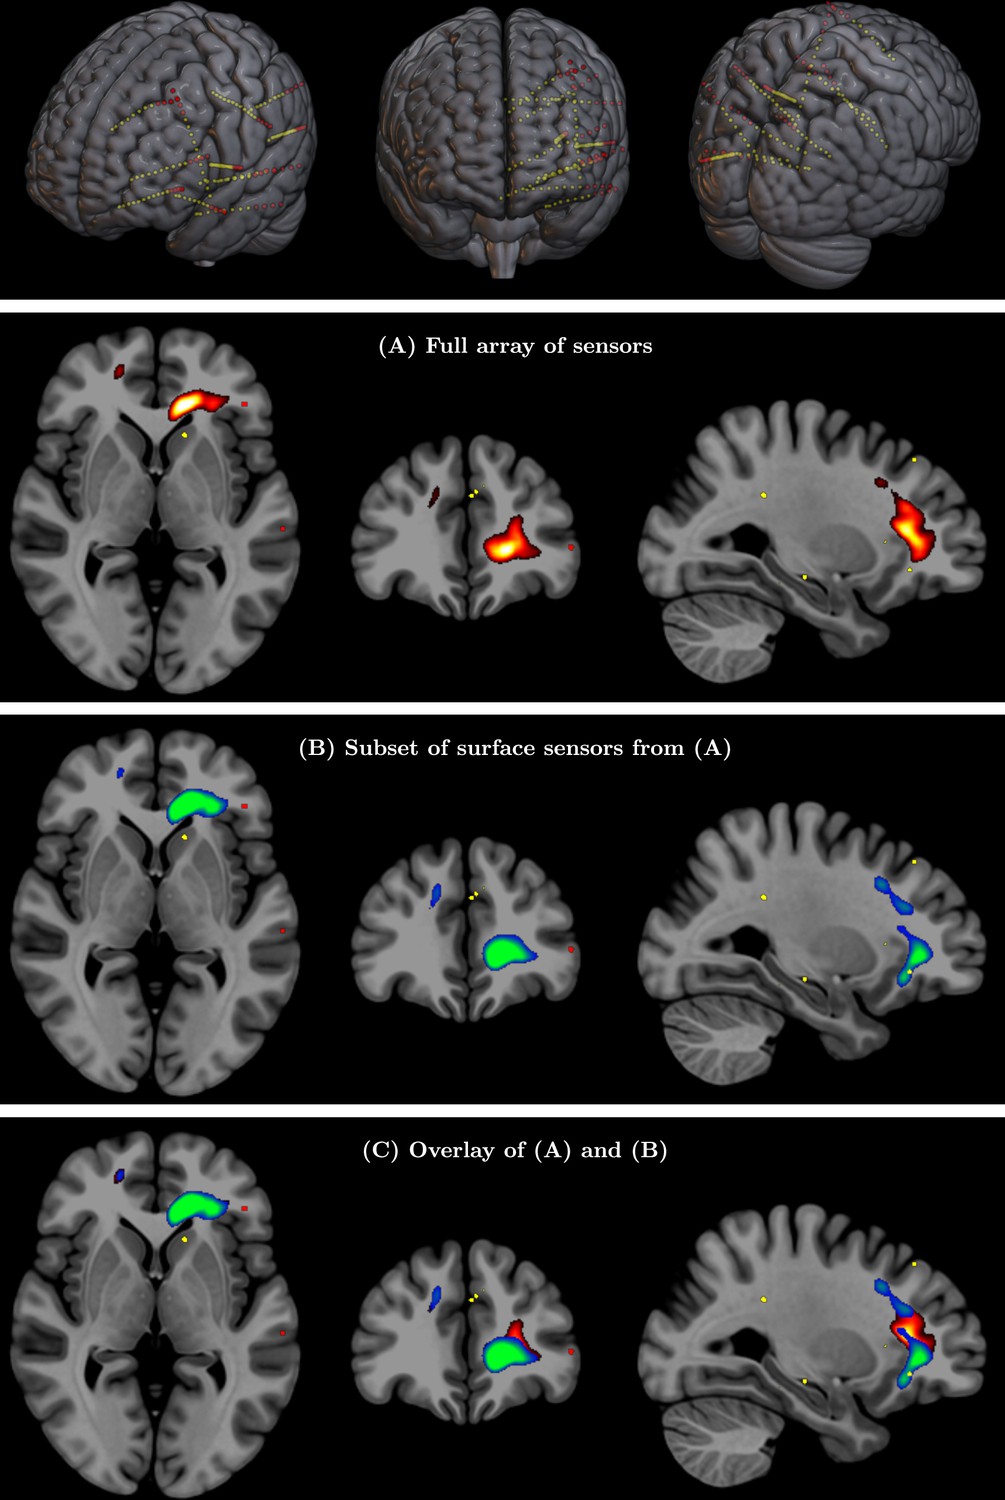
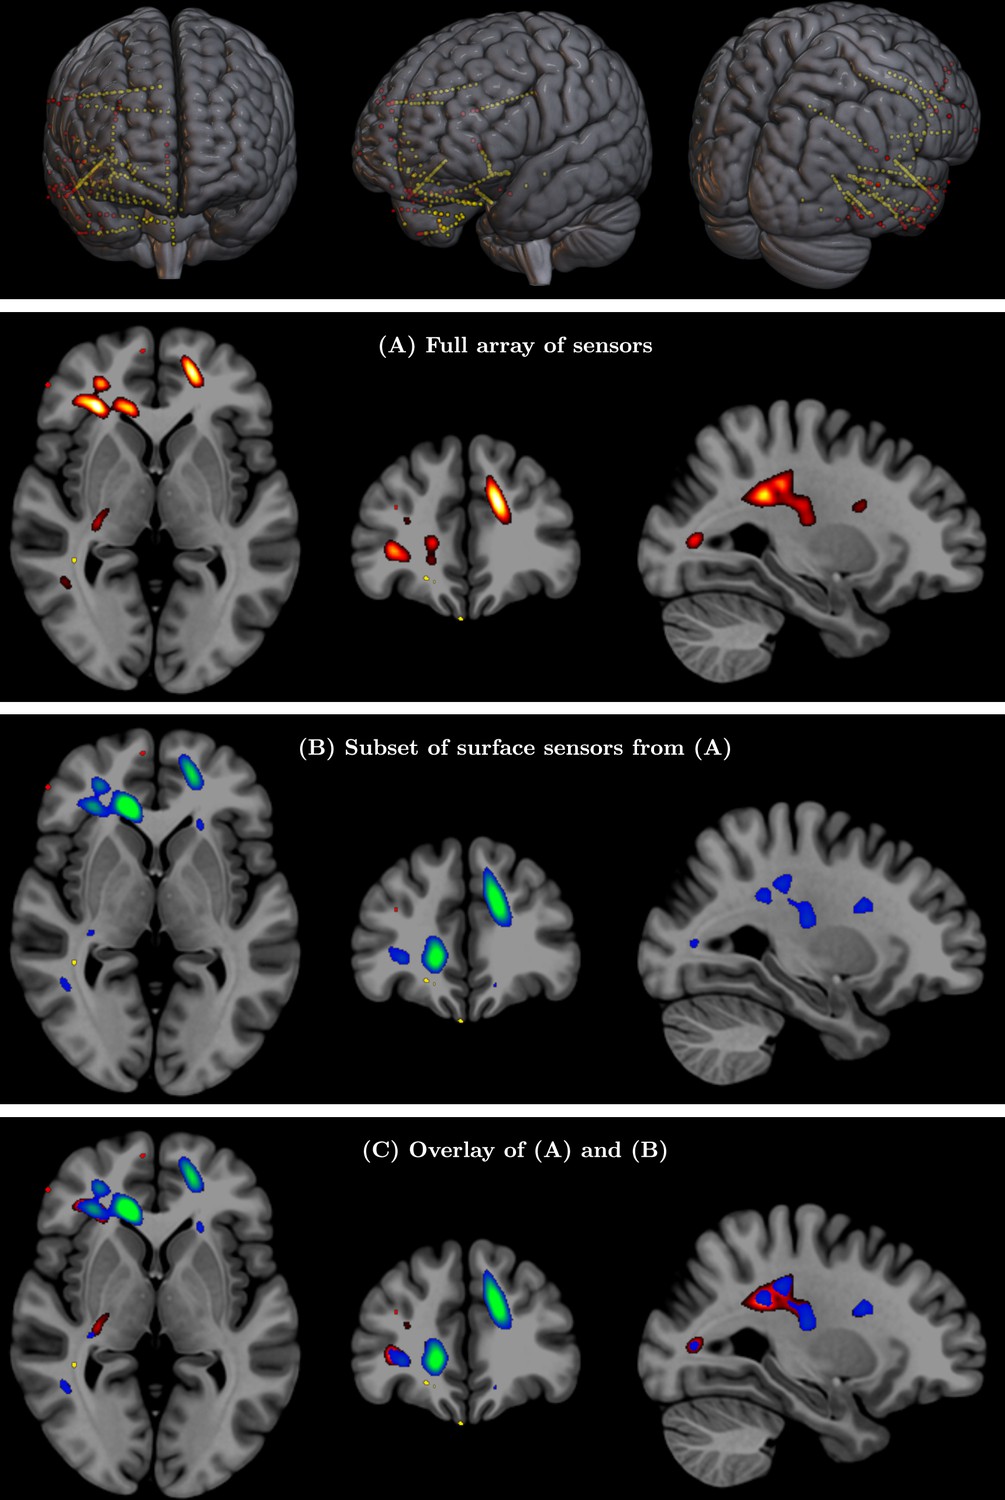
(Top row) Full array of intracranial electroencephalography (EEG) contacts from a recording in a medically refractory epilepsy patient (yellow dots).
Red dots indicate a subset of surface-only electrodes to mimic a standard noninvasive (i.e. extracranial) EEG study. SPatially resolved EEG Constrained with Tissue properties by Regularized Entropy (SPECTRE) alpha band reconstruction from (A) full array of intracranial EEG sensors from an epilepsy study (yellow dots) in top row and (B) from subset of surface electrodes (red dots) in top figure. (C) Overlay of (A) and (B) validating that the surface-based is correctly reconstructing the local electric field potential detected by the intracranial electrodes.
Figure 9

Statistical comparison of full vs surface intracranial electroencephalography (EEG) estimates.
The horizontal axis represents the correlation coefficients between the estimates obtained from the full set of electrodes and the deep electrodes (adjacent to the source). The vertical axis represents the correlation coefficients between the full set of electrodes and just the surface electrodes, as would be collected in a standard (extracranial) EEG experiment. The results are highly correlated and thus support the claim that the SPatially resolved EEG Constrained with Tissue properties by Regularized Entropy (SPECTRE) reconstruction of the spatial distribution of deep electrical activity from the surface measurements accurately reflects the true spatial localization of the deep electric fields.
Figure 10

Validation of weakly evanescent transverse cortical waves (WETCOW) model with intracranial measurements and SPatially resolved EEG Constrained with Tissue properties by Regularized Entropy (SPECTRE) reconstruction.
(Top) Examples of wave trajectories obtained in simulation of wave propagation in real data cortical fold tissue model. Panels (a, c) show the complete trajectories, and panels (d, e) show the emergent stable wave loops. The spherical cortex shell model is used for panels (a) and (d), and the cortical fold model is used for panels (b), (c), (e), and (f) (reprinted from Galinsky and Frank, 2020a, 2020 Massachusetts Institute of Technology. All rights reserved). The colors encode wave propagation: red - left/right, green - anterior/posterior and blue - dorsal/ventral. (Bottom) (left) EEG contacts and (right) detected WETCOW cortical loops from intracranial electroencephalography (iEEG) recordings of epileptic seizure onset in insular posterior opercular area.
© 2020, Massachusetts Institute of Technology. The spherical cortex shell model is used for panels (a) and (d) and the cortical fold model is used for panels (b),(c),(e), and (f) (reprinted from https://doi.org/10.1162/jocn_a_01611 with permission). It is not covered by the CC-BY 4.0 licence and further reproduction of this panel would need permission from the copyright holder.
Figure 11
Gambling task electroencephalography (EEG) from 500 subject cohort.
Alpha power of the weighted sum over the first n = 10 SPatially resolved EEG Constrained with Tissue properties by Regularized Entropy (SPECTRE) modes. Activation in key regions of the reward circuit, including the frontal lobes, paracingulate gyrus, accumbens, and amygdala, is clearly evident. Negative activation (i.e. deactivation) is evident in the supplementary motor cortex and the left temporal-parietal regions.
Figure 12
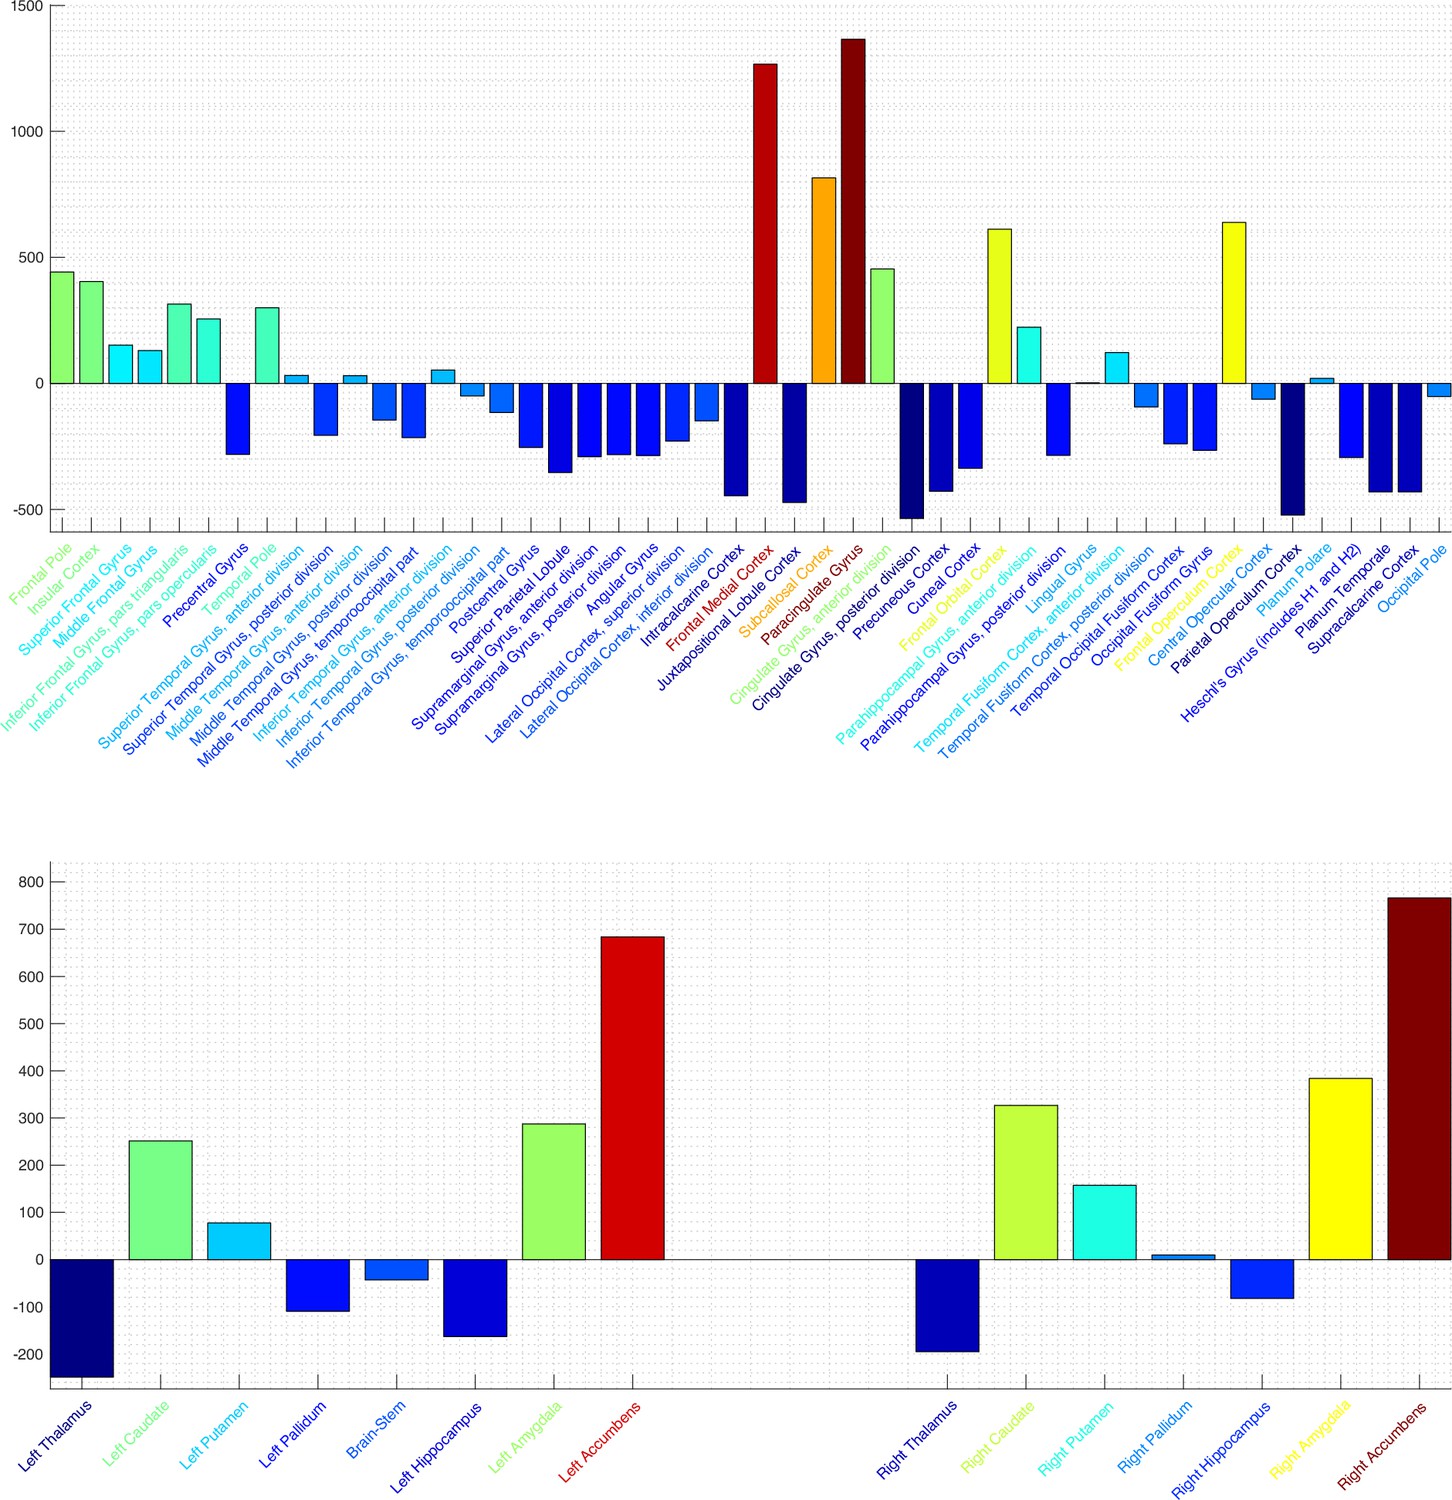
SPatially resolved EEG Constrained with Tissue properties by Regularized Entropy (SPECTRE) power per brain region in the Harvard-Oxford 2 mm cortical (top) and subcortical (bottom) atlases.
Colormap is from hot/yellow (activated) to blue (deactivated). Activation in key regions of the reward circuit, including the frontal lobes, paracingulate gyrus, subcallosal cortex/nucleus accumbens, and amygdala, is clearly evident. Negative activation (i.e. deactivation) is evident in the supplementary motor area, posterior cingulate, and thalamus. Activation of the important reward element accumbens is evident in the bottom plot. Also of note is the relatively similar activation in the bilateral subcortical elements.
Figure 13

Statistical significance.
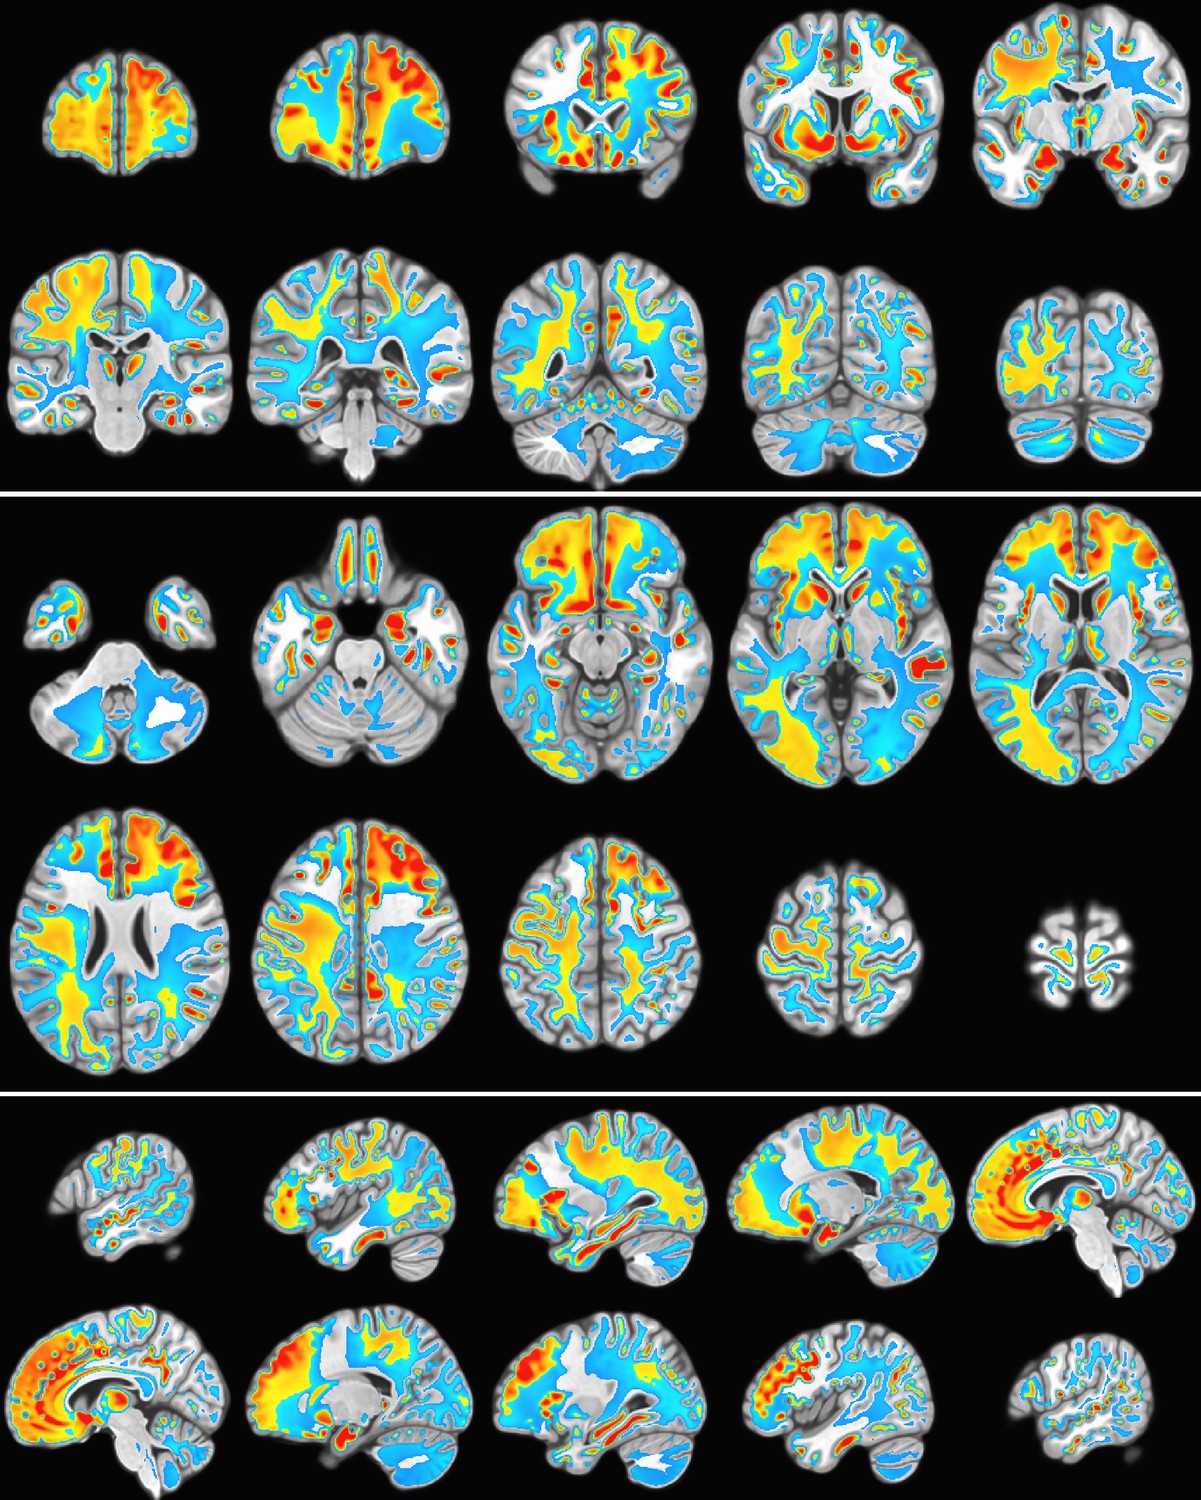
t-Statistic between the SPatially resolved EEG Constrained with Tissue properties by Regularized Entropy (SPECTRE) power modes pre- and poststimulus reward experiment. Calculations were performed using the standard AFNI 3dttest++ algorithm. Yellow/red color reflects positive changes, blue color reflects negative changes. Significance threshold was p=10−8, indicating strong statistical significance.
Appendix 1—figure 1

The significance of a detected spatiotemporal pattern.
Idealized numerical simulation in which there are two areas of activity in Gaussian random noise: a point oscillating with very high signal-to-noise (SNR) (centered on the red dot) but also a larger circular region with very low SNR (centered at the blue dot). Traditional estimation methods tend to favor high SNR signals (red dot) but have difficulty with low SNR activity with very high spatial correlations (blue dot). The entropy field decomposition (EFD) takes both spatial and temporal correlations into account and therefore detects both regions.
Appendix 1—figure 2
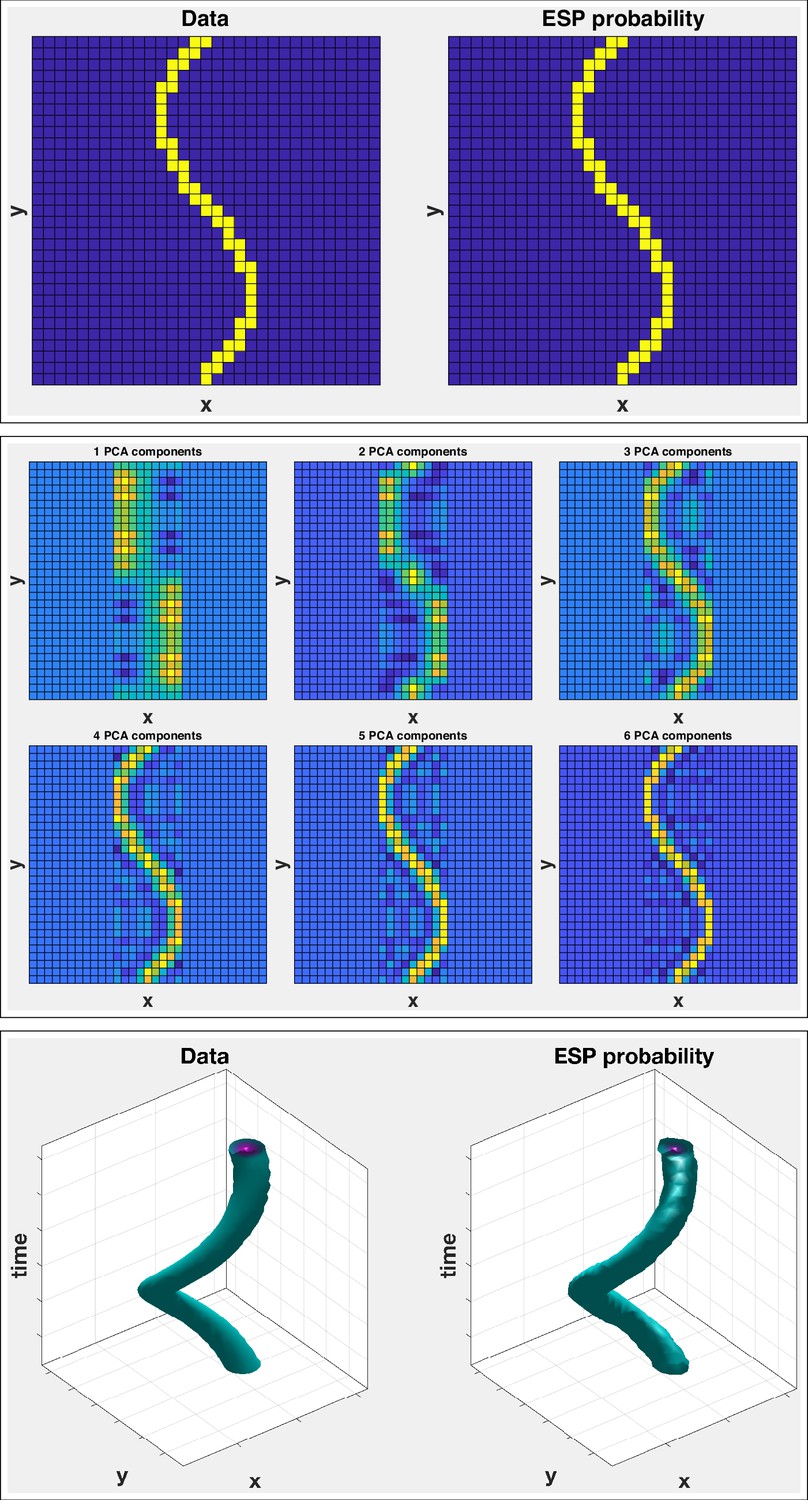
(Top left) Original lattice; (top right) entropy spectrum pathway (ESP) probability.
(Middle) Principal components analysis (PCA) results on same original lattice. The ESP probability locates the structure in a single calculation. The PCA decomposition, even for six components, shows significant errors. Several more components would be required to accurately fit the data. (Bottom row) Space-time ESP. (Top left) Space-time trajectory of 2D data; (top right) ESP probability.
Appendix 1—figure 3
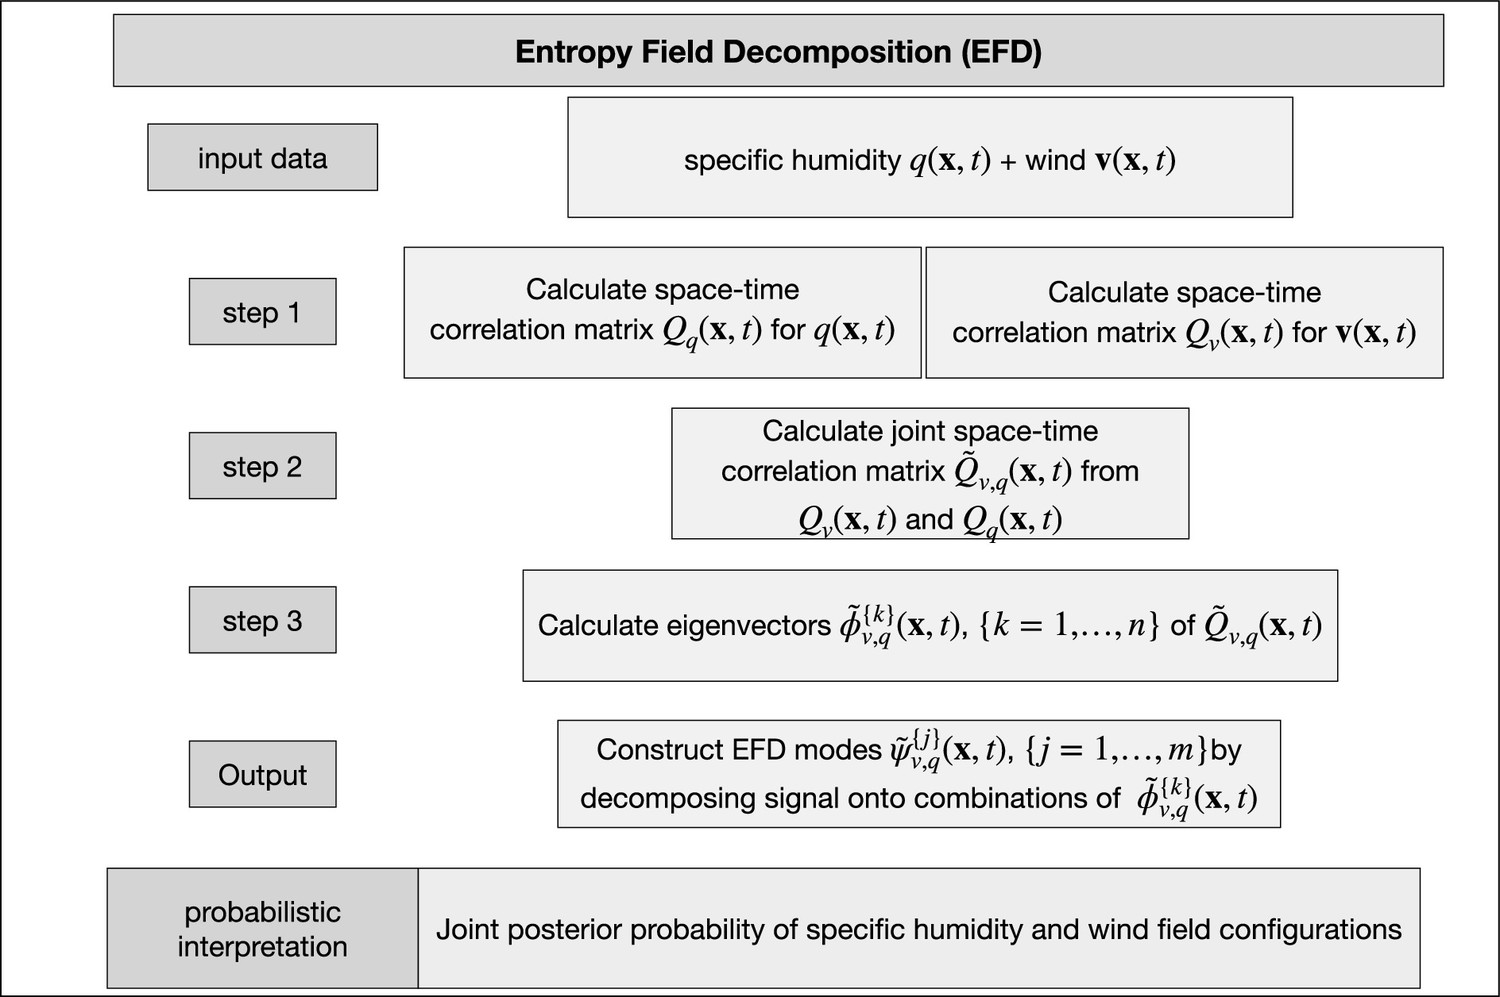
Schematic for the construction of space-time entropy field decomposition (EFD) modes from the data.
Appendix 2—figure 1
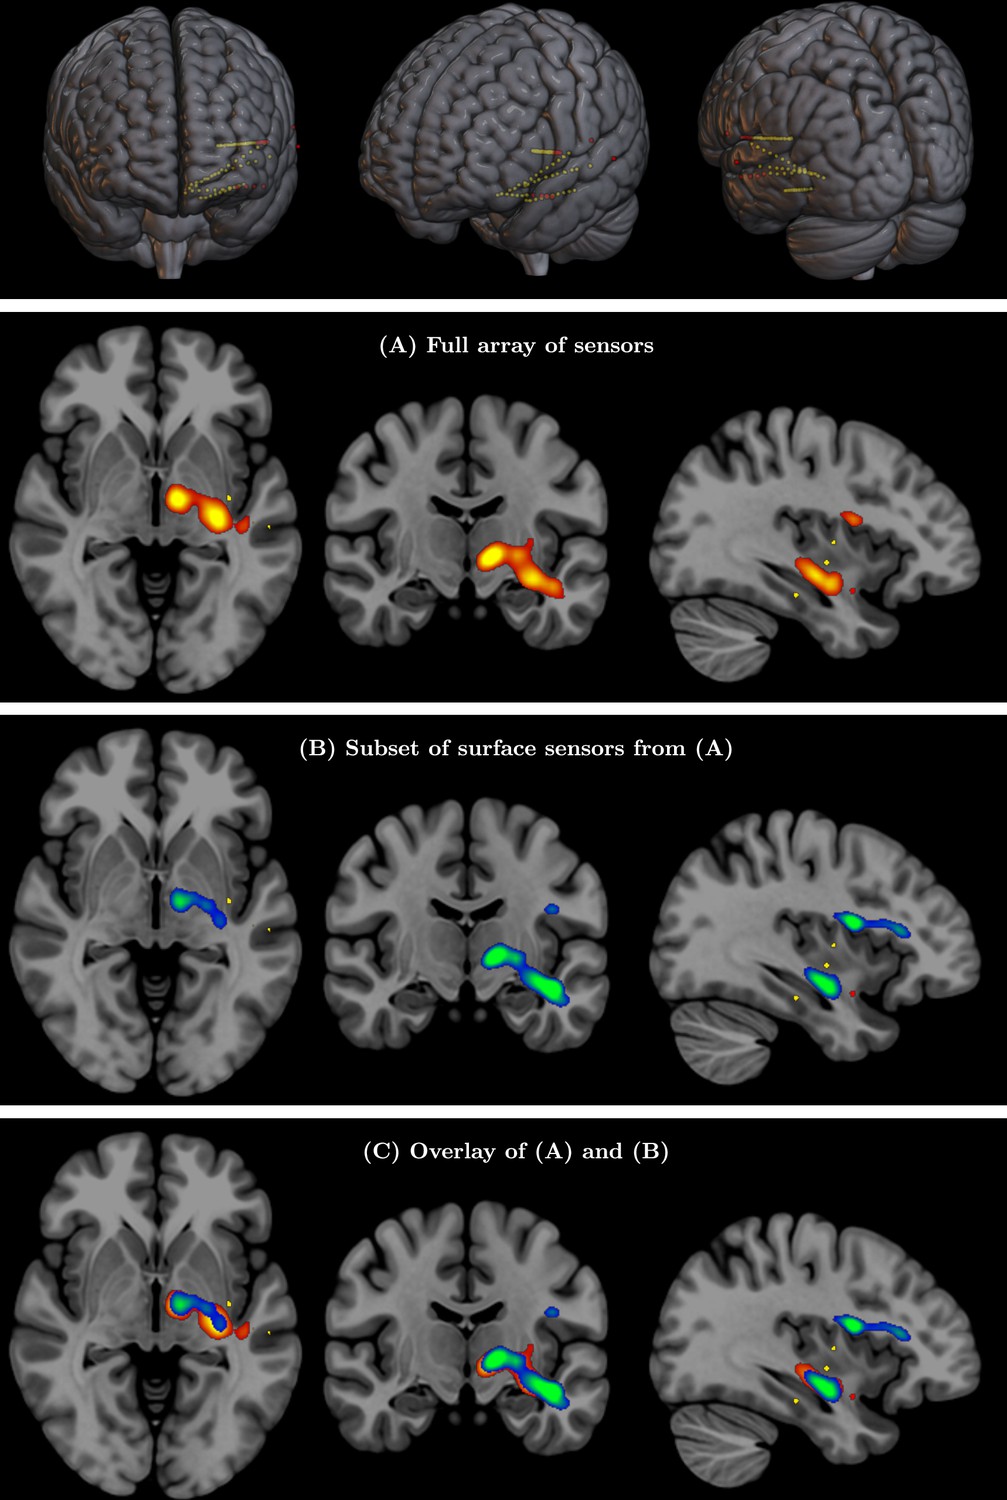
Validation of SPatially resolved EEG Constrained with Tissue properties by Regularized Entropy (SPECTRE) with intracranial electroencephalography (iEEG) data for Subject 2 (see Figure 8 for details).
Appendix 2—figure 2
Validation of SPatially resolved EEG Constrained with Tissue properties by Regularized Entropy (SPECTRE) with intracranial electroencephalography (iEEG) data for Subject 3 (see Figure 8 for details).
Appendix 2—figure 3

Validation of SPatially resolved EEG Constrained with Tissue properties by Regularized Entropy (SPECTRE) with intracranial electroencephalography (iEEG) data for Subject 4 (see Figure 8 for details).
Additional files
Download links
A two-part list of links to download the article, or parts of the article, in various formats.
Downloads (link to download the article as PDF)
Open citations (links to open the citations from this article in various online reference manager services)
Cite this article (links to download the citations from this article in formats compatible with various reference manager tools)
Imaging of brain electric field networks with spatially resolved EEG
eLife 13:RP100123.
https://doi.org/10.7554/eLife.100123.3


