Knockout of Slo2.2 enhances itch, abolishes KNa current, and increases action potential firing frequency in DRG neurons
- Washington University School of Medicine, United States
Figures
Figure 1
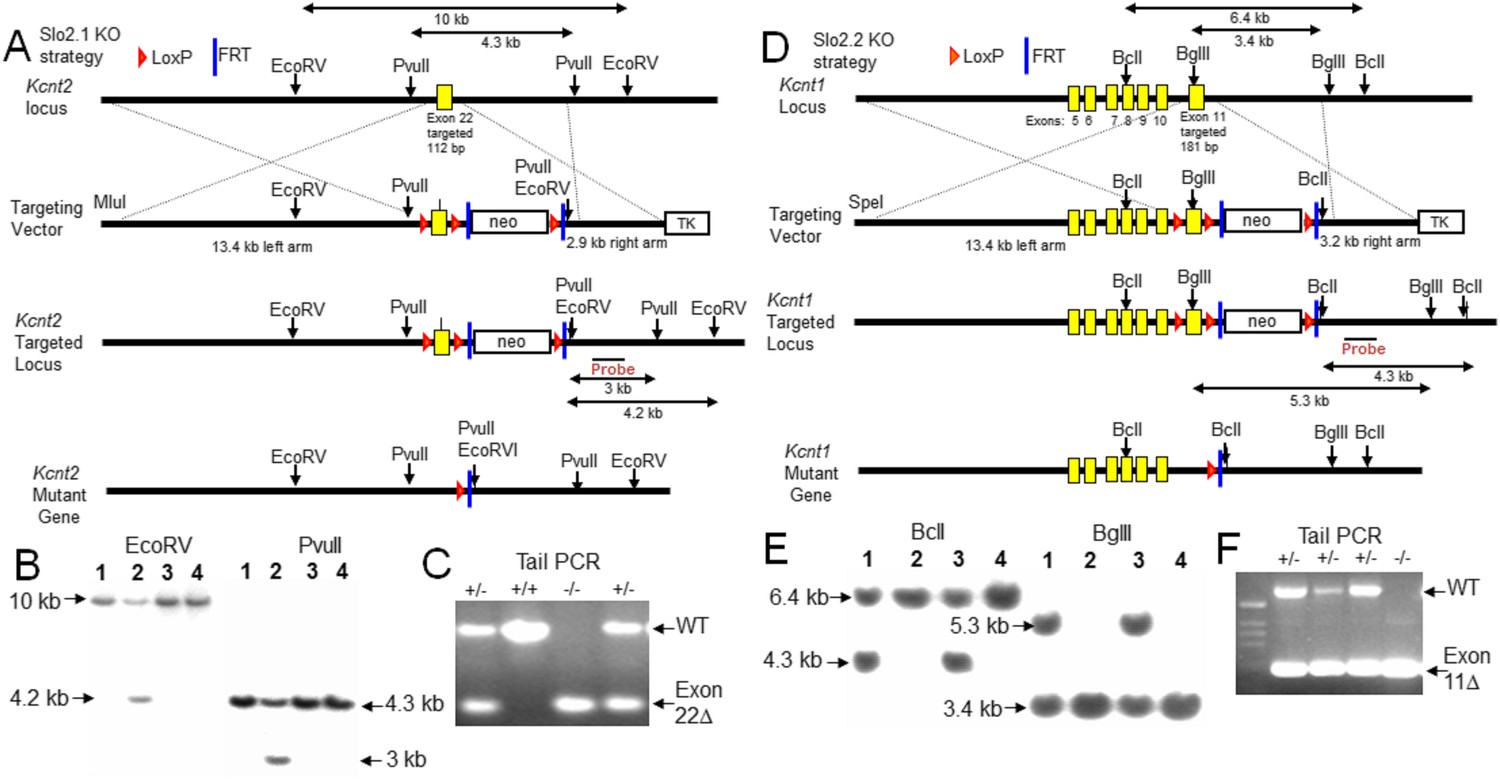
Construction and validation of Slo2.1 and Slo2.2 KO mice.
(A) Upper row: map of WT mouse Kcnt2 (encoding Slo2.1) gene locus within genomic DNA bracketing the targeted exon 22. Second row: map of the targeting vector, showing M1uI site for vector linearization, targeted exon 22 with a 1.8 kb neomycin gene cassette flanked by LoxP and FRT sites, and a 2.8 kb thymidine kinase (TK) gene cassette. The overall size of the Kcnt2 genomic DNA for homologous recombination (left arm + right arm) is 16.3 kb. Third row: map of the recombinant allele in targeted embryonic stem (ES) clones following homologous recombination of the Kcnt2 KO region into the targeted locus. The neo gene cassette is eliminated by Flp-FRT mediated deletion. Fourth row: map of the mutant kcnt allele following Cre-loxP mediated deletion of the targeted exon. Shown are the elements and restriction enzyme sites used in generation and verification of the targeted mutant allele. Location of the probe used in genomic Southerns for the selection of recombinant ES clones is indicated. After enzyme digestion treatments, the WT allele fragments detected by the probe are 10 kb (by EcoRV) and 4.3 kb (by PvuII), while the recombinant allele fragments detected by the probe are 4.2 kb (by EcoRV) and 3 kb (by PvuII), respectively. (B) Genotype analysis of ES cell lines by Southern blot analysis. After enzyme digestion with either EcoRV (left) or PvuII (right), genome DNA obtained from recombinant ES colonies, containing both wild type allele and targeted recombinant allele, shows two corresponding fragments identified by the probe. (C) PCR verification of animal genotypes. The target exon is removed by mating heterozygous (HET) F1 mice with early embryonic expression Cre-mice (EIIa-Cre, Jackson). The predicted amplicons are 579 bp for WT and 269 bp for the exon 22 deleted mutant. (D) Upper row: map of WT mouse Kcnt1 (encoding Slo2.2) gene locus bracketing the targeted exon 11. Second row: map of the targeting vector, showing SpeI site for vector linearization, targeted exon 11 and a 1.8 kb neomycin gene cassette flanked by LoxP and FRT sites, and a TK gene cassette. The overall size of Kcnt1 genomic DNA for homologous recombination is 16.6 kb. Third row: map of the recombinant allele in targeted ES clones following homologous recombination of the kcnt1 region into the targeted locus. The neo gene cassette is then eliminated by Flp-FRT mediated deletion. Fourth row: map of the mutant Kcnt1 allele following Cre-loxP mediated deletion of the targeted exon. The location of the probes used in genomic Southerns are also indicated. After enzyme digestion treatments, the WT allele fragments detected by the probe are 6.4 kb (by BclI) and 3.4 kb (by BglII), while the recombinant allele fragments detected by the probe are 4.3 kb (by BclI) and 5.3 kb (by BglII) respectively. (E) Genotype analysis of ES cell lines by Southern blot analysis. Expected fragment sizes for either BclI (left) or BglII (right) restriction enzyme digestion are shown for both wild type and targeted homologous recombinant. (F) PCR verification of Kcnt1 exon 11 deletion. The target exon is removed by mating HET F1 mice with early embryonic expression Cre-mice (EIIa-Cre, Jackson). The predicted amplicons for WT and the exon 11 deleted mutant were 607 bp and 200 bp, respectively.
Figure 2

Slo2.1 and Slo2.2 subunits are absent in Kcnt2 and Kcnt1 KO mice, respectively, exhibit differential tissue distribution, and coassemble in some tissue.
(A) Top, brain membrane proteins from WT, Slo2.1 KO, and Slo2.2 KO mice were probed with N11/33 anti-Slo2.1 antibody (Antibodies Inc.). Middle, brain membrane proteins were separated and probed with N3/26 anti-Slo2.2 mAb (Antibodies, Inc). Slo2.2 protein is absent in Slo2.2 KO mice. No native Slo2.2 protein is present in the Slo2 KO mice, but is found in Slo2.1 KO mice. Bottom, α-tubulin loaded in each lane was probed with anti-α-tubulin Ab. 15 μg of whole brain membrane proteins were loaded in each lane. (B) Slo2.1 Ab pulls down Slo2.1 protein from brain membrane proteins in WT and Slo2 KO mice, but not from Slo2.1 KO mice. Anti-Slo2.1 Ab also pulls down Slo2.1 from proteins following mixing of separate Slo2.2 KO and Slo2.1 KO membrane preparations (mix). 25 μg of whole brain proteins were subjected to IP procedures and the IP products were loaded in each lane. (C) IP with anti-Slo2.1 Ab pulls down Slo2.2 only in WT membrane proteins, but not in mixed proteins, or membrane proteins from Slo2.1 KO or Slo2.2 KO mice. 62.5 μg of whole brain proteins were subjected to IP procedures with the IP products loaded in each lane. (D) Following IP with anti-Slo2.2, Slo2.2 is detected in proteins from WT, mixed, and Slo2.1 KO membranes. 25 μg of whole brain proteins were subjected to IP procedures and the products loaded in each lane. (E) IP with anti-Slo2.2 Ab pulls down Slo2.1 only from WT membrane proteins. 62.5 μg of whole brain proteins was subjected to IP procedures and the products loaded in each lane. (F1) Abundance of message for Slo2.1 relative to β-actin message is plotted for various tissues. Here and in (F2), message was measured in triplicate from each of three mice. (F2) Slo2.2 message abundance is plotted. (F3) The ratio of message for Slo2.1 to Slo2.2 measured by quantitative rt-PCR is shown for various tissues. Dotted line indicates approximately equimolar RNA amounts. Red arrows highlight enrichment of Slo2.2 message. Horizontal blue bar and arrow highlight relative enrichment of message for Slo2.2 in heart tissues. (G) IP with anti-Slo2.1 shows presence of Slo2.1 protein in DRG, spinal cord, cortex and heart, but not cerebellum. Protein amounts used in IPs were: DRG, 3 mg; spinal cord, 1 mg; cortex, 0.3 mg; cerebellum; 2 mg; heart, 30 mg. (H) IP with anti-Slo2.2 pulls down Slo2.1 in DRG, spinal cord and cortex, but not in cerebellum and heart. Protein amounts used in IPs were: DRG, 3 mg; spinal cord, 1 mg; cortex, 0.5 mg; cerebellum; 0.25 mg; heart, 30 mg. (I) IP with anti-Slo2.1 pulls down Slo2.2 in spinal cord and cortex. (J) IP with anti-Slo2.2 shows presence of Slo2.2 in all tested tissues except heart. Western blots were repeated three times in all cases, except twice for DRG.
Figure 3
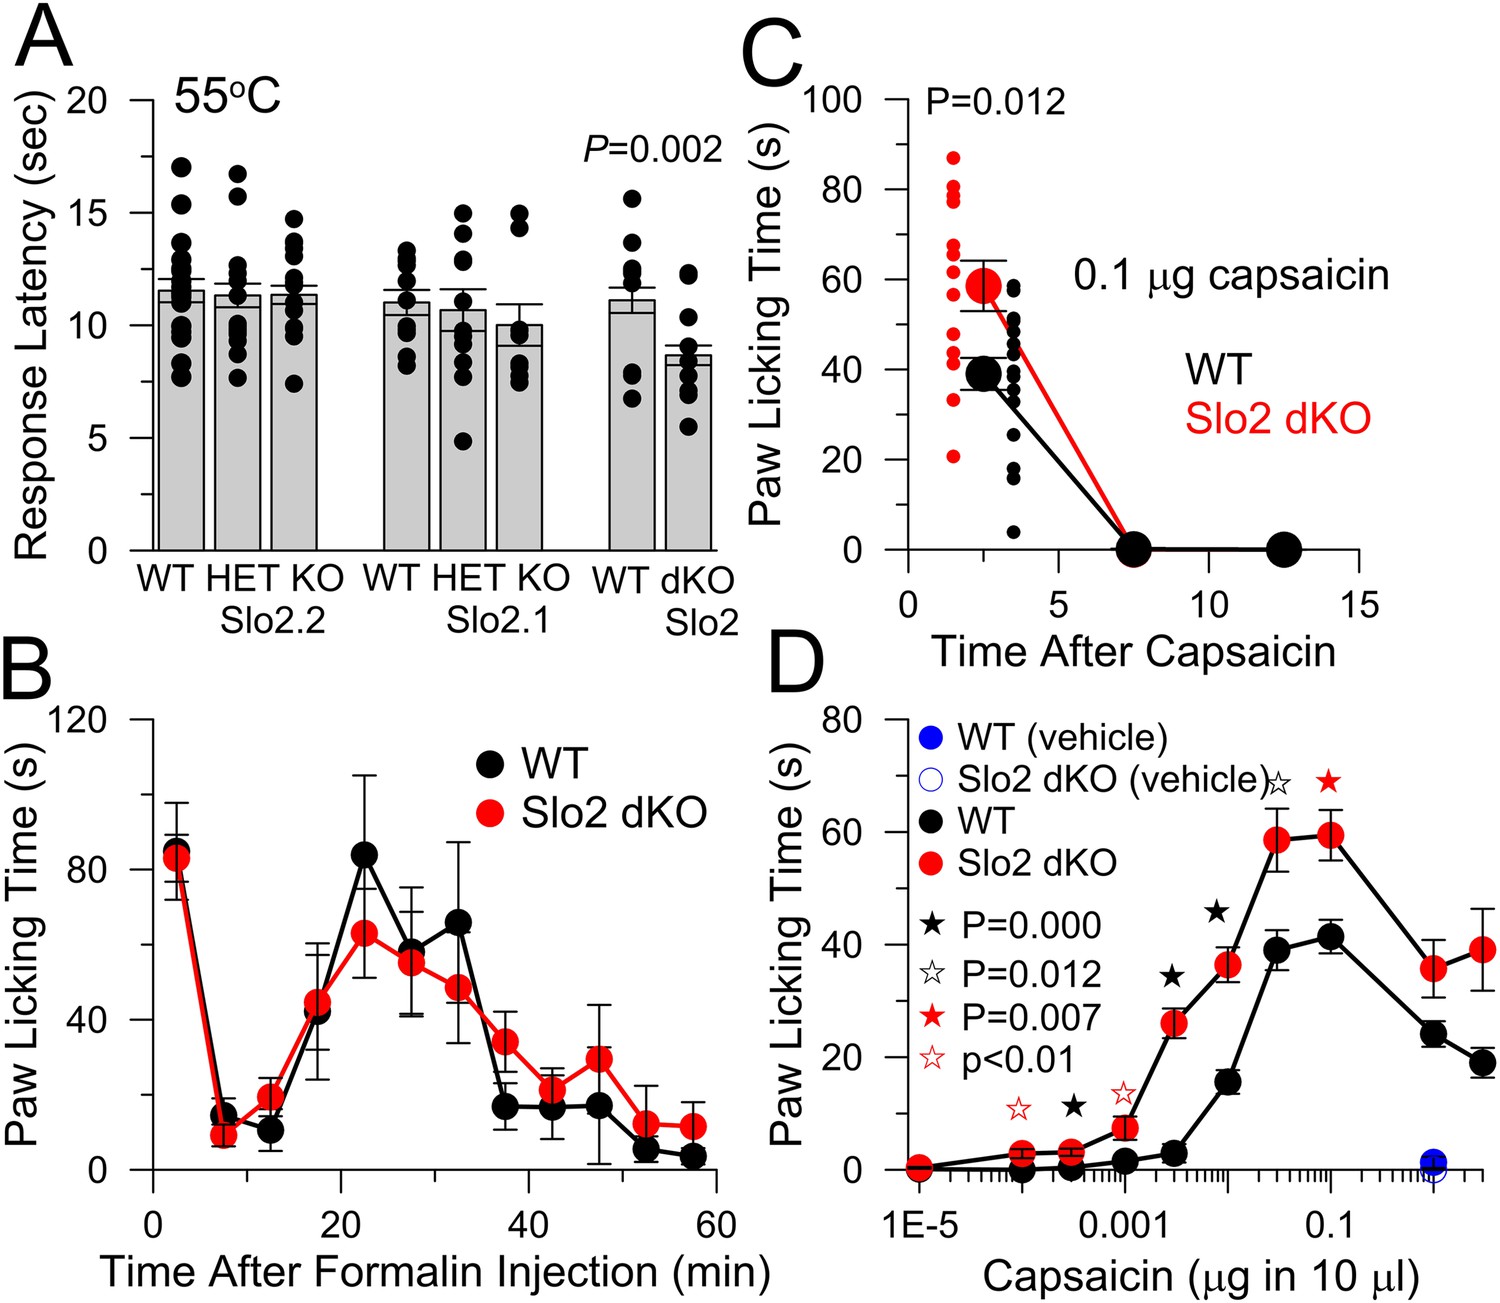
Slo2 dKO shortens hotplate response latency, increases responses to hindpaw injections of capsaicin, but does not influence formalin responses.
(A) Latencies to aversive response following placement on a 55°C hotplate are plotted for the indicated genotypes, showing means, sem, and individual latencies. From left to right, n = 19, 19, 24, 11, 13, 9, 17, and 24. Only in the WT vs Slo2 dKO comparison was a difference noted (p = 0.002; KS test). (B) Following formalin injection, time spent in licking the hindpaw was determined for 5 min intervals for WT (n = 10) and Slo2 dKO (n = 9) mice. Here and below, behavioral tests over time display measurements centered in each 5 min interval. (C) Time course of licking response to hindpaw injection of 0.1 μg capsaicin. Small symbols, individual mice. p = 0.012 (KS test). Vehicle: 10 μl volume with 0.35% EtOH. (D) Time spent licking was determined over 10 min following hindpaw injections of the indicated capsaicin quantities in 10 μl vehicle for WT (n = 9, 9, 20, 20, 18, 20, 20, 20, 20, and 9 from low to high capsaicin) and Slo2 dKO (n = 10, 10, 11, 9, 14, 26, 13, 18, 10, and 10) genotypes. Vehicle alone was without effect (n = 10 for both WT and Slo2 dKO). For filled black, open black, and filled red stars, p values correspond to KS statistic with p = 0.000 (filled black stars), p = 0.007 (filled red stars), and p = 0.012 for open black star. For open red stars, a t-test statistic was used with p < 0.01. Highest capsaicin concentrations showed no difference between WT and Slo2 dKO mice.
Figure 4 with 1 supplement
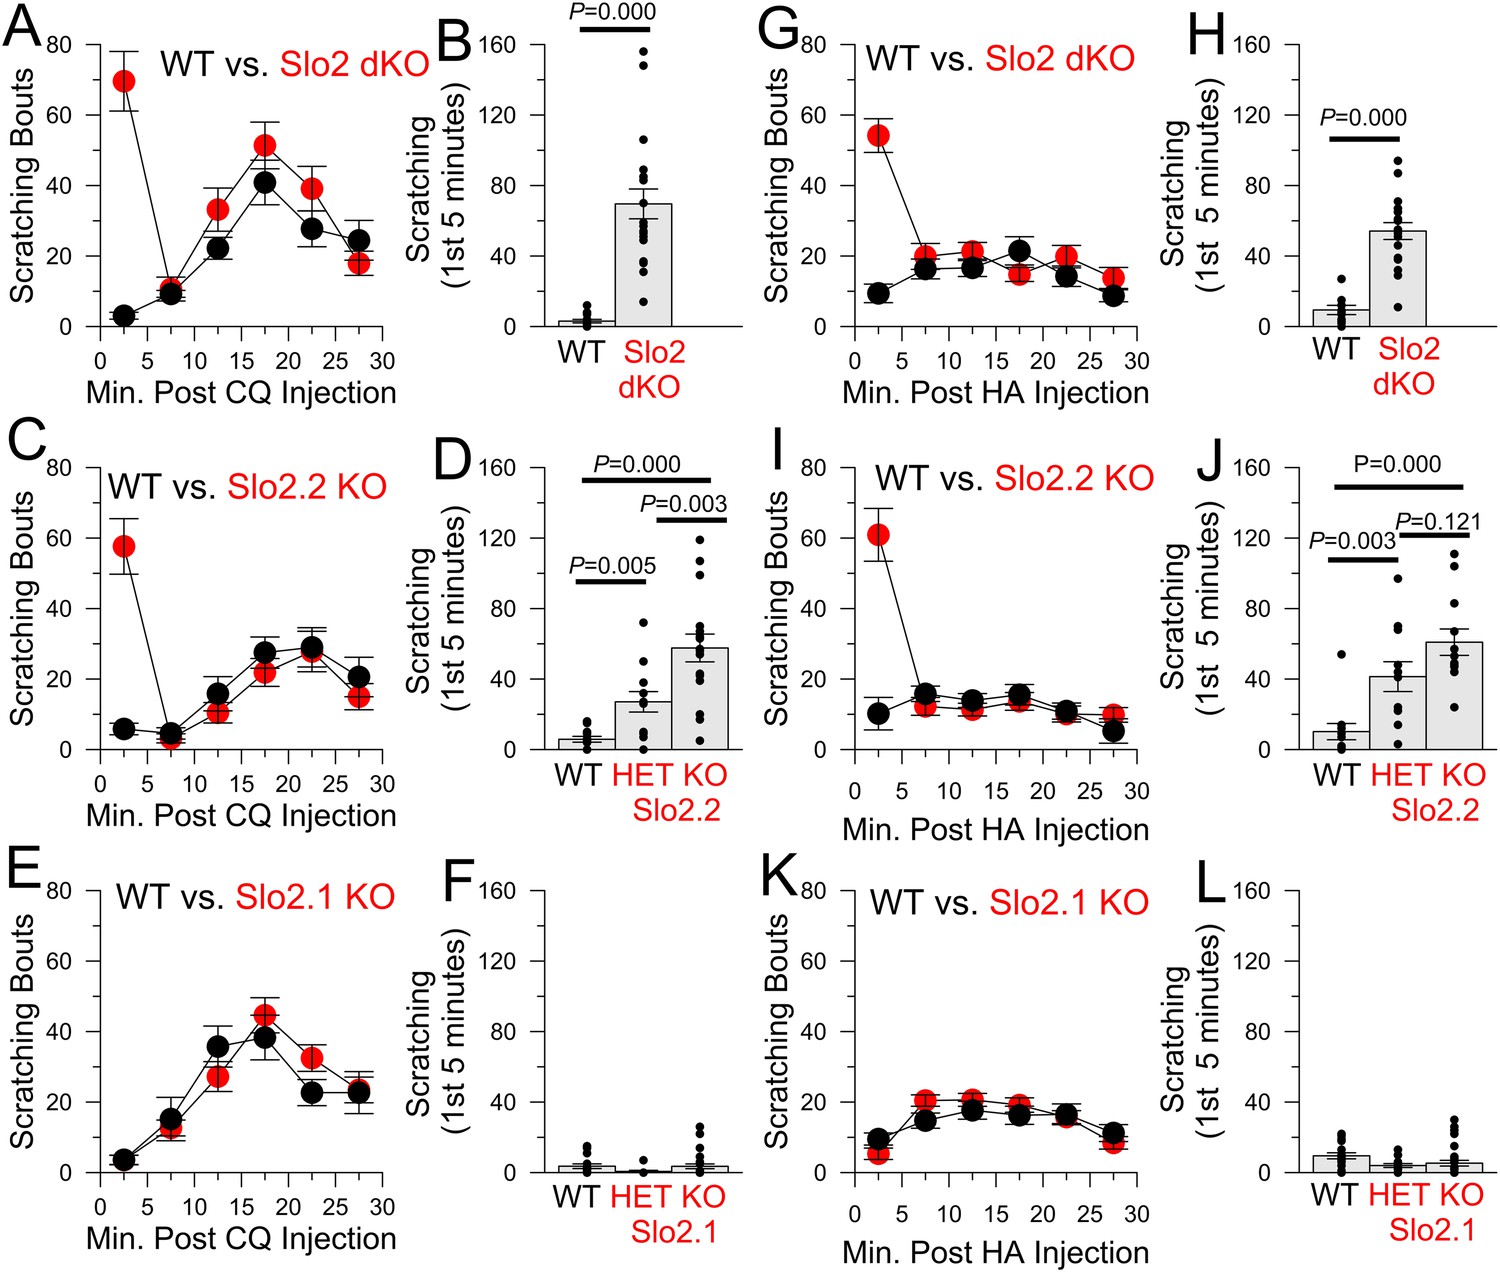
The absence of Slo2.2, but not Slo2.1, results in enhancement of chloroquine (CQ) and histamine (HA)-induced itch.
(A) Each point shows mean number of scratching bouts per 5 min bins for WT mice (n = 15, black circles) and Slo2 dKO mice (n = 19, red circles) after injection of 200 μg CQ. (B) Mean scratching bouts during first 5 min are summarized for WT and Slo2 dKO mice from (A), along with determinations from individual mice (circles). Over the first 5 min, WT and Slo2 dKO mice differ at p = 0.000 (KS-test). (C) Slo2.2 KO mice exhibit enhanced responsiveness to CQ injection. (D) Mean scratching bouts during the first 5 min after CQ injection for WT (n = 12), Slo2 HET mice (n = 12) and Slo2.2 KO mice (n = 16). KS-test comparisons: WT vs Slo2.2 HET, p = 0.005; WT vs Slo2.2 KO, p = 0.000; Slo2.2 HET vs Slo2.2 KO, p = 0.003. (E) Slo2.1 KO mice exhibit CQ responsiveness identical to WT mice. (F) Mean scratching during the first 5 min after CQ injection for WT (n = 16), Slo2.1 HET (n = 11) and Slo2.1 KO (n = 16) mice. (G) Responses of WT (n = 15) and Slo2 dKO (n = 18) mice following injection of 1 mg HA. (H) Scratching during first 5 min following HA injection for WT and Slo2 dKO mice. Over the first 5 min, WT and Slo2 dKO mice differ at p = 0.000. (I) HA-induced scratching behavior for WT and Slo2.2 KO mice. (J) Mean and individual values of scratching during first 5 min for WT (n = 11), Slo2.2 HET (n = 11), and Slo2.2 KO (n = 12) mice. KS-test comparisons: WT vs Slo2.2 HET, p = 0.003; WT vs Slo2.2 KO, p = 0.000; Slo2.2 HET vs Slo2.2 KO, p = 0.121. (K) HA-induced scratching behavior for WT and Slo2.1 KO mice. (L) Mean and individual values of scratching during first 5 min for WT (n = 19), Slo2.1 HET (n = 13), and Slo2.1 KO (n = 30) mice.
Figure 4—figure supplement 1
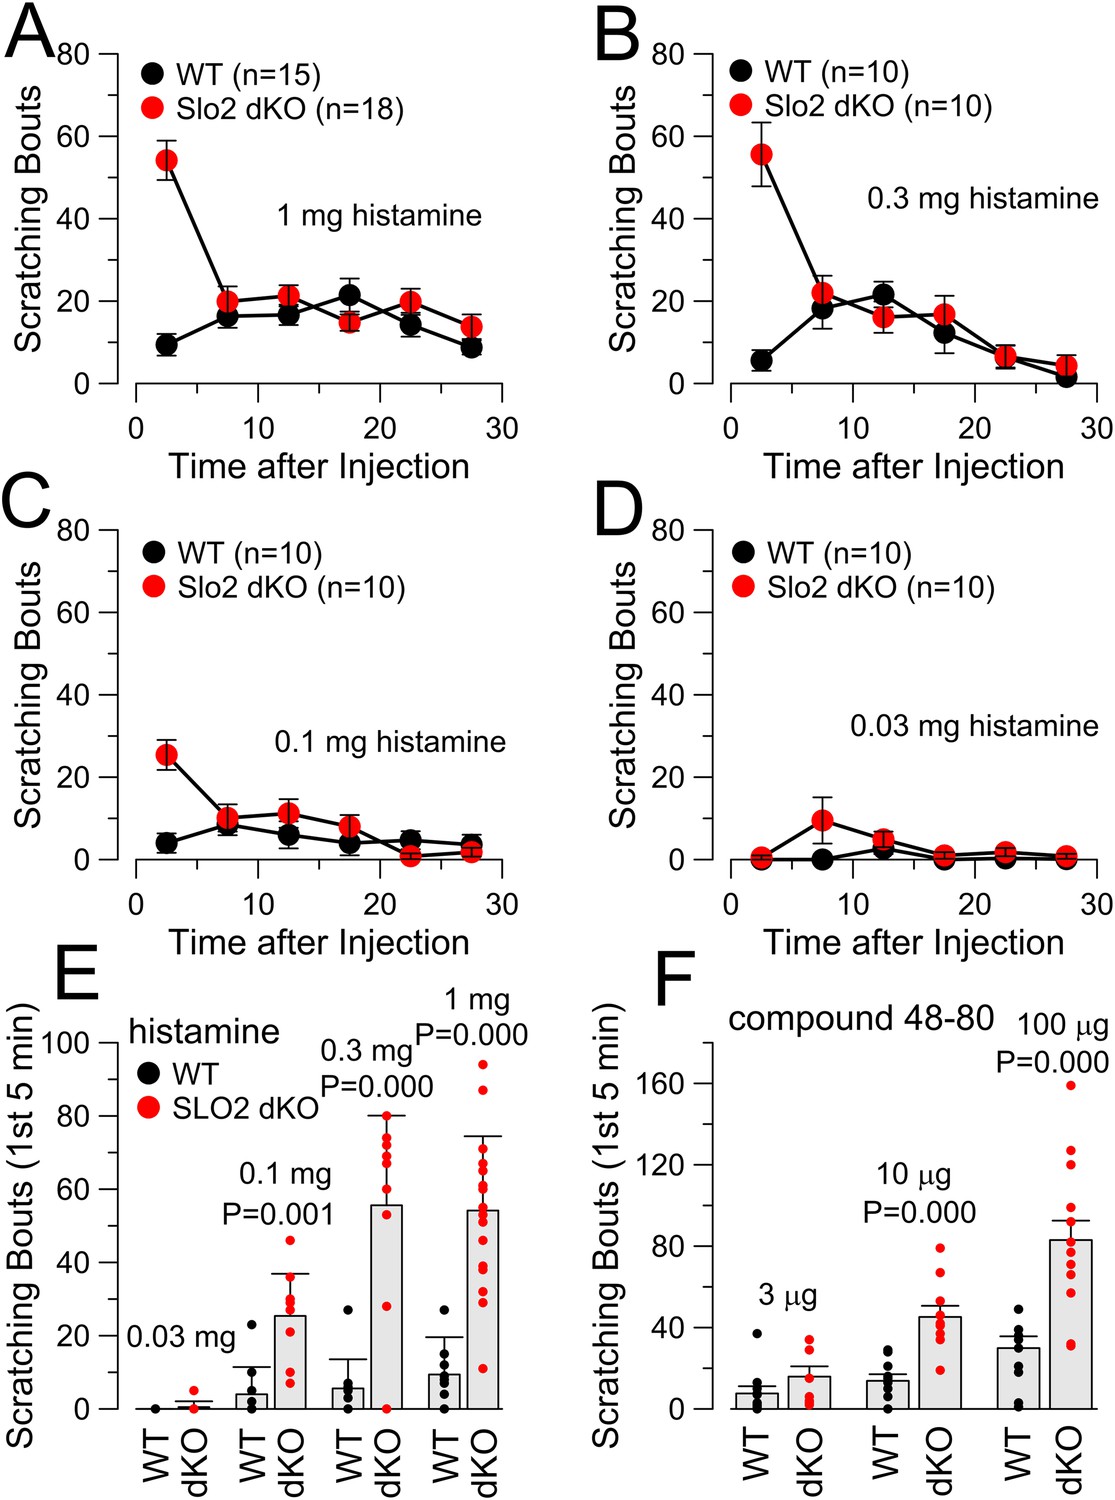
Concentration-dependence of itch response to HA and compound 48–80.
(A) Scratching behavior in WT and Slo2 dKO mice is plotted following injection of 1 mg HA. (B) Scratching behavior after 0.3 mg HA is compared. (C) Scratching behavior after 0.1 mg HA is displayed. (D) Scratching behavior after 0.03 mg HA is shown. (E) Dose-response relationship for HA injections is displayed showing individual estimates and mean responses for WT and Slo2 dKO mice during first 5 min after injection. p values are the KS statistic. Numbers of animals in each case are given in A–D. (F) Dose-response relationship for compound 48–80 injection is compared. p values reflect the KS statistic. At 3 μg, 10 WT mice were compared to 8 dKO mice; at 10 μg, 10 WT were compared to 10 dKO; at 100 μg, 10 WT were compared to 14 dKO mice.
Figure 5
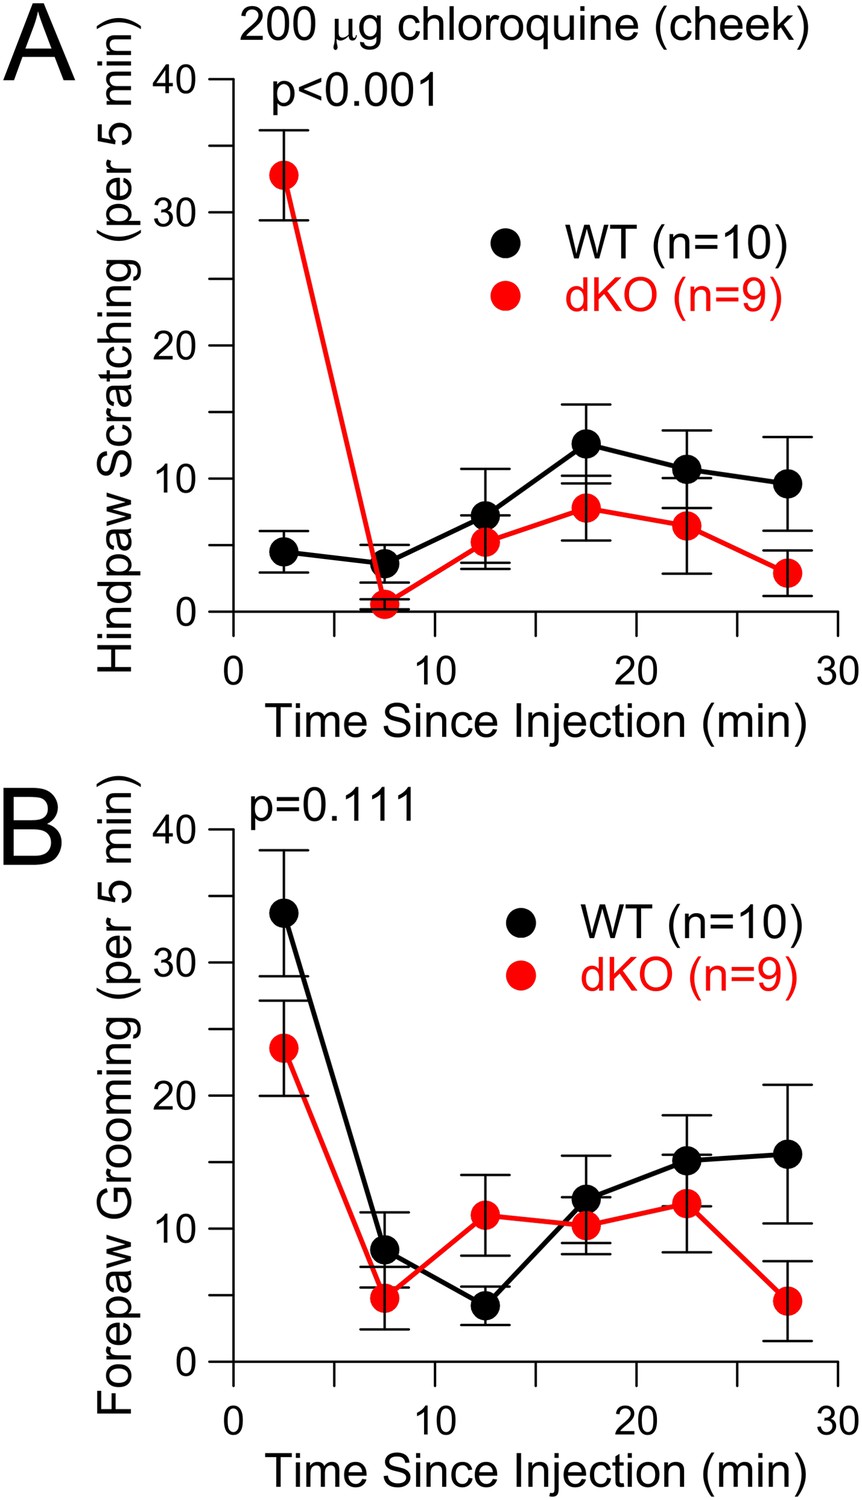
CQ enhances itch-type behavior following cheek injection, but not pain-type behavior.
(A) Total scratching bouts using the hindpaw to scratch the cheek was monitored following cheek injection of 200 μg CQ in WT and Slo2 dKO mice. During the first 5 min interval, distributions differed at p < 0.001 (Student's t-test). (B) Bouts of forepaw grooming were monitored following CQ cheek injection for WT and Slo2 dKO mice. There was no difference in the first 5 min.
Figure 6 with 5 supplements
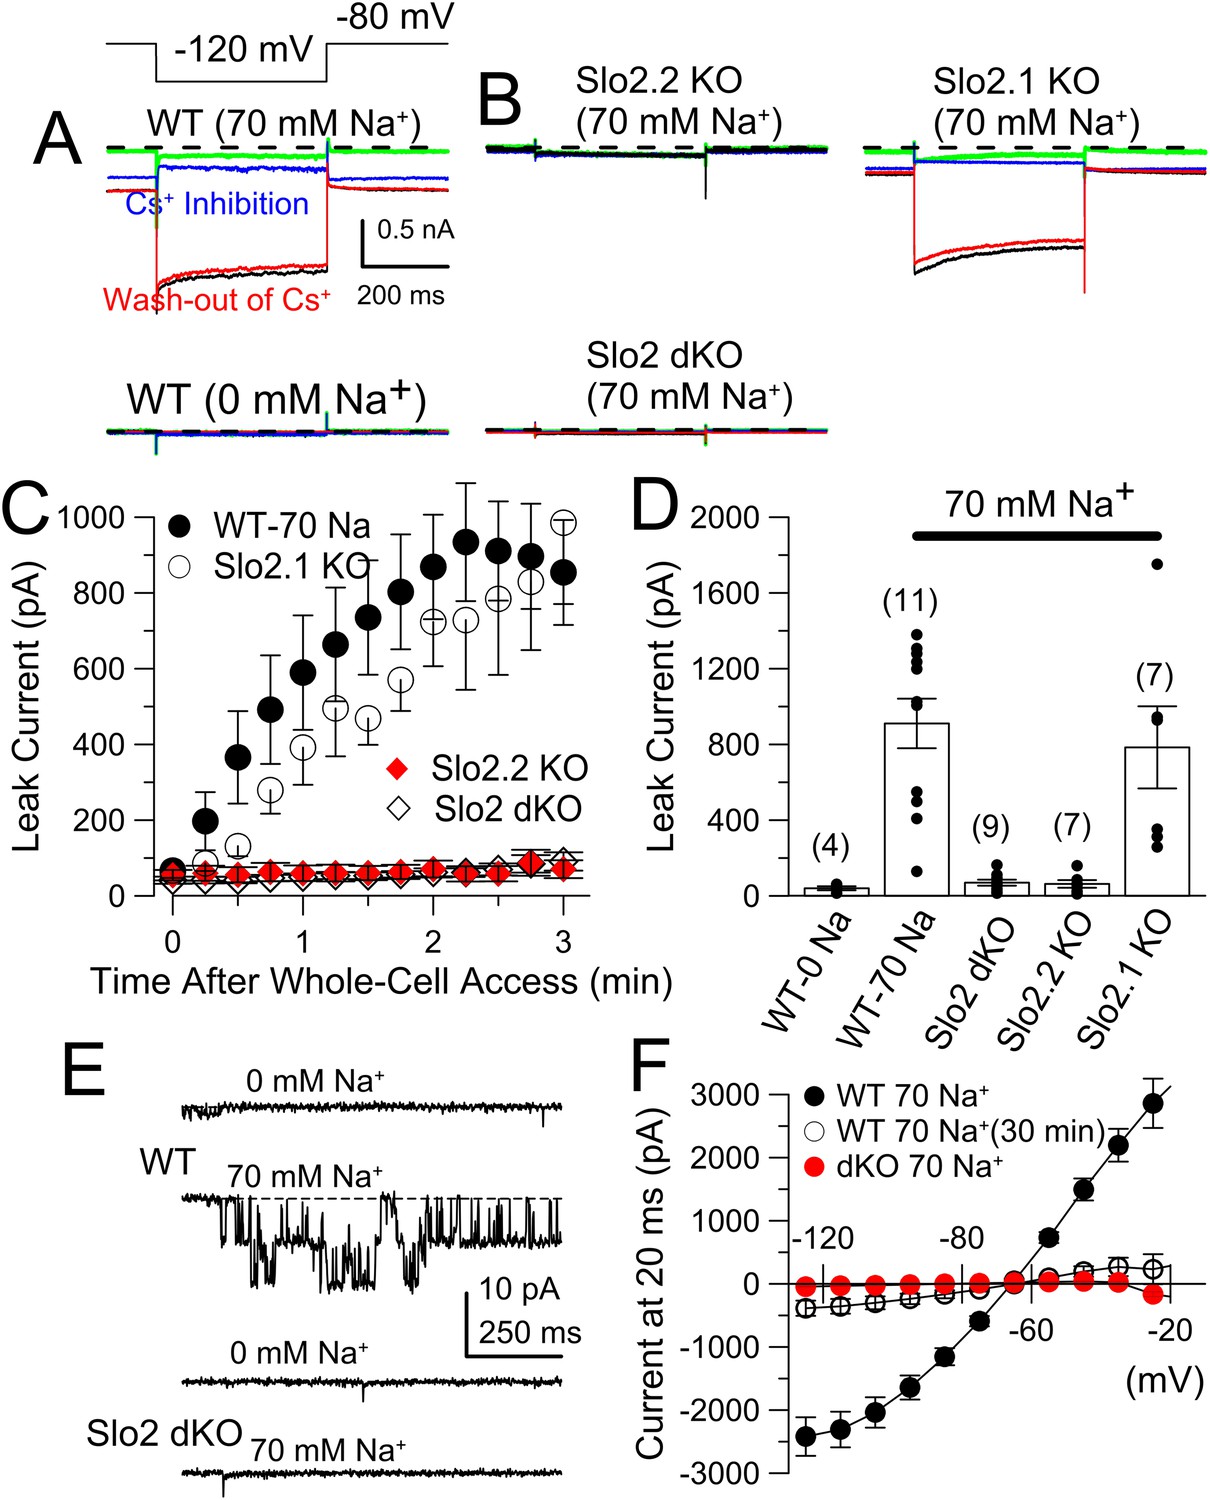
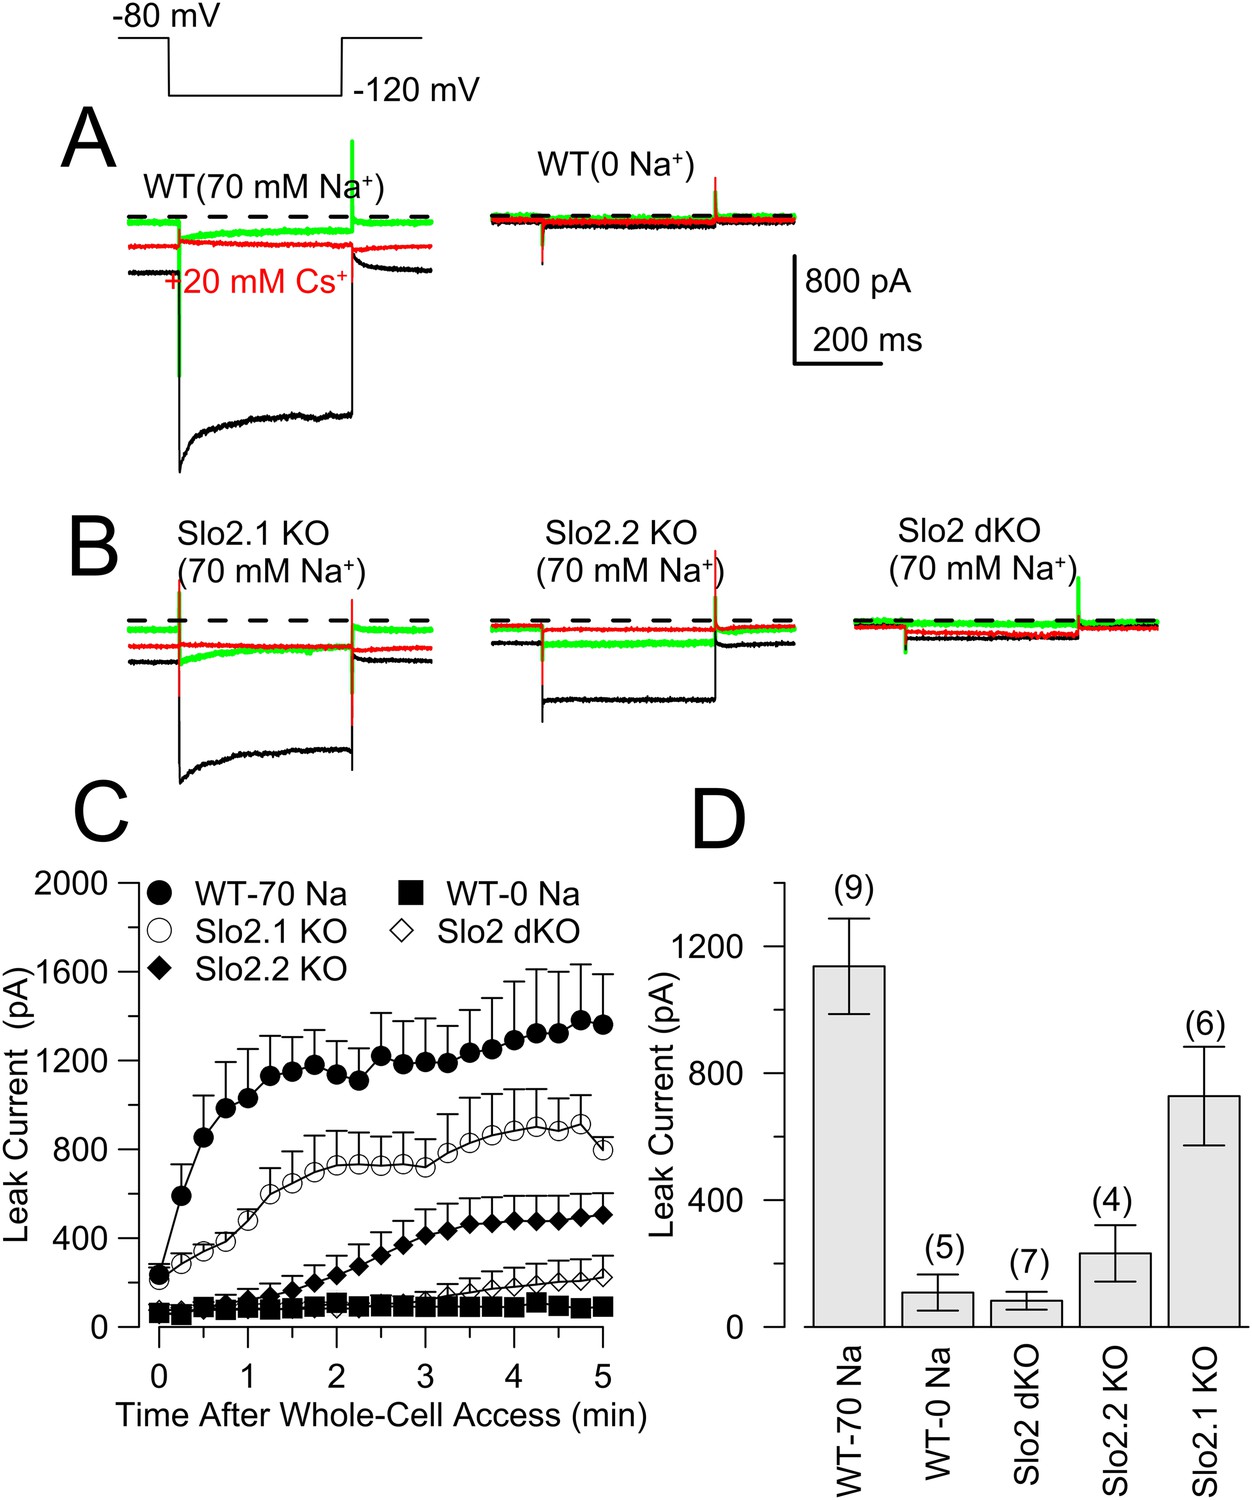
The absence of Slo2.2 reduces Na+-dependent leak current in acutely dissociated mouse DRG neurons.
(A) Traces on the top show currents (evoked by indicated voltage protocol) for four time points following formation of a whole-cell recording with 70 mM pipette Na+. Green: immediately following whole-cell access; black: 3 min following access; blue: following application of 20 mM Cs+; red: washout of Cs+. On the bottom, traces are from another WT neuron examined with the same procedure, but with 0 mM pipette Na+. (B) Panels correspond to the same sequence as shown in (A) for a Slo2.2 KO neuron (top left), a Slo2.1 KO neuron (top right), and a Slo2 dKO neuron (bottom). (C) The time courses of increases in net current evoked by steps from −80 to −120 mV are shown for WT and the three indicated Slo2 genotypes. (D) Mean estimates of leak current and standard errors measured 3 min following whole-cell access are plotted for different test conditions. Circles correspond to individual cells. t-test comparisons yielded: for 0 mM Na+ WT vs 70 mM Na+ WT, p = 0.0015; for 70 mM WT vs Slo2 dKO, p < 0.001; for 70 WT vs Slo2.2 KO, p < 0.001; for Slo2.1 KO vs Slo2.2 KO, p = 0.0038. All other comparisons were p > 0.1. (E) Traces on the top show channel activity in a patch excised from a WT DRG neuron bathed either with 0 mM Na+ or 70 mM Na+. Bottom: a similar patch from a Slo2 dKO neuron reveals no channels activated by Na+. (F) Voltage-step protocols over the range of −125 mV to −25 mV were used to compare steady-state conductance (measured at the end of a 20 ms command step) (Figure 6—figure supplement 1) in WT and dKO neurons with 70 mM pipette Na+, along with WT neurons with 70 mM Na+ after 30 min of recording.
Figure 6—figure supplement 1
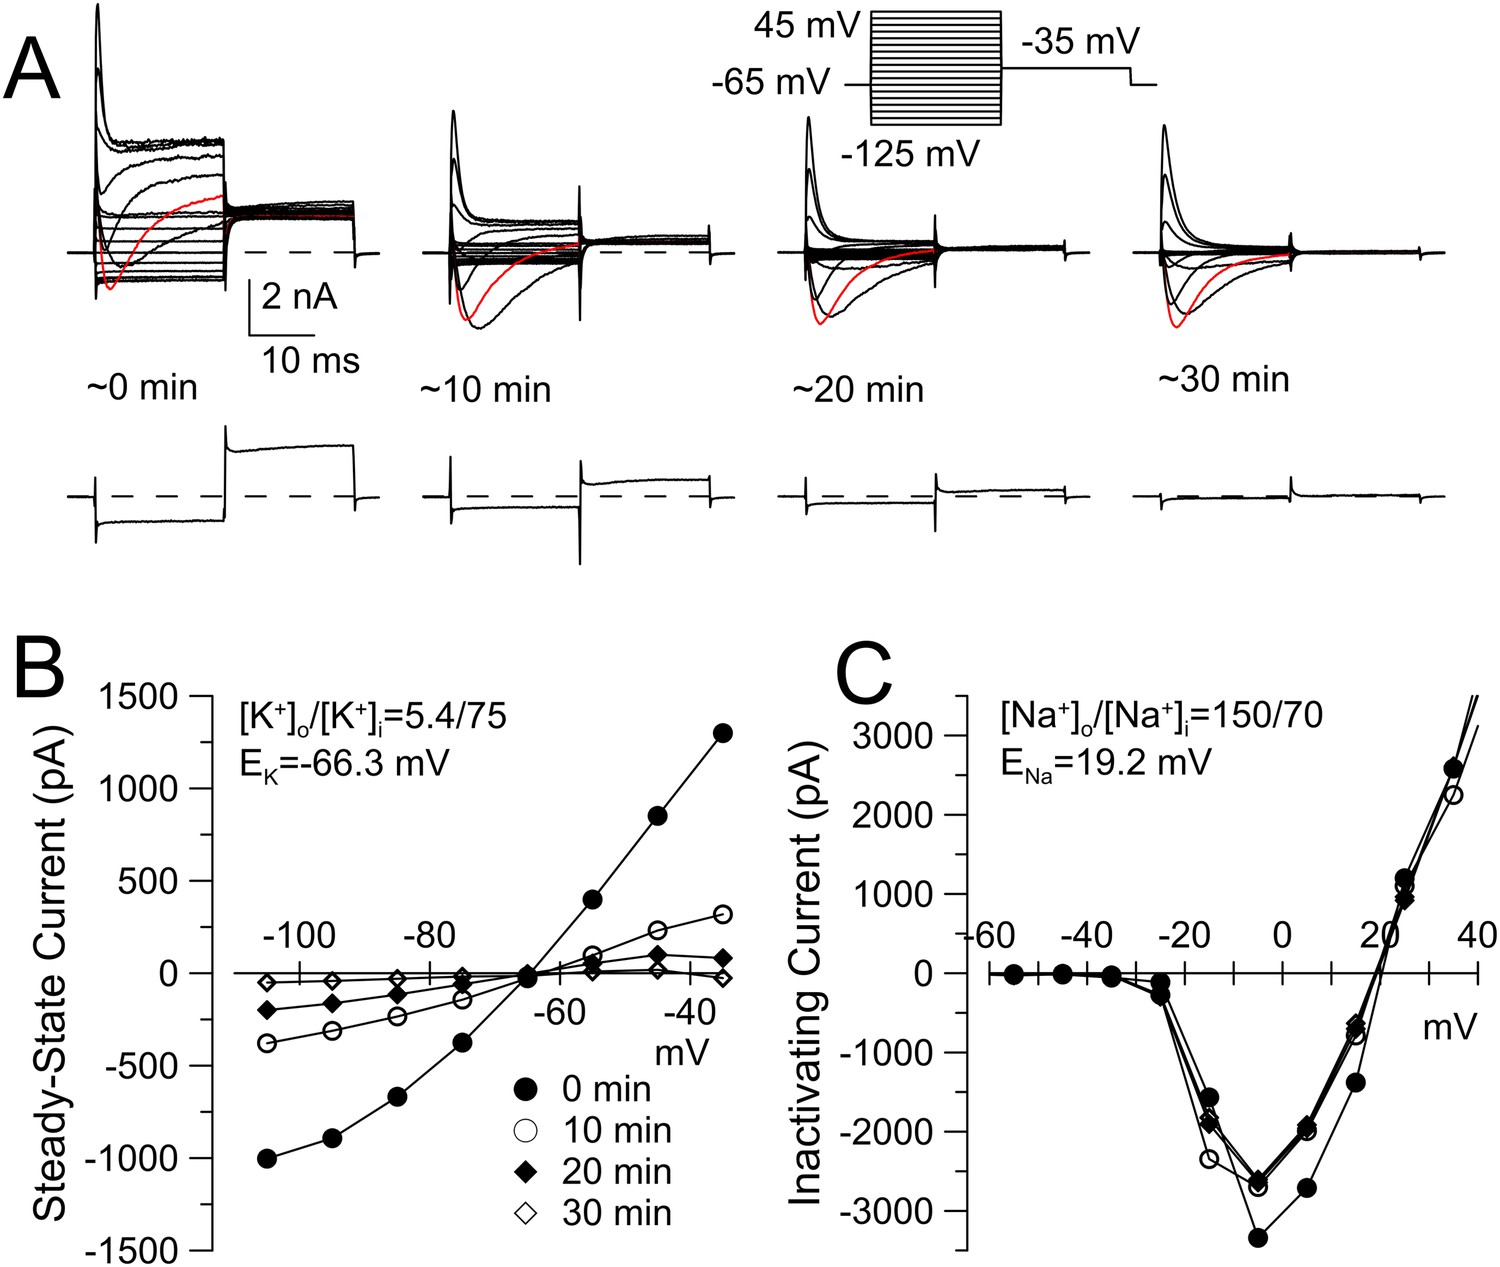
KNa current runs down during constant cytosolic 70 mM Na+.
(A) The indicated voltage protocol was used to elicit currents in a WT DRG neuron with 70 mM pipette Na+. Red trace indicates current activated by step to −5 mV. Bottom record in each case shows current resulting from the step to −125 mV to highlight the loss of the conductance over negative voltages. Application of loxapine following the example trace at 30 min resulted in partial restoration of the background conductance (not shown). For recordings in this figure, the extracellular solution contained 10 mM TEA to minimize any contribution from Ca2+-dependent K+ currents. (B) Current at the end of the 20 ms voltage steps in A is plotted for the different recording times. (C) The difference between peak inactivating current and steady-state current at 20 ms is plotted as a function of command voltage for the different recording times, revealing little change in Na+ current over the 30 min of recording.
Figure 6—figure supplement 2

Cs+ inhibition of KNa current exhibits voltage-dependence.
(A) Steady-state current was measured over the indicated voltages with 70 mM pipette Na+. Application of 20 mM extracellular Cs+ markedly inhibits the KNa current, with stronger inhibition at more negative potentials. Symbols are means (±sem) of current from four neurons. (B) Fractional inhibition is plotted as a function of membrane voltage. Solid line is the best fit of the following equation:
where A (= 0.39) is the amplitude of the voltage-dependent component of inhibition by 20 mM Cs+, Vh (= −82.2 mV) reflects the voltage of half inhibition of the voltage-dependent component, and z (= 0.68e) reflects the voltage-dependence of that inhibition. The function implies that at more positive potentials 20 mM Cs+ inhibits 61% of the current in a voltage-independent fashion.
Figure 6—figure supplement 3

Confirmation of properties of single KNa channels that are deleted by Slo2 dKO.
(A) The cytosolic face of an excised inside-out patch from a DRG neuron was exposed to 70 mM Na+ solution and channel activity was monitored over a range of voltages. Average activity exhibited only weak voltage-dependence. (B) Single channel amplitude was measured at four voltages for a set of four patches, yielding a single channel conductance of 127 pS.
Figure 6—figure supplement 4
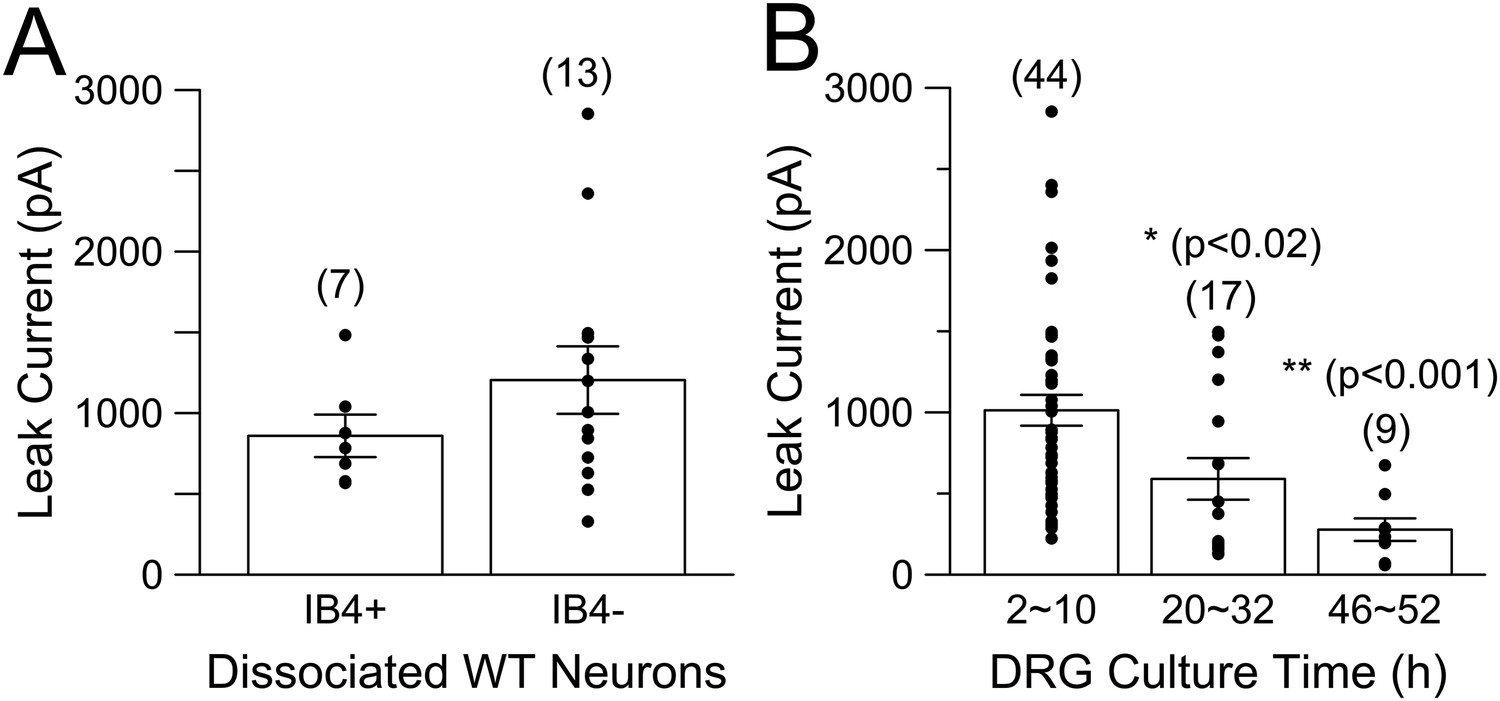
Na+-dependent leak current is present in both IB4+ and IB4− neurons and runs down with time in culture.
(A) Whole-cell current was activated by voltage-steps from −80 to −120 mV, with 70 mM Na+ in the pipette solution. Both IB4+ and IB4− neurons exhibit substantial KNa current. (B) Dissociated DRG neurons were maintained in culture for up to about 2 days. Following formation of whole-cell recordings, a step from −80 to −120 mV was used to determine leak current in the presence of 70 mM pipette Na+. p values at 20–32 hr and 46–52 hr of culture are T-test comparisons to the measurements from 2 to 10 hr in culture.
Figure 6—figure supplement 5
The absence of Slo2.2 and, to a lesser extent, Slo2.1, reduces Na+-dependent leak current in mouse DRG neurons in DRG tissue slices.
(A) Traces on the left show currents evoked by the indicated voltage steps at three time points following formation of a whole-cell recording with 70 mM pipette Na+, an initial trace immediately following whole-cell access (green), ∼3 min following access (black), and then following application of 20 mM Cs+. On the right, traces are from another WT neuron examined with the same procedure on the left, but with 0 mM pipette Na+. (B) Panels correspond to the same sequence as shown in (A) for a Slo2.1 KO neuron (left), a Slo2.2 KO neuron, and a Slo2 dKO neuron. (C) The time course of increases in net current evoked by steps from −80 to −120 mV is shown for the five indicated conditions. (D) Mean current amplitude (±sem) of background current observed 2–3 min following formation of whole-cell recording is plotted for five conditions.
Figure 7

Evoked action potential (AP) firing is increased in IB4+ DRG neurons from Slo2 dKO mice.
(A) 40, 60, 100, and 200 pA current injections (1 s) were used to elicit firing in WT (left) and dKO IB4+ DRG neurons from a holding potential of −60 mV. The pipette solution contained 10 mM Na+. (B) Similar injected currents were used to elicit firing in WT and Slo2 dKO neurons, but with 0 mM pipette Na+. (C) Mean number of APs for each 1 s step is plotted as a function of injected current amplitude for WT and dKO neurons for 10 mM pipette Na+. WT and dKO AP firing was significantly different at all injected current levels. (D) Mean firing is compared for WT and dKO neurons recorded with 0 mM pipette Na+. (E) Mean (black circle) and individual estimates (red circles) of AP firing for 1 s 60 pA current injections are summarized for 10 and 0 mM pipette Na+. p values, KS statistic. For comparisons between 0 and 10 mM Na+, for WT cells, p = 0.909; for dKO cells, p = 0.545. (F) AP firing for 100 pA current injections. Between 0 and 10 mM Na+, for WT cells, p = 0.585; for dKO cells, p = 0.245. (G) AP firing for 200 pA current injections. Between 0 and 10 mM Na+, for WT cells, p = 0.09; for dKO cells, p = 0.23.
Figure 8

Slo2 dKO results in reduced AP threshold.
(A) A 20 ms current injection of different amplitudes applied with membrane potential adjusted to −60 mV was used to examine AP threshold for a WT (left) and a Slo2 dKO (right) DRG neuron with 10 mM pipette Na+. Dotted red lines indicate 0 and −60 mV voltage levels. Current injection amount that first elicited an AP is indicated on each panel. (B) A similar comparison of AP threshold for a WT (left) and dKO (right) neuron is shown with 0 mM pipette Na+. (C) Mean and individual determinations of effective rheobase as determined in panels (A) and (B) are plotted for WT and dKO cells both for 10 and 0 mM pipette Na+. p values are the KS statistic for the indicated pairs. There was no difference for comparisons of 0 and 10 mM Na+ within a given genotype. (D) Example single APs elicited by a 100 pA current injection for WT and Slo2 dKO neurons are shown (0 mM pipette Na+). (E) dV/dt is plotted as function of membrane voltage for the APs in panel (D) (dKO, red; WT, black). Horizontal dotted lines correspond to the dV/dt value that is 10% of peak dV/dt for a given cell. (F) The dV/dt plot is shown for a more limited range of membrane voltage, with crossover with horizontal dotted lines of same color showing effective AP threshold. (G) Thresholds determined from dV/dt analysis are plotted for WT and dKO neurons (p = 0.001, KS statistic). (H) Currents activated by a 40 ms voltage-ramp from −60 to −20 mV from a holding potential of −60 mV were averaged for 10 WT and 11 dKO neurons (0 mM pipette Na+). The voltage at which the current becomes net inward is indicated by the arrows. (I) The membrane potential at which net current becomes inward during the voltage-ramp protocol shown in (H) is plotted for WT and dKO neurons with p = 0.007 (KS statistic).
Figure 9 with 3 supplements
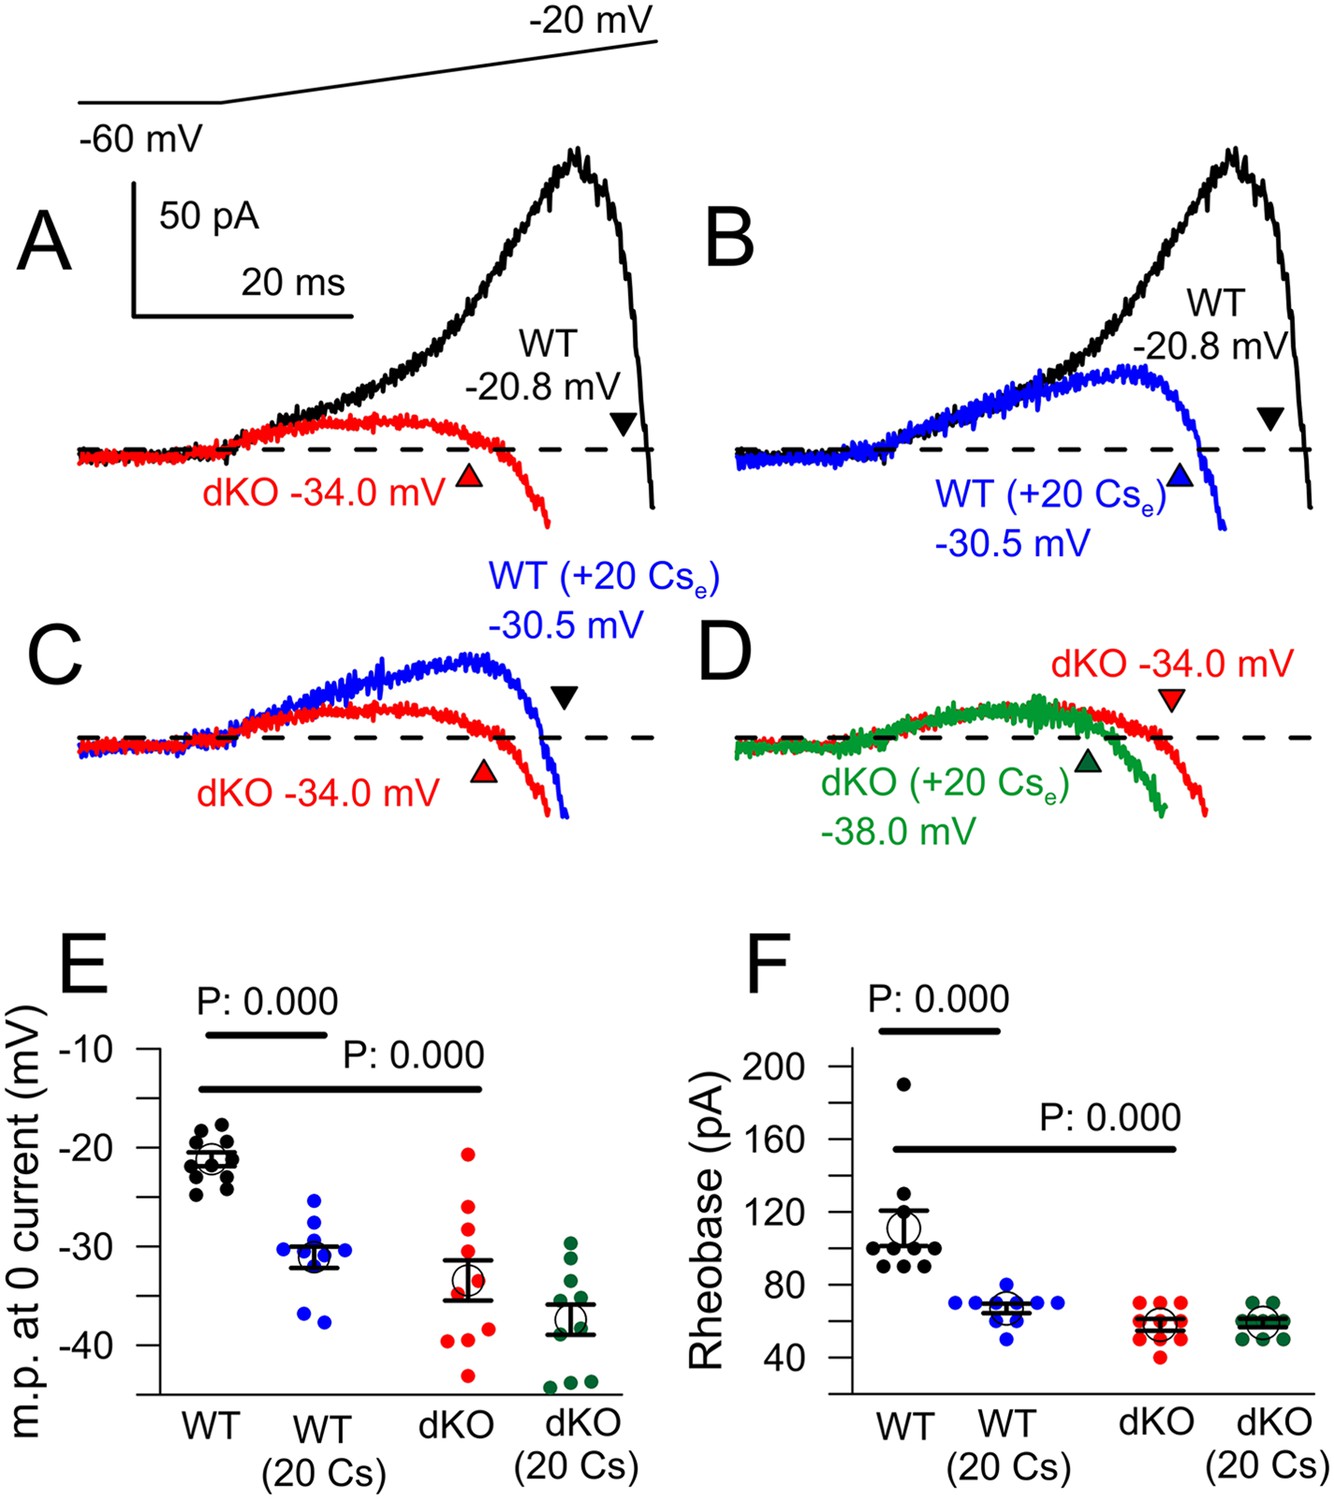
Cs+ inhibition of outward current in WT, but not dKO, neurons recapitulates properties of Slo2 dKO.
(A) Traces show averaged currents activated by the indicated voltage-ramp protocol (top) for 10 WT and 10 dKO neurons. Number shows the voltage at which net current crosses the 0-current level (indicated approximately by arrow heads). (B) Ramp-activated currents are shown for WT cells before and after application of 20 mM extracellular Cs+. (C) Ramp-activated currents are compared for WT cells in the presence of 20 mM Cs+ and dKO cells. (D) Currents are shown for dKO neurons without and with 20 mM extracellular Cs+. (E) The mean 0-current potential for sets of WT and dKO neurons without and with Cs+ are plotted, along with the individual estimates from each cell. p values are KS statistics. Other comparisons had p-value estimates >0.1. (F) Mean rheobase for the same set of WT and dKO cells are plotted, along with individual estimates.
Figure 9—figure supplement 1
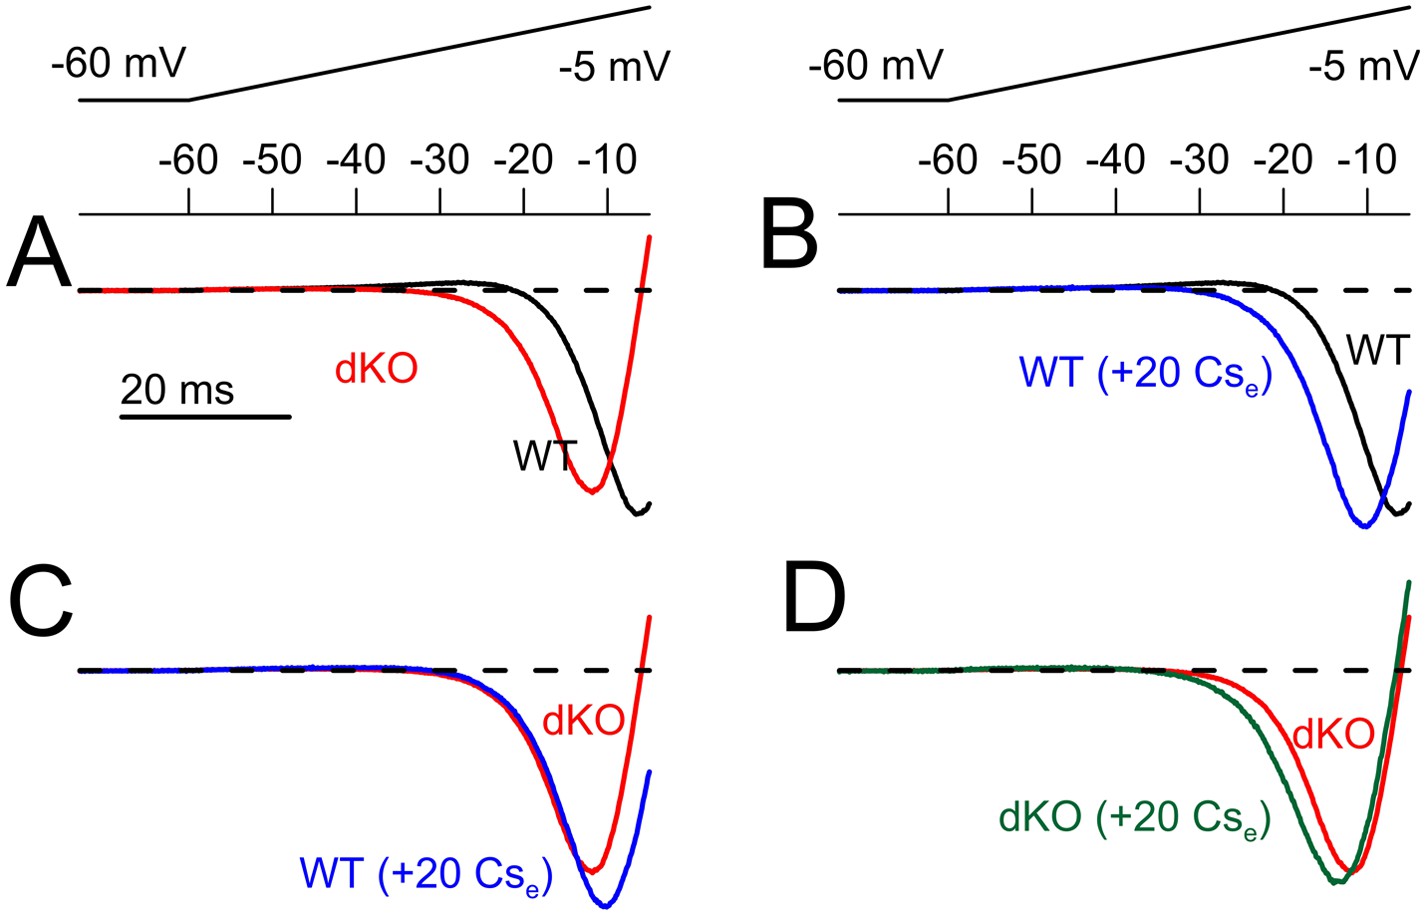
Normalized ramp-activated currents reveals that application of Cs+ shifts the apparent range of inward current activation in a fashion similar to dKO of Slo2 currents.
Ramp-activated currents as in Figure 9 were normalized in each cell to the largest inward current and then averaged. The most negative inward current values of the averaged traces differ among each average because of temporal displacement of the exact minimum. (A) Normalized currents are shown for WT and dKO neurons (10 each) for ramps up to −5 mV. (B) Application of 20 mM Cs+ to WT cells elicits a shift in the apparent range of inward current onset similar to that seen in dKO neurons. (C) The normalized ramp-activated currents compare dKO cells to WT cells in the presence of Cs+. (D) Application of Cs+ to dKO cells produces only minor shifts in the normalized ramp-activated current properties.
Figure 9—figure supplement 2
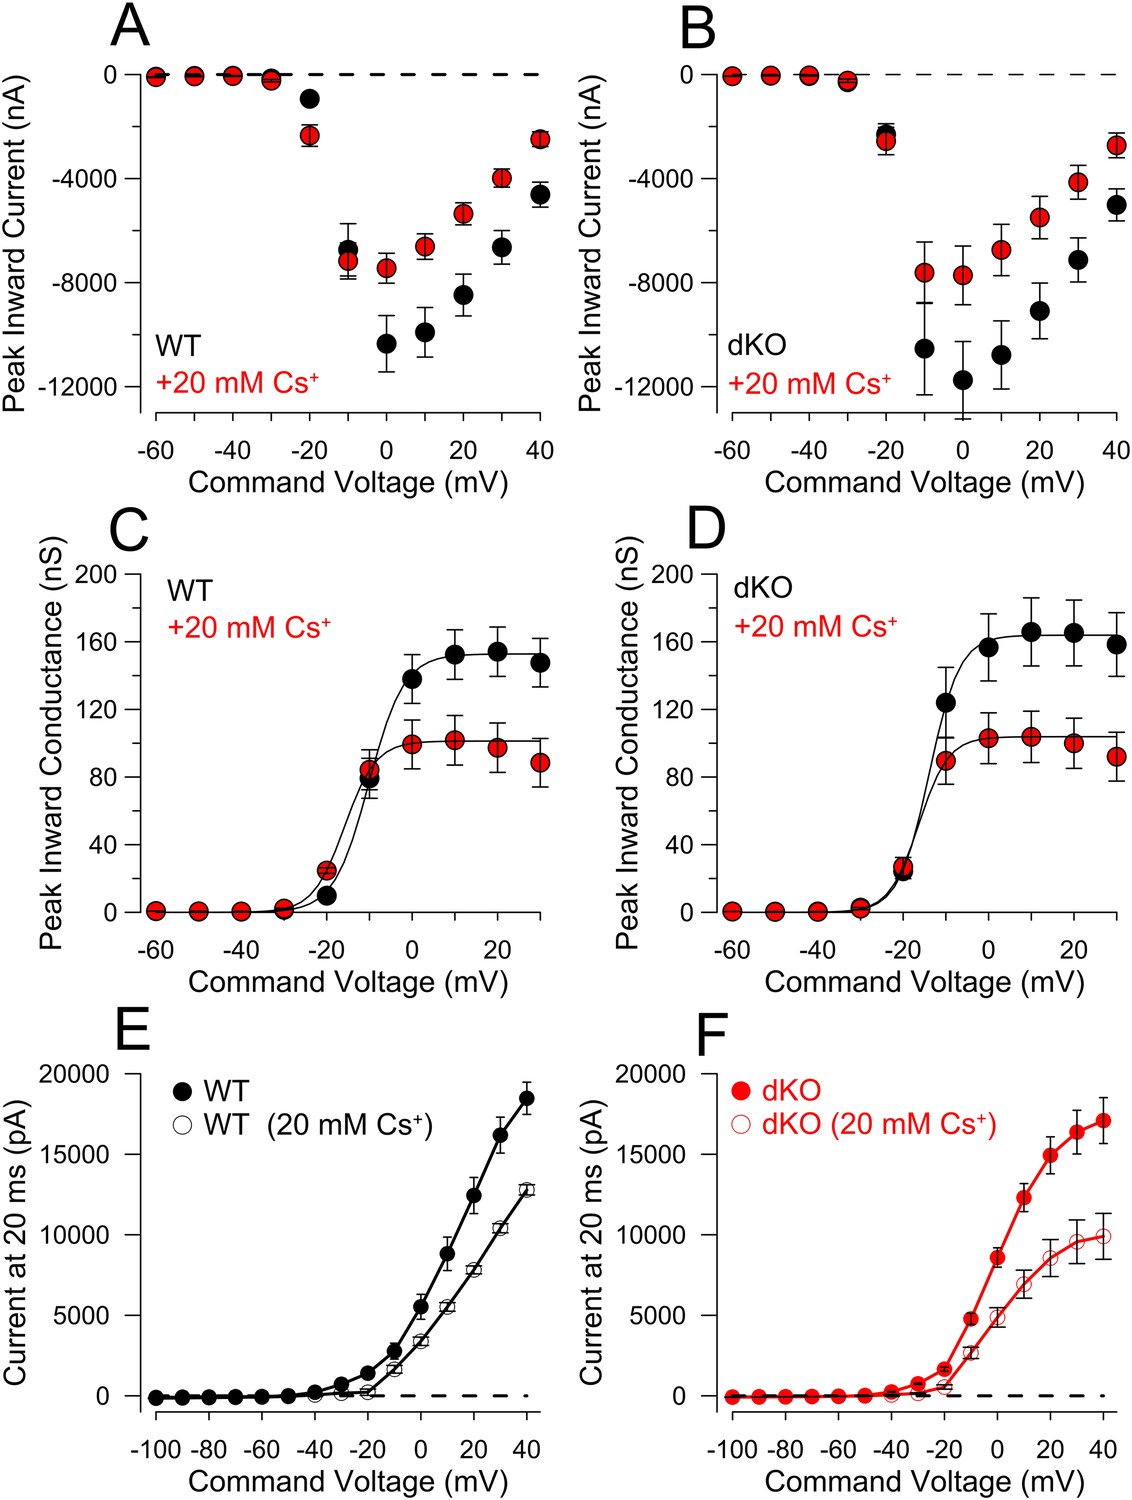
Comparison of step-activated inward and steady-state currents activated in WT and dKO cells for comparison of ramp-activated outward current.
(A) 20 ms voltage steps from −120 mV to +40 mV were applied from a holding potential of −60 mV, with pipette and extracellular solutions appropriate to allow normal cell firing. Figure plots peak inward current as a function of command voltage for 10 WT DRG neurons without and with application of 20 mM Cs+. (B) Inward current as a function of command voltage is displayed for 10 dKO DRG neurons without and with Cs+. (C) As an approximation of the voltage-dependence of inward current activation, currents at each command potential from A were converted to chord conductance estimates assuming ENa = 75 mV. Boltzmann fits yielded, for control solution, Vh = −10.1 ± 0.4 mV with z = 4.1 ± 0.4e; with 20 mM Cs+, Vh = −15.9 ± 0.2 mV with z = 3.7 ± 0.1e. (D) Mean Nav conductance was plotted as a function of command potential for 10 dKO DRG neurons and fit with a Boltzmann function. For control solution, Vh = −13.9 ± 0.4 mV with z = 3.6 ± 0.2e; for 20 mM Cs+, Vh = −16.4 ± 0.1 mV with z = 3.5 ± 0.1e. (E) From the same family of traces used to generate panels A–D and same cells used for Figure 9, sustained current at the end of a 20 ms command step was measured and plotted as a function of command potential, for the 10 WT cells, without and with 20 mM Cs+. (F) Sustained current as a function of command potential is plotted for 10 dKO cells. Although maximum sustained current is similar between these sets of WT and DRG neurons, at voltages of −20 mV and more positive the activation of sustained current is shifted to more negative potentials in the dKO cells. Note that in both WT and dKO cells the net blocking effect of Cs+ is stronger over potentials from −40 to −20 mV than at the more positive voltages. A linear fit to the current values between −120 mV and −60 mV yielded a net conductance of 1.4 ± 0.04 nS for WT neurons, and 1.1 ± 0.1 nS for the dKO neurons. However, in neither WT nor dKO cells, did Cs+ reduce this resting conductance, suggesting there is no basal KNa activation with 0 pipette Na+.
Figure 9—figure supplement 3
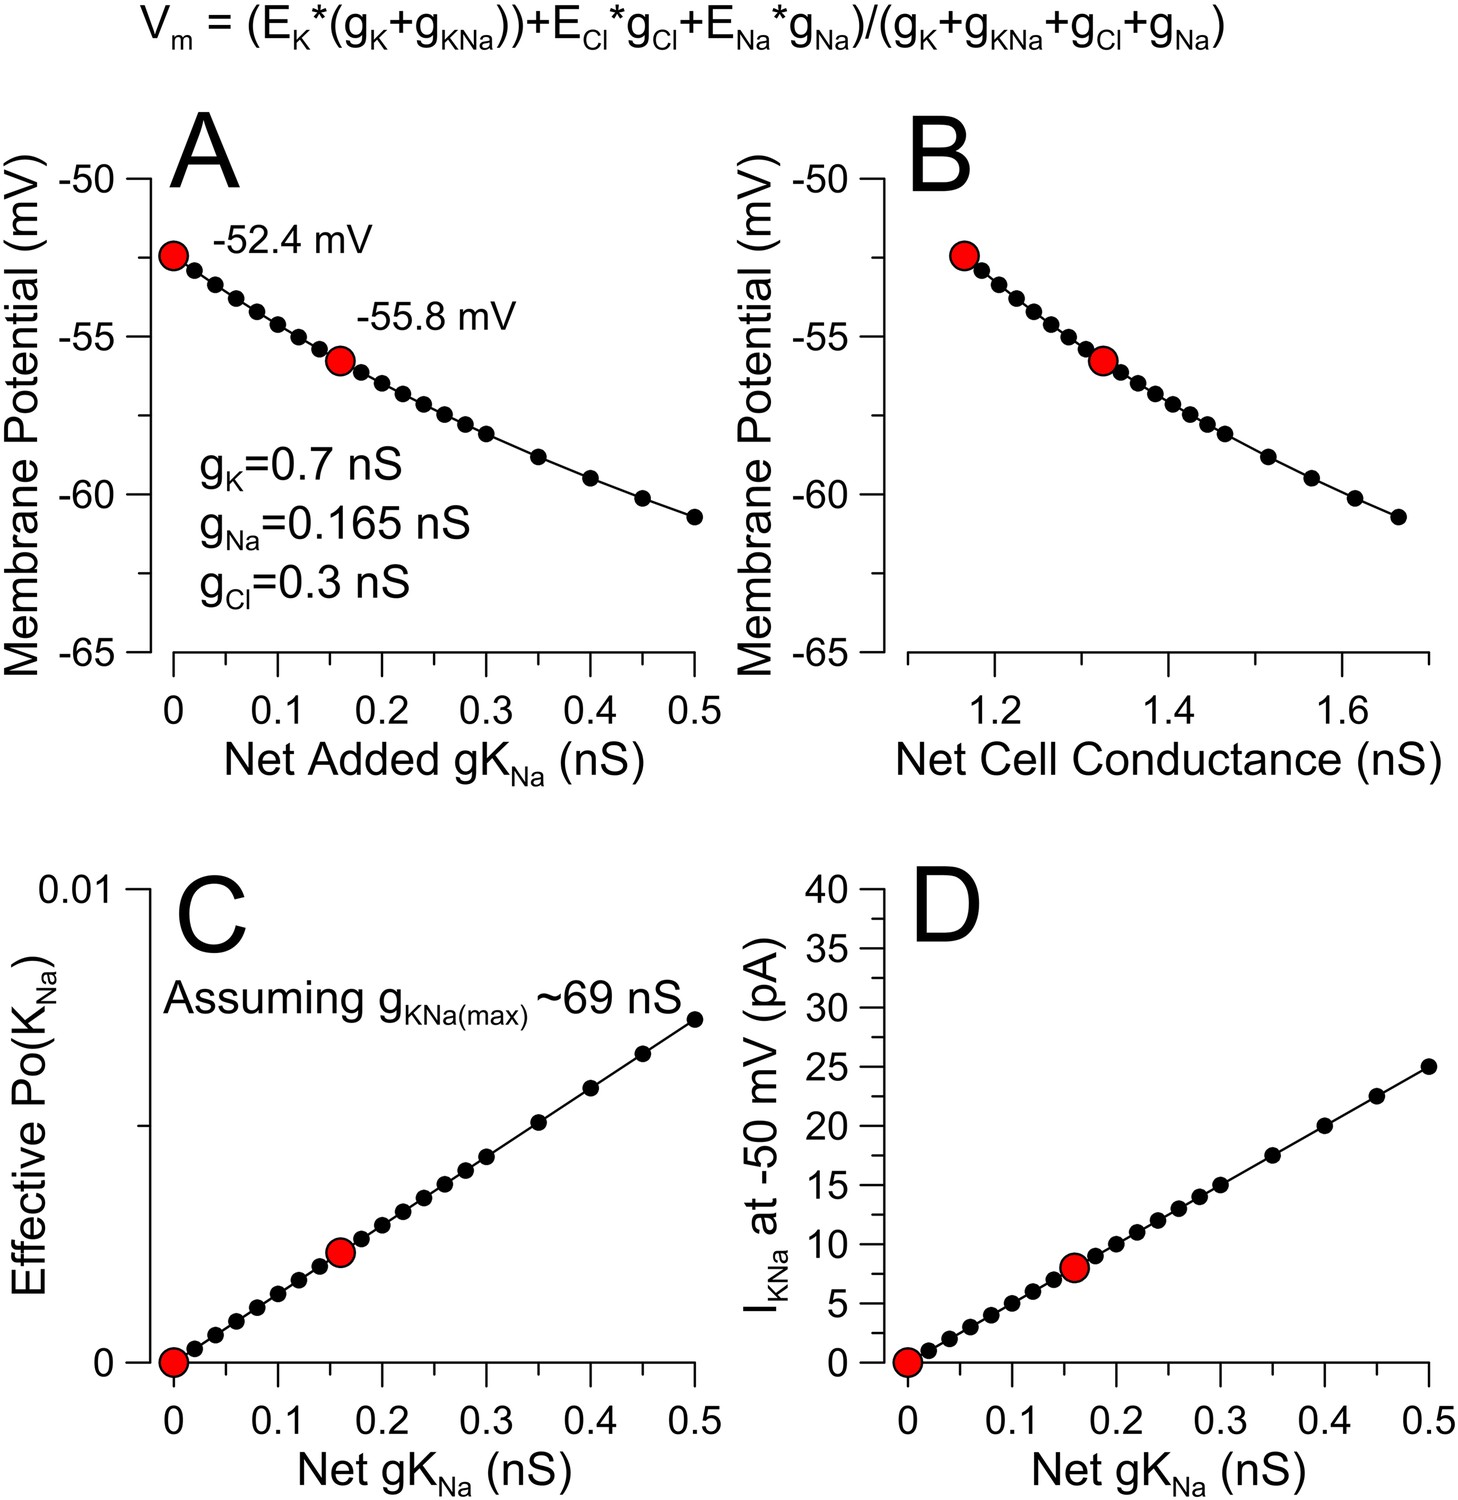
Evaluating the potential impact of a small K+ conductance near resting potential.
(A) A modified GHK conductance equation (top) was used to calculate membrane potential. In the absence of explicit estimates of specific ion conductances at rest, we assume EK = −80 mV, ENa = 60 mV, ECl = −50 mV with gK, gNa, and gCl set to 0.7 nS, 0.165 nS, and 0.3 nS for a total membrane conductance of 1.165 nS and a basal membrane potential of −52.4 mV. A hypothetical gKNa was then added in increments of 0.02 nS to generate the relationship between net added gKNa and membrane potential. Red dots correspond to the complete absence of KNa and with added 0.16 nS gKNa, (B) The relationship between Vm and total cell conductance is plotted. We would propose that the ability of KNa to influence Vm will also be influenced by any factors affecting basal Na flux, such that at more negative voltages the contribution of KNa would diminish. (C) Assuming a maximal DRG gKNa of ∼69 nS (Figure 6F), the relationship between effective Po of the KNa channels and gKNa is plotted. (D) The expected current amplitude of KNa at −50 mV for the given increments of KNa conductance is plotted.
Figure 10
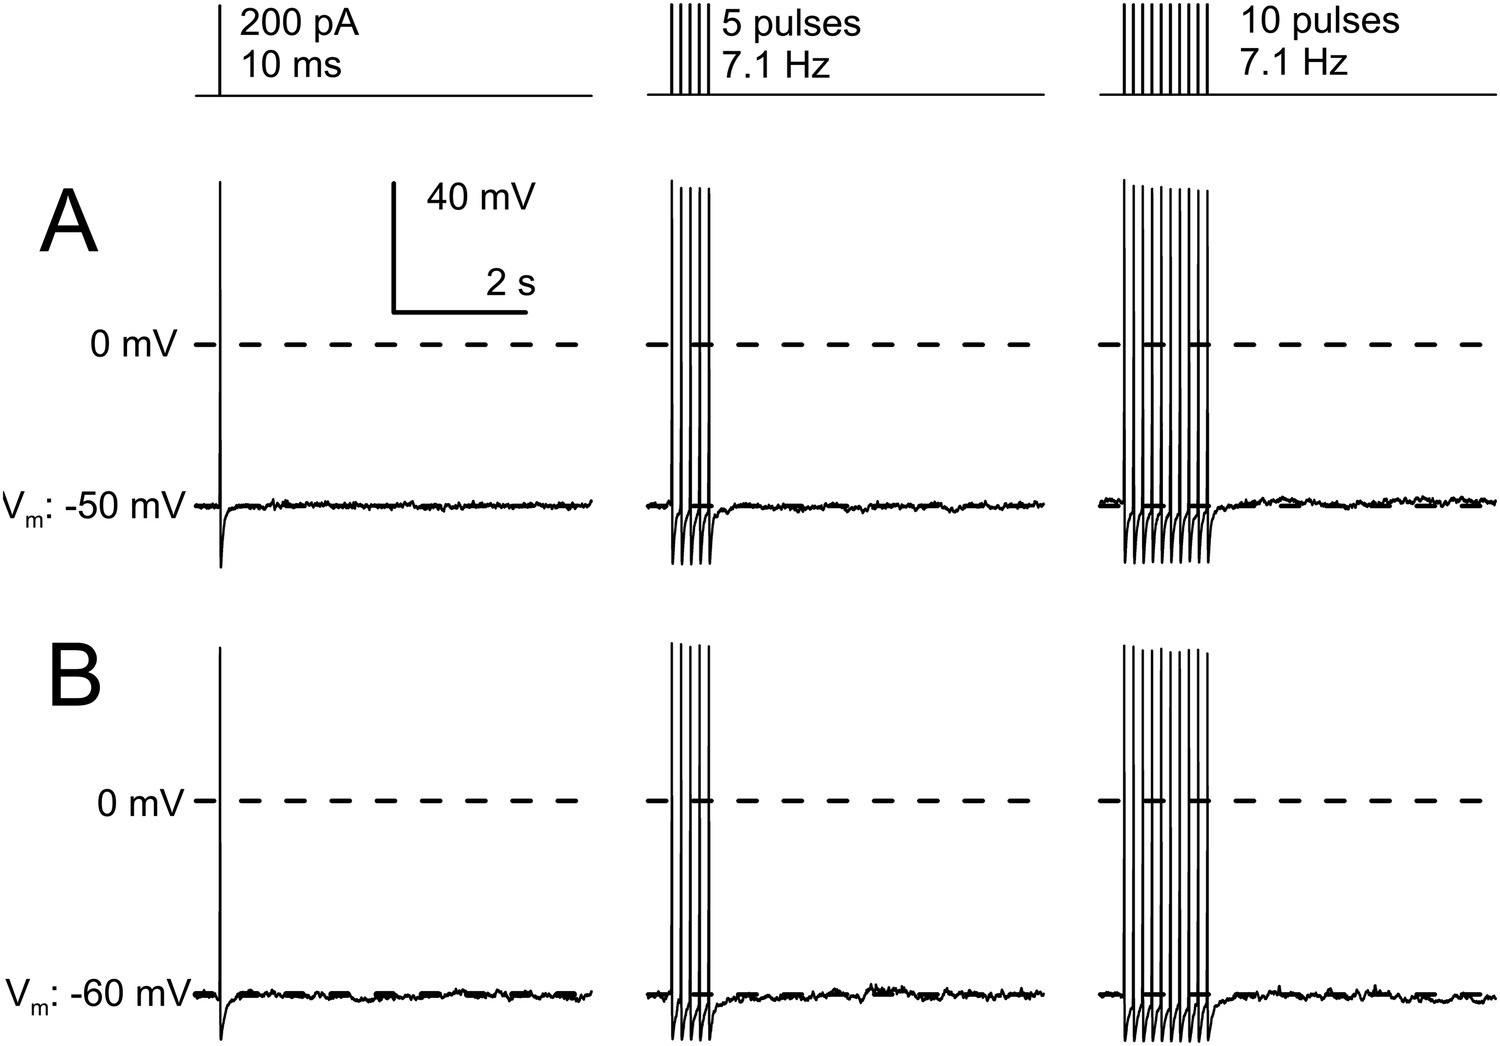
AP trains in IB4+ small diameter DRG neurons do not develop slow AHPs.
(A) A cell was maintained at a resting potential of −50 mV and stimulated with either 1, 5, of 10 pulses of 10 ms duration and 200 pA amplitude, with a pulse frequency of 7.1 Hz. A brief afterhyperpolarization is associated with the last AP in each test, with no indication of any additional slow afterhyperpolarization persisting for 100 s of milliseconds. (B) In another cell maintained at a resting potential of −60 mV, the identical current injection sequence also failed to elicit any slow afterhyperpolarization. Identical results were observed in three additional neurons.
Videos
Video 1
Response of a Slo2 dKO mouse to CQ injection (related to Figure 4A).
The nape of the neck of a Slo2 dKO mouse was injected with 10 μl 200 μM choroquine. Video recording was begun about 10 s after injection.
Video 2
Response of a WT mouse to CQ injection (related to Figure 4A).
The nape of the neck of a WT mouse was injected with 10 μl 200 μM choroquine. Acquisition of video was begun about 10 s after injection.
Tables
Table 1
Properties of IB4+ WT and Slo2 dKO DRG neurons (10 and 0 mM pipette Na+)
| Pipette Na+ | IB4+ WT | IB4+ dKO | p-values | ||||
|---|---|---|---|---|---|---|---|
| 10 mM Na+ | mean | sem | n | mean | sem | n | K-S statistic |
| Cm (pF) | 16.1 | 0.3 | 64 | 15.9 | 0.5 | 41 | 0.574 |
| m.p. (mV) | −54.2 | 0.6 | 57 | −50.8 | 0.9 | 41 | 0.001 |
| Rin (MΩ) | 1251.1 | 130.8 | 13 | 1212.9 | 148.8 | 13 | 0.828 |
| rheobase (pA) | 86.6 | 4.6 | 44 | 58.1 | 3.4 | 31 | 0.000 |
| dV/dt AP threshold (mV) | −25.31 | 0.64 | 14 | −27.89 | 0.65 | 10 | 0.032 |
| AP peak (mV) | 39.2 | 2.2 | 14 | 41.7 | 1.6 | 10 | 0.877 |
| AP half-width (ms) | 5.7 | 0.3 | 14 | 5.6 | 0.3 | 10 | 0.771 |
| AHP (mV) | −74.0 | 0.4 | 14 | −72.6 | 0.5 | 10 | 0.124 |
| 60 pA AP count | 2.3 | 0.5 | 64 | 9.7 | 1.9 | 41 | 0.000 |
| 100 pA AP count | 5.5 | 0.8 | 64 | 17.7 | 2.7 | 41 | 0.000 |
| 200 pA AP count | 11.4 | 1.5 | 64 | 28.9 | 5.1 | 41 | 0.000 |
| Pipette Na+ | IB4− WT | IB4− dKO | p-values | ||||
|---|---|---|---|---|---|---|---|
| 0 Na+ | mean | sem | n | mean | sem | n | K-S statistic |
| Cm (pF) | 16.7 | 0.9 | 12 | 16.7 | 0.8 | 12 | 0.991 |
| m.p. (mV) | −54.0 | 1.4 | 11 | −47.0 | 1.4 | 12 | 0.007 |
| Rin (MΩ) | 1381.0 | 194.5 | 12 | 1136.4 | 95.0 | 11 | 0.459 |
| rheobase (pA) | 92.5 | 8.7 | 12 | 60.8 | 5.1 | 12 | 0.0048 |
| dV/dt AP threshold (mV) | −22.7 | 0.7 | 10 | −25.8 | 0.5 | 10 | 0.001 |
| AP peak (mV) | 45.3 | 2.9 | 10 | 51.7 | 1.6 | 10 | 0.313 |
| AP half-width (ms) | 5.1 | 0.3 | 10 | 4.5 | 0.2 | 10 | 0.313 |
| AHP (mV) | −72.5 | 0.7 | 10 | −73.7 | 0.4 | 10 | 0.313 |
| 60 pA AP count | 1.2 | 0.5 | 12 | 5.8 | 1.2 | 12 | 0.005 |
| 100 pA AP count | 3.5 | 1.1 | 12 | 12.3 | 2.1 | 12 | 0.019 |
| 200 pA AP count | 6.8 | 2.4 | 11 | 19.9 | 3.0 | 10 | 0.005 |
-
Cm, cell capacitance; m.p., resting potential; Rin, input resistance measured by current deflection arising from a 10 mV pulse from −60 to −70 mV; AP half-width, measured at half peak amplitude; AHP, measured following a single evoked AP; AP count, number of APs in 1 s of specified injected current. Rheobase, defined as smallest injected current which elicited an action potential during a 20 ms current injection.
-
AP, action potential.
Table 2
Primers used for Real-Time PCR
| Gene | Primer | Amplicon length |
|---|---|---|
| Kcnt2 | Forward: 5′-TCTATTTGAAACAATACTCCTTGG-3′ | 149 bp |
| Reverse: 5′-GAACAAATAGATTTCTTAAGGTGG-3′ | ||
| Kcnt1 | Forward: 5′-CTCACACACCCTTCCAACATGCGG-3′ | 161 bp |
| Reverse: 5′-ATGCTGATACTAAATACTCGACCA-3′ | ||
| Β-actin | Forward: 5′-TGGAGAAGAGCTATGAGCTGCCTG-3′ | 127 bp |
| Reverse: 5′-GTAGTTTCATGGATGCCACAGGAT-3′ |
Download links
A two-part list of links to download the article, or parts of the article, in various formats.
Downloads (link to download the article as PDF)
Open citations (links to open the citations from this article in various online reference manager services)
Cite this article (links to download the citations from this article in formats compatible with various reference manager tools)
Knockout of Slo2.2 enhances itch, abolishes KNa current, and increases action potential firing frequency in DRG neurons
eLife 4:e10013.
https://doi.org/10.7554/eLife.10013


