Prebiotic gas flow environment enables isothermal nucleic acid replication
- Systems Biophysics, Physics department, Center for NanoScience, Ludwig-Maximilians-Universität München, Germany
Figures
Figure 1
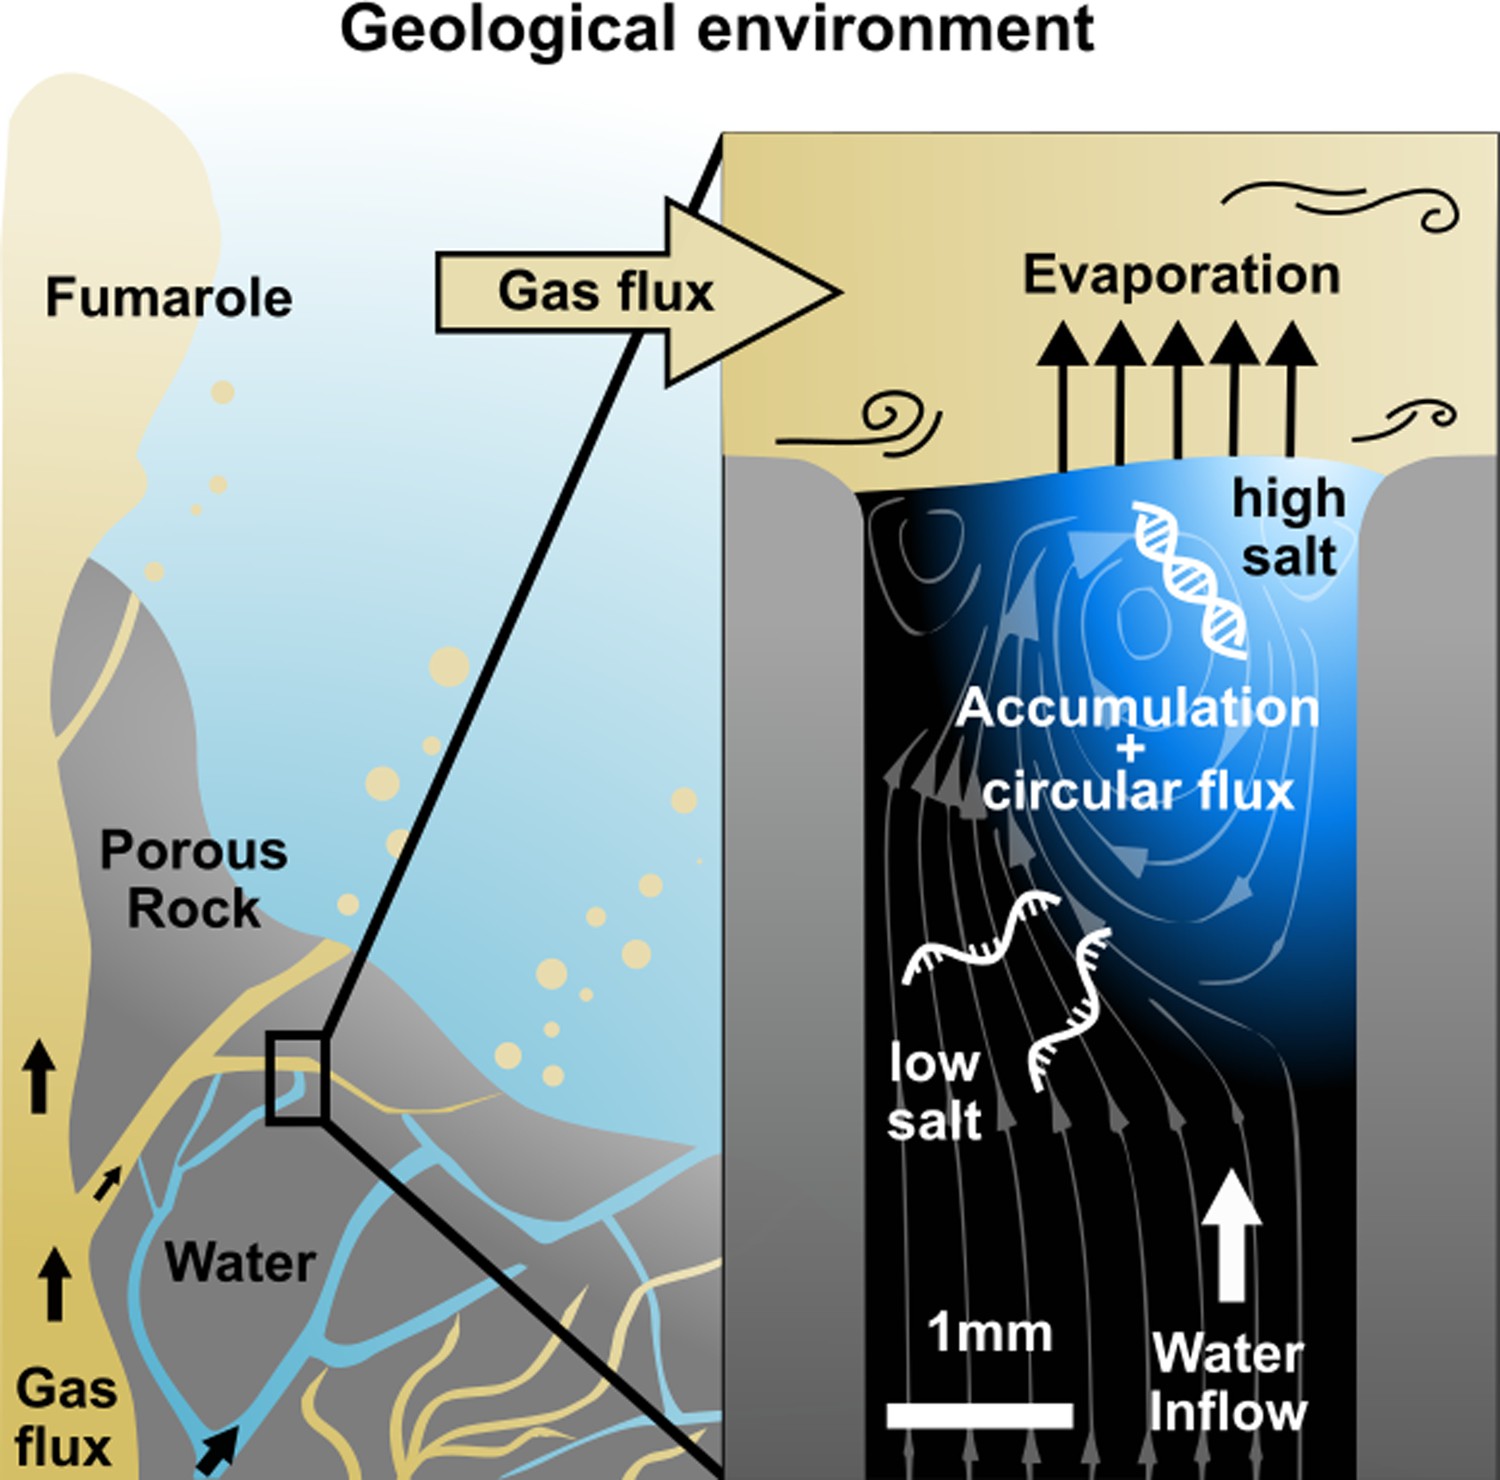
Replication at the gas-water interface.
We considered a geological scenario in which water, containing biomolecules, is evaporated by a gas flow at the scale of millimeters. In volcanic porous rock, many of such settings can be imagined. The gas flow induces convective water currents and causes it to evaporate. Dissolved nucleic acids and salts accumulate at the gas-water interface due to the interfacial currents, even if the influx from below is pure water. Through the induced vortex, nucleic acids pass through different concentrations of salt, promoting strand separation and allowing them to replicate exponentially. Our experiments replicate this environment on the microscale, subjecting a defined sample volume to a continuous influx of pure water with an air flux brushing across.
Figure 2 with 8 supplements
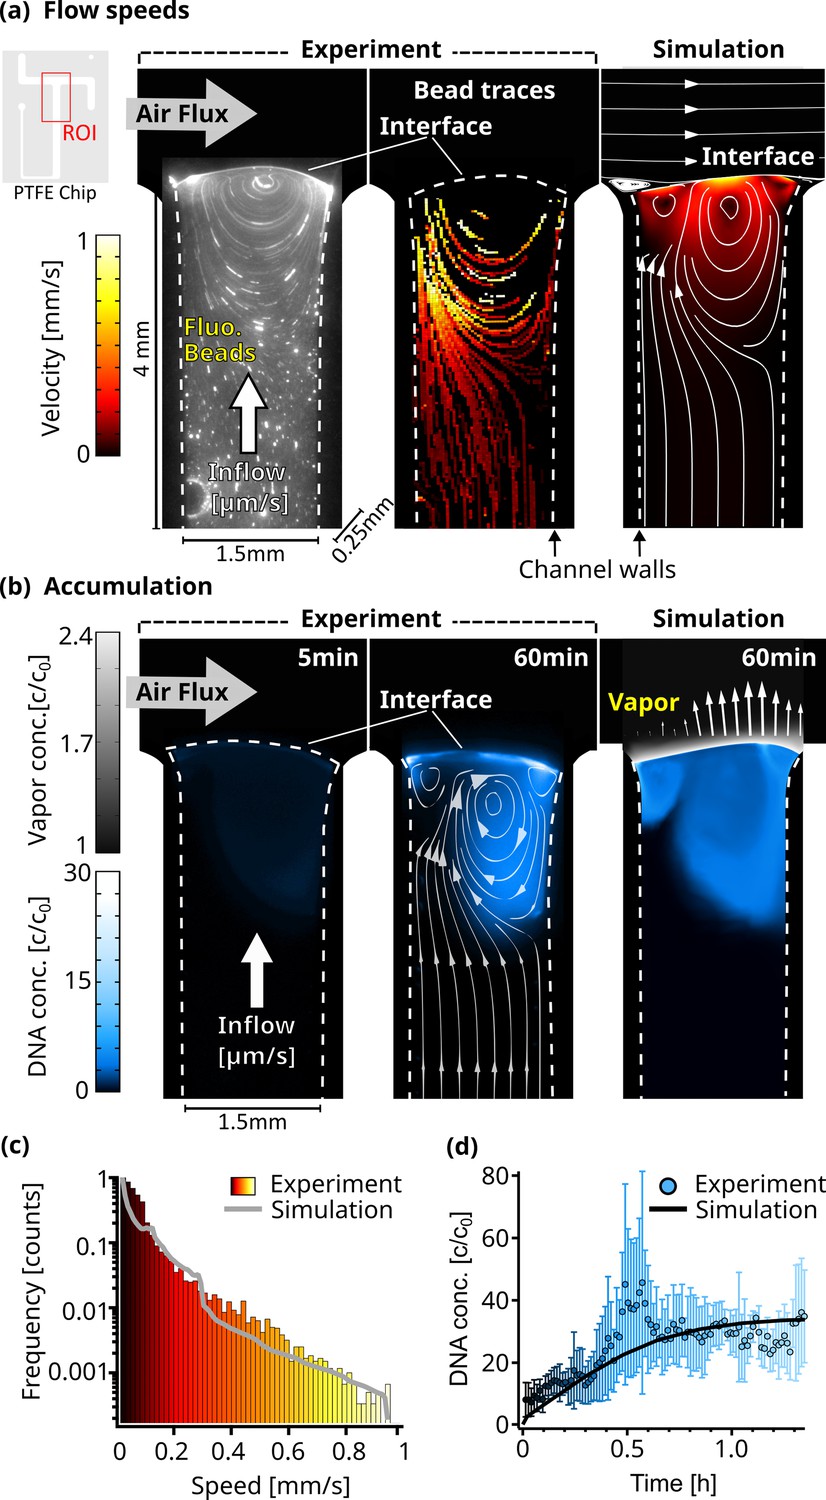
Flow and accumulation dynamics.
(a) Imaging of fluorescent beads (0.5 µm) reveals a flow vortex right below the air-water interface, induced by the air flux across the interface (left panel). The bead movements were traced (middle panel), and the measured velocities were confirmed by a detailed finite element simulation (right panel). The PTFE chip cutout in the top left corner shows the ROI used for the micrographs. The color scale is equal for both simulation and experiment, and channel dimensions are 4x1.5 x 0.25 mm as indicated. Dotted lines visualize the location of the channel walls. (b) The accumulation of fluorescently labeled 63mer DNA was imaged and confirmed our understanding of the environment based on a diffusion model. Concentration reaches up to 30 times relative to the start c0. The accumulation profile of the experiment (middle panel) and simulation (right panel) match well, showcased by overlaying the simulated flowlines. Blue colorscale represents DNA accumulation for experiment and simulation, while grey color scale shows the relative vapor concentration in the simulation. Arrows (right panel) proportionally show the evaporation speed along the interface. (c) The simulated and experimentally measured distribution of flow velocities of dissolved beads plotted in a histogram, showing a similar profile. Color scale is equal to (a). (d) The maximum relative concentration of DNA increased within an hour to ≈30 X the initial concentration, with the trend following the simulation. Error bars are the standard deviation from four independent measurements.
Figure 2—figure supplement 1
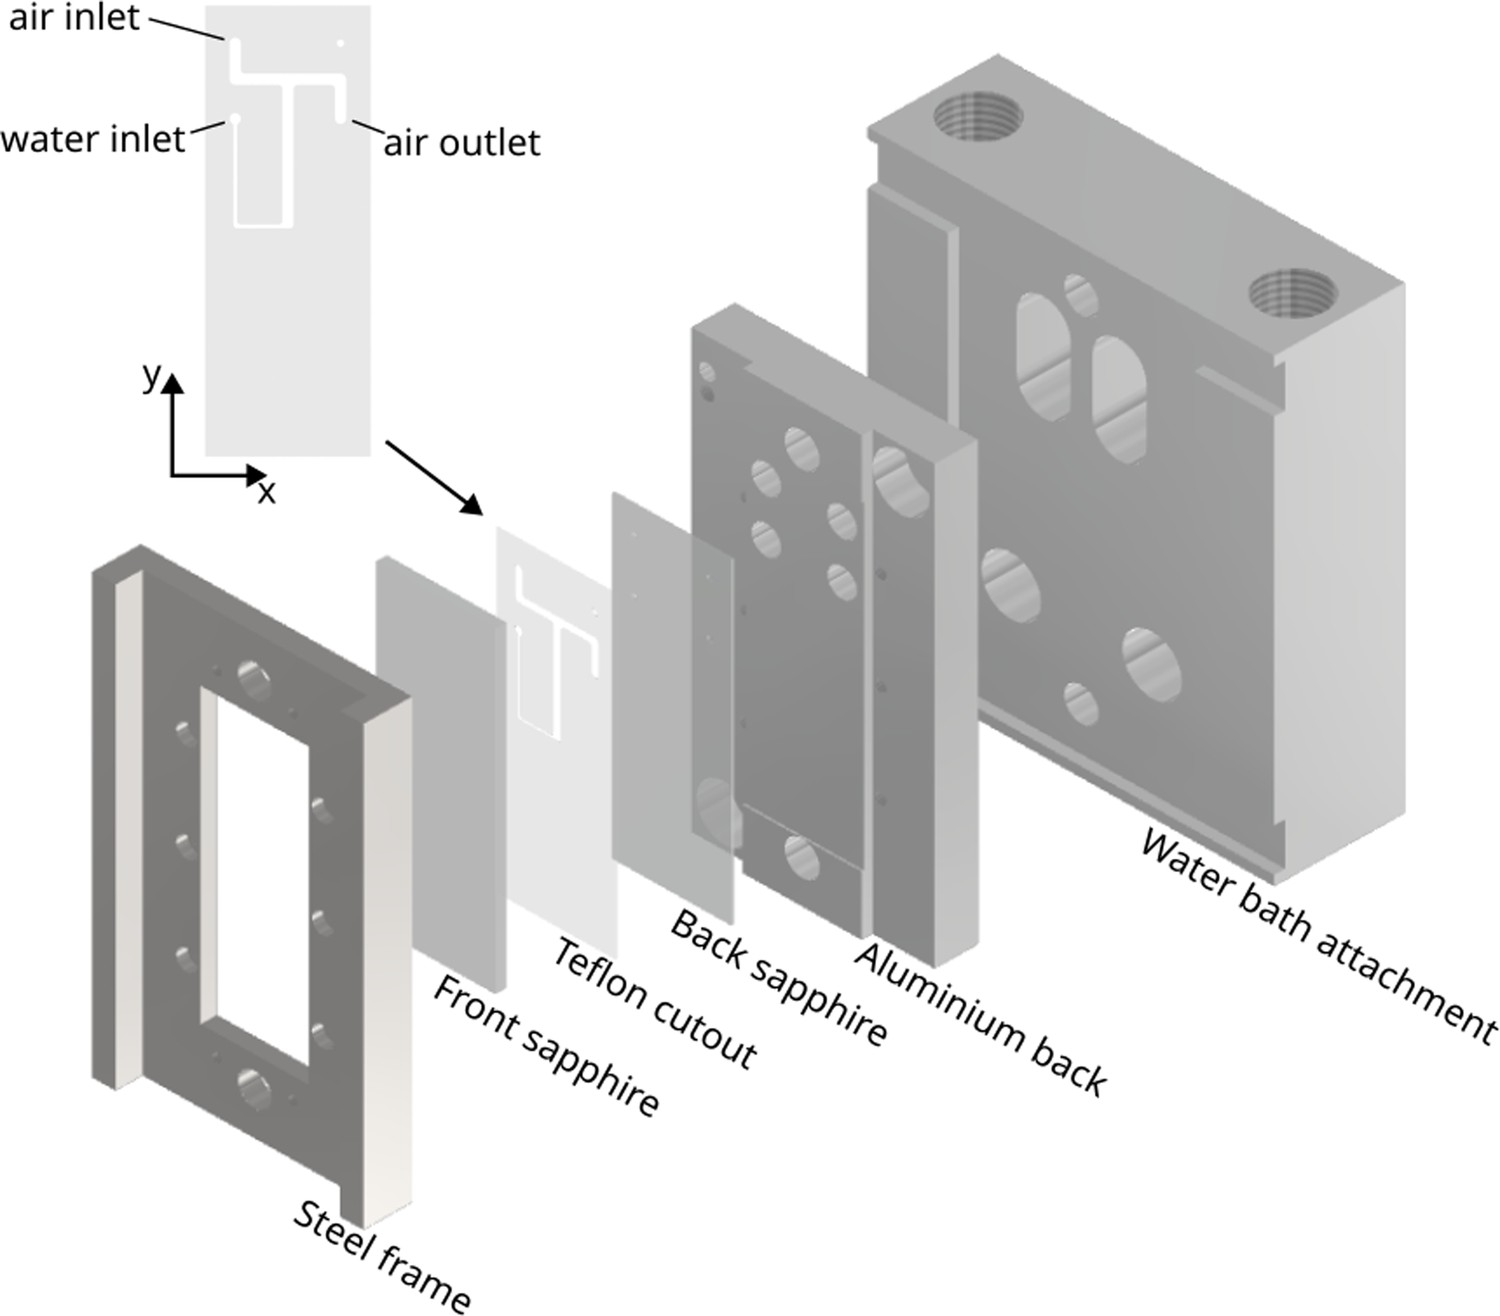
Sketch of the microfluidic chamber assembly.
Between a steel frame front and an aluminium back attached to the waterbath attachment, a sapphire doublet sandwiches the teflon cutout. The 250-µm-thick cutout is connected to airflow and water flow through holes in the back sapphire. More detailed information can be found in Appendix 3.
Figure 2—figure supplement 2
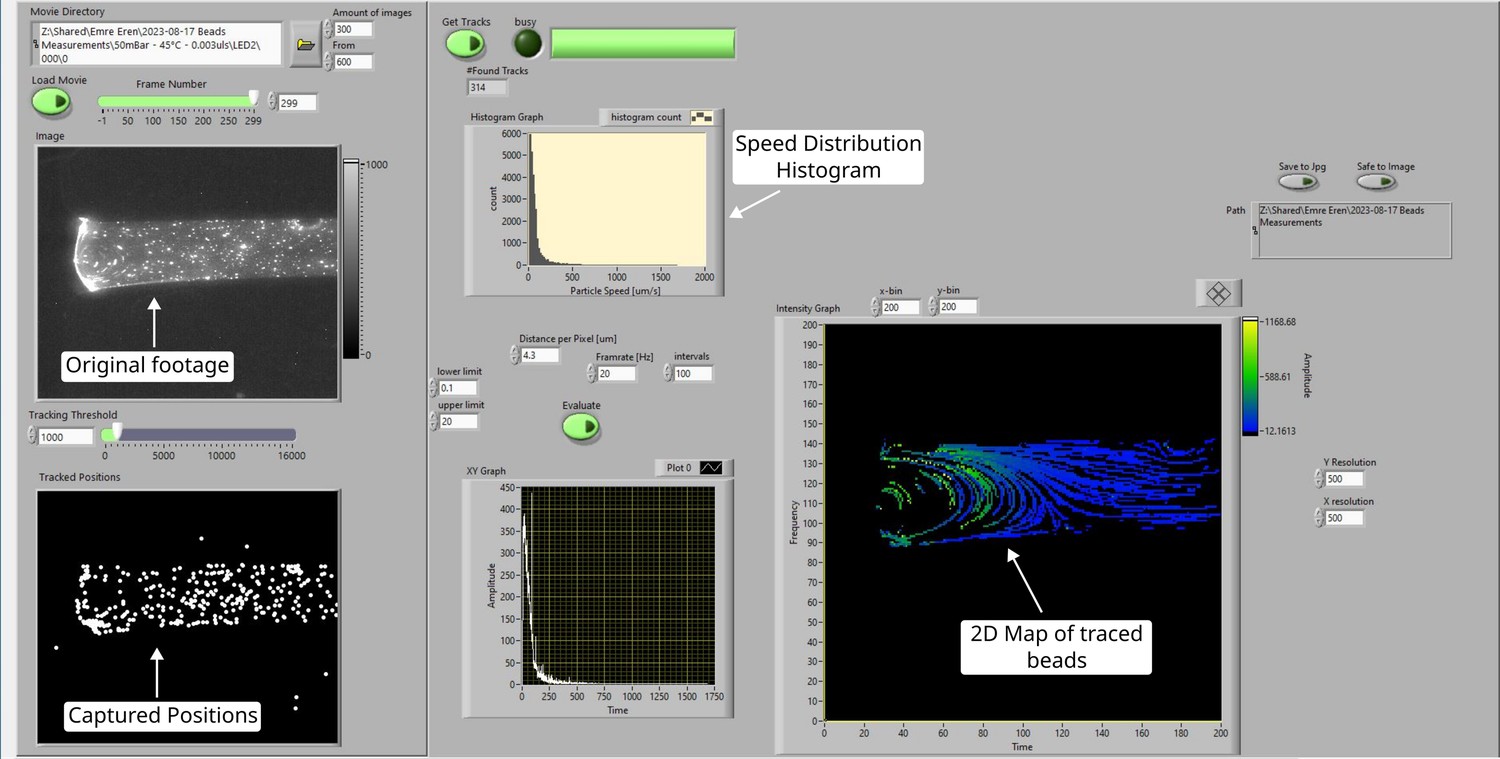
Screenshot of the user interface of the self-written LabVIEW script used for particle tracking.
A series of microscopy images are loaded, and beads are located and positional changes between images are traced. Statistics of particle speeds spanning hundreds of images are calculated using imaging framerate and previously measured length/pixel values. A 2D map of the obtained traces converted to the corresponding speed is generated as well. More detailed information can be found in Appendix 4.
Figure 2—figure supplement 3
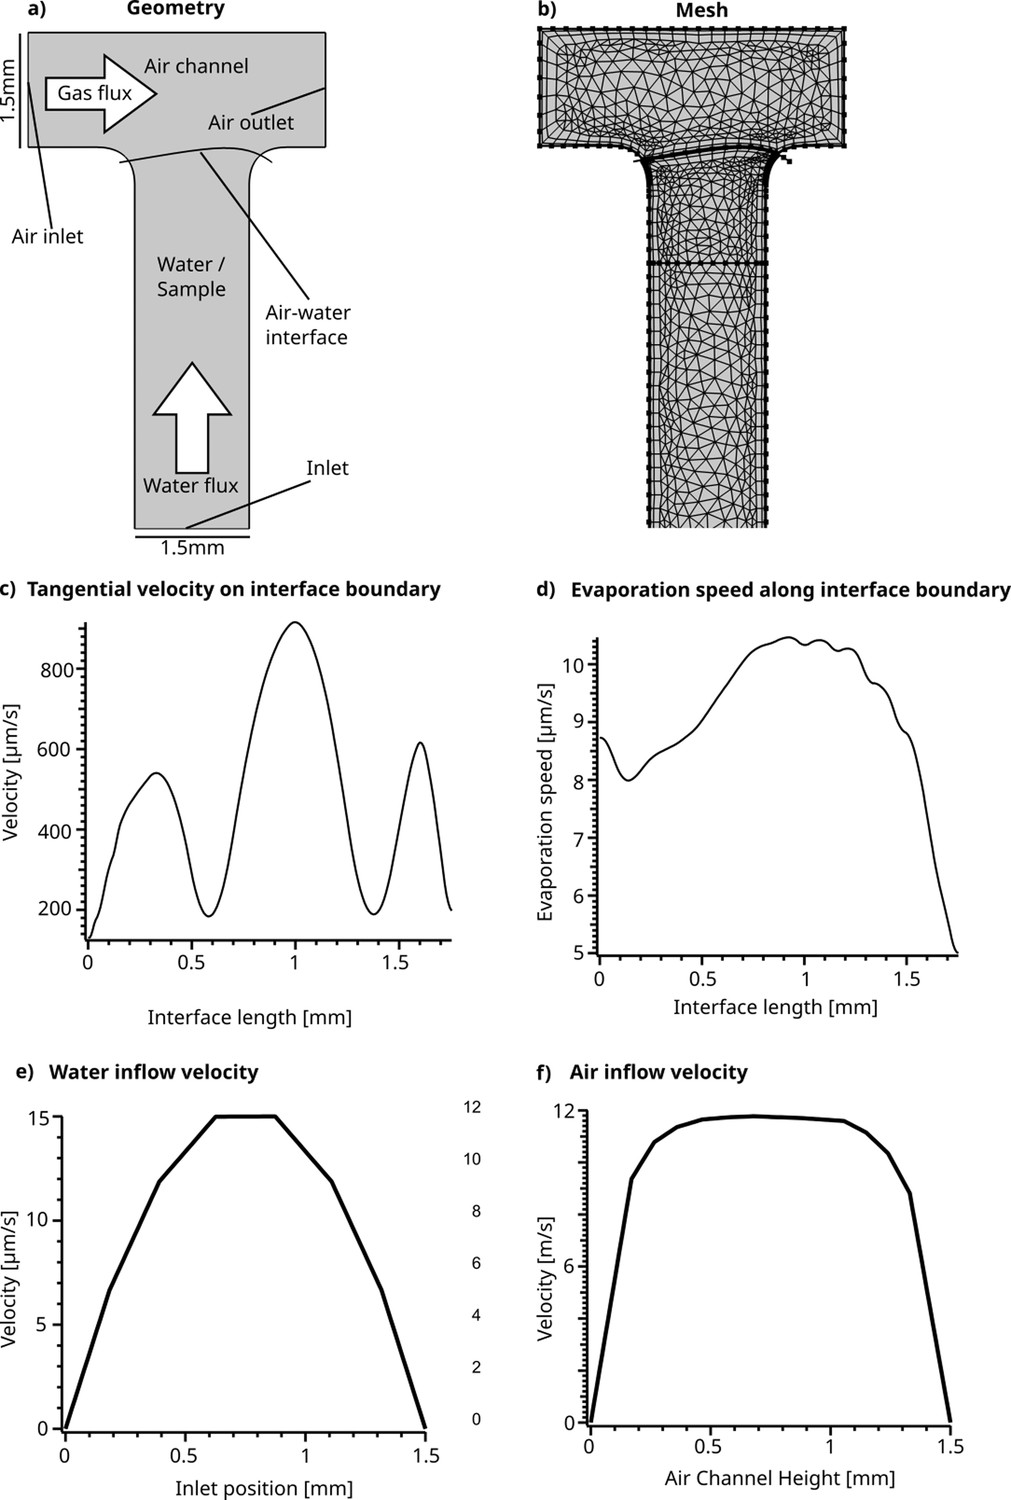
The geometry as it is used for the simulation and simulated velocities.
(a) The geometry as it is used for the simulation. (b) The geometry of the system after it has been meshed. (c) Tangential velocity directly at the interface. x-axis goes from the left-most point of the interface (see (a)) to the right-most. The velocity is induced by the momentum transfer of the gas brushing across the interface (boundary condition Equation 4). (d) Evaporation speed along the interface. (e) Parabolic flow profile at the inlet of the chamber in (a). (f) Parabolic flow profile of the gas flow measured at the inlet. More detailed information can be found in Appendix 5.
Figure 2—video 1
Fluorescence beads are used to track the fluid flow shown in Figure 2a.
Figure 2—video 2
Concentration of fluorescently labeled 63mer DNA is imaged to infer the accumulation at the interface in Figure 2b.
Color scale is the same as in Figure 2b.
Figure 2—video 3
Individual repeat #1 of Figure 2—video 2 showing raw data, underlining interfacial fluctuations.
Figure 2—video 4
Individual repeat #2 of Figure 2—video 2 showing raw data, underlining interfacial fluctuations.
Figure 2—video 5
Individual repeat #3 of Figure 2—video 2 showing raw data, underlining interfacial fluctuations.
Figure 3 with 4 supplements
Strand separation by salt cycling.
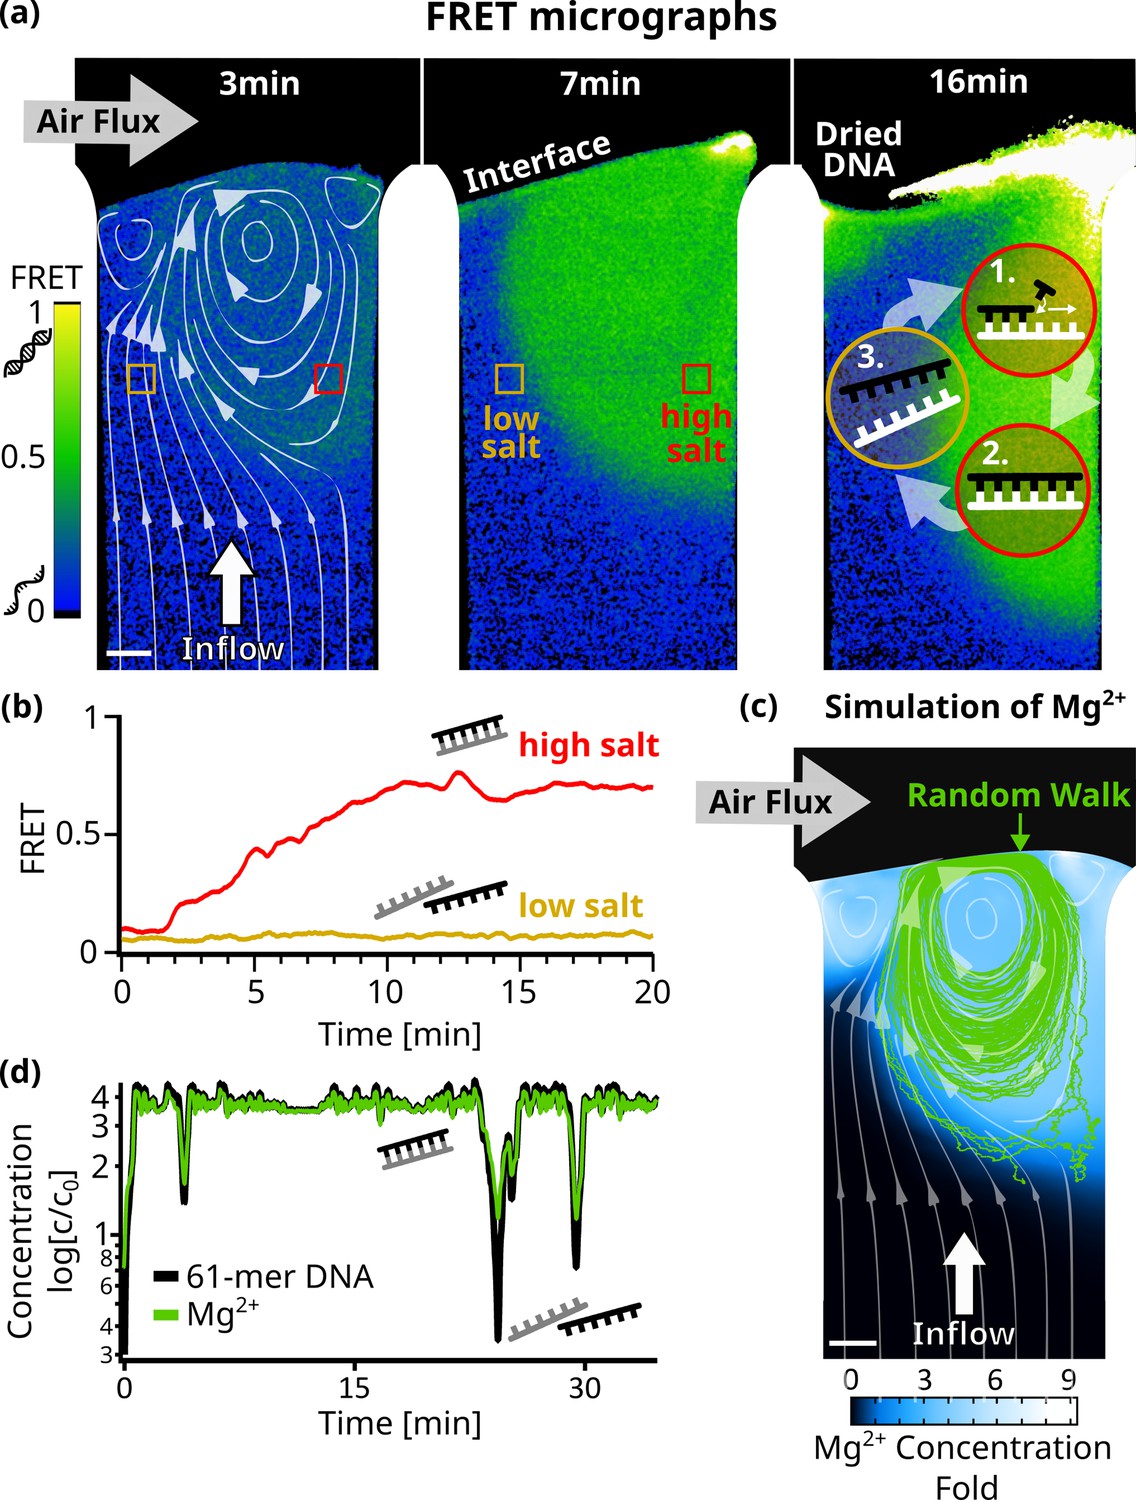
Fluorescence resonance energy transfer measurements revealed cycles of strand separation. (a) Micrographs of 24 bp DNA FRET pair in the chamber at 45 C. 1 µl sample (5 µM DNA, 10 mM TRIS pH7, 50 µM MgCl2, 3.9 mM NaCl) was subjected to a 3 nl/s diluting upflow of pure water and a gas flow of 230 ml/min across. The induced vortex, shown by the simulated flow lines (left panel), overlays with regions of high FRET indicative of double-stranded DNA. The vortex flow was expected to enable replication reactions by (1+2) strand replication in the high-salt region and (3) strand separation of template and replicate in the low-salt region. Fluctuations in interface position can dry and redissolve DNA, repeatedly (see ‘Dried DNA’ in right panel). (b) FRET signals confirmed strand separation in low-salt regions and strand annealing in high-salt regions in (a). After about 10 min, DNA and salt accumulated at the interface ,forming stable and clearly separated regions of low – where the influx from below reaches the interface – and high – located at the vortex – FRET signals. (c) Comsol simulation of Mg2+ ions D=705 in the chamber agreed with the FRET signal and showed up to ninefold salt accumulation at the interface. The path of a 61mer DNA molecule from a random walk model is shown by the green lines, and the white flowlines are taken from the simulation. (d) Concentrations along the DNA molecule path in (c) show oscillations relative to the initial concentration of up to threefold for Mg2+ and fourfold for 61mer DNA. This could enable replication cycles, as the vortex provides high salt concentrations for replication, while drops in salt and template concentrations regularly trigger strand separation.
Figure 3—figure supplement 1
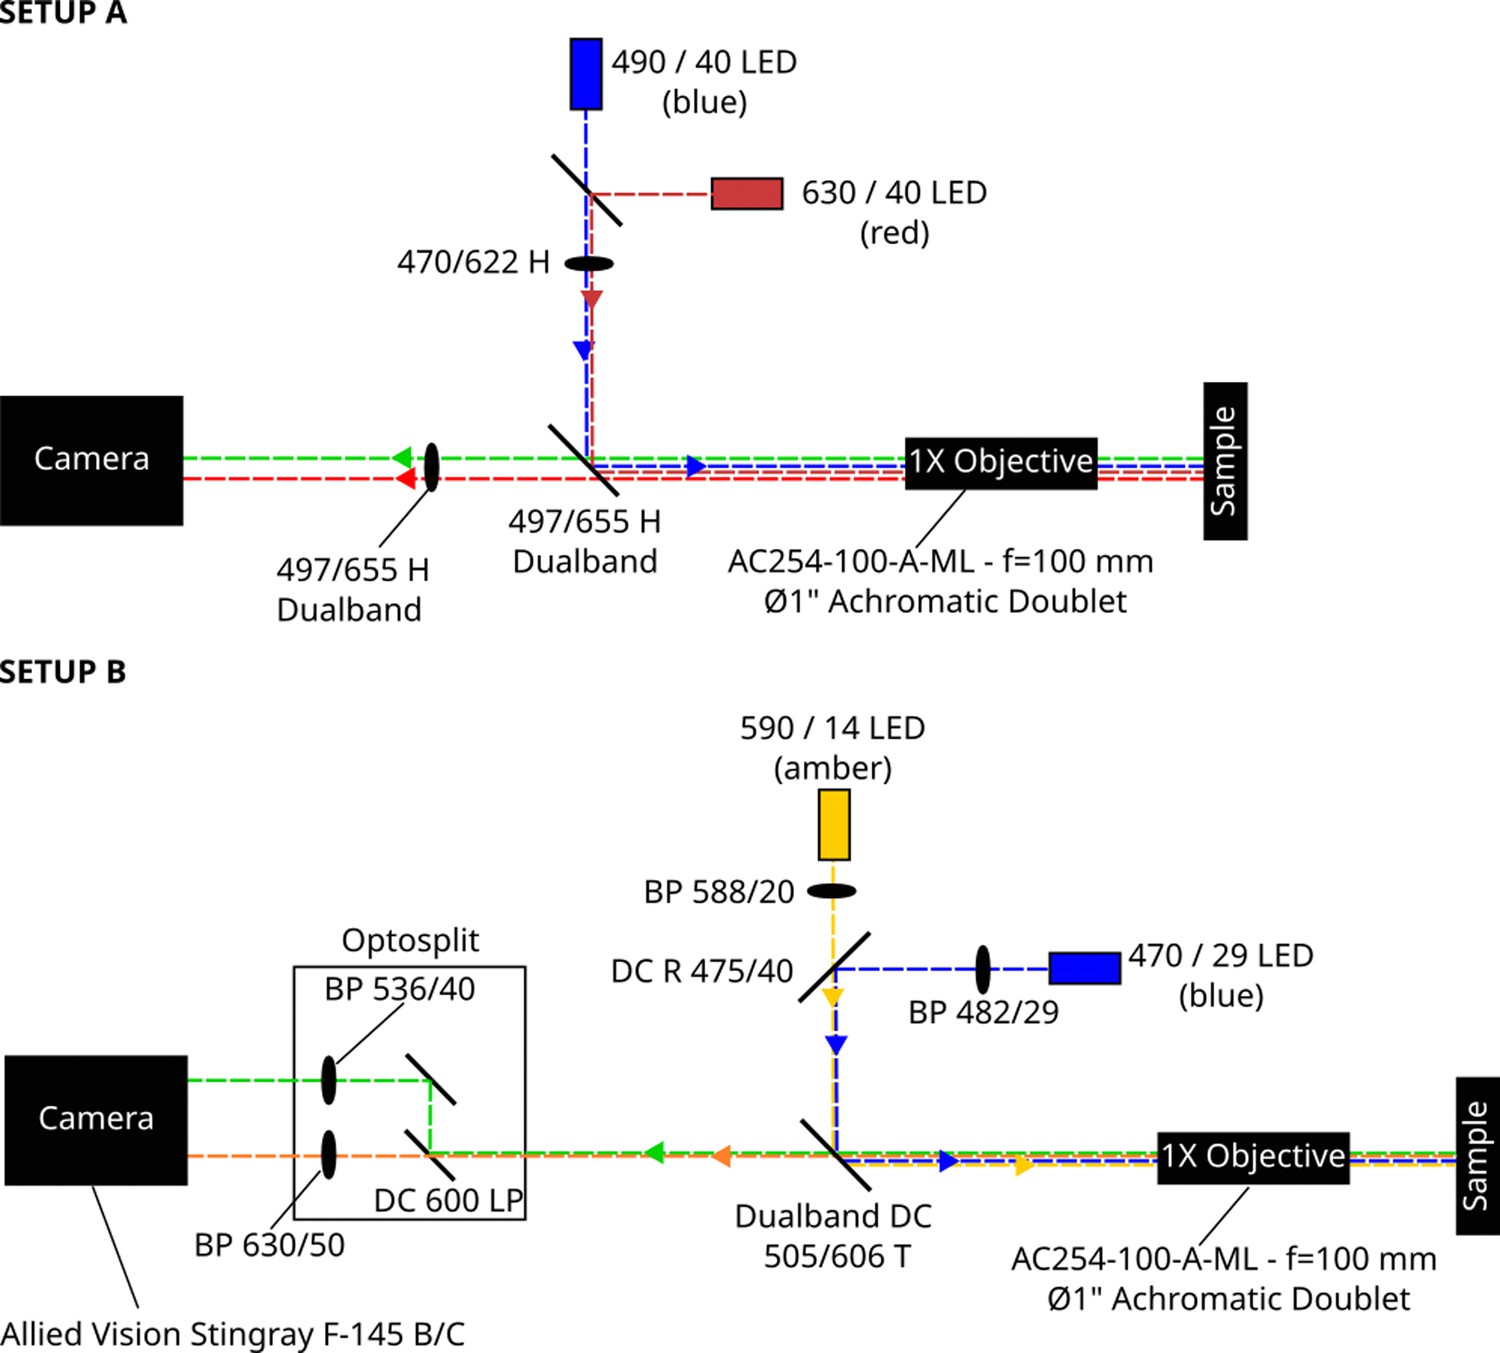
Schemes of microscopy setups used in this study.
Sketch of setup A and B used for all fluorescence imaging. Setup A was used for fluorescence measurements containing only fluorescent beads, DNA with a FAM/Cy5 label, and for those containing SYBR Green I. Setup B was used for FRET measurements using the FAM/ROX FRET pair. More detailed information can be found in Appendix 2.
Figure 3—figure supplement 2
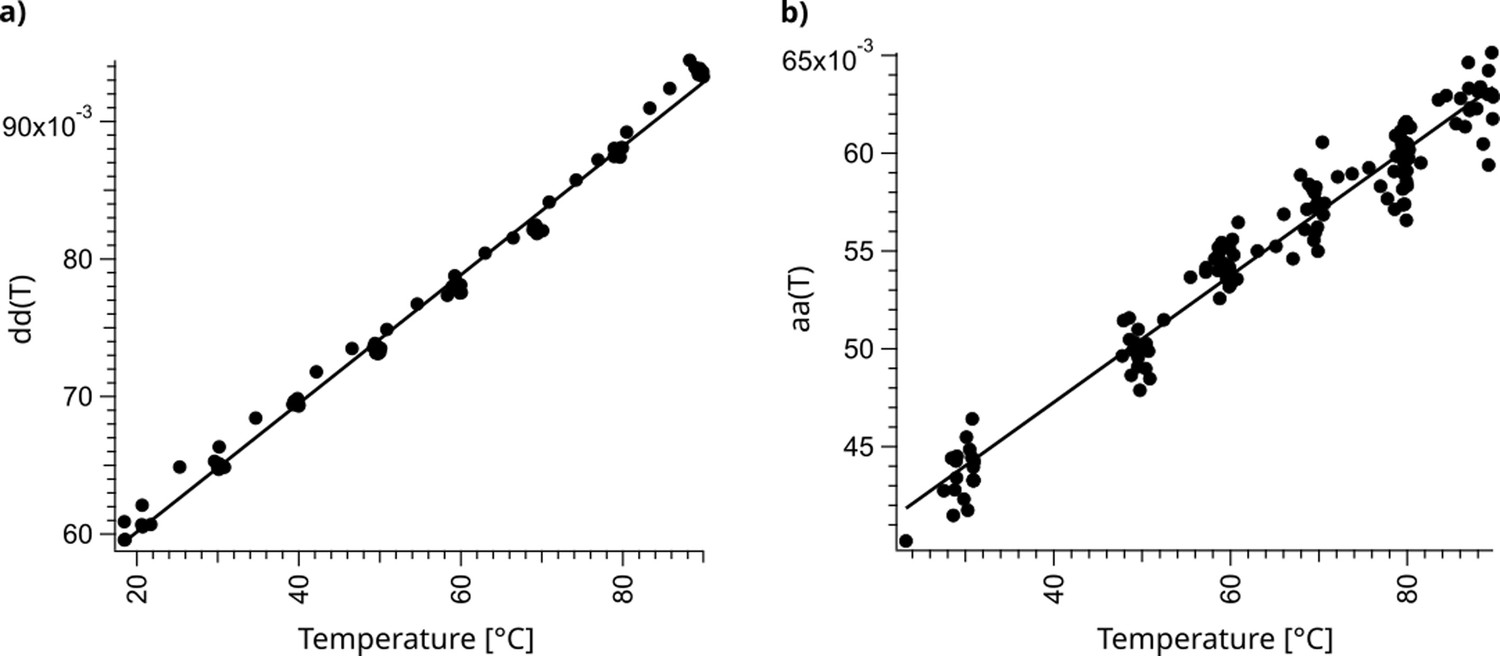
Crosstalk between donor and acceptor channel, (a): dd(T) and (b): aa(T), plotted as a function of temperature and fitted linearly.
More detailed information can be found in Appendix 6.
Figure 3—figure supplement 3
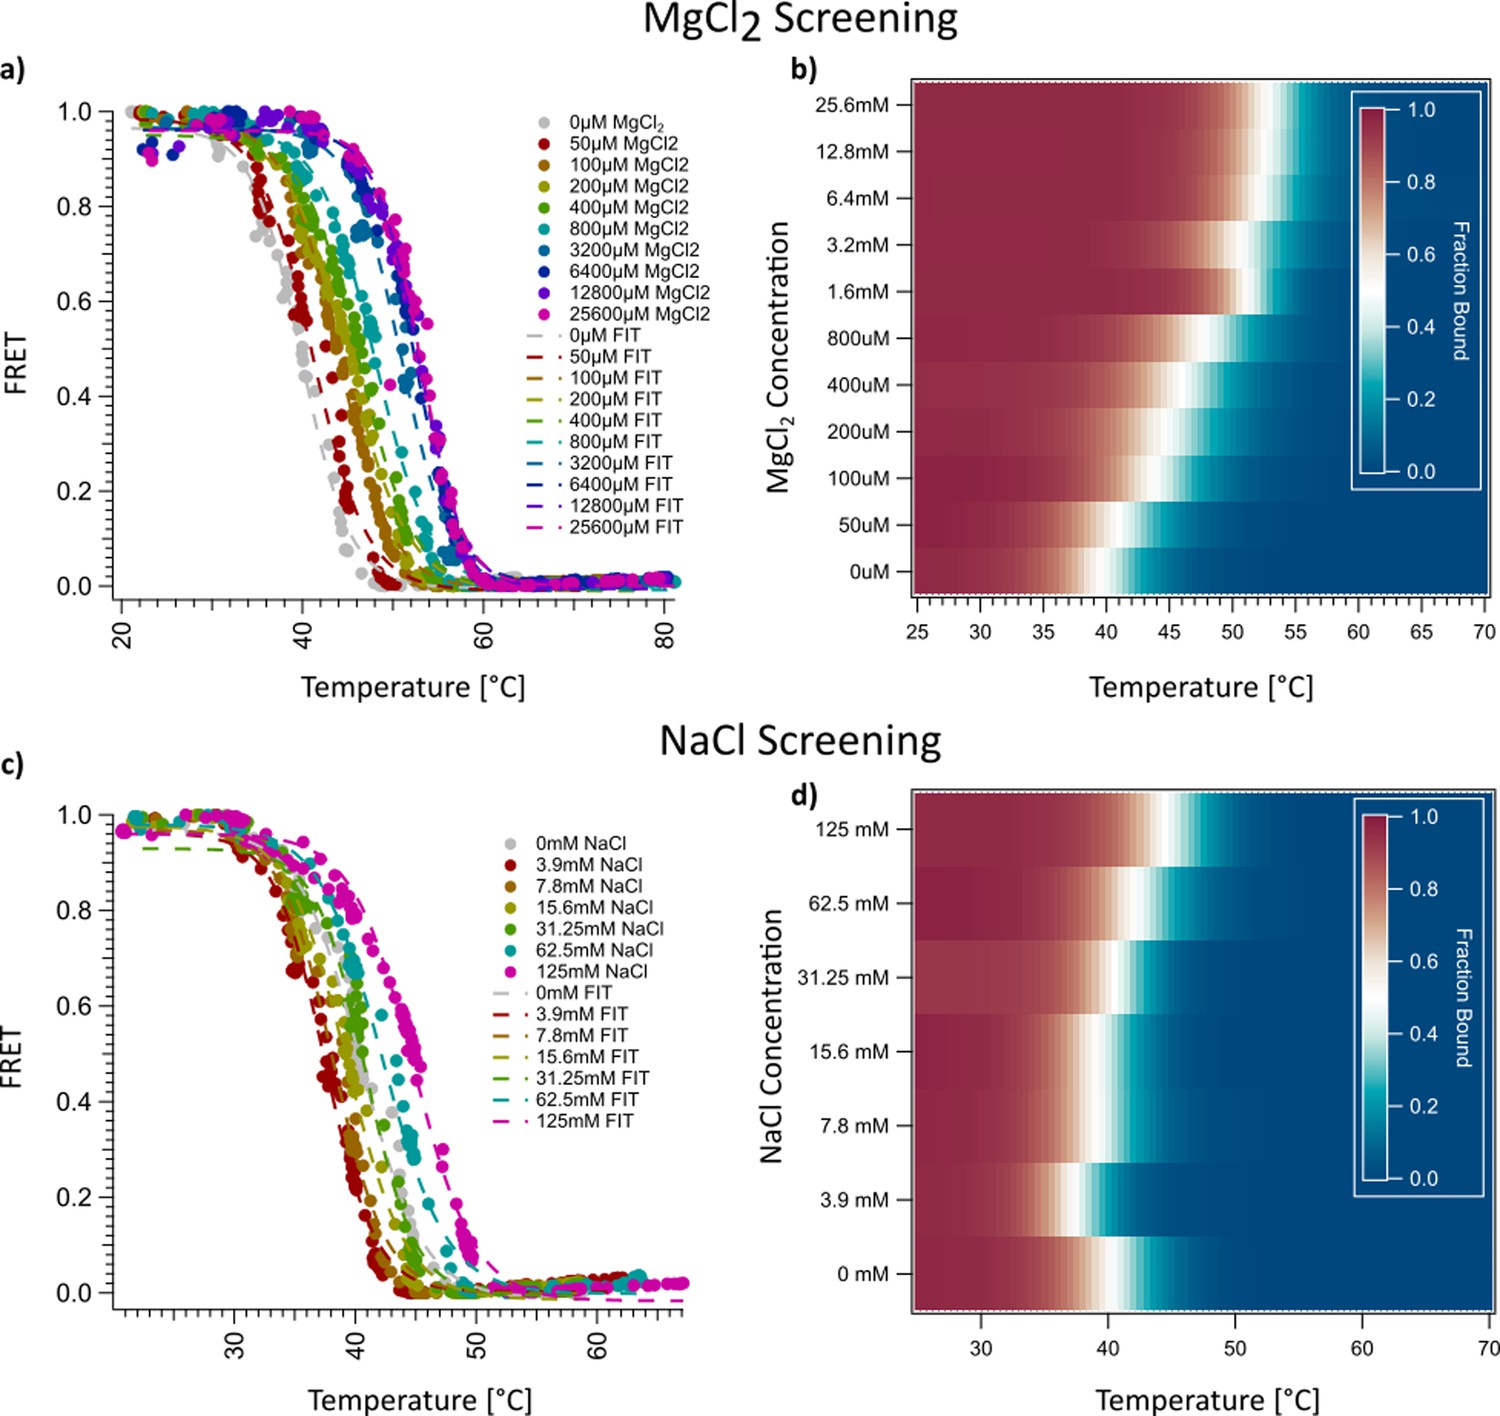
Melting curves performed in the FRET setup for NaCl and MgCl2 using the 24mer strands labeled with ROX and FAM, respectively.
(a) Raw data of the melting curves of different MgCl2 concentrations with 𝛼 and 𝛽 already applied for normalization. (b) Data from a displayed as a heatmap. The white areas display a fraction bound of 0.5 corresponding to the melting temperature T𝑚. Note that small oscillations in Mg2+ strongly influence the melting temperature, which can enable strand separation at isothermal settings. (c) Raw data of the melting curves of different NaCl concentrations with 𝛼 and 𝛽 already applied for normalization. (d) Data from c displayed as a heatmap. The white areas display a fraction bound of 0.5 corresponding to the melting temperature T𝑚. More detailed information can be found in Appendix 6.
Figure 3—video 1
FRET imaging of dual-labeled DNA strands discriminates between single-stranded DNA in blue and double-stranded DNA in green to yellow, as detailed in Figure 3a.
Figure 4 with 7 supplements
Replication.
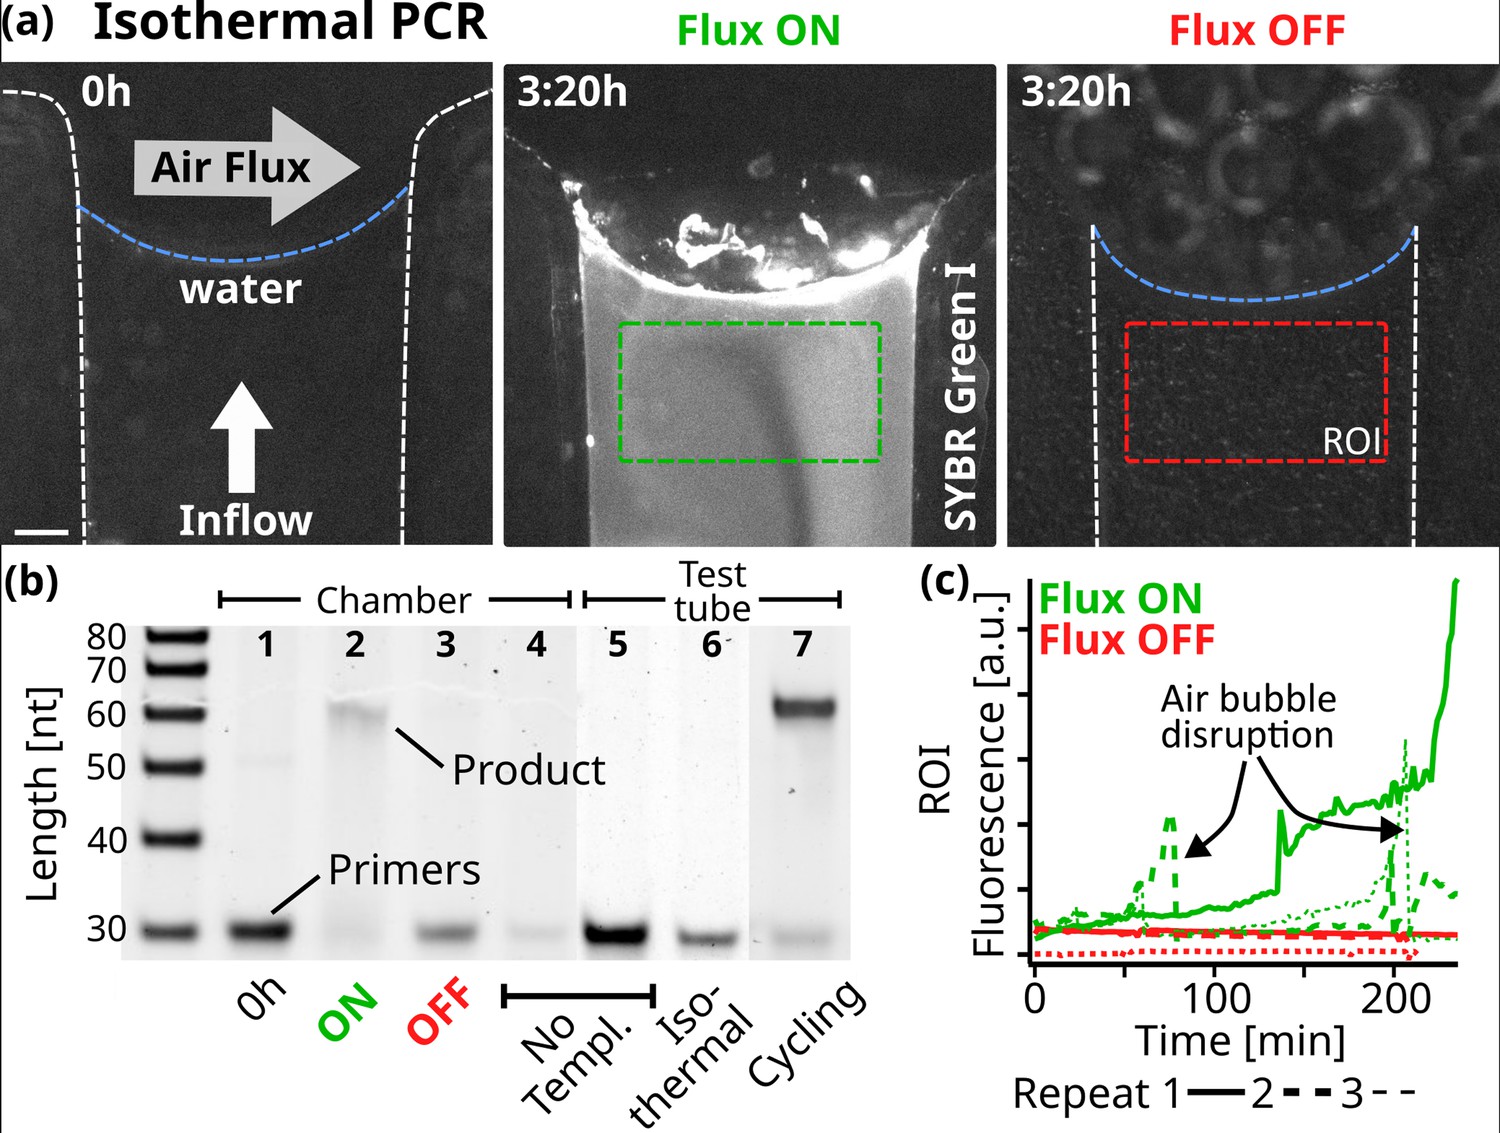
(a) Fluorescence micrographs of the PCR reaction in the chamber. At isothermal 68 °C, 10 µl of reaction sample was subjected to a constant 5 nl/s pure water flow toward the interface where a 250 ml/min gas flowed perpendicularly. The initial state on the left shows the background fluorescence. Fluorescence increased under flux (middle, after 3:20 hr), while without flux, the fluorescence signal remained minimal (right). The reaction sample consisted of 0.25 µM primers, 5 nM template, 200 µM dNTPs, 0.5 X PCR buffer, 2.5 U Taq polymerase, 2 X SYBR Green I. Scale bar is 250 µm. (b) 15% Polyacrylamide Gel Electrophoresis of the reactions and neg. controls. After 4 hr in the reaction chamber with air and water flux ON, the 61mer product was formed under primer consumption (2), unlike in the equivalent experiment with the fluxes turned OFF (3). At the beginning of the experiment (1) or in the absence of template (4), no replicated DNA was detected. The reaction mixture was tested by thermal cycling in a test tube (5-7). As expected, replicated DNA was detected only with the addition of template: (7) shows the sample after 11 replication cycles. The sample was also incubated for 4 hr at the chamber temperature (68 °C), yielding no product (6). Primer band intensity variations are caused by material loss during extraction from the microfluidic chamber. (c) SYBR Green I fluorescence increased when gas and water flow were turned on, but remained at background levels without flow. Fluorescence was averaged over time from the green and red regions of interest shown in (a). Dotted lines show the data from independent repeats. Air bubbles formed through degassing can momentarily disrupt the reaction. SYBR Green I fluorescence indicates replication, as formed products are able to hybridize.
-
Figure 4—source data 1
Original files for PAGE analysis displayed in Figure 4b.
- https://cdn.elifesciences.org/articles/100152/elife-100152-fig4-data1-v1.zip
-
Figure 4—source data 2
PAGE images indicating the relevant bands displayed in Figure 4b.
- https://cdn.elifesciences.org/articles/100152/elife-100152-fig4-data2-v1.zip
Figure 4—figure supplement 1
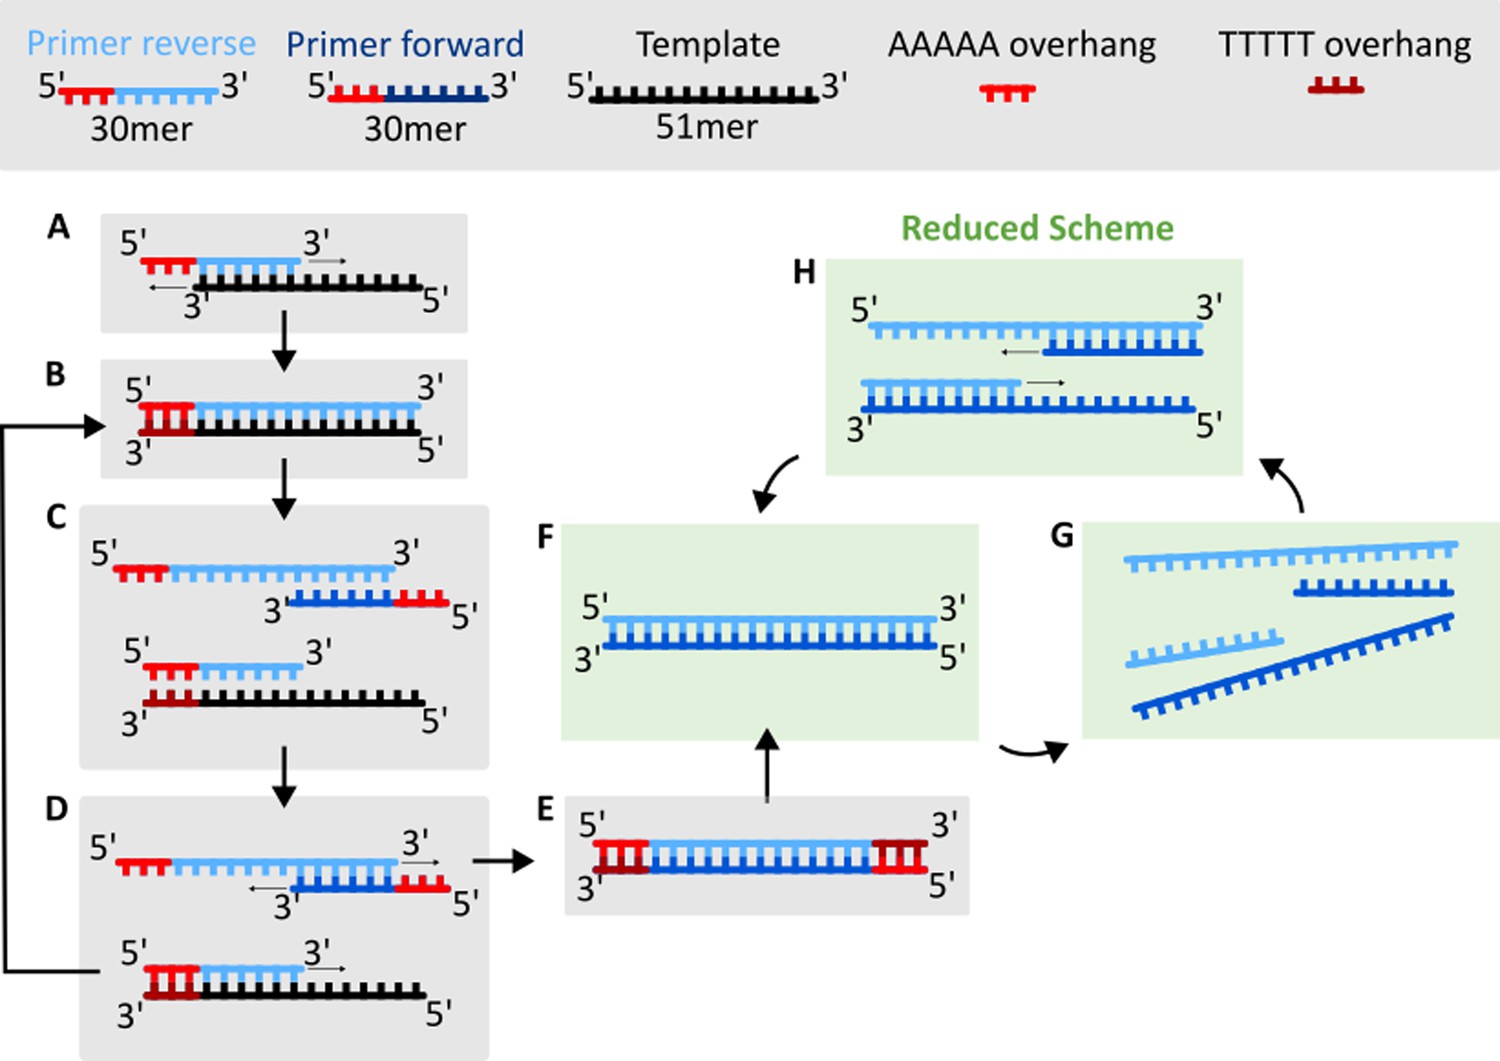
Complete schematic of the replication reaction using Taq polymerase.
(A) The 30mer reverse primer binds to the 51mer template. The 5-A overhang remains unbound. (B) Taq polymerase adds nucleotides from 3’ to 5’, and a complete double strand is formed, now containing 56 base pairs. (C) After strand separation, the newly formed 56mer intermediate product with a 5-A overhang at the 5’ end and the intermediate 56mer template with a 5-T overhang at the 3’ end are bound by the primers. (D) In one case, Taq elongates the forward primer bound to the intermediate product and proceeds to step E. In the other case, elongation of the reverse primer bound to the intermediate template leads back to step B. (E) The result of the extension is a new product and a new template of 61 bases each. From here, the cycle enters the ‘reduced scheme’. The newly formed products, together with the original primers, now replicate exponentially: (F) The double strand formed in E can now be considered as product and template for the reduced scheme. (G) After de-hybridization, both primers can anneal to template and product. (H) Taq extends again from 3’ to 5’, forming two new double strands of template and product, doubling their amount and completing one cycle of exponential amplification.
Figure 4—figure supplement 2
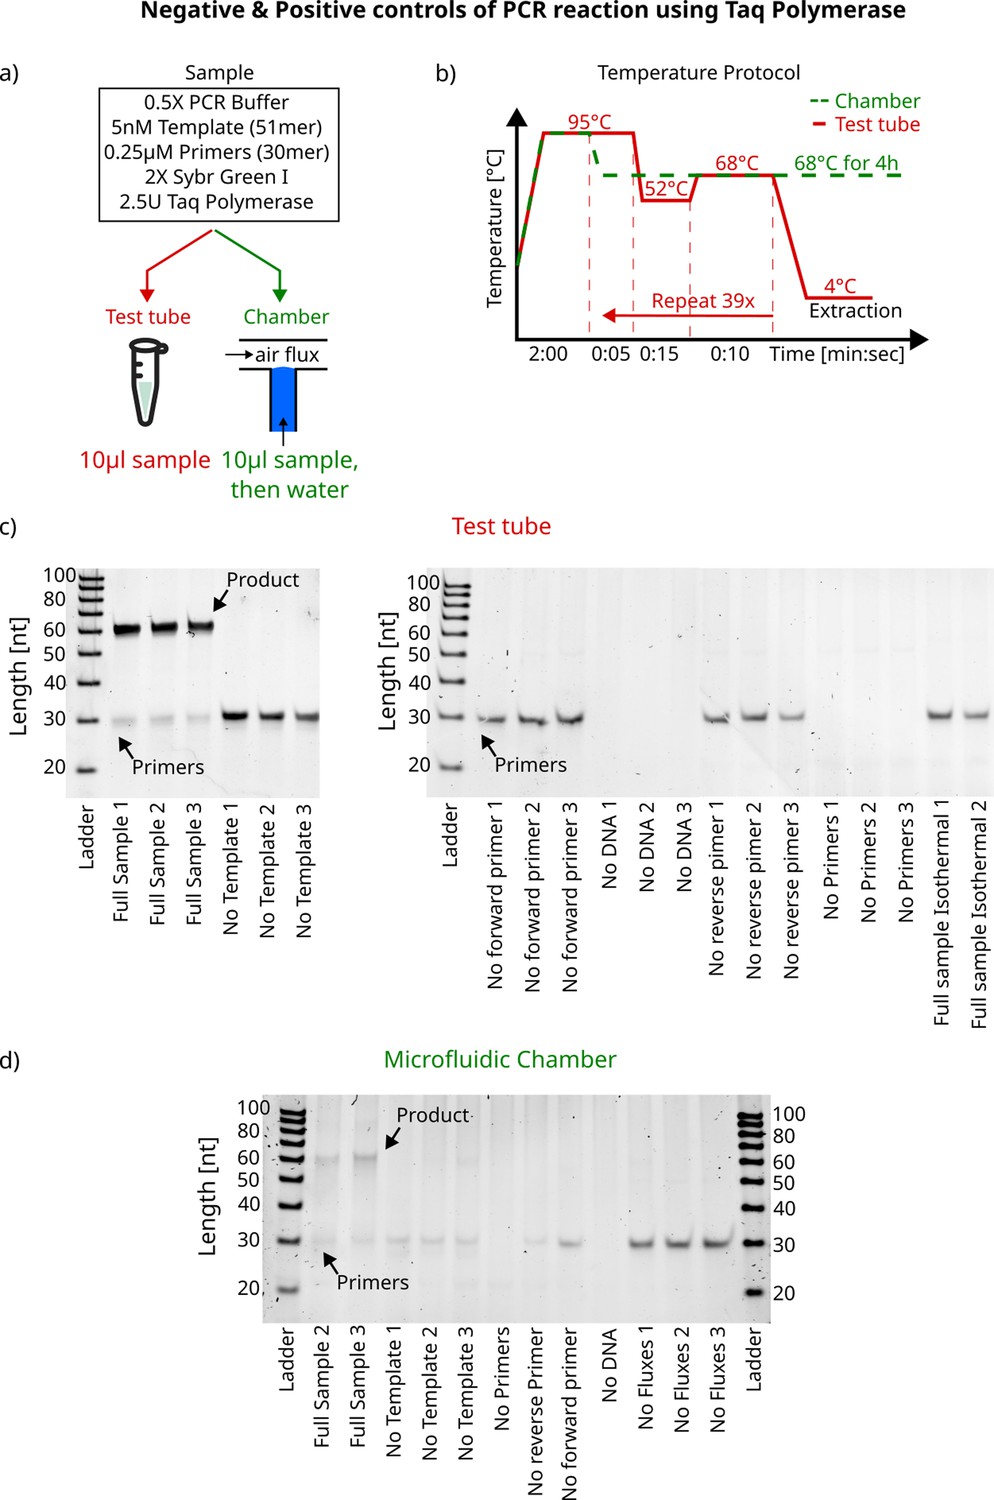
PAGE analysis of Taq PCR reactions.
(a) Sample composition used for the PCR reaction. The sample is either placed in a test tube (Eppendorf tube) and the temperature is controlled in a thermocycler (red text), or 10 µl of the sample is loaded into the microfluidic chamber prior to dilution water inflow (green text). (b) Temperature protocol for the two individual experiments. In the thermocycler (red line), the sample undergoes a heat activation step at 95°C, followed by an annealing step at 52°C for 15s, then a replication step at 68°C for 10s. This is repeated 40 times before the sample is extracted and stored at -20°C prior to loading on a gel. Chamber experiments are performed at isothermal 68°C after the same heat activation step and extracted after 4 hr. (c) PAGE images for the test tube samples. ‘Full sample isothermal 1 and 2’ samples have the same temperature protocol as the chamber samples. A slight band may be visible around 51 nt caused by the 5nM of the 51 mer template. The numbers indicate the nth replicate of the experiment. (d) PAGE image of the chamber control experiments. Primer fluorescence varies between samples, which is caused by variability during sample extraction or primer consumption by Taq (in the case of ‘Full Sample’).
-
Figure 4—figure supplement 2—source data 1
Original files for PAGE analysis displayed in Figure 4—figure supplement 2c and d.
- https://cdn.elifesciences.org/articles/100152/elife-100152-fig4-figsupp2-data1-v1.zip
-
Figure 4—figure supplement 2—source data 2
PAGE images indicating the relevant bands displayed in Figure 4—figure supplement 2c and d.
- https://cdn.elifesciences.org/articles/100152/elife-100152-fig4-figsupp2-data2-v1.zip
Figure 4—figure supplement 3
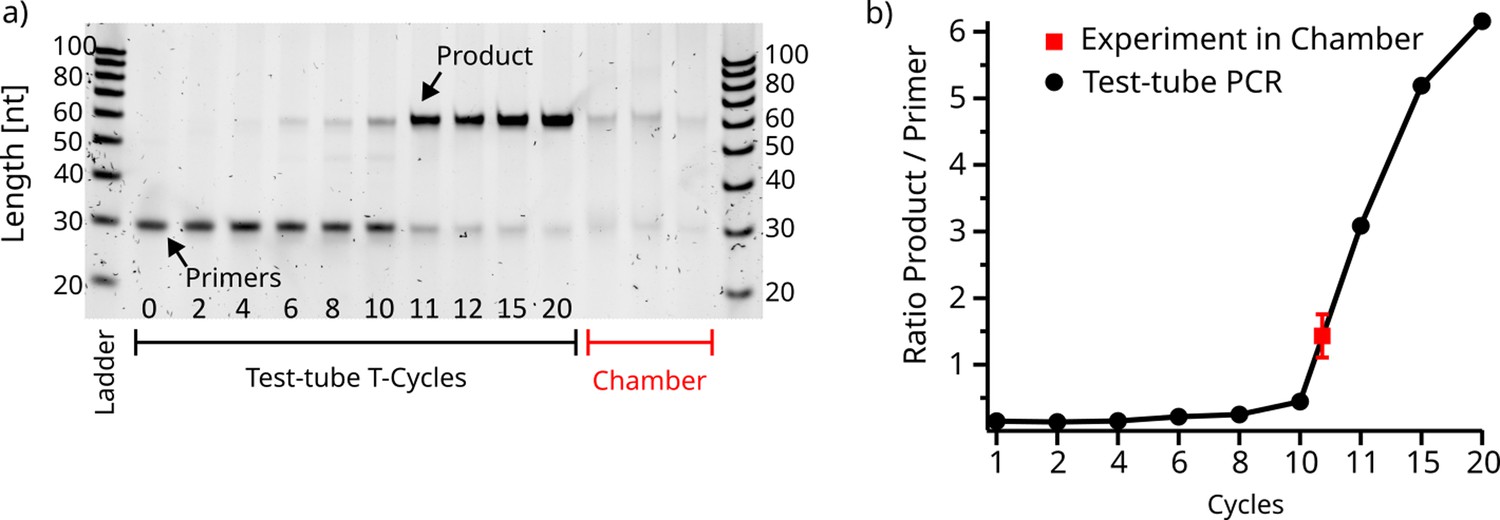
Comparison of test-tube temperature cycling vs. chamber experiments.
(a) Full Sample (10µL of 2.5U of AllTaq polymerase, 2XSYBR GreenI, 5nM template, 0.25µM of each primer, 200 µM of each dNTP and 0.5X PCR buffer) were subjected to various amounts of temperature cycles, as displayed in Figure 4—figure supplement 2b. The more cycles are performed, the more primers are consumed to form the product strand. The three experiments performed in the chamber show a generally lower gel intensity, which is due to losses during sample extraction from the microfluidic chamber. (b) Comparison of Product/Primer intensity ratio of the test-tube sample to the extracted chamber samples. This reveals that in the 4 hr chamber experiment about 10-11 cycles were performed. Error bar of the experiment data point is the standard deviation of the three chamber samples in b.
-
Figure 4—figure supplement 3—source data 1
Original files for PAGE analysis displayed in Figure 4—figure supplement 3a.
- https://cdn.elifesciences.org/articles/100152/elife-100152-fig4-figsupp3-data1-v1.zip
-
Figure 4—figure supplement 3—source data 2
PAGE images indicating the relevant bands displayed in Figure 4—figure supplement 3a.
- https://cdn.elifesciences.org/articles/100152/elife-100152-fig4-figsupp3-data2-v1.zip
Figure 4—video 1
Top fraction of the chamber used for the figures.
SYBR green fluorescence shows the amount of DNA generated in the replication reaction, indicated by a rise in fluorescence showing how DNA becomes copied for Figure 4a. In addition, the accumulation at the interface is also seen.
Figure 4—video 2
Individual repeat #1 of Figure 4—video 1.
Note how gas bubbles formed from degassing travel upwards the channel, drying off the reaction until the channel is filled with liquid again.
Figure 4—video 3
Individual repeat #2 of Figure 4—video 1.
Note how gas bubbles formed from degassing travel upwards the channel, drying off the reaction until the channel is filled with liquid again.
Figure 4—video 4
Whole length of the chamber.
SYBR green fluorescence shows the amount of DNA generated in the replication reaction, indicated by a rise in fluorescence showing how DNA becomes copied for Figure 4a.
Appendix 8—figure 1

Theoretical hydrolysis of RNA in the deployed experimental conditions calculated for the Monte-Carlo trace of Fig.
Figure 3 as well as for constant Mg2+ concentrations.
Tables
Appendix 1—table 1
DNA sequences as ordered from biomers.net.
| Length | 5’- Sequence –3’ | Label |
|---|---|---|
| 63mer | CCAGCCTCCAGTGCCTCGTATCATTGTGCCAA AAGGCACAATGATACGAGGCACTGGAGGCTG | 5′ FAM |
| 24mer FRET strand 1 | CGTAGTAAATA8CTAGCTAAAGTG | 8=FAM |
| 24mer FRET strand 2 | CACTTTAGCTAGA8ATTTACTACG | 8=ROX |
| 51mer Template | TTAGCAGAGCGAGGTATGTAGGCG GGACGCTCAGTGGAACGAAAACTCACG | - |
| 30mer forward primer | AAAAA TTA GCA GAG CGA GGT ATG TAG GCG G | - |
| 30mer reverse primer | AAAAA CGT GAG TTT TCG TTC CAC TGA GCG T | - |
Appendix 5—table 1
Parameters used for the finite elements simulation.
Final set of parameters used to simulate the system. Water-specific parameters such as dynamic viscosity or density were taken from inbuilt features of COMSOL Multiphysics 5.
| Parameter | Value | Description |
|---|---|---|
| (21.2E-6)*(1/1[K])*(1 + (0.0071*(T - 273))) [m2/s] | Diffusion Vapor | |
| 643*n-0.46[µm2/s]=95.6 µm2/s | Diffusion Coefficient of a 63mer DNA Strand Mast et al., 2013 | |
| 705 µm2/s | Diffusion Coefficient of Mg Yuan-Hui and Gregory, 1974 | |
| humidity*0.01*(exp(20.386-(5132[K]/T))[mmHg]) / (R * T) | Initial Vapor concentration | |
| Humidity | 40 % | Ambient relative humidity |
| (exp(20.386 - (5132[K]/T))[mmHg]) | Vapor saturation pressure | |
| psat/(R*T) | Vapor saturation concentration | |
| 0.0180 [kg/mol] | Molar mass of vapor | |
| 18.01528 [g/mol] | Molar mass of water | |
| T | 45 °C | Temperature |
Appendix 6—table 1
Channel definitions for FRET calculation.
First capital letter denotes the excitation wavelength (D=Donor, A=Acceptor), second the measured emission wavelength and the subscript stands for the label used in a separate experiment to determine crosstalk-related artifacts.
| Channel | Excitation | Emission | Label |
|---|---|---|---|
| DD | FAM - 470 nm | FAM - 536 nm | FAM/ROX |
| DA | FAM - 470 nm | ROX - 630 nm | FAM/ROX |
| AA | ROX - 590 nm | ROX - 630 nm | FAM/ROX |
| AD | ROX - 590 nm | FAM - 536 nm | FAM/ROX |
| AAA | ROX - 590 nm | ROX - 630 nm | ROX |
| DAA | FAM - 470 nm | ROX - 630 nm | ROX |
| DDD | FAM - 470 nm | FAM - 536 nm | FAM |
| DAD | FAM - 470 nm | ROX - 630 nm | FAM |
Additional files
Download links
A two-part list of links to download the article, or parts of the article, in various formats.
Downloads (link to download the article as PDF)
Open citations (links to open the citations from this article in various online reference manager services)
Cite this article (links to download the citations from this article in formats compatible with various reference manager tools)
Prebiotic gas flow environment enables isothermal nucleic acid replication
eLife 13:RP100152.
https://doi.org/10.7554/eLife.100152.3


