Mediator kinase inhibition suppresses hyperactive interferon signaling in Down syndrome
- Department of Biochemistry, University of Colorado, United States
- Department of Molecular, Cellular, and Developmental Biology, University of Colorado, United States
- BioFrontiers Institute, University of Colorado, United States
- Department of Biochemistry and Molecular Genetics, University of Colorado School of Medicine, United States
- UC-Denver RNA Bioscience Initiative, United States
- Crnic Institute Boulder Branch, United States
- Linda Crnic Institute for Down Syndrome, University of Colorado Anschutz Medical Campus, United States
- Metabolon Inc, Durham, United States
- Department of Pharmacology, University of Colorado Anschutz Medical Campus, United States
Figures
Figure 1 with 2 supplements
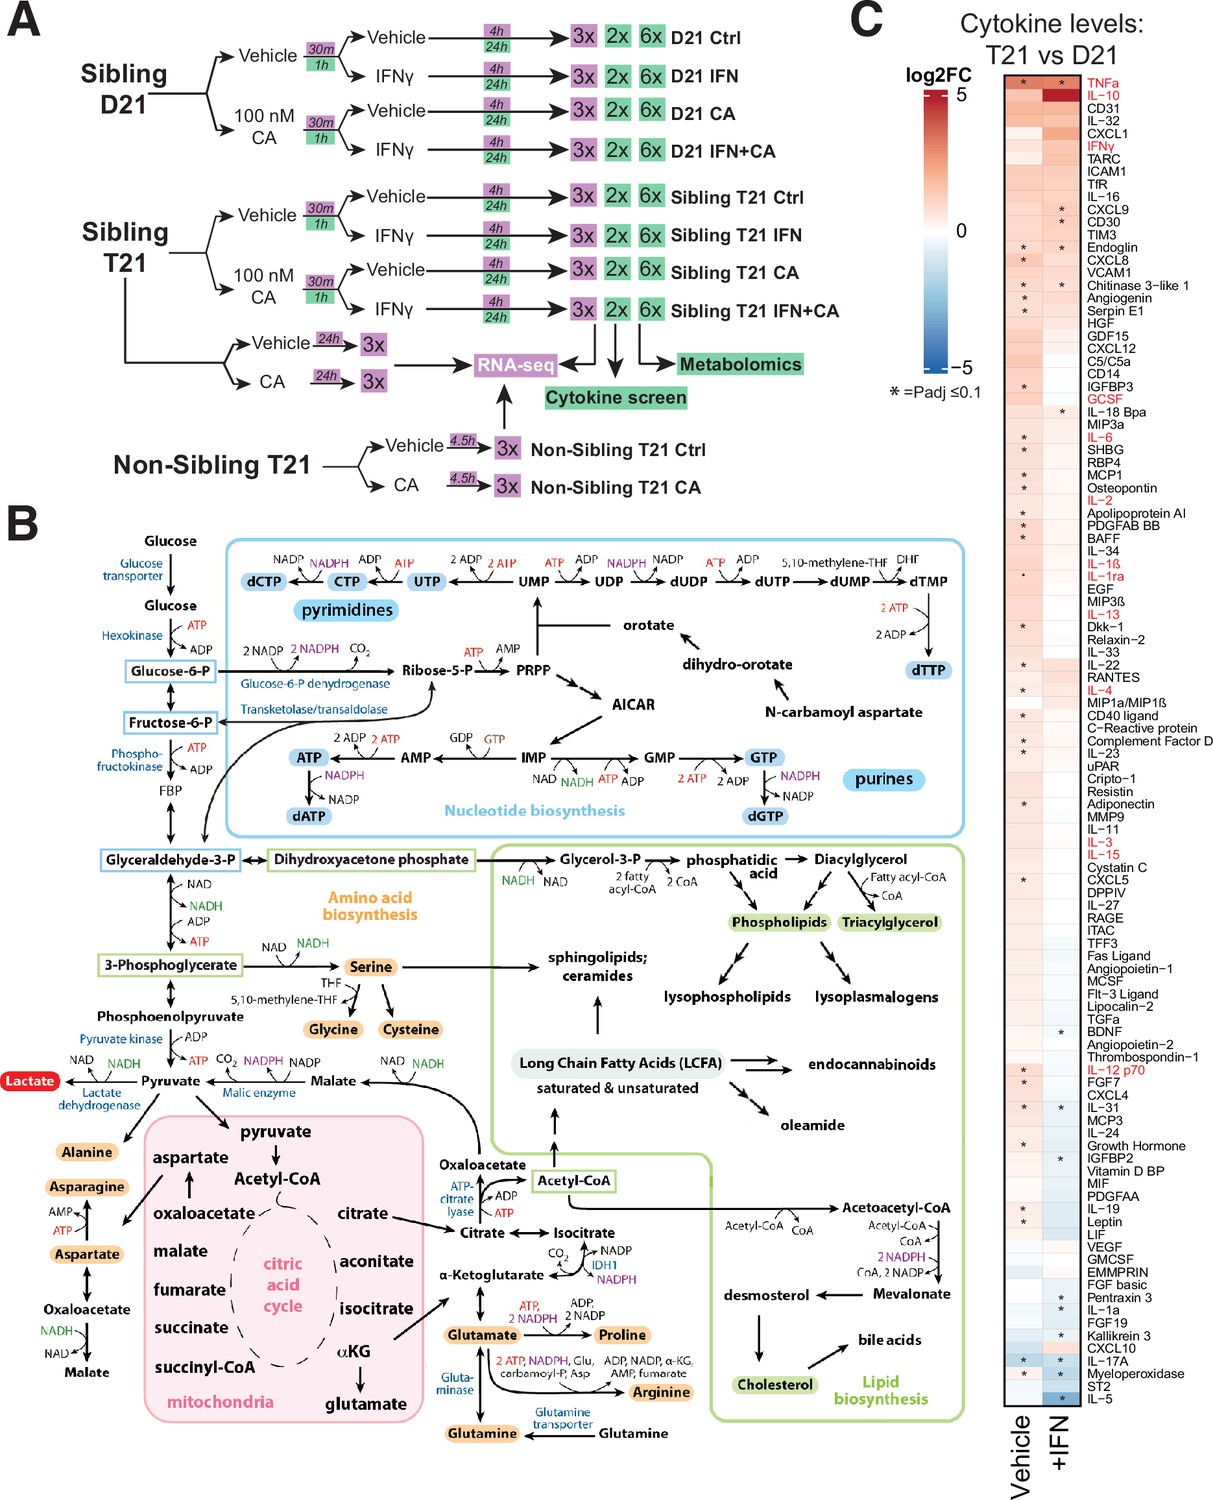
Experimental overview; elevated cytokines in T21 cells.
(A) Schematic of cell treatment and data collection workflow for metabolomics, cytokine screen (green shading) and RNA-seq (purple shading). (B) Simplified diagram of human metabolic pathways, with an emphasis on those relevant to this study. Figure adapted from Lunt and Vander Heiden, 2011. (C) Heatmap of all cytokines measured (n = 105), comparing relative levels in vehicle-treated T21 cells vs. vehicle-treated D21 cells (left column) and relative levels in IFNγ-treated T21 cells vs. IFNγ-treated D21 cells (right column). Asterisk denotes padj ≤ 0.1.
-
Figure 1—source data 1
RNA-seq data summary.
- https://cdn.elifesciences.org/articles/100197/elife-100197-fig1-data1-v1.xlsx
-
Figure 1—source data 2
Metabolomics data.
- https://cdn.elifesciences.org/articles/100197/elife-100197-fig1-data2-v1.xlsx
-
Figure 1—source data 3
Cytokine screen data.
- https://cdn.elifesciences.org/articles/100197/elife-100197-fig1-data3-v1.xlsx
-
Figure 1—source data 4
Gene set enrichment analysis (GSEA) results.
- https://cdn.elifesciences.org/articles/100197/elife-100197-fig1-data4-v1.xlsx
-
Figure 1—source data 5
Ingenuity Pathway Analysis (IPA) results.
- https://cdn.elifesciences.org/articles/100197/elife-100197-fig1-data5-v1.xlsx
-
Figure 1—source data 6
GO pathway analysis involving comparisons with Human Trisome Project large cohort study.
- https://cdn.elifesciences.org/articles/100197/elife-100197-fig1-data6-v1.xlsx
Figure 1—figure supplement 1
Comparisons between T21 and D21 cells.
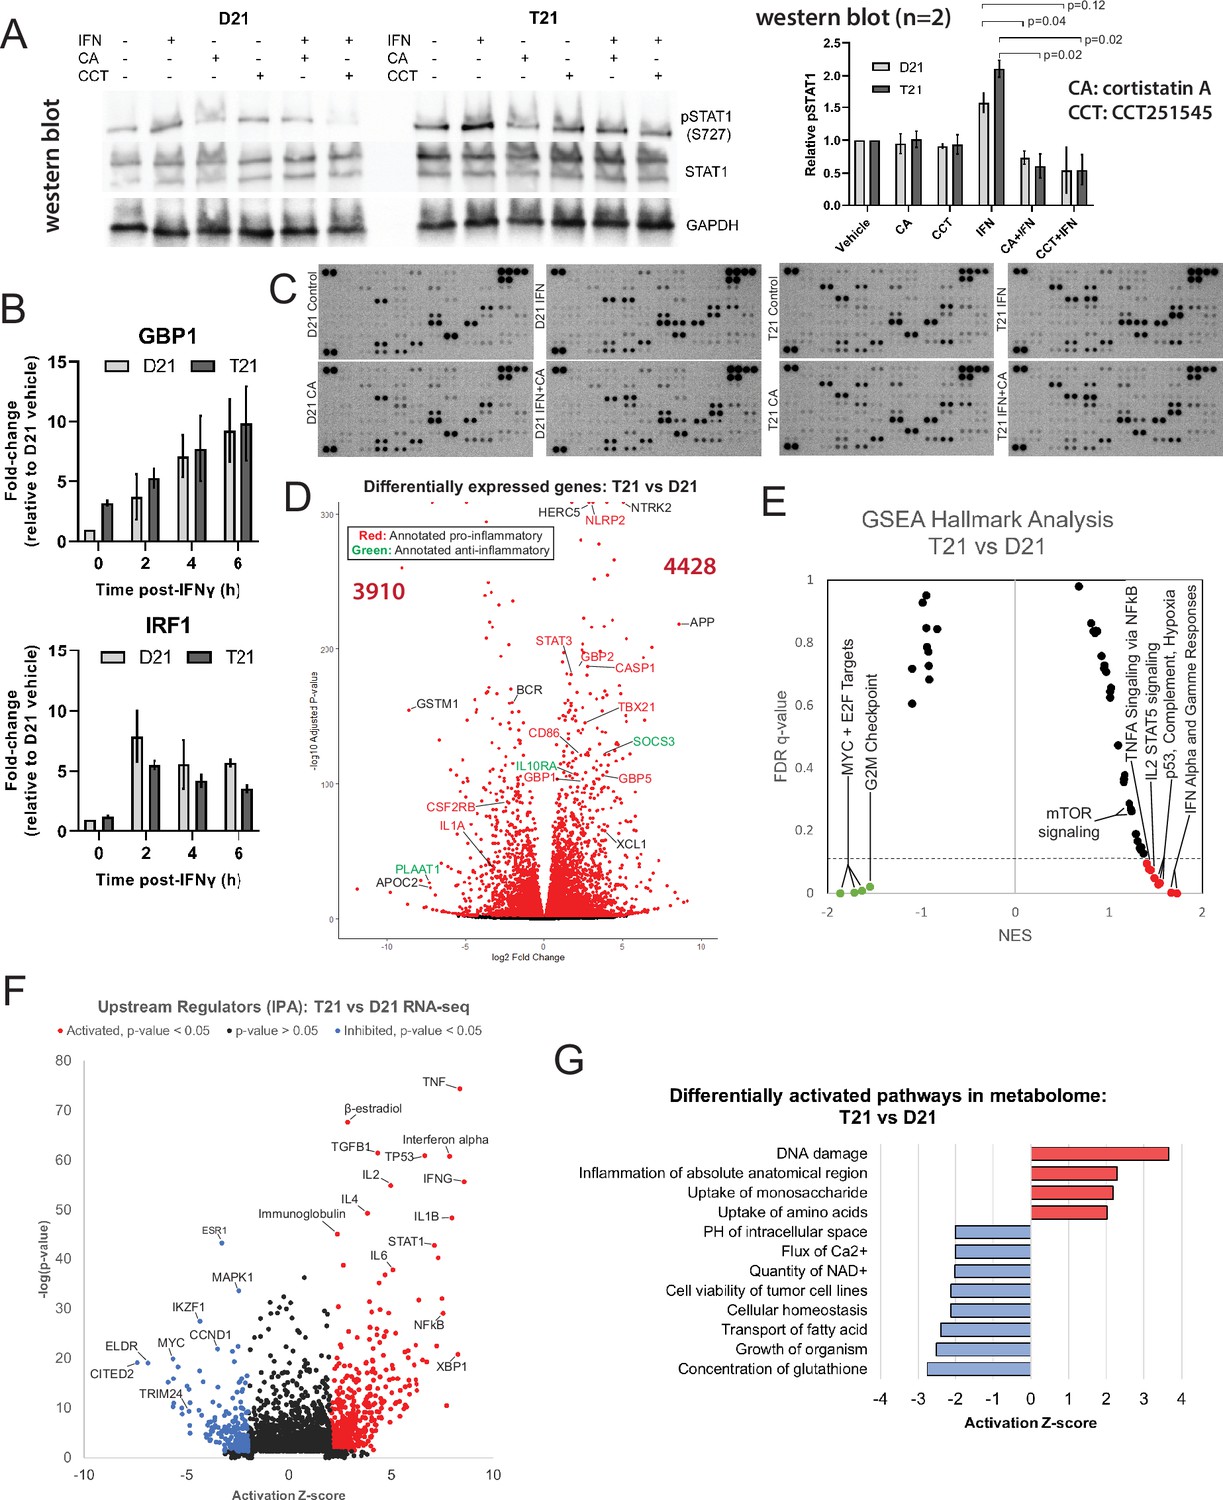
(A) Western blots of STAT1 S727 phosphorylation following 45-min treatment with IFNγ with or without 30-min pretreatment with cortistatin A (100 nM) or CCT251545 (250 nM), two structurally distinct inhibitors of CDK8/19. At right, data represented as mean ± SD from two biological replicate experiments. (B) Time course of relative gene expression levels measured by real-time quantitative PCR (RT-qPCR) of GBP1 and IRF1, two interferon stimulated genes, following treatment with 10 ng/ml IFNγ compared to untreated cells. Data normalized to expression of GAPDH and represented as mean ± SD from two independent experiments. Inset panel represents relative basal expression of each gene in untreated T21 cells compared to untreated D21 cells. (C) Representative data from cytokine protein arrays. Arrays were incubated with cell lysates (250 µg total protein) treated as shown. Multiple exposures were taken to ensure that every spot was measured in the linear range; duplicate spots were averaged. Averaged intensity values from two biological replicates/condition were analyzed using ANOVA. (D) Volcano plot of differentially expressed genes in T21 cells compared to D21; selected genes are color-coded based on pro-inflammatory (red), anti-inflammatory (green), or other (black) roles in IFN signaling. Genes represented by red dots have an adjusted p-value of <0.01. (E) Gene set enrichment analysis (GSEA) moustache plot of Hallmark pathways comparing T21 cells with D21. (F) Ingenuity Pathway Analysis of upstream regulators predicted to be responsible for differential transcription in T21 cells compared to D21 cells. Analysis used genes >1.25× up- or downregulated, with an adjusted p-value <0.1. List of regulators was filtered to exclude drugs or other exogenous compounds. (G) Selected results of pathway analysis based on metabolite levels in untreated T21 compared with D21 cells, using the ‘Diseases & Functions’ list from Ingenuity Pathway Analysis.
Figure 1—figure supplement 2
Metabolic differences in T21 vs. D21; data comparison with whole blood cohort clinical studies.
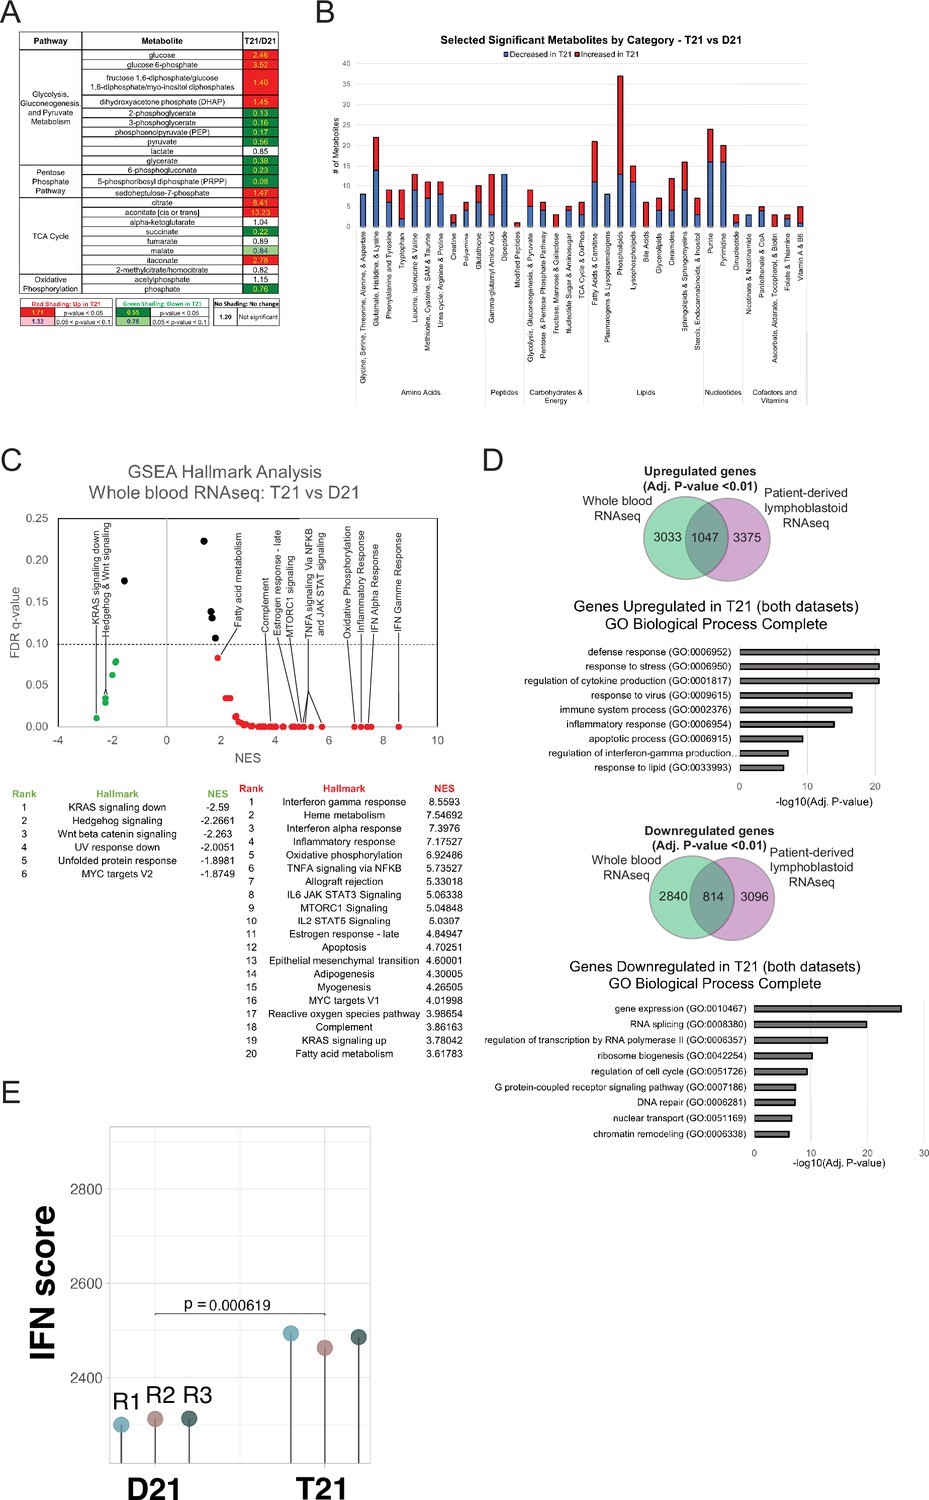
(A) Relative levels of metabolites from core metabolic pathways in untreated T21 cells compared with untreated D21 cells. (B) Differential metabolites summary (ANOVA p-value <0.1) in untreated T21 cells relative to untreated D21 cells, broken down by category; excludes unknown and xenobiotic metabolites. (C) Gene set enrichment analysis (GSEA) moustache plot of Hallmark pathway activation in whole blood samples from a cohort study of T21 individuals compared to euploid controls (Waugh et al., 2023). (D) Venn diagram of up- or downregulated genes (adjusted p-value <0.01) in Trisomy 21 from this study and in whole blood samples from the cohort study (NCT02864108). Genes either up- or downregulated in both studies were analyzed using Gene Ontology Enrichment Analysis with the GO aspect ‘Biological Processes’. (E) The IFN score (Galbraith et al., 2023) is elevated in T21 cell line compared with D21, suggesting IFN hyperactivity in T21.
Figure 2 with 5 supplements
Mediator kinase inhibition tempers inflammatory pathways under basal conditions, with T21-specific effects.
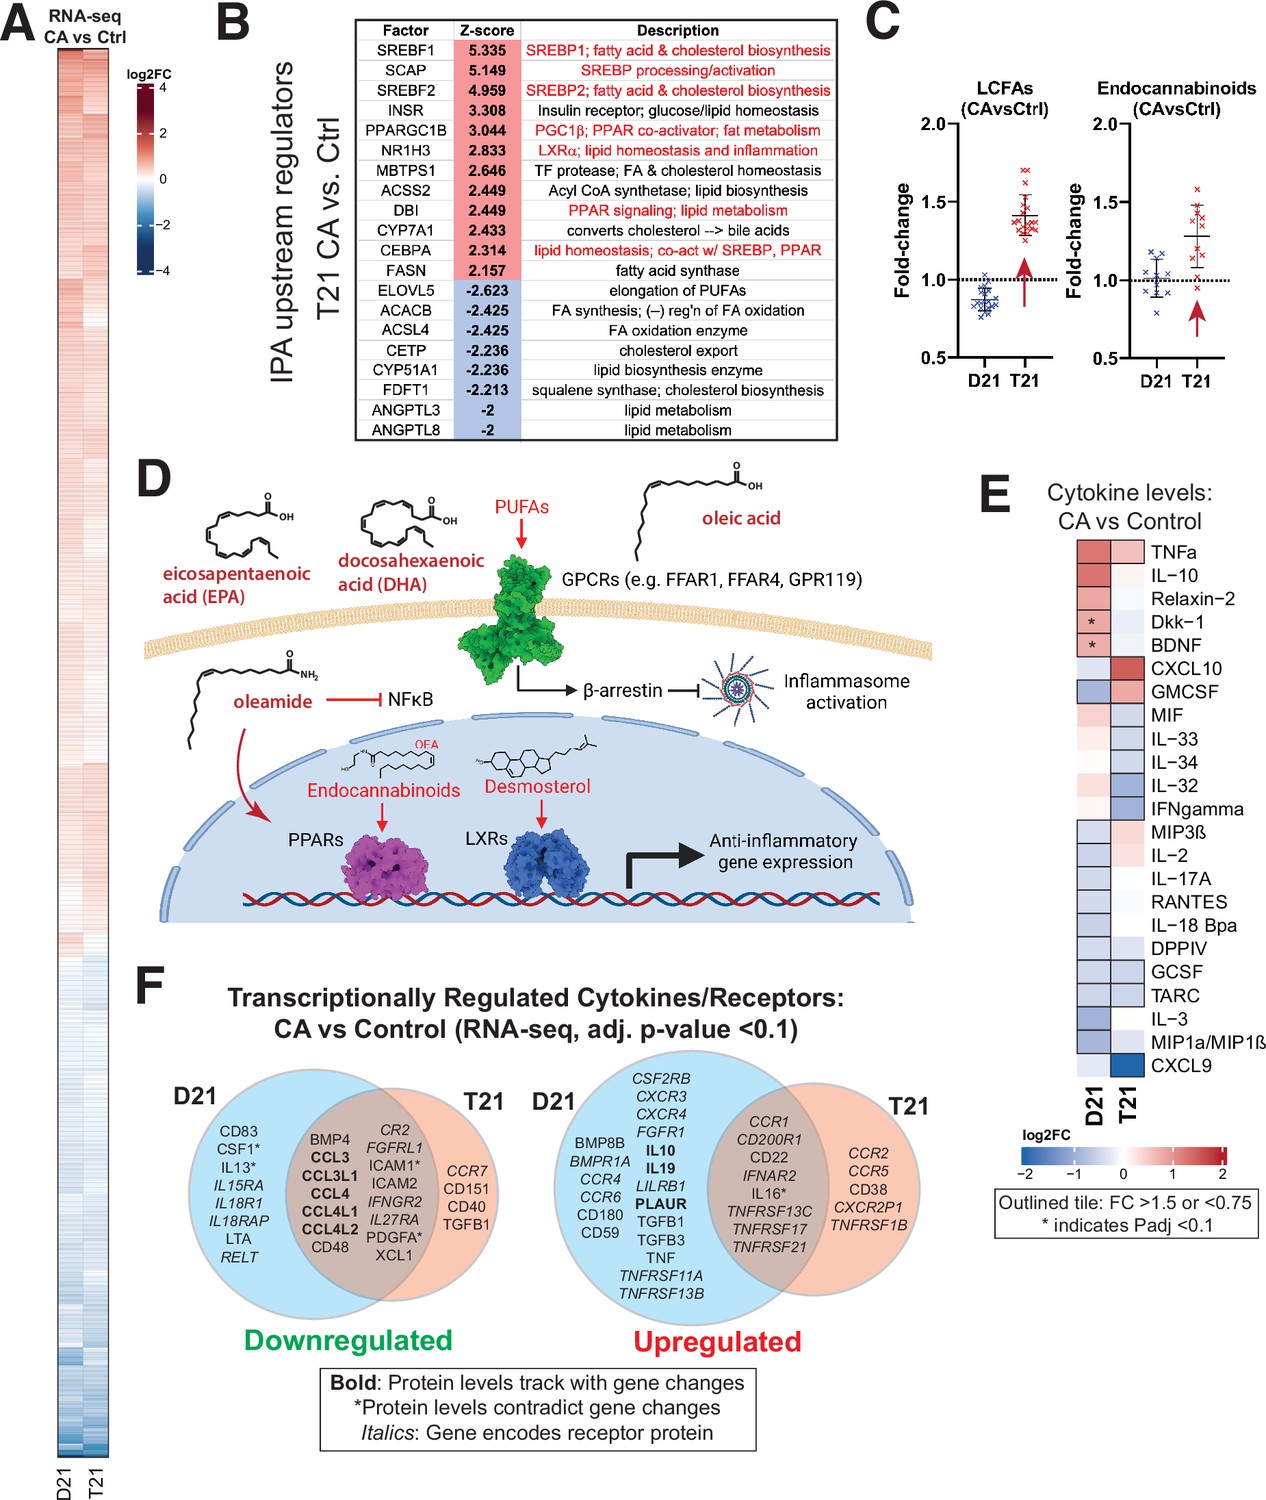
(A) Heatmap of genes with differential expression in D21 or T21 cells treated with cortistatin A (CA) (100 nM) compared to DMSO controls. Genes with adjusted p-value <0.01 in one or both cell lines are shown. (B) Table of activation Z-scores for selected upstream regulators predicted for gene expression changes in CA-treated T21 cells relative to DMSO controls. (C) Box plots showing relative levels of selected lipid metabolites in CA-treated D21 and T21 cells compared to DMSO controls. (D) Simplified diagram of pathways through which selected lipid metabolites regulate inflammation. (E) Heatmap of average relative cytokine levels in CA-treated cells compared to DMSO controls. Only cytokines with relative levels of ≥1.5 (log2FC; red shading) or ≤0.75 (blue shading) in one or both cell lines are shown; cytokines meeting this threshold are outlined in black. Asterisk (*) denotes adjusted p-value <0.1 using ANOVA. (F) Venn diagrams of cytokines and cytokine receptor genes (in italics) that were downregulated (FC <0.8, left diagram) or upregulated (FC >1.2, right diagram) in CA-treated D21 and T21 cells, compared to DMSO controls. Cytokines with matching trends from RNA-seq (4 hr) are listed in bold, whereas cytokines with inverse trends in at least one cell type are marked with an asterisk.
-
Figure 2—source data 1
Metabolomics data sibling-matched T21 vs. D21.
- https://cdn.elifesciences.org/articles/100197/elife-100197-fig2-data1-v1.xlsx
-
Figure 2—source data 2
Metabolomics data sibling-matched T21 and D21 ±CA.
- https://cdn.elifesciences.org/articles/100197/elife-100197-fig2-data2-v1.xlsx
Figure 2—figure supplement 1
Cortistatin A (CA) suppresses T21 inflammatory pathways under basal conditions.
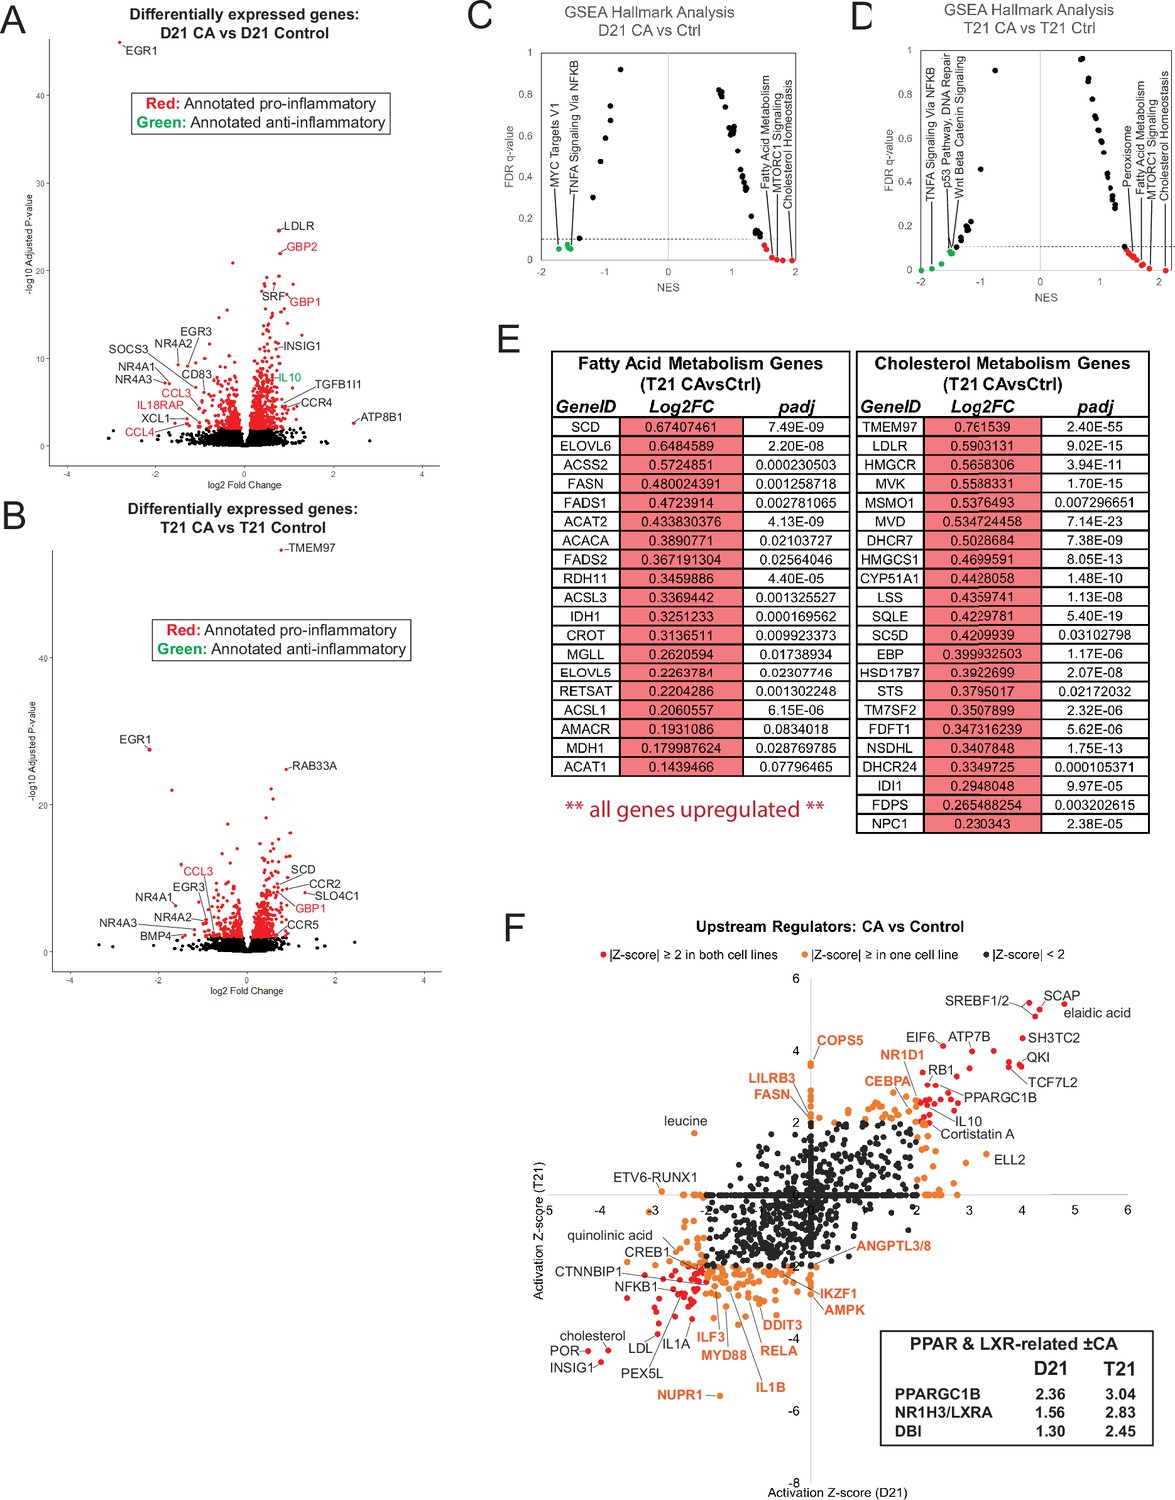
Volcano plots showing differentially expressed genes following CA treatment in D21 (A) or T21 (B) cells, with selected genes color-coded based on pro-inflammatory (red), anti-inflammatory (green) roles. Genes represented by red dots have an adjusted p-value of <0.01. (C, D) Gene set enrichment analysis (GSEA) moustache plots of Hallmark pathway activation in CA-treated D21 (C) and T21 (D) cells compared to DMSO controls. (E) Tables of genes involved in fatty acid metabolism (left) or cholesterol metabolism (right) that are differentially expressed (adjusted p-value ≤0.1) in CA-treated T21 cells relative to vehicle controls, showing consistent upregulation in both pathways. (F) Ingenuity Pathway Analysis of upstream regulators predicted for differential gene expression (RNA-seq) in CA-treated D21 and T21 cells compared to DMSO controls. Predicted regulators specific for T21 cells are labeled in orange font. Analysis used genes with an adjusted p-value <0.1. Inset: Z-score of genes related to PPAR and LXR activation.
Figure 2—figure supplement 2
Persistent activation of lipid metabolism and associated transcription factors (TFs) in cortistatin A (CA)-treated T21 cells; reduced expression of RNA processing factors.
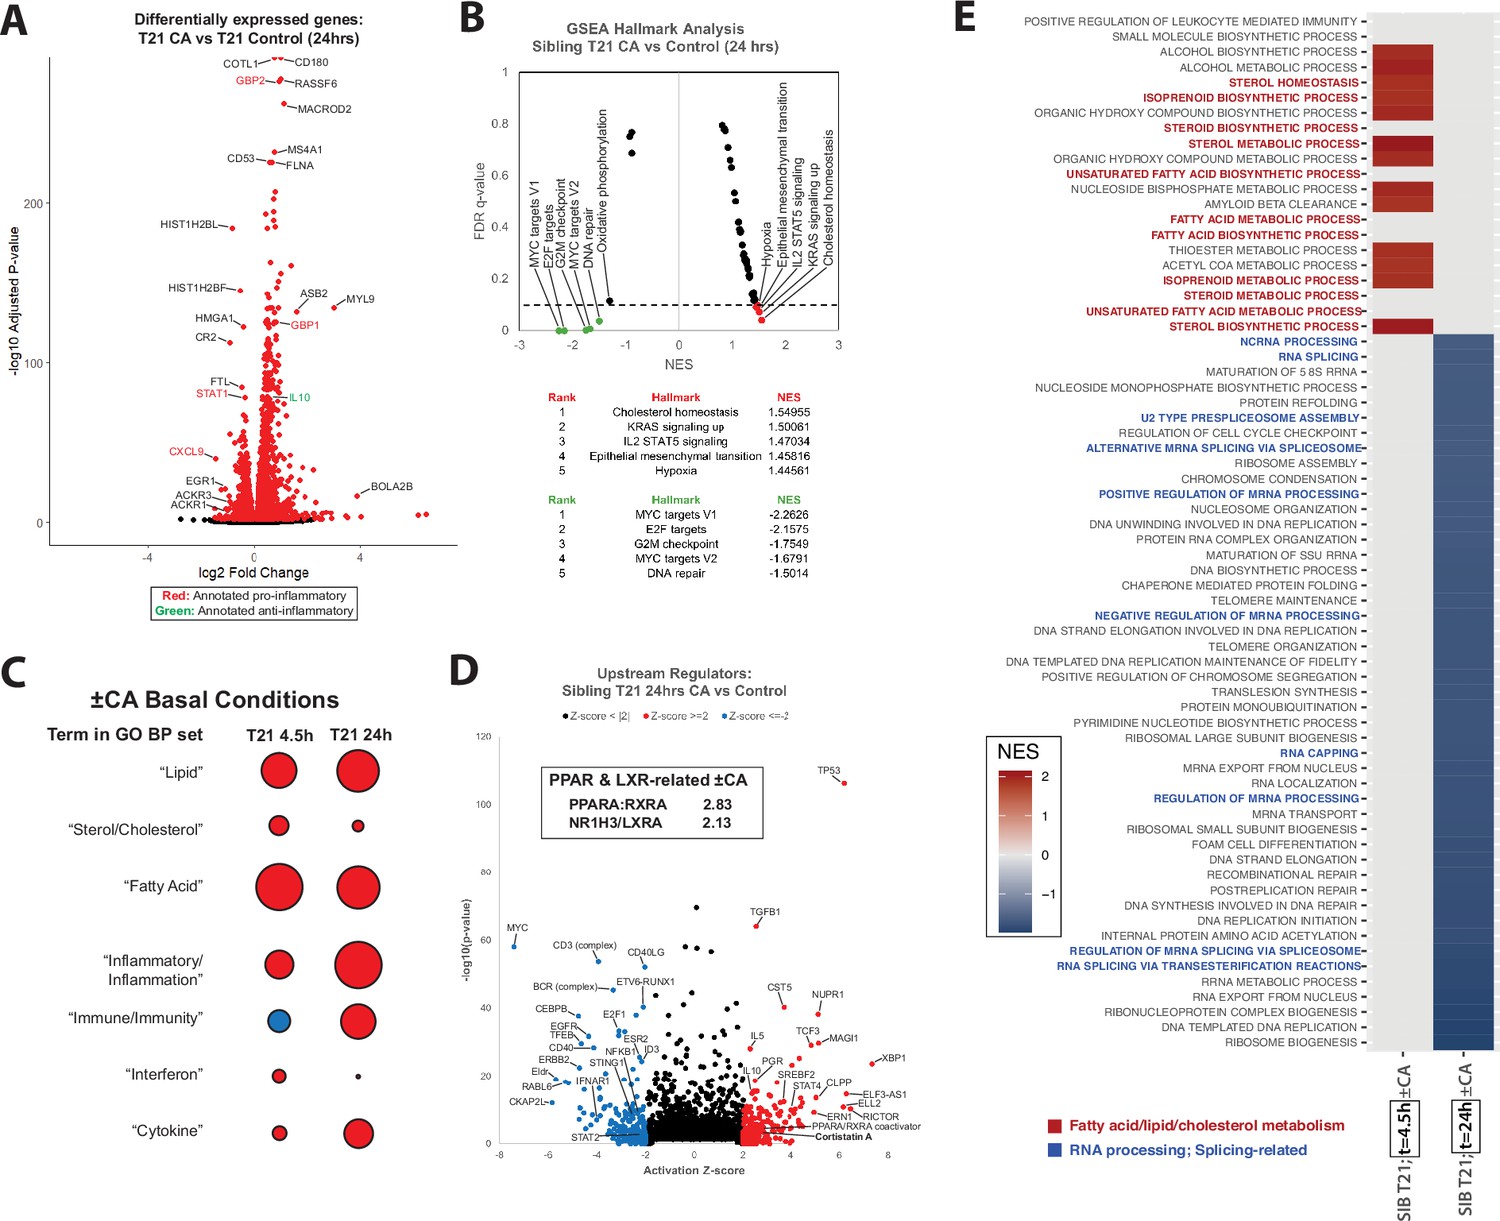
(A) Volcano plot showing differentially expressed genes following 24 hr CA treatment (vs. DMSO controls), with selected genes color-coded based on pro-inflammatory (red), anti-inflammatory (green) roles. Genes represented by red dots have an adjusted p-value of <0.01. (B) Gene set enrichment analysis (GSEA) moustache plot of Hallmark pathway activation in CA-treated T21 cells compared to DMSO controls (t = 24 hr). (C) Dot plots representing average NES for pathways with specific lipid- or inflammatory-related terms; terms are on the left. Pathways were analyzed using GSEA GO Biological Processes (GOBP) of relative gene expression in T21 cells treated with CA for 4.5 or 24 hr relative to DMSO. Dot color indicates direction of average NES, with positive = red and negative = blue. Dot size corresponds to the NES magnitude. All pathways with ‘negative regulation of…’ were excluded to avoid confounding the analysis. (D) Ingenuity Pathway Analysis upstream regulators results from differential gene expression in T21 cells ±CA treatment for 24 hr. Selected TFs and other factors associated with inflammatory responses are labeled. Analysis used only genes with padj < 0.1. Inset: Z-scores of genes related to PPAR and LXR activation. (E) Heatmap of GSEA pathways that significantly change (padj ≤ 0.1) in CA-treated T21 cells vs. DMSO controls.
Figure 2—figure supplement 3
Cortistatin A (CA) treatment suppresses oxygen consumption rate (OCR) and extracellular acidification rate (ECAR) in T21 cells.
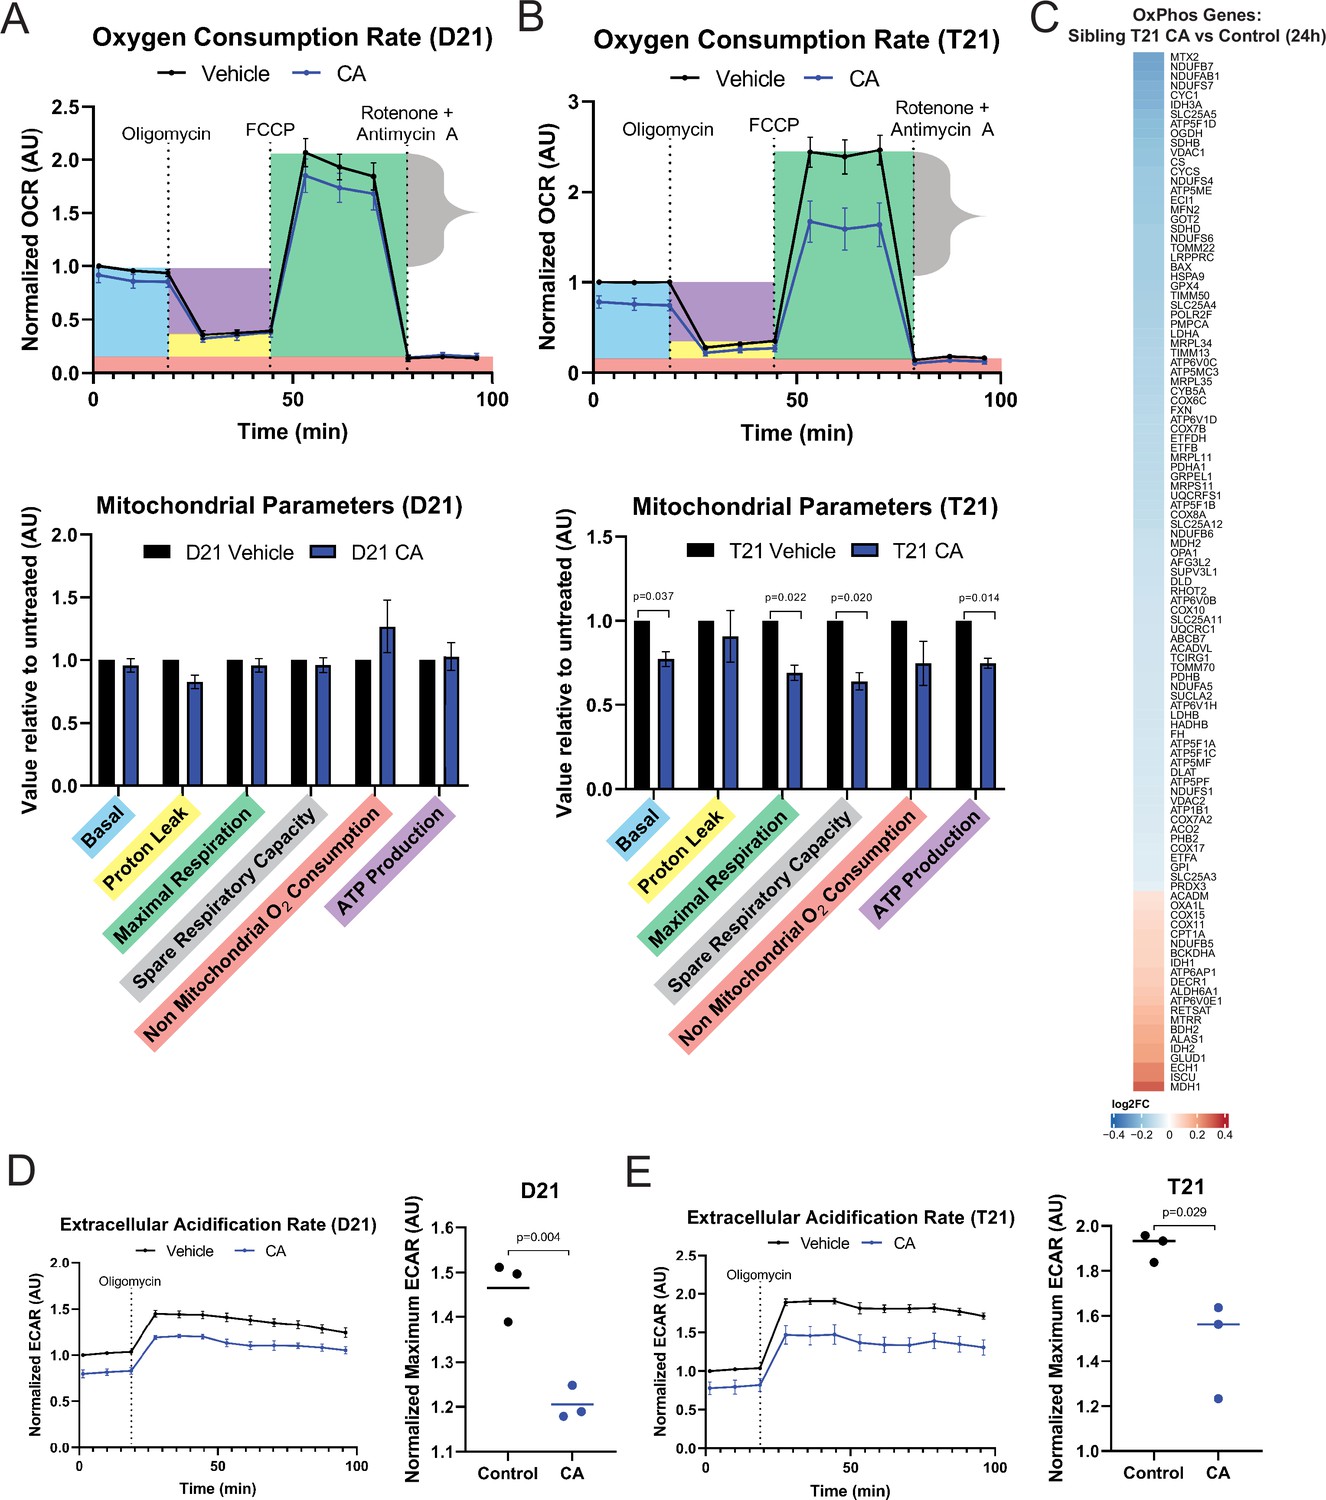
Normalized OCR in D21 (A) or T21 cells (B) treated with 100 nM CA or DMSO for 24 hr. Line plots were generated from biological replicates (n = 3) with error bars representing standard error of the mean. Injection times for compounds affecting OCR are depicted with vertical dashed lines. Bar plots below represent quantitation of mitochondrial stress test parameters. (C) Heatmap showing genes in the gene set enrichment analysis (GSEA) Hallmarks ‘Oxidative phosphorylation’ pathway set with differential expression (RNA-seq ±CA 24 hr, padj ≤ 0.1) in sibling T21 cells. CA treatment (100 nM, 24 hr) reduces ECAR in D21 (D) and T21 cells (E). Line plots were generated from biological replicates (n = 3) with error bars representing standard error of the mean.
Figure 2—figure supplement 4
Elevated oxygen consumption rate (OCR) and extracellular acidification rate (ECAR) in T21 vs. D21; cortistatin A (CA) treatment normalizes mitochondrial function and ECAR toward D21 levels.
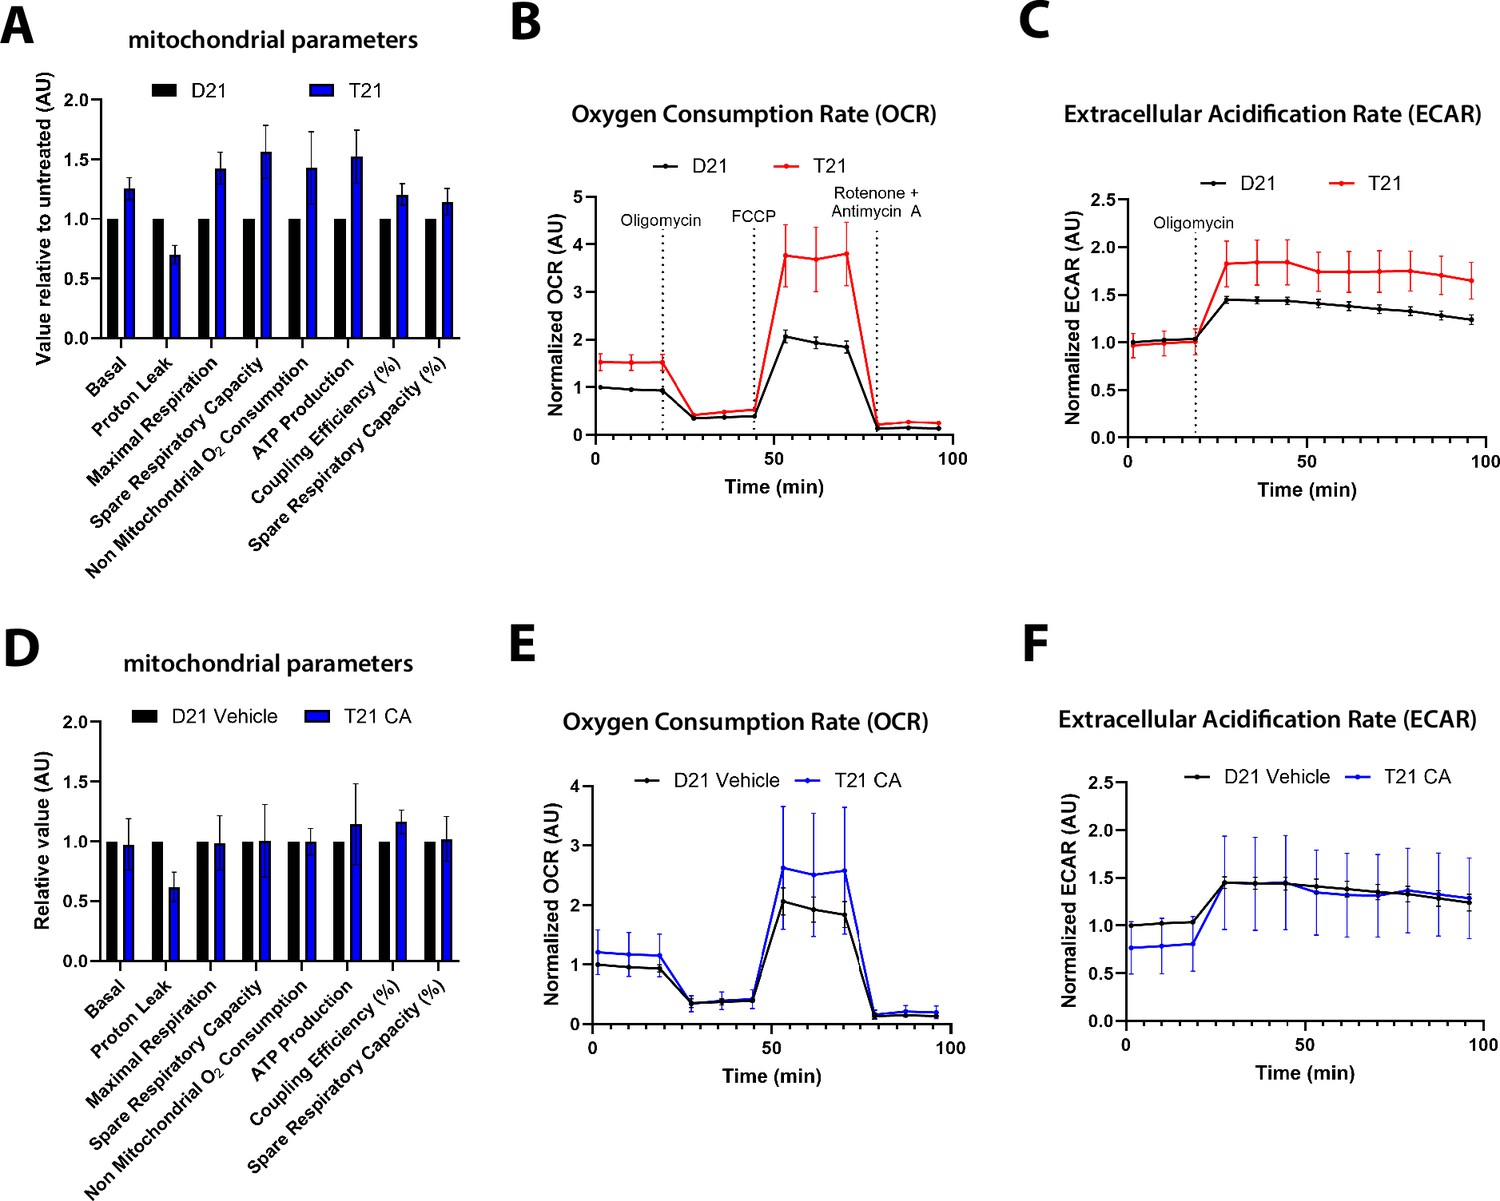
(A) Bar plots showing quantitation of mitochondrial stress test parameters in vehicle-treated D21 or sibling-matched T21 cells. Lines represent standard error of the mean (n = 3). (B, C) Comparison of OCR and ECAR in vehicle-treated D21 vs. T21 cells. Line plots were generated from biological replicates (n = 3) with error bars representing standard error of the mean. Injection times for compounds affecting OCR or ECAR are depicted with vertical dashed lines. (D) Bar plots showing quantitation of mitochondrial stress test parameters in vehicle-treated D21 or sibling-matched T21 cells +CA (100 nM, t = 24 hr). Lines represent standard error of the mean (n = 3). (E, F) Comparison of OCR and ECAR in vehicle-treated D21 vs. CA-treated T21 cells. Line plots were generated from biological replicates (n = 3) with error bars representing standard error of the mean. Injection times for compounds affecting OCR or ECAR are identical to panels B, C.
Figure 2—figure supplement 5
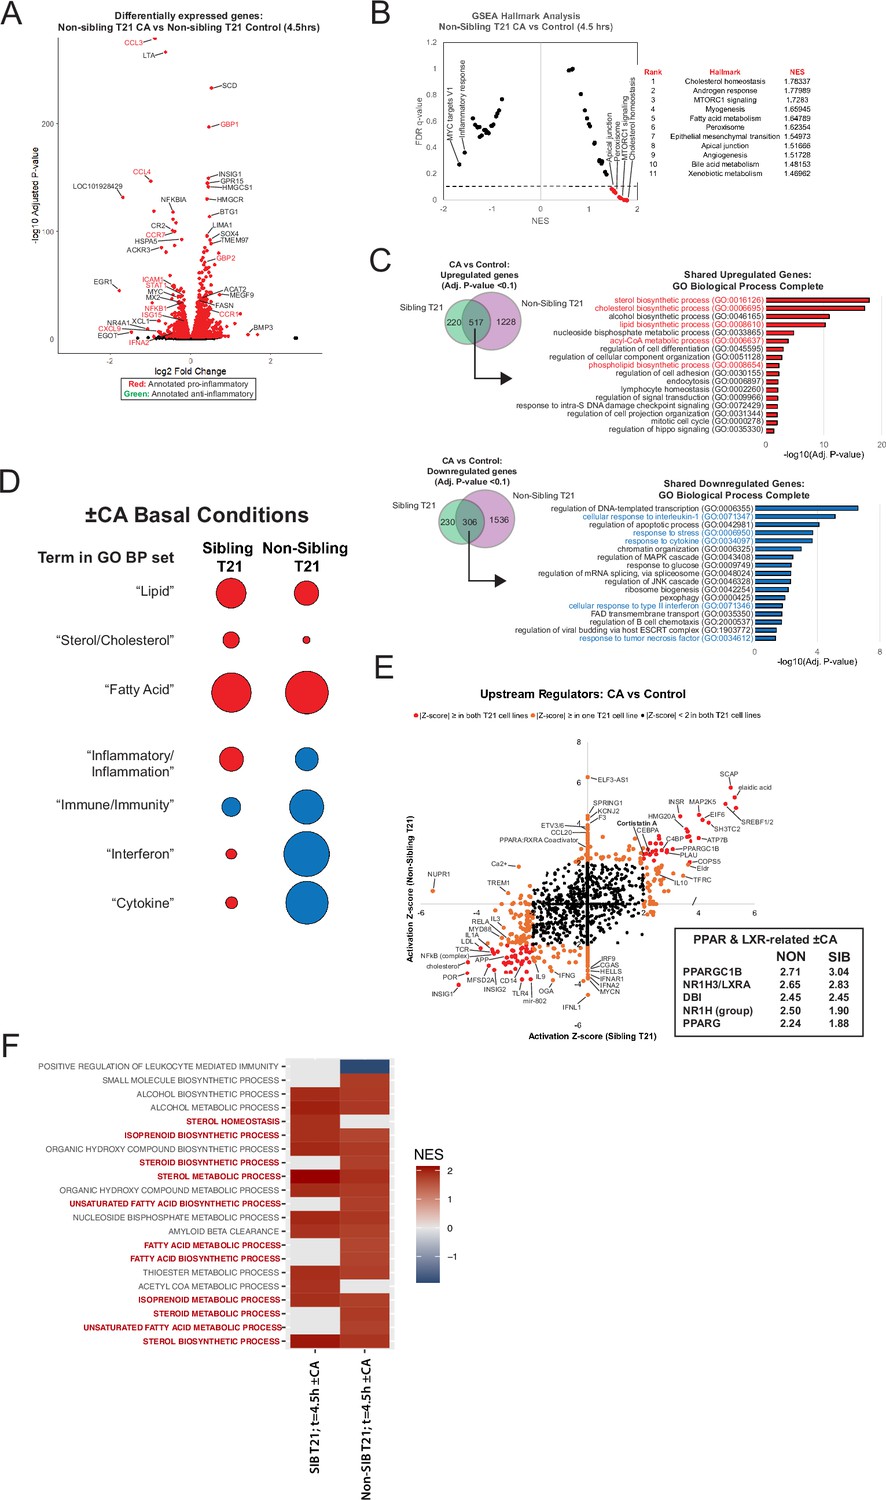
Cortistatin A (CA) treatment increases expression of lipid biosynthesis genes and suppresses inflammation and IFN-related genes in a different T21 donor line.
(A) Volcano plot showing differentially expressed genes following 4.5 hr CA treatment (vs. DMSO controls), with selected genes color-coded based on pro-inflammatory (red), anti-inflammatory (green) roles. Genes represented by red dots have an adjusted p-value of <0.01. (B) Gene set enrichment analysis (GSEA) moustache plot of Hallmark pathway activation in CA-treated ‘non-sibling’ T21 cells compared to DMSO controls (t = 4.5 hr). (C) GO analysis of shared CA-responsive genes among each T21 cell line (sibling and non-sibling), based upon RNA-seq data ±CA, t = 4.5 hr. Top = upregulated genes; bottom = downregulated genes (padj ≤ 0.1 in one or both lines). Pathways related to lipid biosynthesis highlighted in red and those related to inflammatory response highlighted in blue. All displayed pathways meet an FDR ≤0.05 cutoff. (D) Dot plots representing average NES for pathways with specific lipid- or inflammation-related terms; terms are on the left. Pathways were analyzed using GSEA GO Biological Processes (GOBP) of relative gene expression in T21 cells treated with CA for 4.5 hr relative to DMSO. Dot color indicates direction of average NES, with positive = red and negative = blue. Dot size corresponds to the NES magnitude. All pathways with ‘negative regulation of…’ were excluded to avoid confounding the analysis. (E) Ingenuity Pathway Analysis of upstream regulators predicted for differential gene expression (RNA-seq) in CA-treated ‘non-sibling’ vs. ‘sibling’ T21 cells compared to DMSO controls. Predicted regulators with absolute Z-score ≥2.0 in both lines labeled in red, whereas regulators with absolute Z-score ≥2.0 in only one line labeled in orange font. Analysis used genes with an adjusted p-value <0.1. Inset: Z-score of genes related to PPAR and LXR activation. (F) Heatmap of GSEA pathways that significantly change (padj ≤ 0.1) in CA-treated T21 cells vs. DMSO controls.
Figure 3 with 2 supplements
Mediator kinase inhibition antagonizes IFNγ transcriptional responses in T21 and D21.
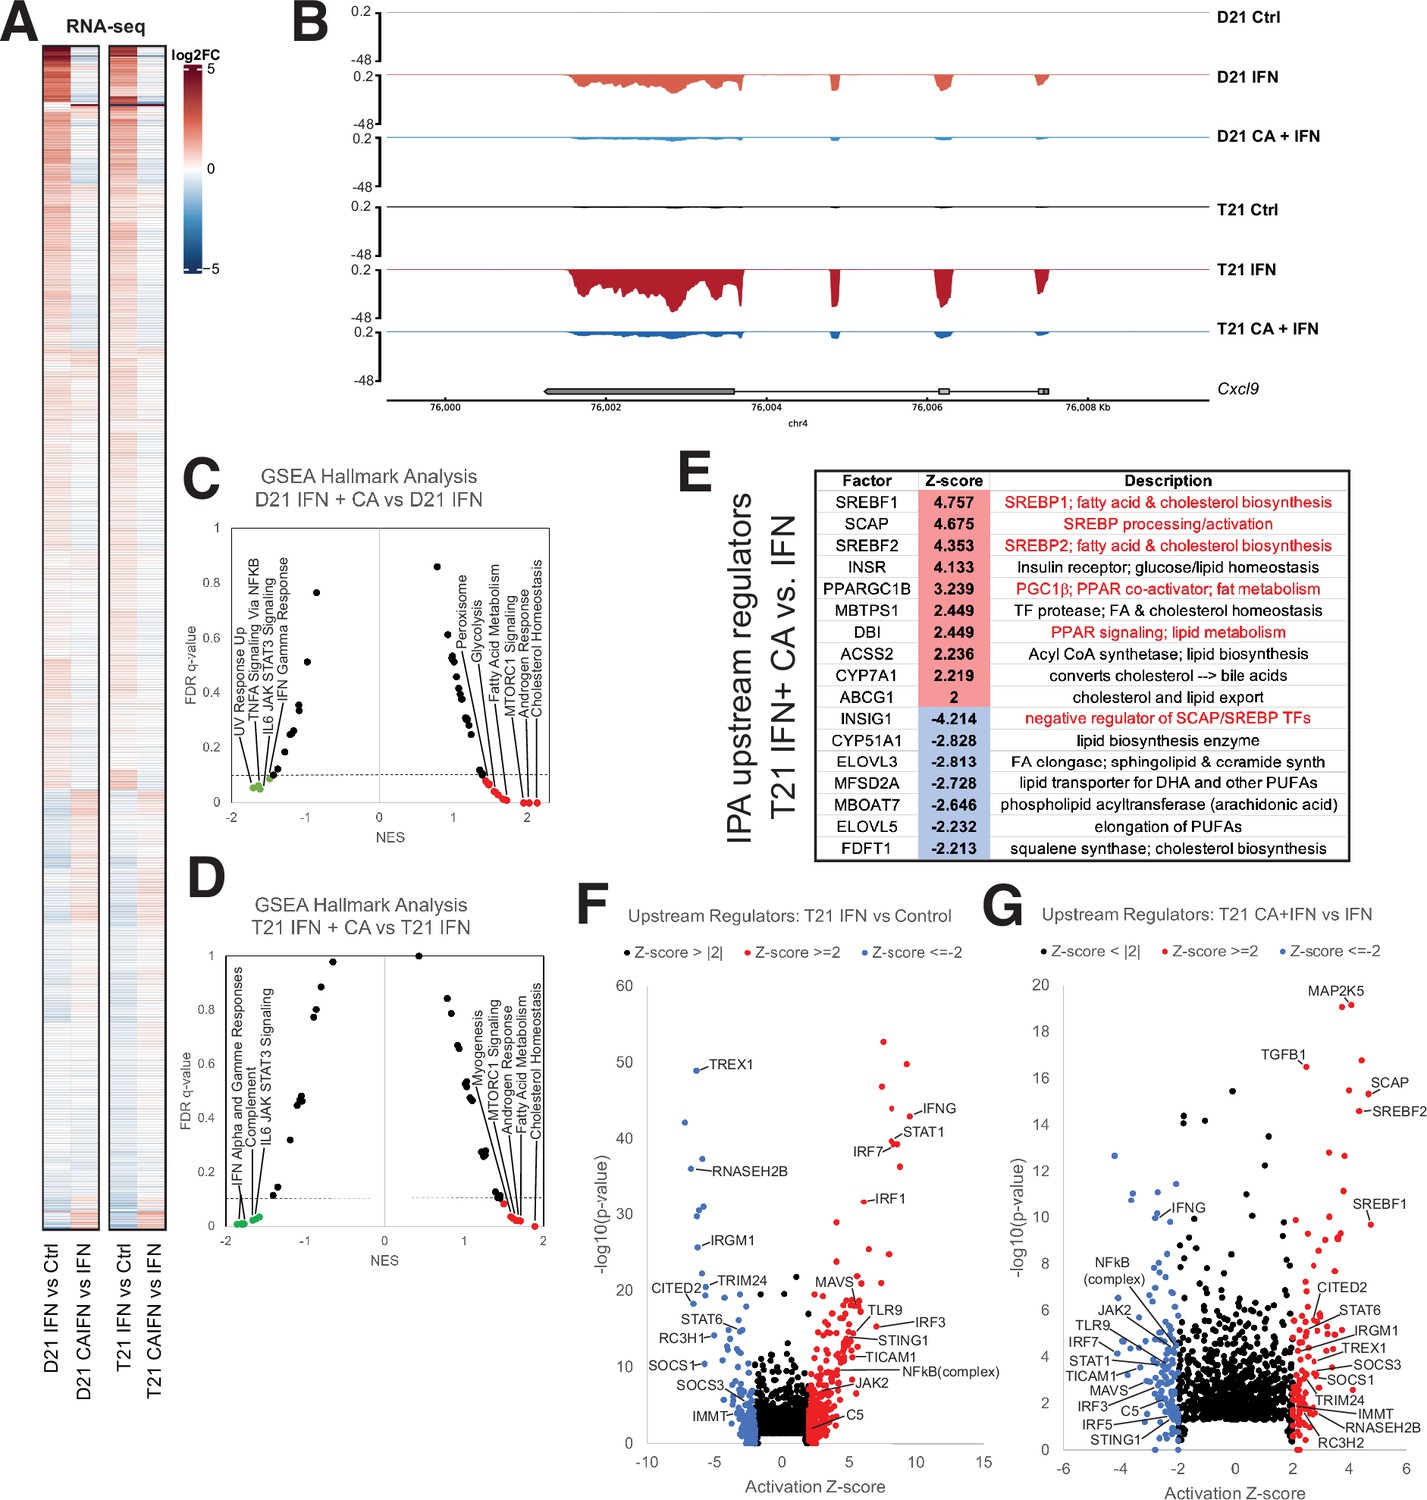
(A) Heatmap comparing gene expression patterns (RNA-seq) in IFNγ-treated D21 or T21 cells ±CA. This comparison shows cortistatin A (CA)-specific effects during IFNγ stimulation, which broadly counter changes caused by IFNγ alone. Genes with statistically significant (padj < 0.01) levels in one or both cell lines in IFNγ vs. control comparisons are shown. (B) Representative genome browser tracks for CXCL9 locus in D21 and T21 cells treated with vehicle, IFNγ, or IFNγ + CA. Gene set enrichment analysis (GSEA) moustache plots of Hallmark pathways in D21 (C) and T21 (D) cells treated with IFNγ + CA compared to IFNγ alone. This shows CA-specific effects during IFNγ stimulation. (E) Table of activation Z-scores for selected upstream regulators in CA-treated T21 cells treated with IFNγ + CA relative to IFNγ alone. This curated set emphasizes lipid metabolite changes. Ingenuity Pathway Analysis upstream regulators results from comparison of differential gene expression in T21 cells during IFNγ treatment (F) or in cells treated with IFNγ + CA compared to IFNγ alone (G). Selected transcription factors (TFs) and other factors associated with inflammatory responses are labeled. Analysis used only genes with padj < 0.1.
Figure 3—figure supplement 1
The response to exogenous IFNγ is suppressed in T21 vs. D21 cells.
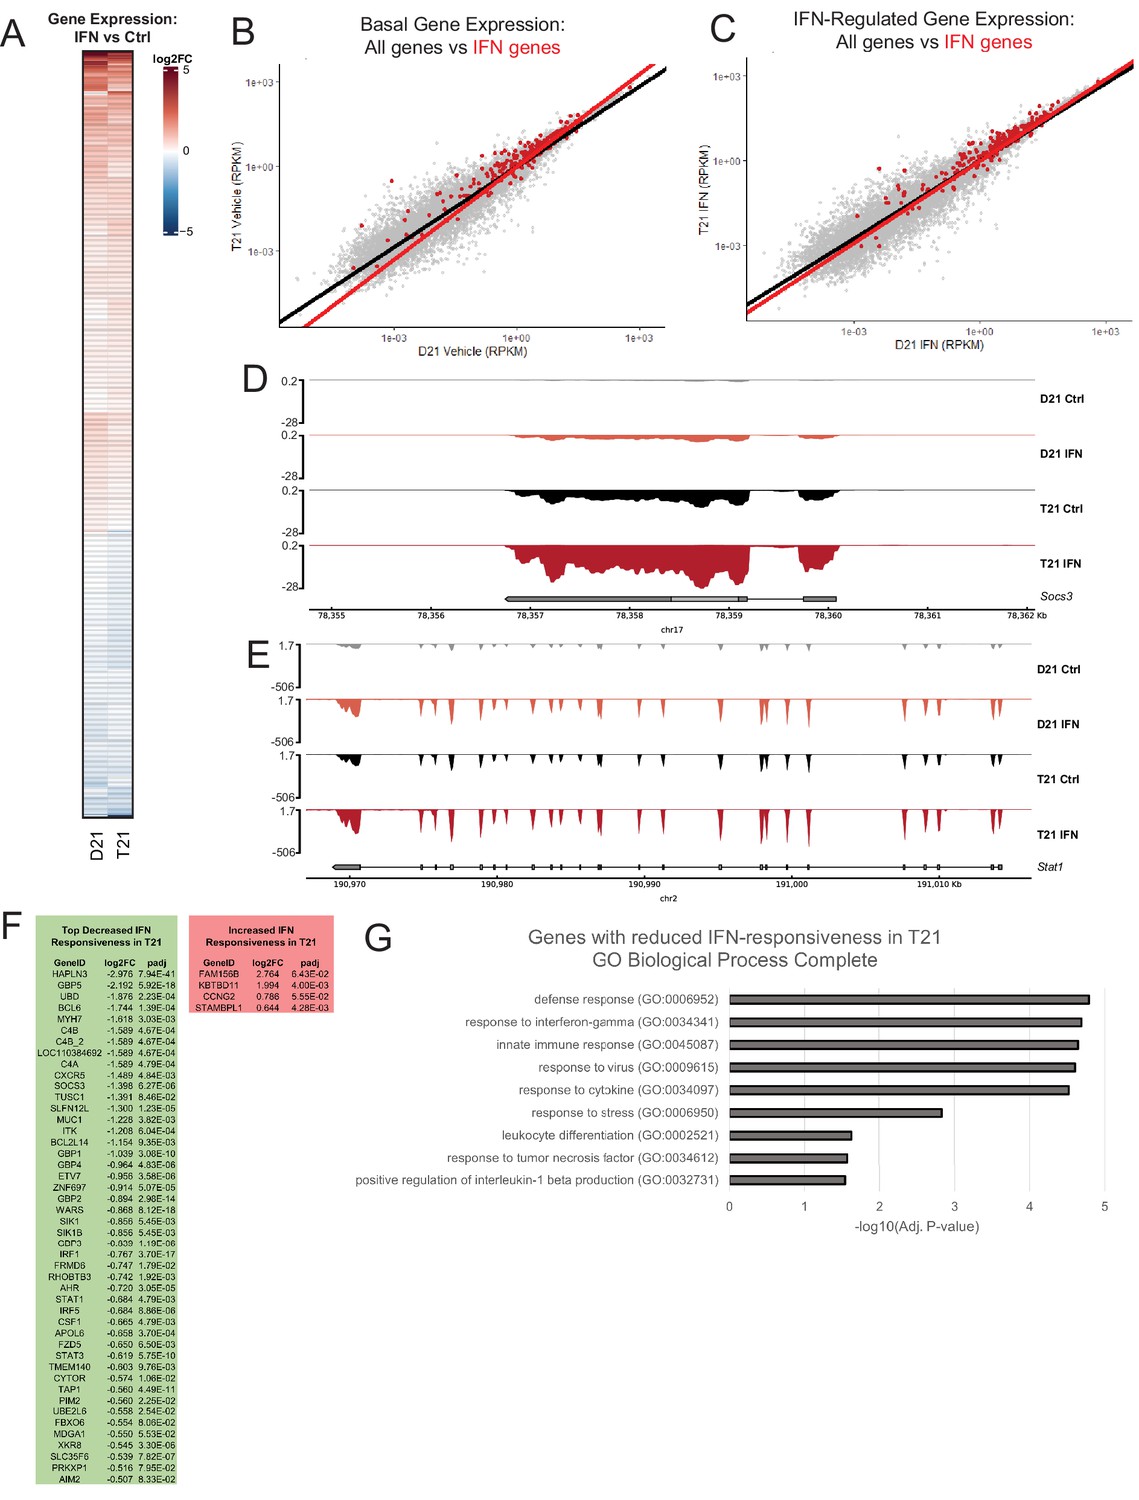
(A) Heatmap of genes with differential expression in D21 or T21 cells treated with IFNγ compared to controls. Genes with adjusted p-value <0.01 in one or both cell lines are shown. (B) Average values across biological replicates for reads per kilobase of transcript, per million mapped reads (RPKM) in vehicle-treated D21 cells (x-axis) and vehicle-treated T21 cells (y-axis). Gray dots represent all genes with an RPKM value >0, and red dots represent genes from the gene set enrichment analysis (GSEA) Hallmarks IFNγ and IFNα signaling pathways. Linear regression trendlines for each set are depicted as follows; black: all genes; red: IFN-response genes. The greater slope for IFN-responsive genes indicates higher basal expression of these genes in T21 cells. (C) Similar to panel B, except in IFNγ-treated D21 (x-axis) and IFNγ-treated T21 cells (y-axis). Note the linear regression trendlines are more similar under IFNγ stimulation conditions, compared with basal conditions (panel B), which provides evidence for dampened IFNγ transcriptional response in T21 cells, likely from higher basal level expression, such that gene expression ends up being similar in T21 and D21 cells treated with exogenous IFNγ. Representative genome browser tracks (RNA-seq data) for SOCS3 (D) or STAT1 (E) in D21 and T21 cells ±IFNγ treatment. (F) Genes with lower (green) or higher (red) relative expression in IFNγ-treated T21 cells (vs. IFNγ-treated D21; adjusted p-value <0.1). Only genes with a log2FC ≥ |0.5| are shown. (G) Gene Ontology Enrichment Analysis with the GO aspect ‘Biological Processes’ for genes with reduced responsiveness to IFNγ stimulation in T21 cells. Many genes with reduced expression in T21 cells represent inflammatory pathways, consistent with a suppressed response to exogenous IFNγ in T21 cells, vs. D21.
Figure 3—figure supplement 2
Mediator kinase inhibition antagonizes IFNγ transcriptional responses.
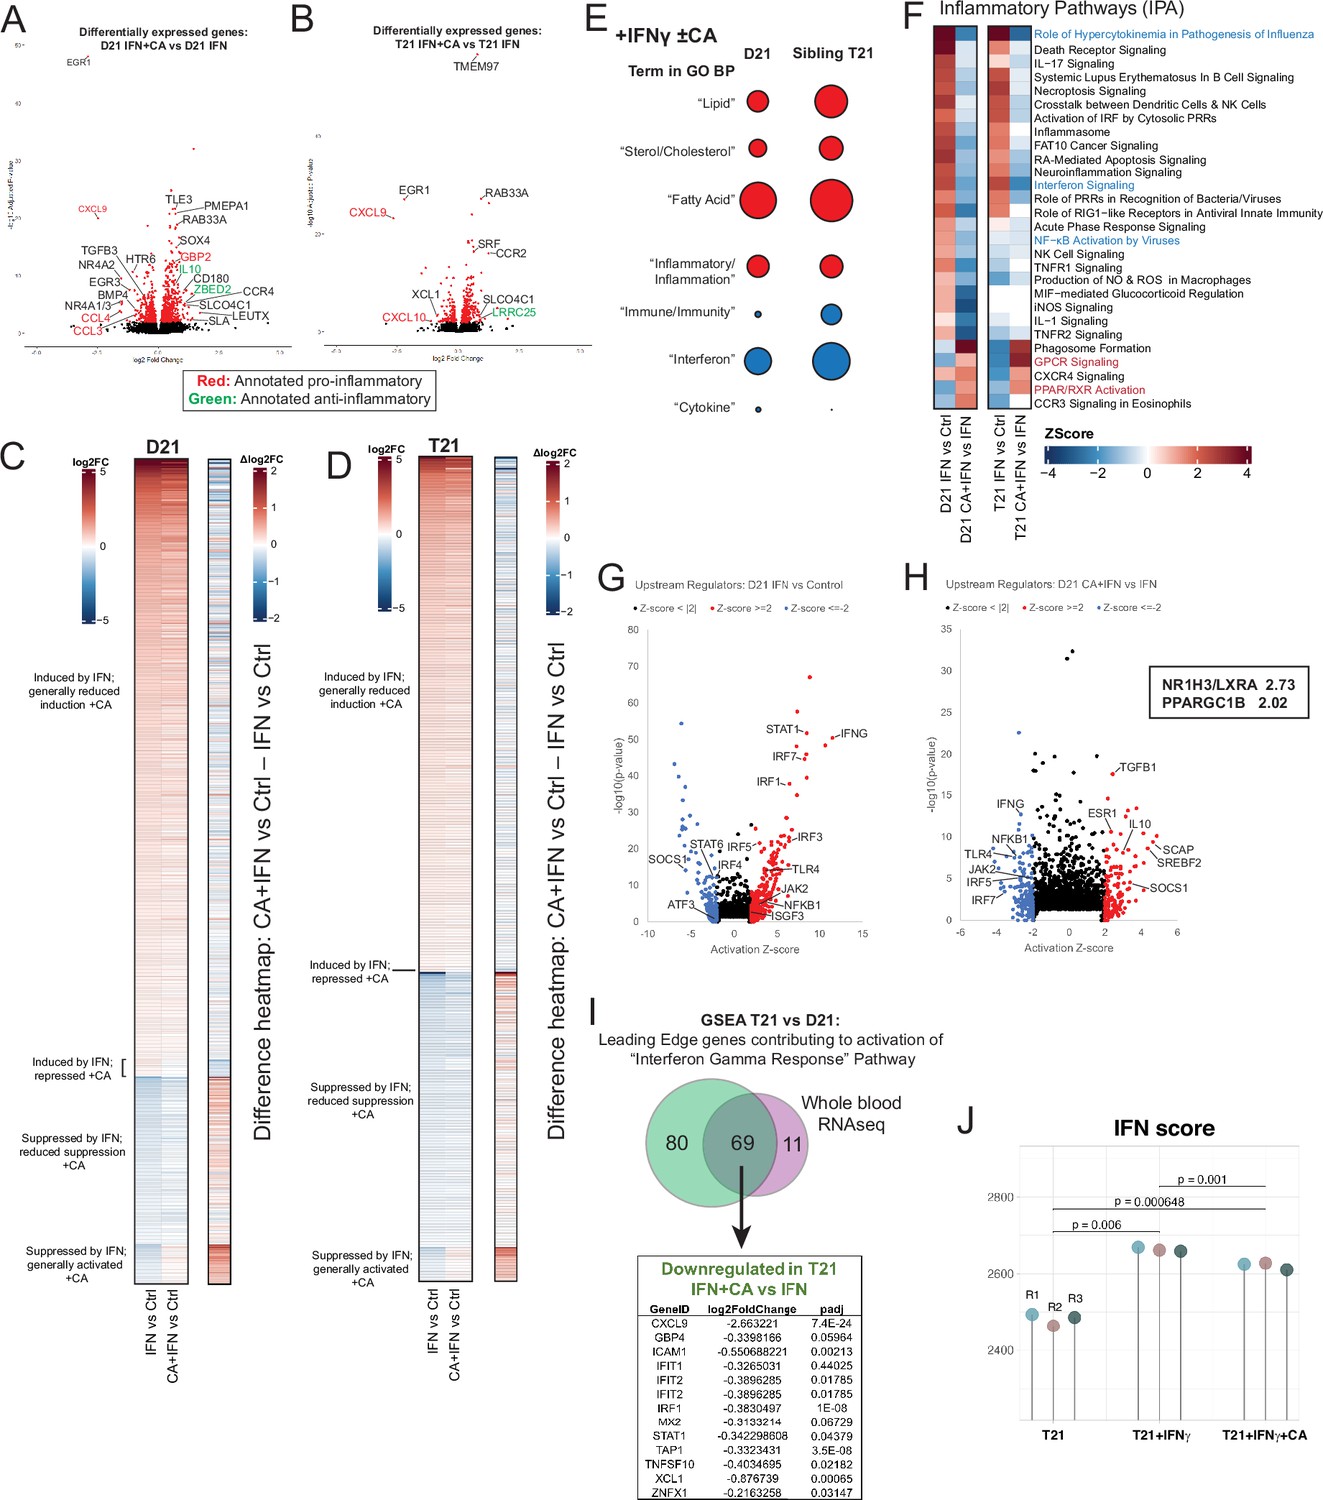
Volcano plots of differentially expressed genes in IFNγ-treated cells ±CA in D21 (A) or T21 (B) cells. Names of selected genes are color-coded based on pro-inflammatory (red) or anti-inflammatory (green) roles. Genes represented by red dots have an adjusted p-value of <0.01. Heatmaps and ‘difference’ heatmaps based upon RNA-seq data under various conditions in D21 (C) or T21 (D) cells. At left (panel C, D), heatmaps represent all genes with an adjusted p-value <0.01 in IFNγ vs. Control comparisons for each cell line. Log2FC values were used to sort genes by expression trends in D21 and T21 cells. Data for IFNγ + CA vs. Ctrl are shown alongside IFNγ vs. Ctrl to better visualize cortistatin A (CA)-dependent effects. For difference heatmaps (at right in panel C, D), Log2FC values for each gene in the IFNγ vs. Control comparison were subtracted from Log2FC values for CA + IFNγ vs. Control comparisons to generate ‘difference’ Log2FC values, which are shown in the difference heatmap on the right. (E) Dot plots representing average NES for pathways with specific lipid- or inflammation-related terms; terms are on the left. Pathways were analyzed using gene set enrichment analysis (GSEA) GO Biological Processes (GOBP) of relative gene expression in D21 or T21 cells treated with CA for 4.5 hr relative to DMSO. Dot color indicates direction of average NES, with positive = red and negative = blue. Dot size corresponds to the NES magnitude. All pathways with ‘negative regulation of…’ were excluded to avoid confounding the analysis. (F) Heatmaps showing inflammatory pathways in the Ingenuity Pathway Analysis ‘Diseases & Functions’ list, generated from RNA-seq data. Heatmaps show pathway activation in IFNγ vs. Control compared to IFNγ + CA vs. IFNγ in both D21 and T21 cells, to focus on CA-dependent effects during IFNγ response. Volcano plots from Ingenuity Pathway Analysis (IPA) upstream regulators results, derived from differential gene expression (RNA-seq) in D21 cells during IFNγ treatment (G) or in cells treated with IFNγ + CA compared to IFNγ alone (H). Selected transcription factors (TFs) and other factors associated with inflammatory responses are labeled. Note prominent activation of pro-inflammatory TFs in +IFNγ cells (G), whereas these same TFs are predicted to be repressed in CA-treated cells (H). Analysis used only genes with an adjusted p-value <0.1. Inset: genes related to PPAR or LXR activation. (I) Venn diagram showing overlap of leading edge genes in the GSEA ‘Interferon Gamma Response’ pathway based upon RNA-seq data from a T21 vs. D21 whole blood cohort study (Waugh et al., 2023) and RNA-seq data from the sibling-matched T21 vs. D21 cells in this study. A substantial number of genes with the IFN ‘leading edge’ designation in this study (i.e. increased expression in T21 vs. D21; 69 out of 80) were shared among the whole blood clinical cohort study; these 69 genes were downregulated by CA treatment in T21 cells. A partial list of these genes is shown, with Log2FC and adjusted p-values. (J) The IFN score (Galbraith et al., 2023) increases upon IFN stimulation and decreases with CA treatment.
Figure 4 with 1 supplement
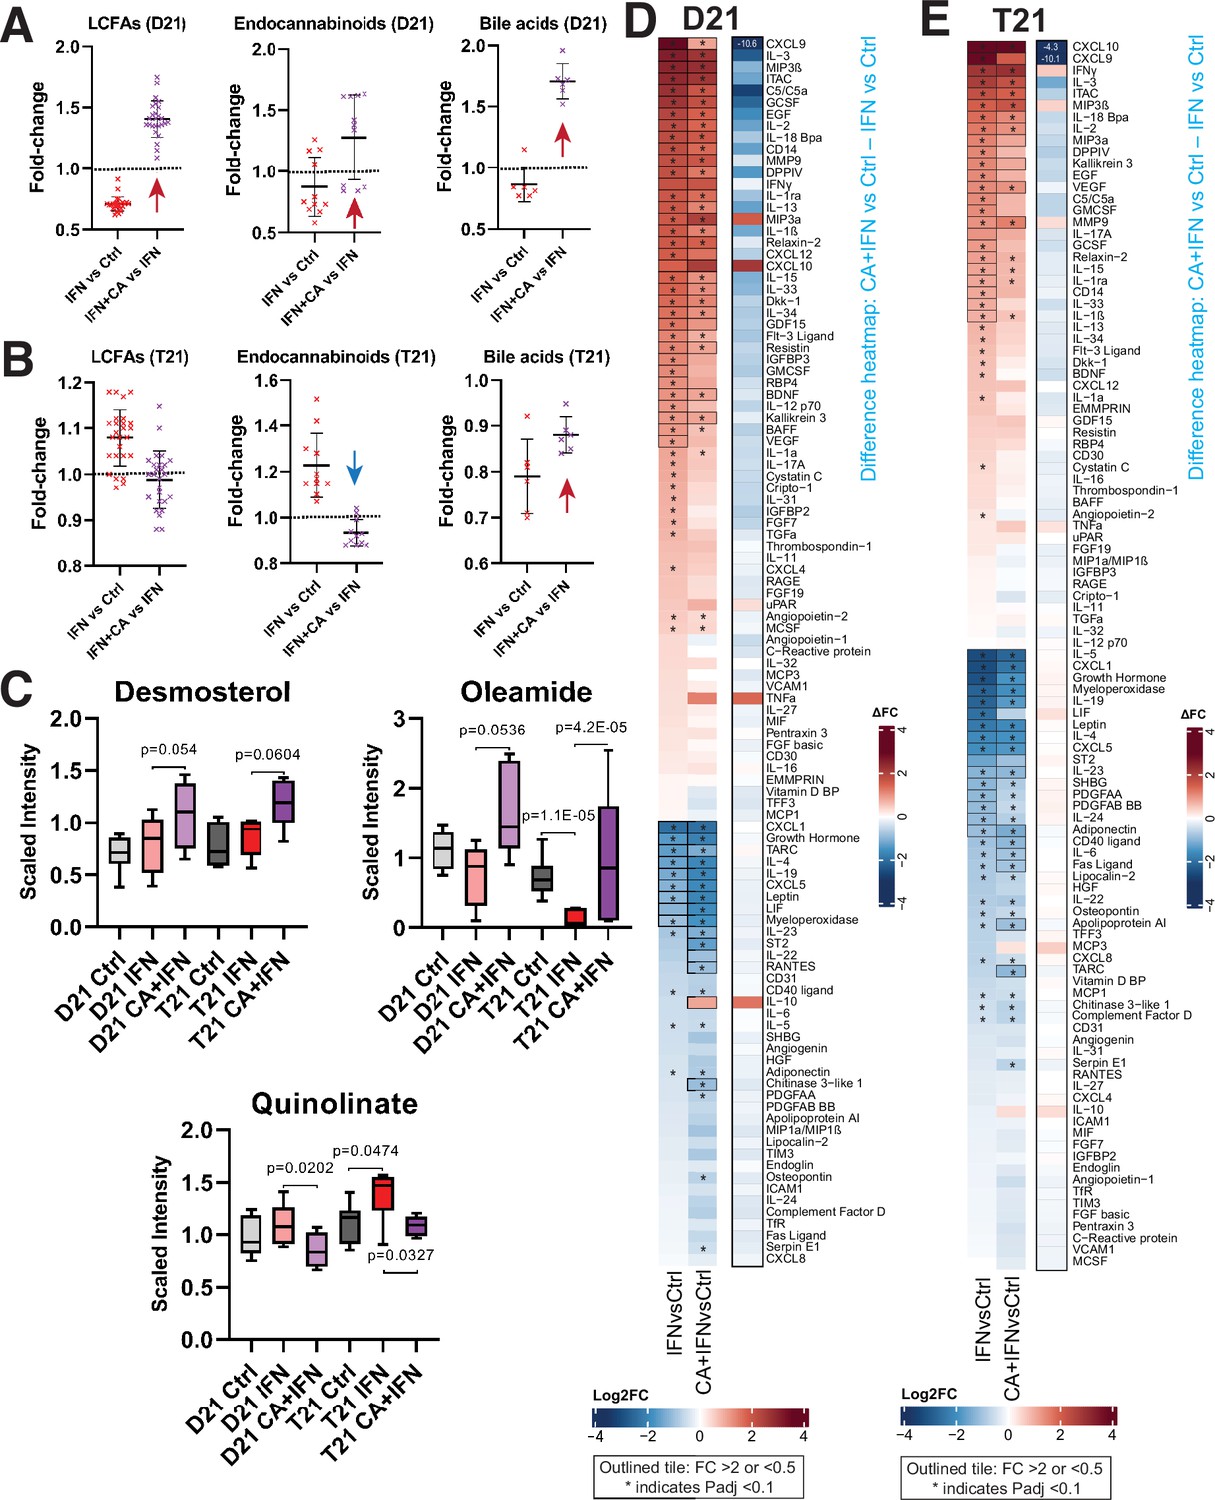
Mediator kinase inhibition reverses pro-inflammatory metabolic and cytokine changes triggered by IFNγ.
Effect of IFNγ treatment on select classes of lipid metabolites is shown (IFNγ vs. Ctrl) alongside the effect of cortistatin A (CA) treatment in IFNγ-treated cells, in D21 (A) and T21 (B) cells. The LCFAs represented here include saturated, mono- and poly-unsaturated FA, shown in rows 3–28 in Figure 4—source data 1. Each point represents a different metabolite, with line and whiskers representing the mean and SD. Note CA treatment reverses IFNγ effects generally (arrows). (C) Box plots showing levels of anti-inflammatory metabolites desmosterol or oleamide, and pro-inflammatory metabolite quinolinate, in D21 or T21 cells treated with DMSO (Ctrl), IFNγ, or IFNγ + CA. Heatmaps showing changes in cytokine levels in D21 (D) and T21 (E) cells, after the indicated treatments. Only cytokines with relative levels of ≥2.0 (log2FC; red shading) or ≤0.5 (blue shading) in one or both cell lines are shown; cytokines meeting this threshold are outlined in black. Asterisk (*) denotes adjusted padj < 0.1 using ANOVA. Alongside each heatmap set (D21 or T21) is a ‘difference’ heatmap (IFN + CA vs. Ctrl – IFN vs. Ctrl levels) that highlights how Mediator kinase inhibition suppresses cytokine responses to IFNγ.
-
Figure 4—source data 1
Metabolomics data sibling-matched T21 and D21 ±CA ±IFNγ.
- https://cdn.elifesciences.org/articles/100197/elife-100197-fig4-data1-v1.xlsx
Figure 4—figure supplement 1
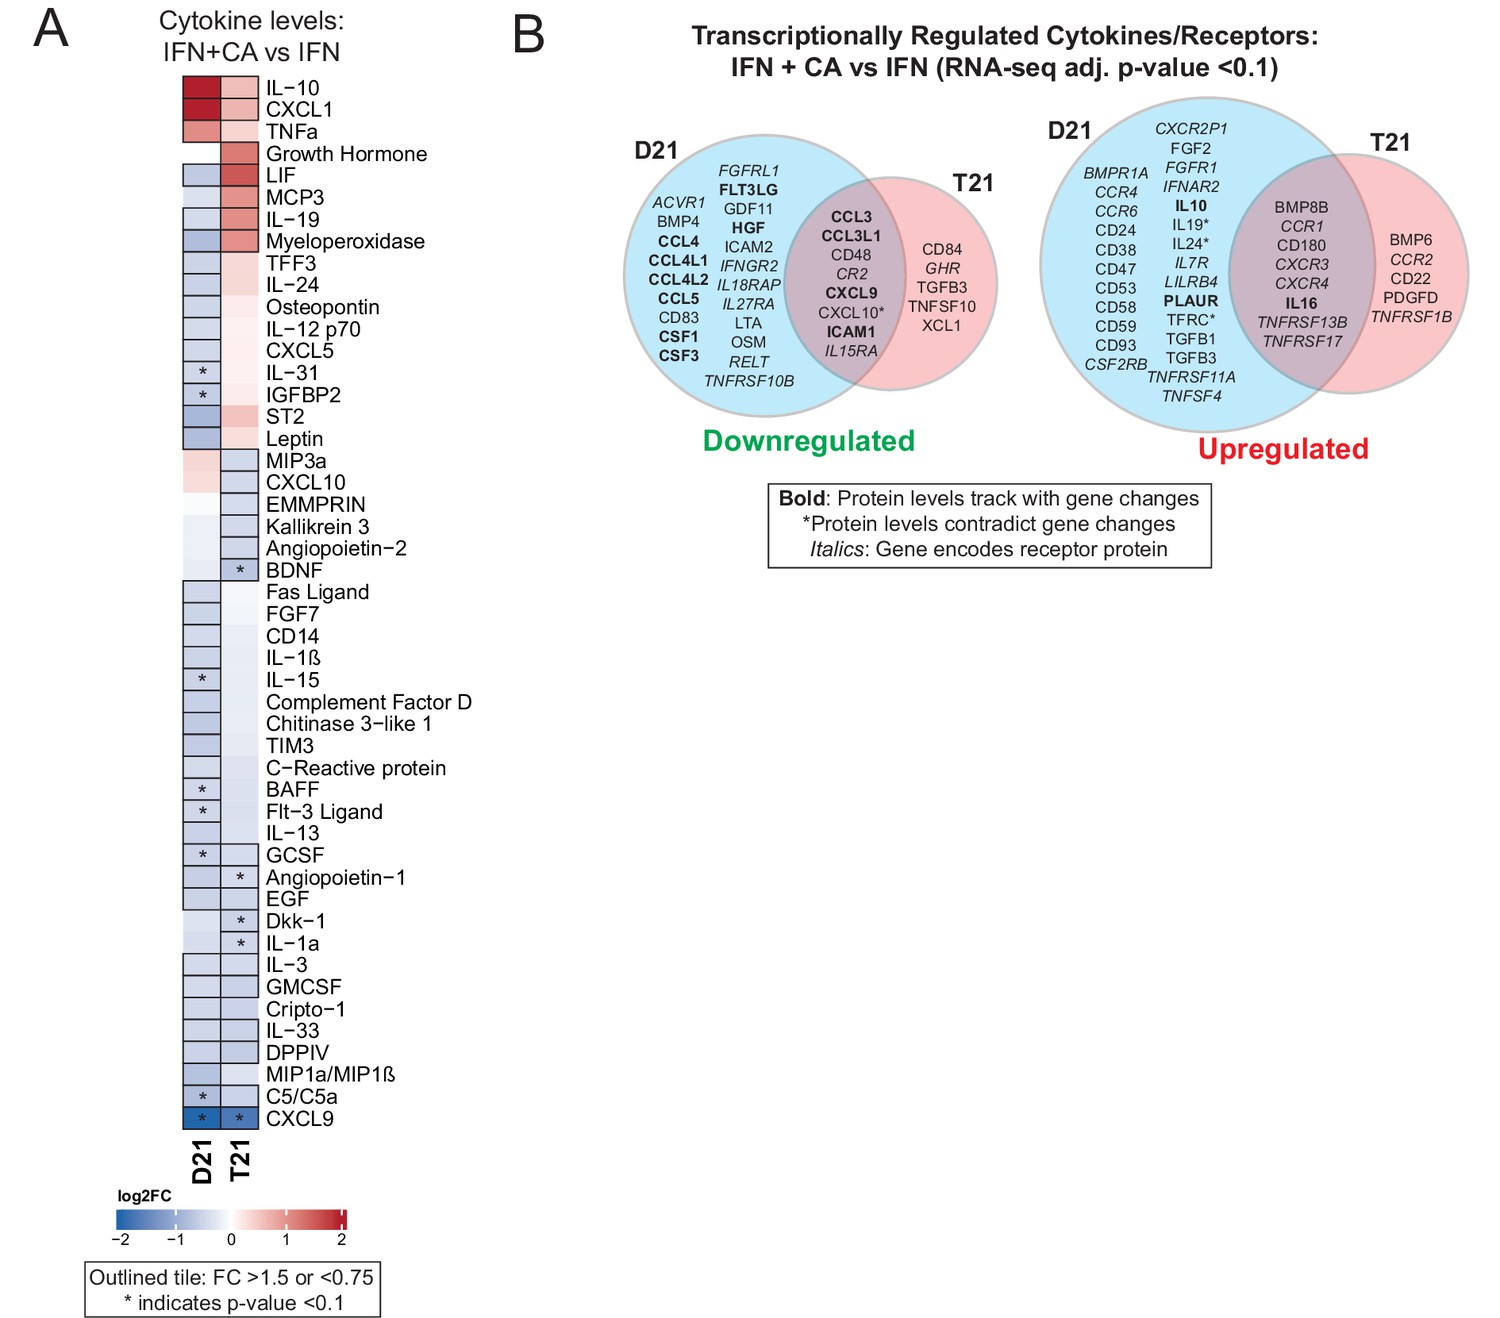
Mediator kinases transcriptionally enable cytokine responses to IFNγ.
(A) Heatmap of average relative cytokine levels in cells treated with IFNγ + CA compared to IFNγ alone. Only cytokines with relative levels of ≥1.5 (log2FC; red shading) or ≤0.75 (blue shading) in one or both cell lines are shown; cytokines meeting this threshold are outlined in black. Cytokines with an asterisk (*) had an adjusted p-value <0.1 using ANOVA. (B) Venn diagrams (RNA-seq data) of cytokines and cytokine receptor genes (in italics) that were downregulated (FC <0.8, left diagram) or upregulated (FC >1.2, right diagram) in IFNγ + CA-treated cells compared to IFNγ alone (D21 and T21). Cytokines with matching trends from RNA-seq (4 hr) and cytokine protein measurements (24 hr) are listed in bold, whereas cytokines with inverse trends in at least one cell type are marked with an asterisk.
Figure 5 with 2 supplements
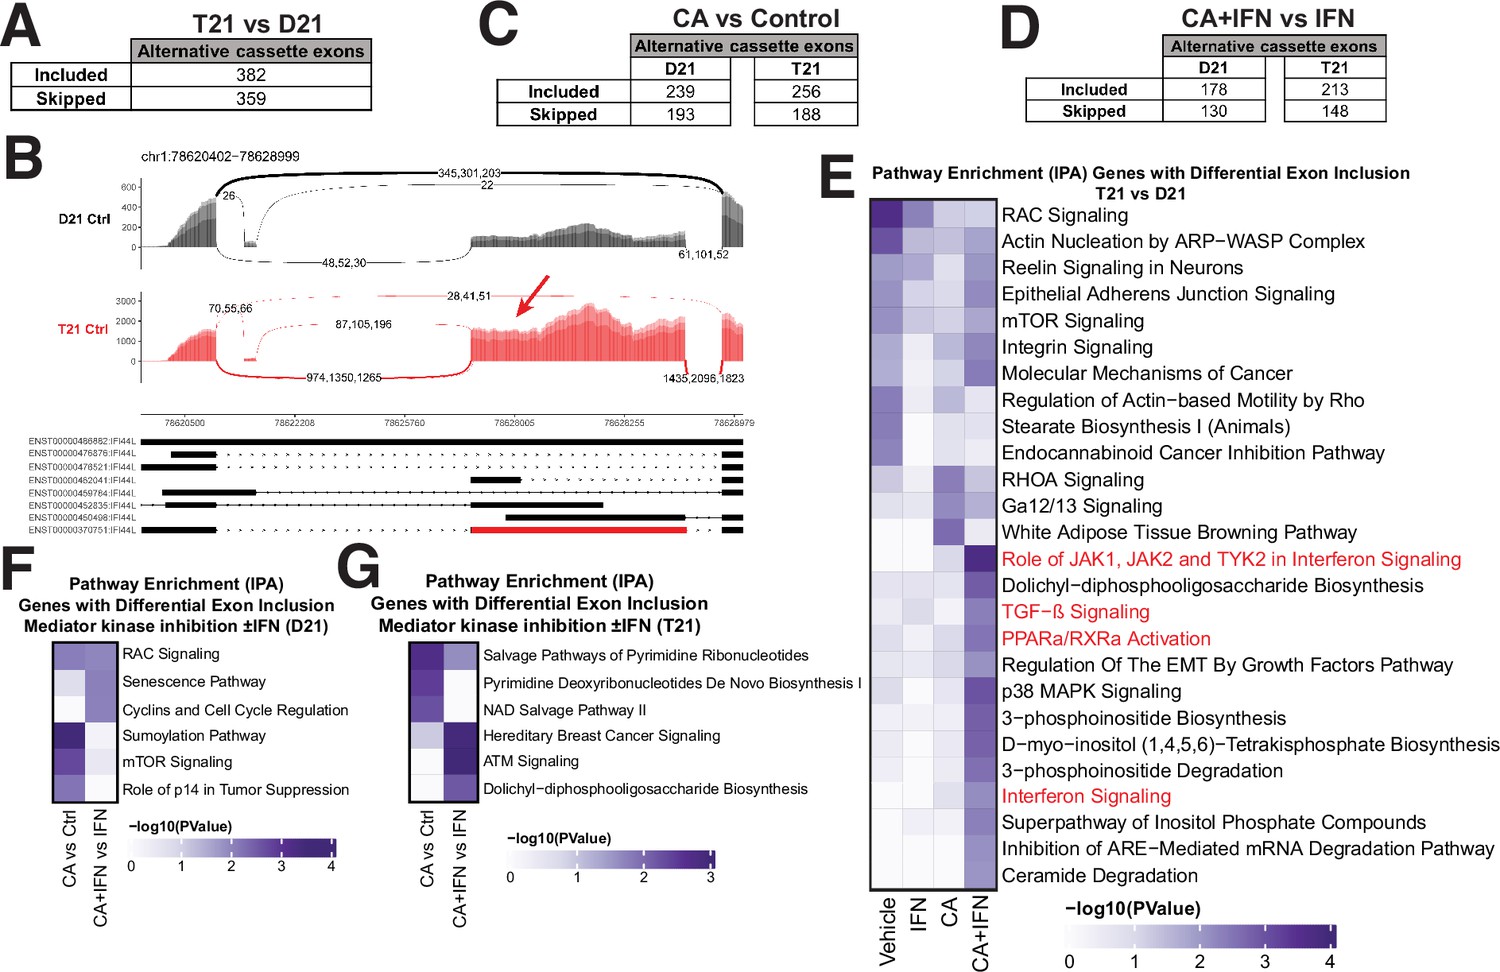
Mediator kinases regulate splicing in pathway-specific ways.
(A) Table of alternative exon usage from untreated T21 cells compared to D21. Inclusion criteria were assessed at FDR <0.05, |InclusionLevelDifference| >0.2, and ≥2 reads/replicate. (B) Sashimi plots for the IFI44L gene, with normalized read numbers for D21 control (black) and T21 control (red) samples on the y-axis, and splice junction read numbers (representing each of three replicate experiments). (C) Table of alternative exon usage from cortistatin A (CA)-treated D21 or T21 cells compared to controls. Inclusion criteria were same as for panel A. (D) Table of alternative exon usage from D21 or T21 cells treated with IFNγ and CA compared to IFNγ alone. Inclusion criteria were same as for panel A. (E) Ingenuity Pathway Analysis enrichment results of genes with alternative exon skipping events in T21 vs. D21 cells; different treatment conditions indicated at bottom. Pathways relevant to IFNγ signaling are highlighted in red. Genes affected by alternative splicing in T21 vs. D21 cells could be grouped into different signaling pathways (e.g. RAC, mTOR, integrin) that are important for robust immune responses (Jones and Pearce, 2017; Lee et al., 2021a), suggesting how alternative splicing may influence inflammatory signaling in T21 cells. Ingenuity Pathway Analysis enrichment results of genes with alternative exon skipping events in D21 (F) or T21 (G) cells treated with CA (±IFNγ).
-
Figure 5—source data 1
Splicing data (rMATS); sibling-matched T21 and D21.
- https://cdn.elifesciences.org/articles/100197/elife-100197-fig5-data1-v1.xlsx
-
Figure 5—source data 2
Splicing data (rMATS); non-sibling T21 and sibling T21 t = 24 hr.
- https://cdn.elifesciences.org/articles/100197/elife-100197-fig5-data2-v1.xlsx
-
Figure 5—source data 3
Ingenuity Pathway Analysis (IPA) results from splicing data.
- https://cdn.elifesciences.org/articles/100197/elife-100197-fig5-data3-v1.xlsx
Figure 5—figure supplement 1
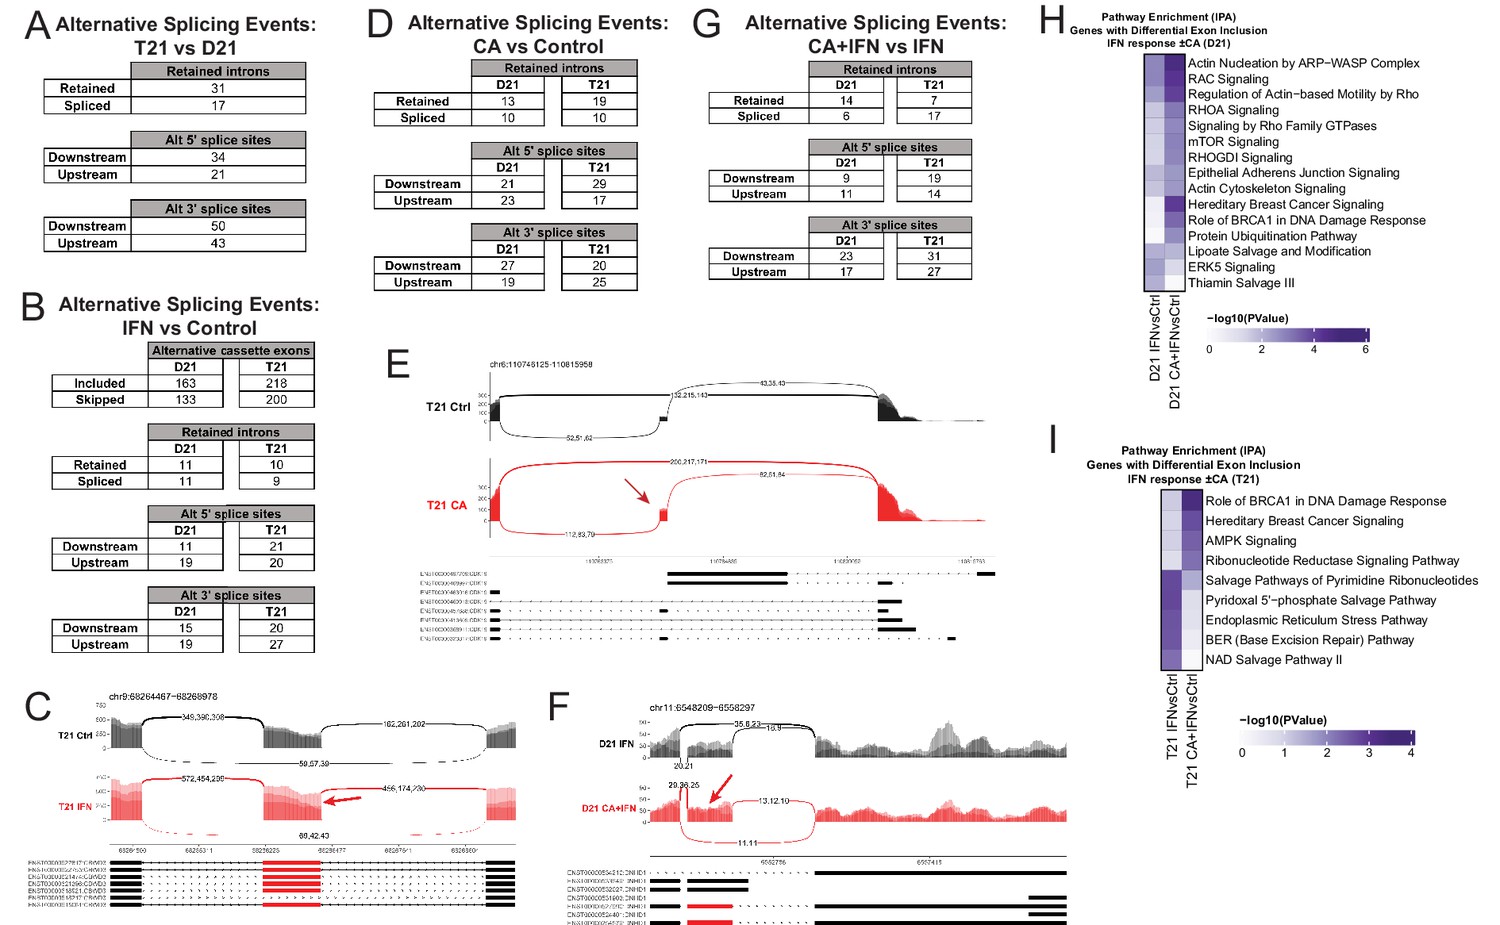
Additional information about splicing changes.
(A) Table of alternative splicing events (RNA-seq data) from untreated T21 cells compared to D21. Inclusion criteria were an FDR <0.05, |InclusionLevelDifference| >0.2, and ≥2 reads/replicate. (B) Table of alternative splicing events from D21 or T21 cells treated with IFNγ compared to control cells. Inclusion criteria were as indicated in A. (C) Sashimi plots of the CBWD3 gene, with normalized read numbers for T21 control (black) and T21 IFNγ (red) samples on the y-axis and splice junction read numbers (representing each of three replicate experiments). (D) Table of alternative splicing events from D21 or T21 cells treated with cortistatin A (CA) compared to controls. Inclusion criteria were as indicated in A. (E) Sashimi plots for the CDK19 gene, with normalized read numbers for T21 Ctrl (black) and T21 +CA (red) samples on the y-axis, and splice junction read numbers (representing each of three replicate experiments). Arrow denotes greater inclusion of alternative exon T21 +CA. (F) Sashimi plots for the DNHD1 gene, with normalized read numbers for D21 +IFNγ (black) and D21 +IFNγ +CA (red) samples on the y-axis, and splice junction read numbers (representing each of three replicate experiments). Arrow denotes greater inclusion of alternative exon D21 +IFNγ +CA. (G) Table of alternative splicing events from D21 or T21 cells treated with IFNγ and CA compared to IFNγ alone. Inclusion criteria were as indicated in A. Ingenuity Pathway Analysis enrichment results of genes with alternative exon skipping events in D21 (H) or T21 (I) cells treated with IFNγ (±CA).
Figure 5—figure supplement 2
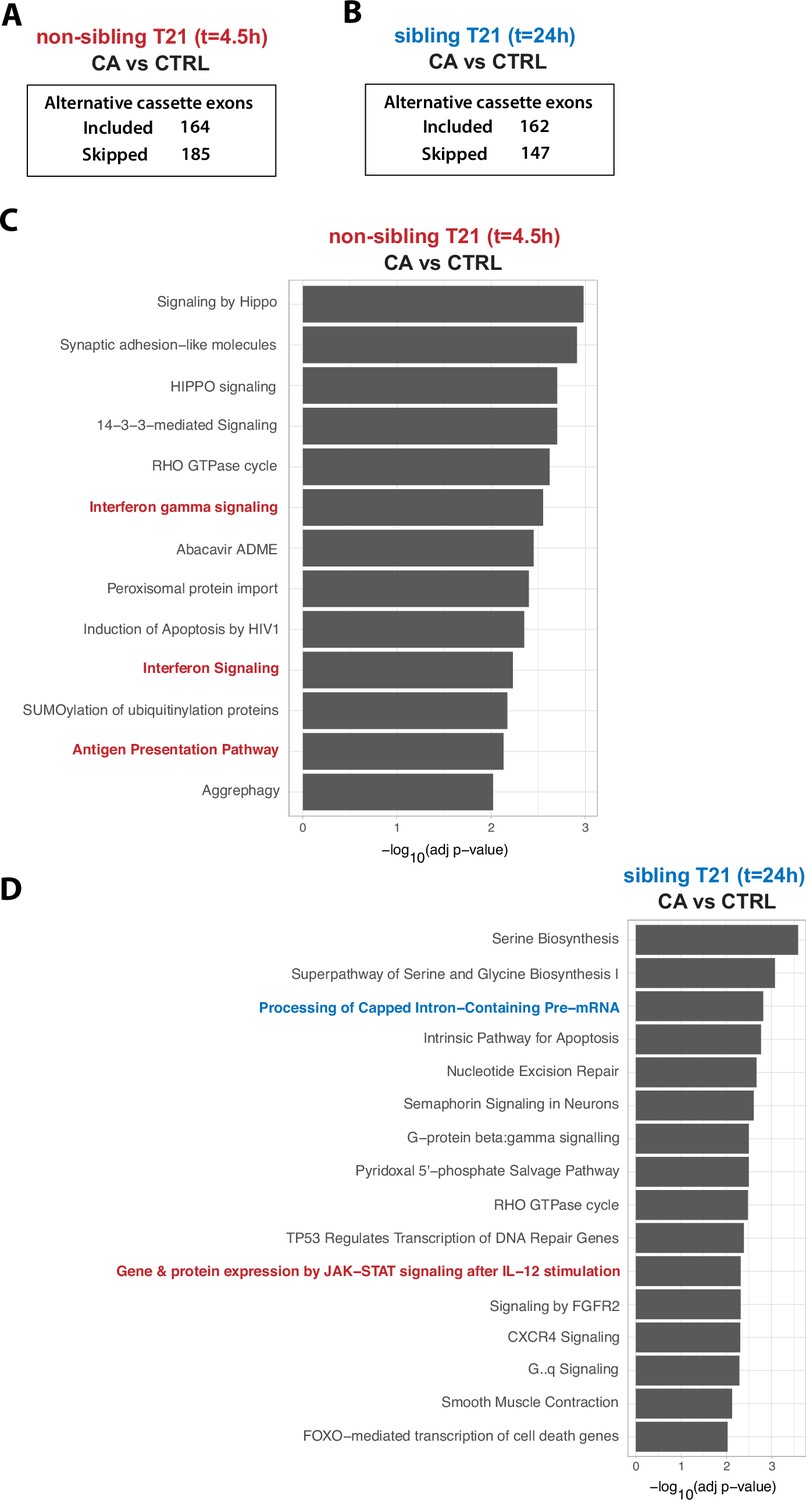
Summary of splicing changes ±CA in non-sibling T21 (t = 4.5 hr) and sibling-matched T21 at 24 hr.
(A) Table of alternative exon usage from non-sibling T21 cells ±CA at t = 4.5 hr. Inclusion criteria were assessed at FDR <0.05, |InclusionLevelDifference| >0.2, and ≥2 reads/replicate. (B) Table of alternative exon usage from sibling T21 cells ±CA at t = 24 hr. Inclusion criteria were as described in panel A. (C) Ingenuity Pathway Analysis enrichment results of genes with alternative exon skipping events in non-sibling T21 cells ±CA at t = 4.5 hr. Pathways relevant to IFN and inflammation are highlighted in red. (D) Ingenuity Pathway Analysis enrichment results of genes with alternative exon skipping events in sibling T21 cells ±CA at t = 24 hr. Pathways relevant to IFN and inflammation are highlighted in red; RNA splicing/processing in blue.
Figure 6

Mediator kinase inhibition rapidly suppresses pro-inflammatory transcription factors (TFs) in T21 cells.
(A) MA plot of Transcription Factor Enrichment Analysis (TFEA) results comparing control (DMSO) vs. cortistatin A (CA)-treated T21 cells under basal conditions, from PRO-seq experiments completed after 75-min CA treatment. (B) Representative examples of bidirectional ‘eRNA’ transcription from PRO-seq data, showing reduced levels in CA-treated cells. Location of TF consensus binding motifs indicated with dashed line.
-
Figure 6—source data 1
Transcription Factor Enrichment Analysis (TFEA) results from PRO-seq data, T21 ±CA.
- https://cdn.elifesciences.org/articles/100197/elife-100197-fig6-data1-v1.xlsx
Figure 7
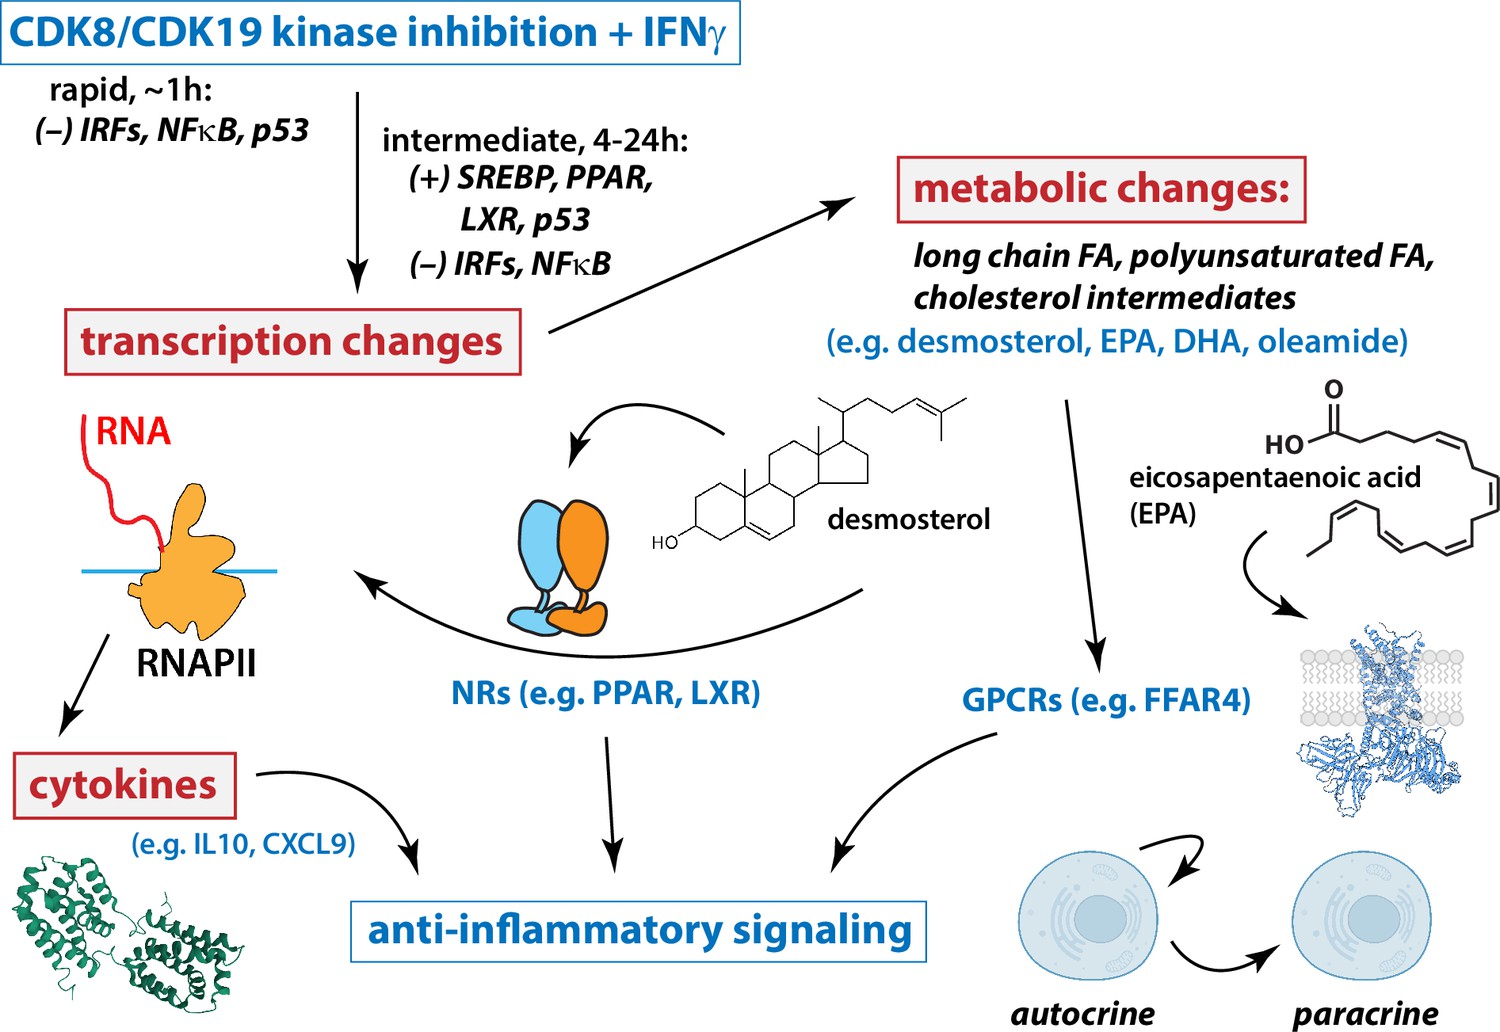
Working model for Mediator kinase-dependent regulation of IFNγ signaling.
Under conditions of IFN stimulation, Mediator kinase inhibition suppresses pro-inflammatory transcriptional responses, including expression of cytokine genes and receptors. Mechanistically, this occurs through rapid inhibition of IRF and NFκB transcription factors (TFs), which persists 4–24 hr after Mediator kinase inhibition. Mediator kinase inhibition also activates SREBP, which likely results from rapid suppression of p53 (Moon et al., 2019). Metabolic changes include increased levels of PPAR and LXR ligands, which tracks with activation of PPAR and LXR target genes 4–24 hr after Mediator kinase inhibition. See text for additional details.
Author response image 1

Information about cortistatin A.
(A) KiNativ kinome screen from HEK293 lysates. CA blocked capture of only CDK8/CDK19 in this MSbased assay, among over 200 kinases detected. (B) Equilibrium binding constants and kinetics for CA. (C) CA structure; note the dimethylamine is protonated at physiological pH, and forms a pi-cation interaction with W105 (crystal structure, panel D). Only CDK8 and CDK19 have an aromatic residue (W) at this position, providing a structural basis for high selectivity.
Additional files
Download links
A two-part list of links to download the article, or parts of the article, in various formats.
Downloads (link to download the article as PDF)
Open citations (links to open the citations from this article in various online reference manager services)
Cite this article (links to download the citations from this article in formats compatible with various reference manager tools)
Mediator kinase inhibition suppresses hyperactive interferon signaling in Down syndrome
eLife 13:RP100197.
https://doi.org/10.7554/eLife.100197.3


