Malaria parasites require a divergent heme oxygenase for apicoplast gene expression and biogenesis
- Department of Biochemistry, University of Utah School of Medicine, United States
- Department of Biological Chemistry, University of California, Los Angeles, United States
- Departments of Medicine and Molecular Microbiology, Washington University School of Medicine, United States
- Department of Chemistry & Biotechnology, The University of Tokyo, Japan
- Department of Protein Drug Discovery, Graduate School of Pharmaceutical Sciences, Kyushu University, Japan
- Department of Bioengineering, University of Tokyo, Japan
Figures
Figure 1 with 5 supplements
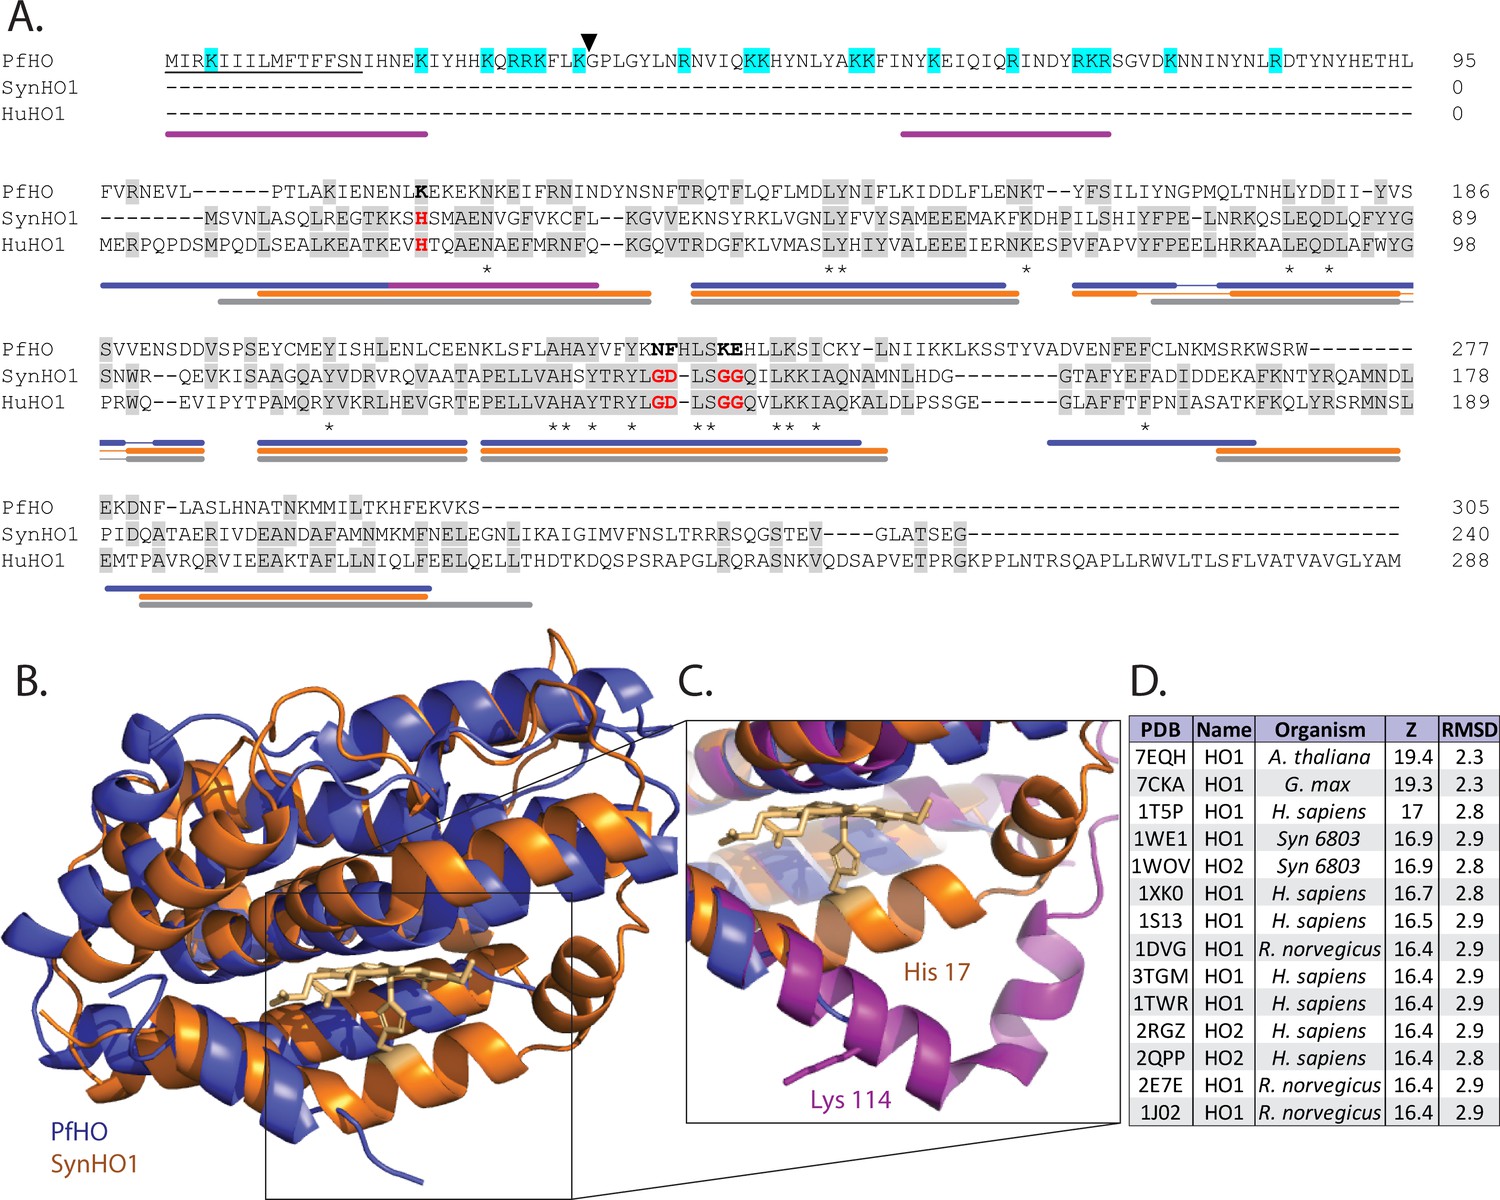
Sequence and structural homology of PfHO.
(A) Sequence alignment of P. falciparum (PfHO, Q8IJS6), cyanobacterial (SynHO1, P72849), and human (HuHO1, P09601) heme oxygenase homologs (Uniprot ID). Conserved histidine ligand and distal helix residues required for catalysis in SynHO1 and HuHO1 are marked in red, and identical residues in aligned sequences are in gray. Asterisks indicate identical residues in all three sequences. The predicted N-terminal signal peptide of PfHO is underlined, electropositive residues in the PfHO leader sequence are highlighted in cyan, and the black arrow marks the putative targeting peptide processing site. Colored bars below the sequence alignment mark locations of α helices observed in crystal structures of PfHO (blue), SynHO1 (orange), and HuHO1 (grey), and the AlphaFold structural prediction for PfHO (purple). (B) Structural superposition of the 2.8 Å-resolution X-ray crystal structure of apo-PfHO84-305 (blue, PDB: 8ZLD) and the 2.5 Å-resolution X-ray structure of cyanobacterial, SynHO1 (orange, PDB: 1WE1). (C) Structural superposition of the proximal helix for SynHO1 active site (orange), PfHO crystal structure (blue), and the AlphaFold structural prediction of PfHO (purple). (D) Top-scoring protein structures in the PDB identified by the DALI server based on structural similarity to the X-ray crystal structure of PfHO84-305. RMSD is calculated in angstroms (Å), and Z-score is a unitless parameter describing similarity, where greater value indicates higher similarity (Holm, 2020).
-
Figure 1—source data 1
PDB file for 2.8 Å-resolution structure of PfHO.
- https://cdn.elifesciences.org/articles/100256/elife-100256-fig1-data1-v1.zip
Figure 1—figure supplement 1
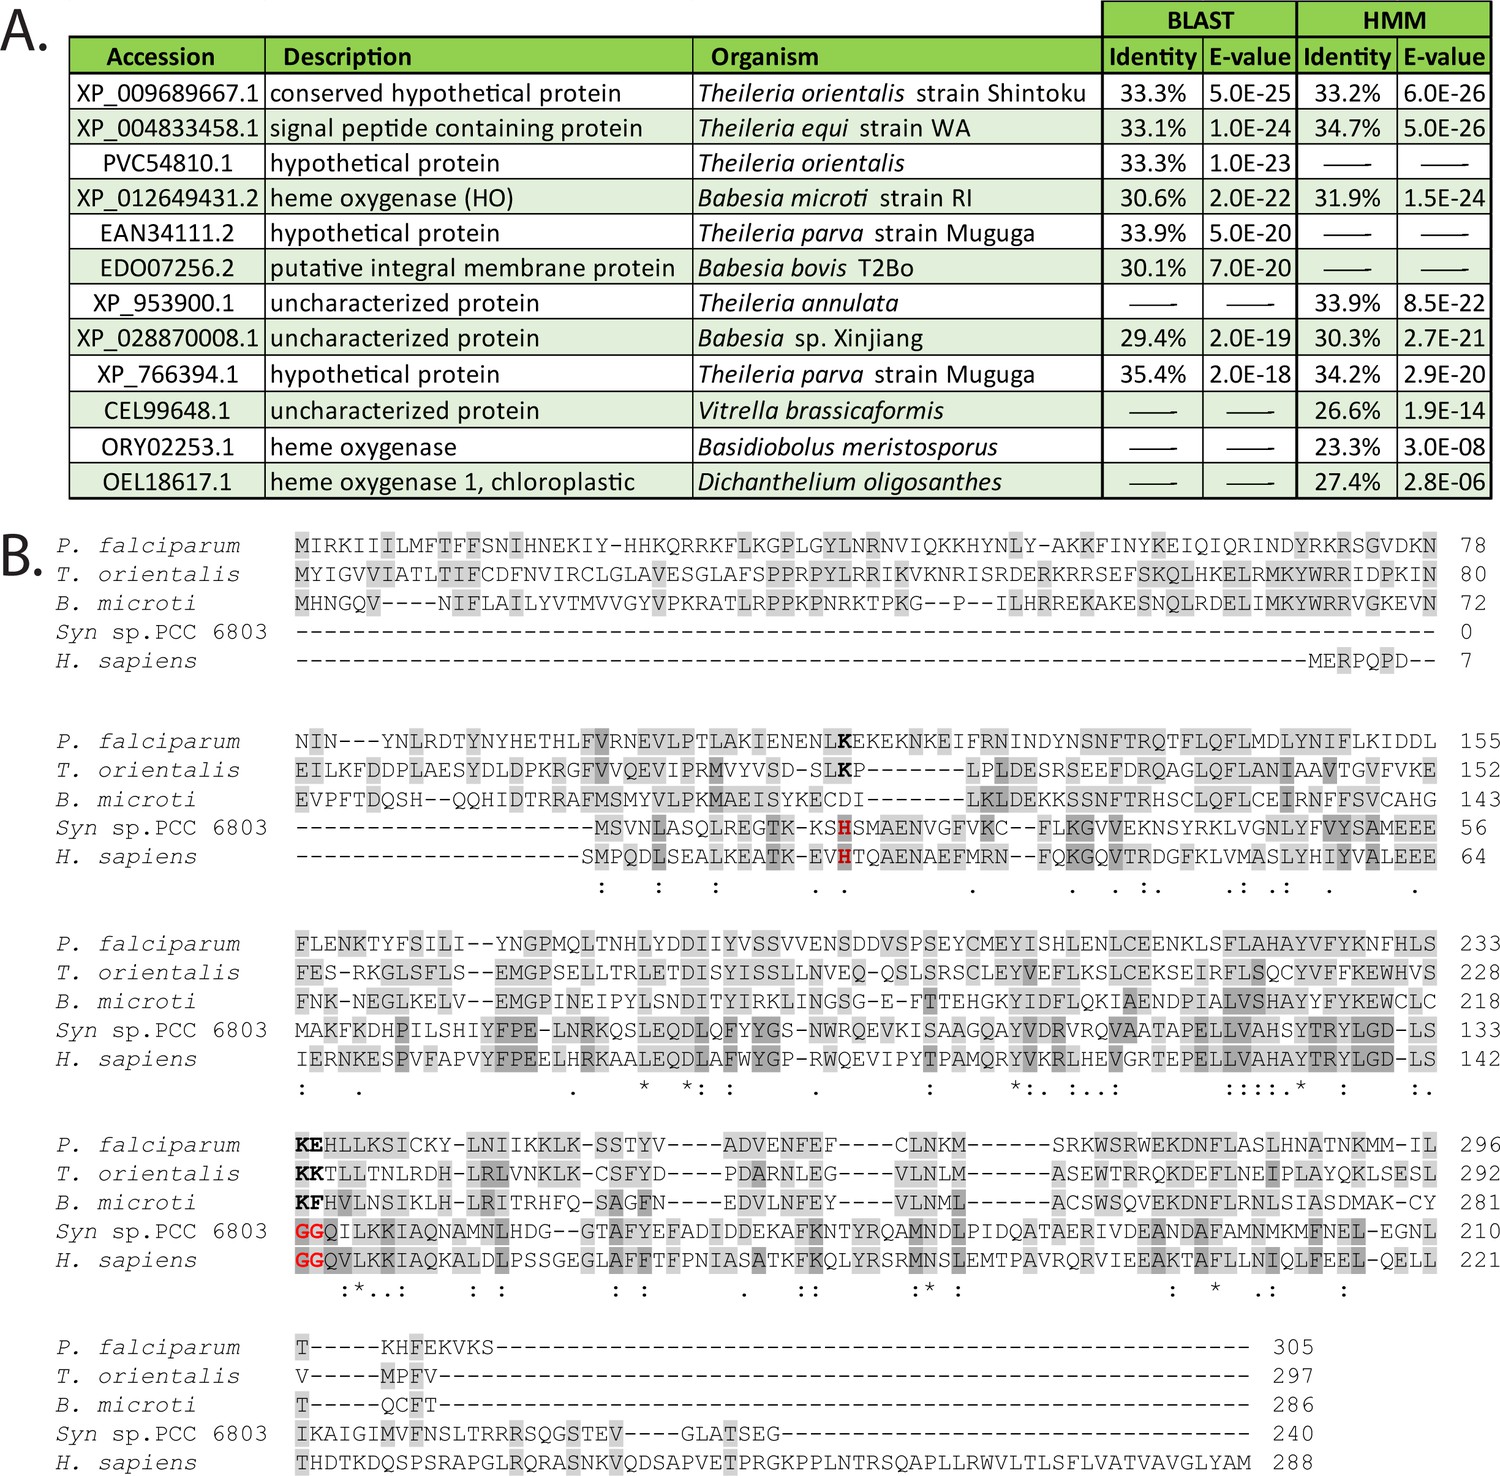
Sequence homology of PfHO.
(A) Sequence homologs of PfHO based on BLAST (Altschul et al., 1990) and HMM (Potter et al., 2018) sequence-similarity searches. (B) Sequence alignment of PfHO (Q8IJS6) with SynHO1 (P72849), Human HO1 (P09601), and HO homologs in Theileria orientalis (J4C2V8) and Babesia microti (A0A1R4ACC9). Uniprot accession codes given in parentheses.
Figure 1—figure supplement 2
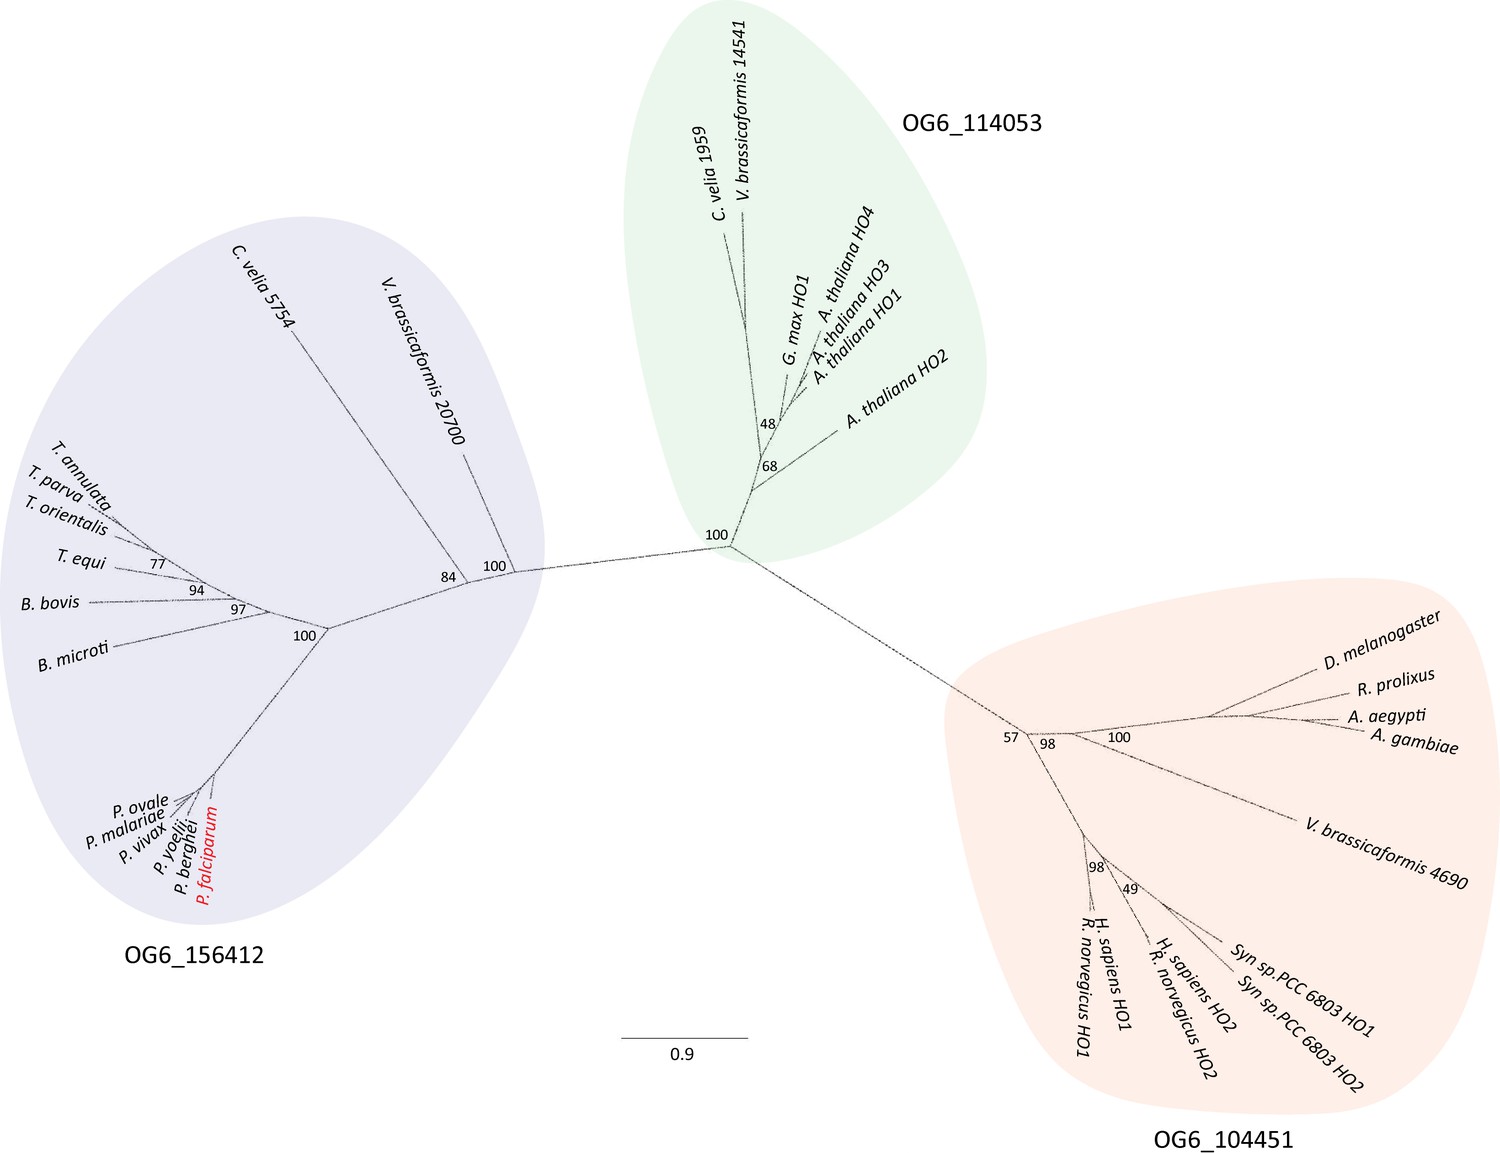
Phylogenic tree of mammalian, plant, algal, and hematozoan HOs.
Nodes are annotated with bootstrap values for each branch. Ortholog groups independently predicted by OrthoMCL (Amos et al., 2022) are annotated for each colored section. Only select Plasmodium HOs are included for clarity, but all other known proteins of OG6_156412 are displayed. PfHO is marked in red.
Figure 1—figure supplement 3
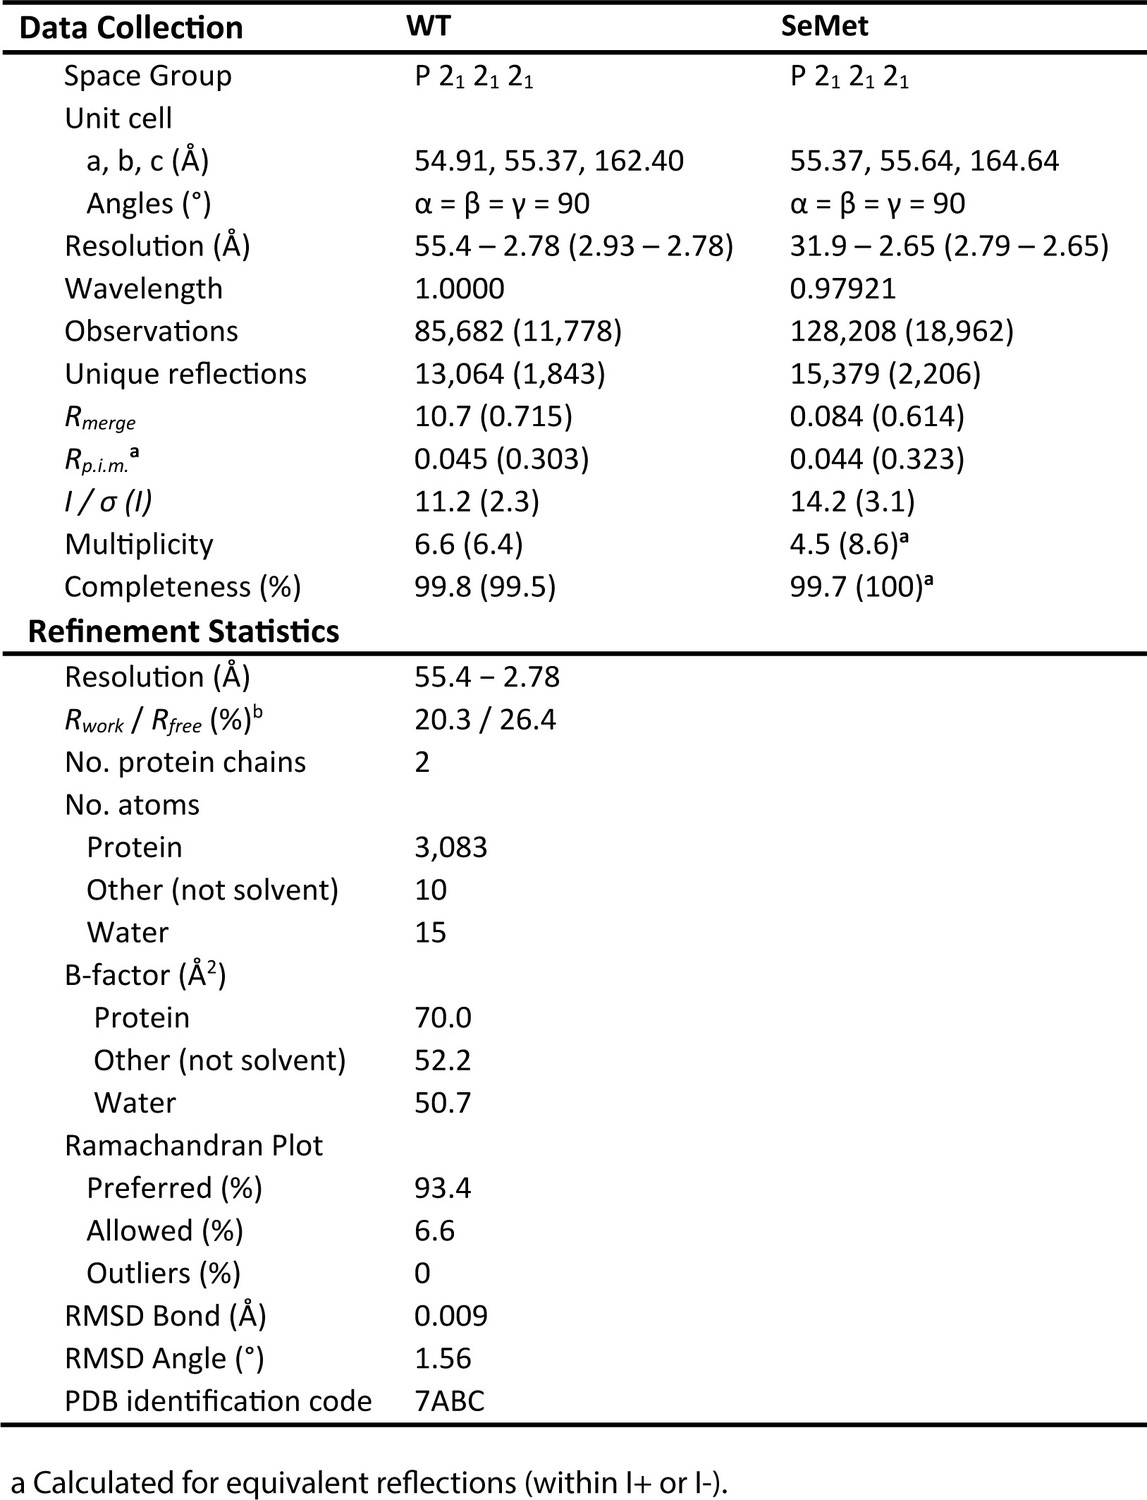
X-ray crystallographic data collection and structure refinement statistics for PfHO.
crystallographic data collection and structure refStatistical values given in parentheses refer to the highest resolution bin.
-
Figure 1—figure supplement 3—source data 1
- https://cdn.elifesciences.org/articles/100256/elife-100256-fig1-figsupp3-data1-v1.docx
Figure 1—figure supplement 4
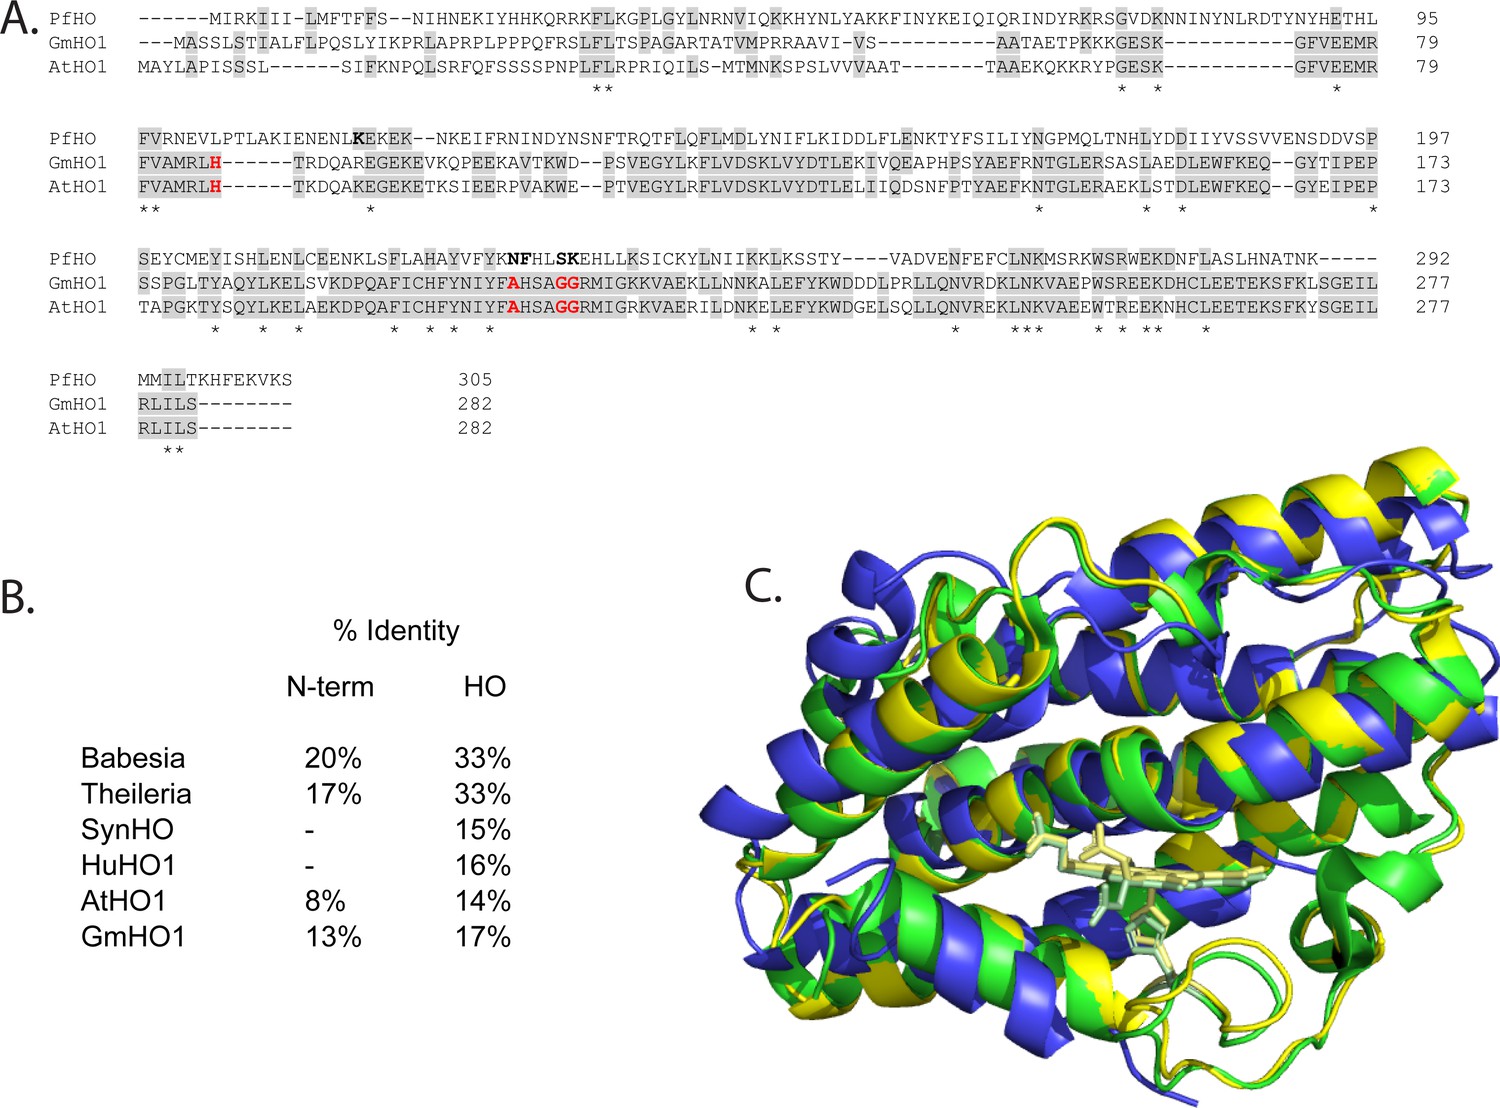
Sequence and structural alignment of PfHO and plant HOs.
(A) Sequence alignment of PfHO with Arabidopsis thaliana (O48782) and Glycine max (C6THA4) HO1s (Uniprot ID). Heme-coordinating histidine and distal helix glycines in plant HOs are highlighted in red. (B) Sequence identity of PfHO with proteins identified in our sequence homology analysis showing N-terminal targeting sequence and HO-domain separately. (C) Structural alignment of the 2.8 Å-resolution PfHO crystal structure (blue, PDB: 8ZLD) with X-ray structures of A. thaliana HO1 (green, PDB: 7EQH) and G. max HO1 (yellow, PDB: 7CKA).
Figure 1—figure supplement 5
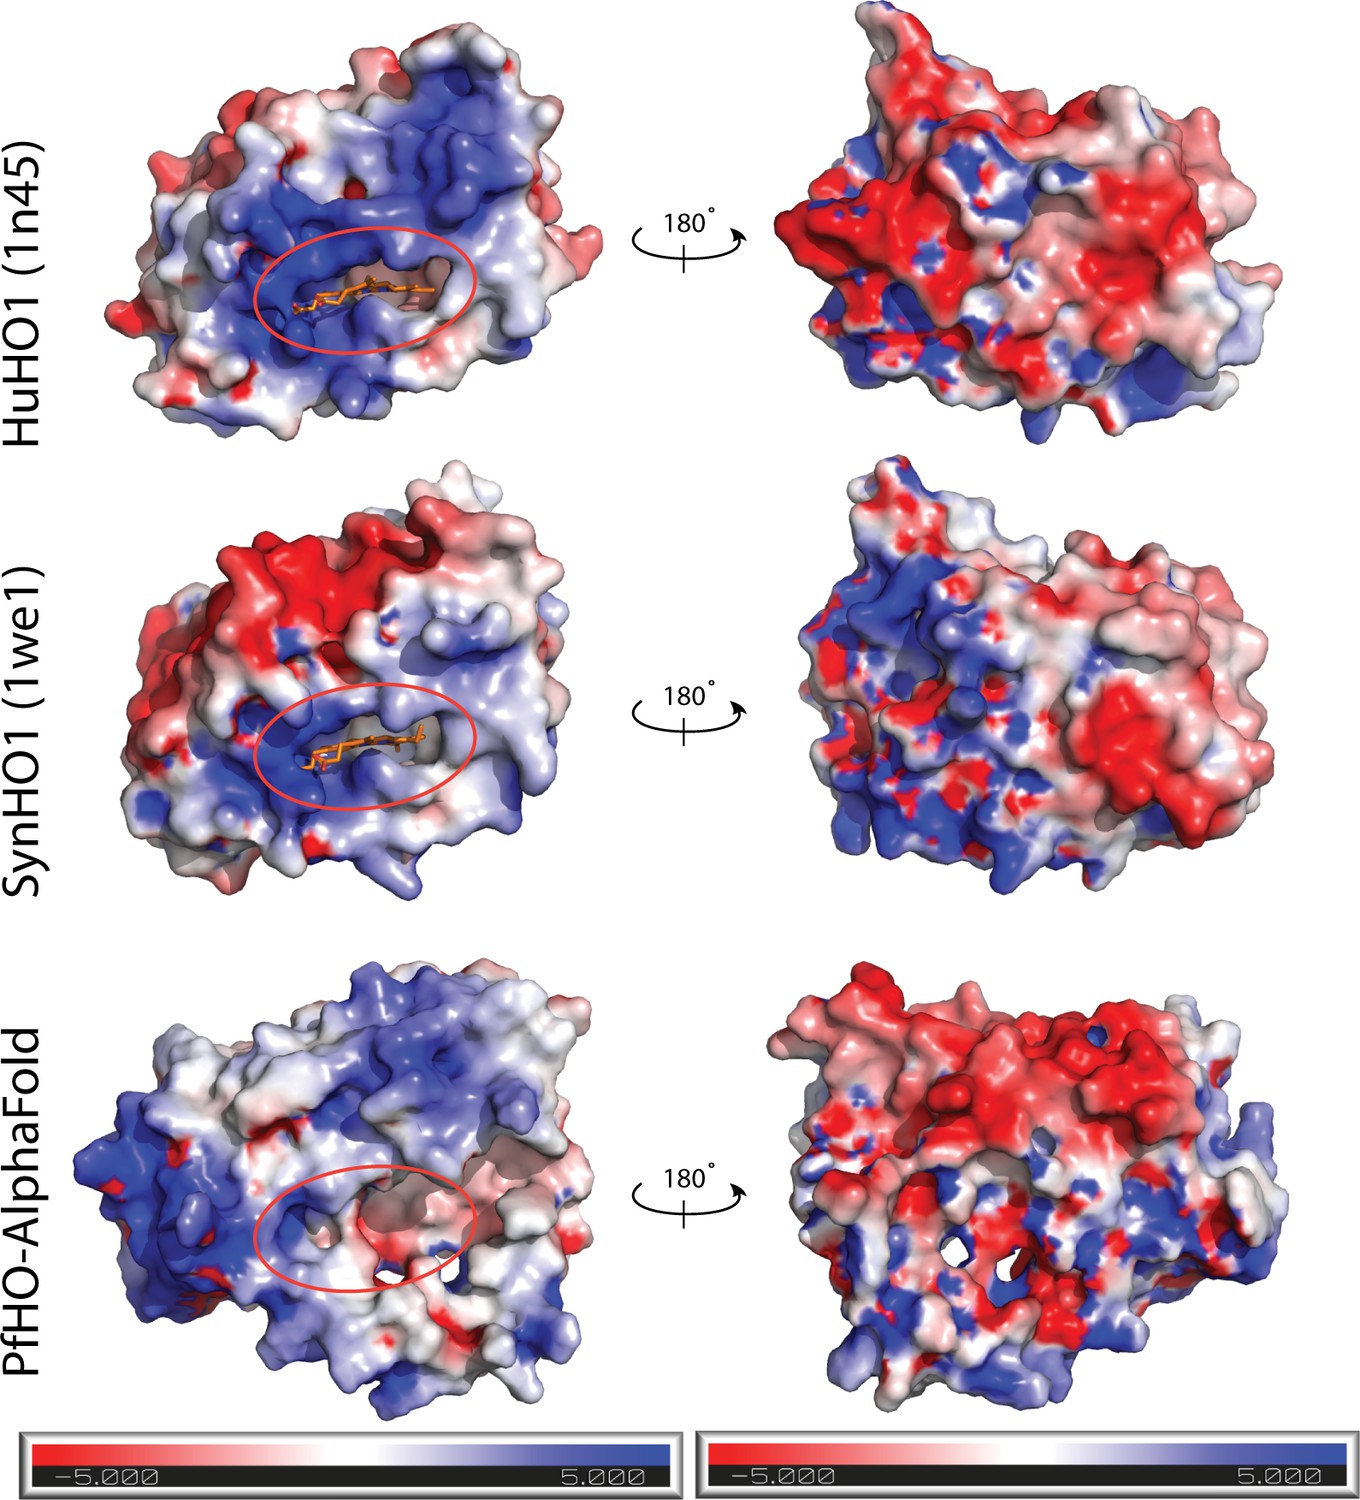
HO surface charge features.
Electrostatic surface potential maps calculated for human HO1 (PDB 1N45), SynHO1 (PDB 1WE1), and the AlphaFold-predicted structure for PfHO (HO domain only) and contoured at ±5 kT/e. Calculations were performed using the APBS PDB2PQR online software suite (Jurrus et al., 2018).
Figure 2 with 2 supplements
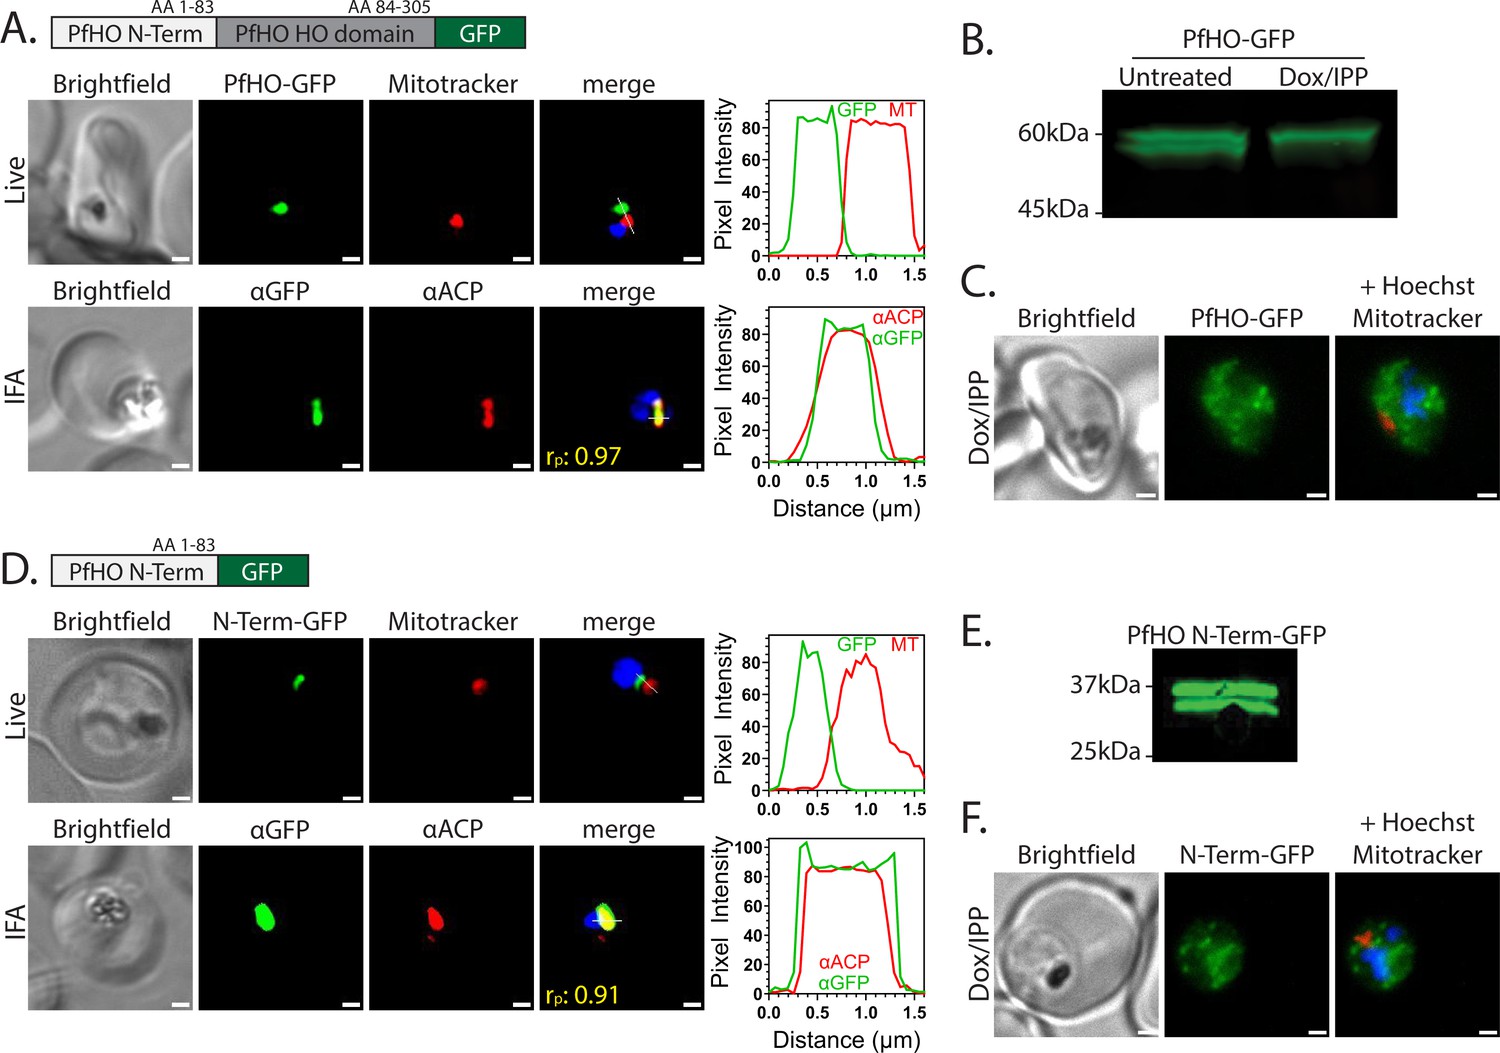
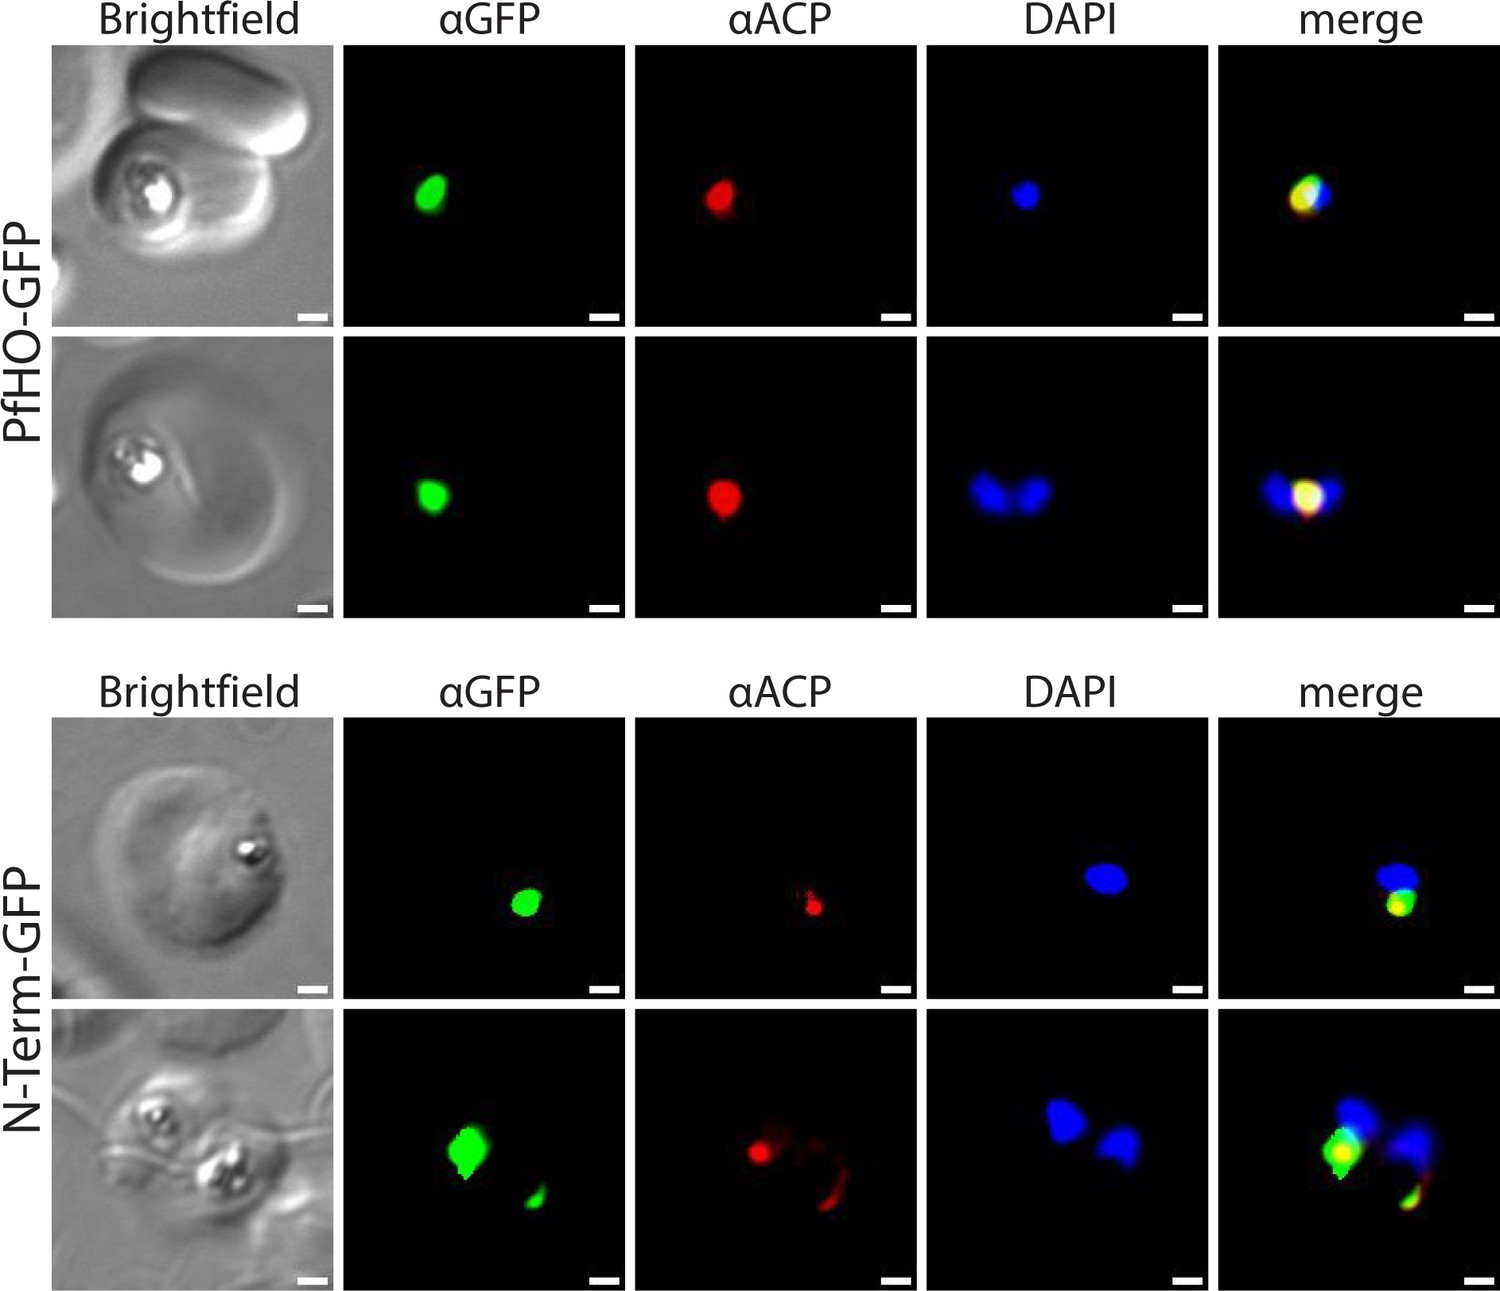
PfHO localization and processing.
(A) Widefield fluorescence microscopy of Dd2 parasites episomally expressing PfHO-GFP. For live imaging, parasites were stained with 25 nM Mitotracker Red and 10 nM Hoechst. For IFA, parasites were fixed and stained with anti-GFP and anti-apicoplast ACP antibodies, as well as DAPI. For all images, the white scale bars indicate 1 µm. The average Pearson correlation coefficient (rp) of red and green channels based on ≥10 images. Pixel intensity plots as a function of distance along the white line in merged images are displayed graphically beside each parasite. (B) Western blot of untreated or Dox/IPP-treated parasites episomally expressing PfHO-GFP and stained with anti-GFP antibody. (C) Live microscopy of PfHO-GFP parasites cultured 7 days in 1 µM doxycycline (Dox) and 200 µM IPP and stained with 25 nM Mitotracker Red and 10 nM Hoechst. (D) Widefield fluorescence microscopy of Dd2 parasites episomally expressing PfHO N-term-GFP and stained as in panel A. (E) Western blot of parasites episomally expressing PfHO N-term-GFP and stained with anti-GFP antibody. (F) Live microscopy of PfHO N-term-GFP parasites cultured 7 d in 1 µM Dox and 200 µM IPP, and stained as in panel C. For each parasite line and condition, ≥20 parasites were analyzed by live imaging and ≥10 parasites were analyzed by IFA.
-
Figure 2—source data 1
Uncropped and labeled western blot for Figure 2B.
- https://cdn.elifesciences.org/articles/100256/elife-100256-fig2-data1-v1.zip
-
Figure 2—source data 2
Original unlabeled file for western blot image in Figure 2B.
- https://cdn.elifesciences.org/articles/100256/elife-100256-fig2-data2-v1.zip
-
Figure 2—source data 3
Uncropped and labeled western blot for Figure 2E.
- https://cdn.elifesciences.org/articles/100256/elife-100256-fig2-data3-v1.zip
-
Figure 2—source data 4
Original unlabeled file for western blot image in Figure 2E.
- https://cdn.elifesciences.org/articles/100256/elife-100256-fig2-data4-v1.zip
Figure 2—figure supplement 1
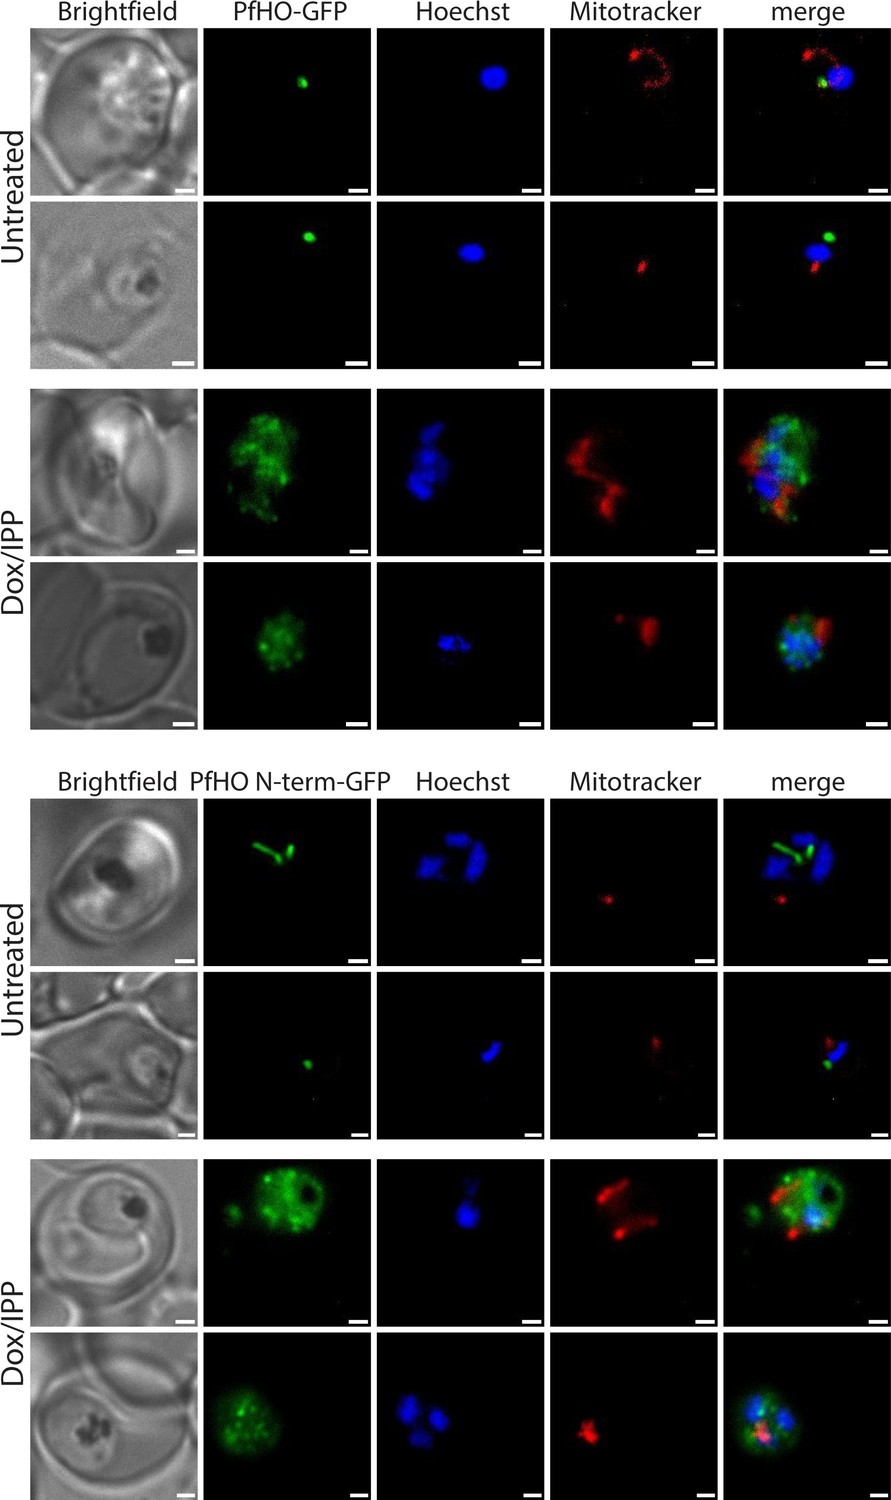
Additional widefield fluorescence microscopy of live Dd2 parasites episomally expressing PfHO-GFP or PfHO N-term-GFP.
Additional widefield fluorescence microscopy of live, untreated or Dox/IPP-treated Dd2 parasites episomally expressing (A) PfHO-GFP or (B) PfHO N-term-GFP and stained with 25 nM Mitotracker Red and 10 nM Hoechst.
Figure 2—figure supplement 2
Additional widefield immunofluorescence microscopy of fixed Dd2 parasites episomally expressing PfHO-GFP and PfHO N-Term-GFP and stained with anti-GFP and anti-apicoplast acyl carrier protein (ACP) antibodies, and DAPI.
White scale bars in bottom right corners are 1 µm.
Figure 3 with 8 supplements
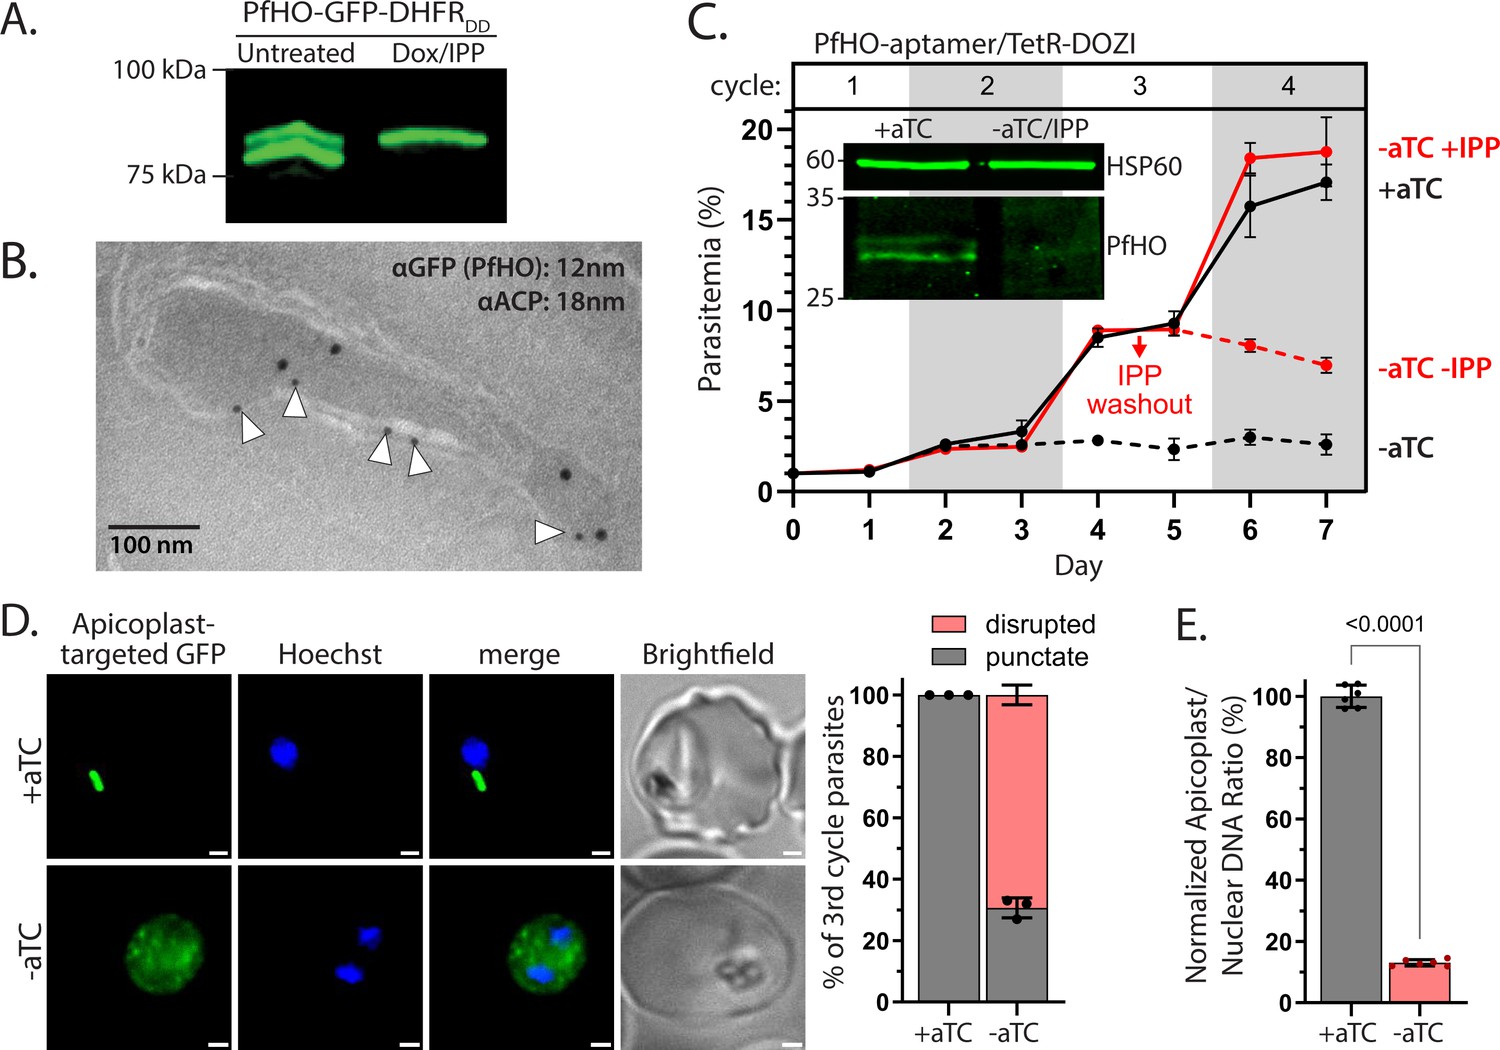
PfHO is essential for parasite viability and apicoplast maintenance.
(A) Western blot of untreated or Dox/IPP-treated parasites with endogenously tagged PfHO-GFP-DHFRDD. (B) Immunogold TEM of a fixed 3D7 parasite endogenously expressing PfHO-GFP-DHFRDD and stained with anti-GFP (12 nm, white arrows) and anti-apicoplast ACP (18 nm) antibodies. (C) Synchronized growth assay of Dd2 parasites tagged at the PfHO locus with the aptamer/TetR-DOZI system and grown ±1 µM aTC and ±200 µM IPP. Data points are the average ± SD of biological triplicates. Inset: western blot analysis of PfHO expression for 100 µg total lysates from parasites grown 3 d ±aTC, analyzed in duplicate samples run on the same gel, and stained with either custom anti-PfHO antibody or anti-heat shock protein 60 (HSP60) as loading control. Densitometry of western blot bands indicated >80% reduction in PfHO expression. (D) Live microscopy of PfHO-aptamer/TetR-DOZI parasites episomally expressing apicoplast-localized GFP (PfHO N-Term-GFP) grown 5 d ±aTC with 200 µM IPP. White scale bars in bottom right corners are 1 µm. Right: Population analysis of apicoplast morphology scored for punctate versus dispersed GFP signal in 110 total parasites from biological triplicate experiments. Statistical significance was calculated by Student’s t-test. (E) Quantitative PCR analysis of the apicoplast: nuclear genome ratio for PfHO-aptamer/TetR-DOZI parasites cultured 5 d ±aTC with 200 µM IPP, based on amplification of apicoplast (SufB: Pf3D7_API04700, ClpM: Pf3D7_API03600, TufA: Pf3D7_API02900) relative to nuclear (STL: Pf3D7_0717700, I5P: Pf3D7_0802500, ADSL: Pf3D7_0206700) genes. Indicated qPCR ratios were normalized to +aTC and are the average ± SD of biological triplicates. Significance of ±aTC difference was analyzed by Student’s t-test.
-
Figure 3—source data 1
Uncropped and labeled western blot image of Figure 3A.
- https://cdn.elifesciences.org/articles/100256/elife-100256-fig3-data1-v1.zip
-
Figure 3—source data 2
Original and unlabeled western blot image of Figure 3A.
- https://cdn.elifesciences.org/articles/100256/elife-100256-fig3-data2-v1.zip
-
Figure 3—source data 3
Uncropped and labeled western blot images of Figure 3C.
- https://cdn.elifesciences.org/articles/100256/elife-100256-fig3-data3-v1.zip
-
Figure 3—source data 4
Original and unlabeled western blot images of Figure 3C.
- https://cdn.elifesciences.org/articles/100256/elife-100256-fig3-data4-v1.zip
Figure 3—figure supplement 1
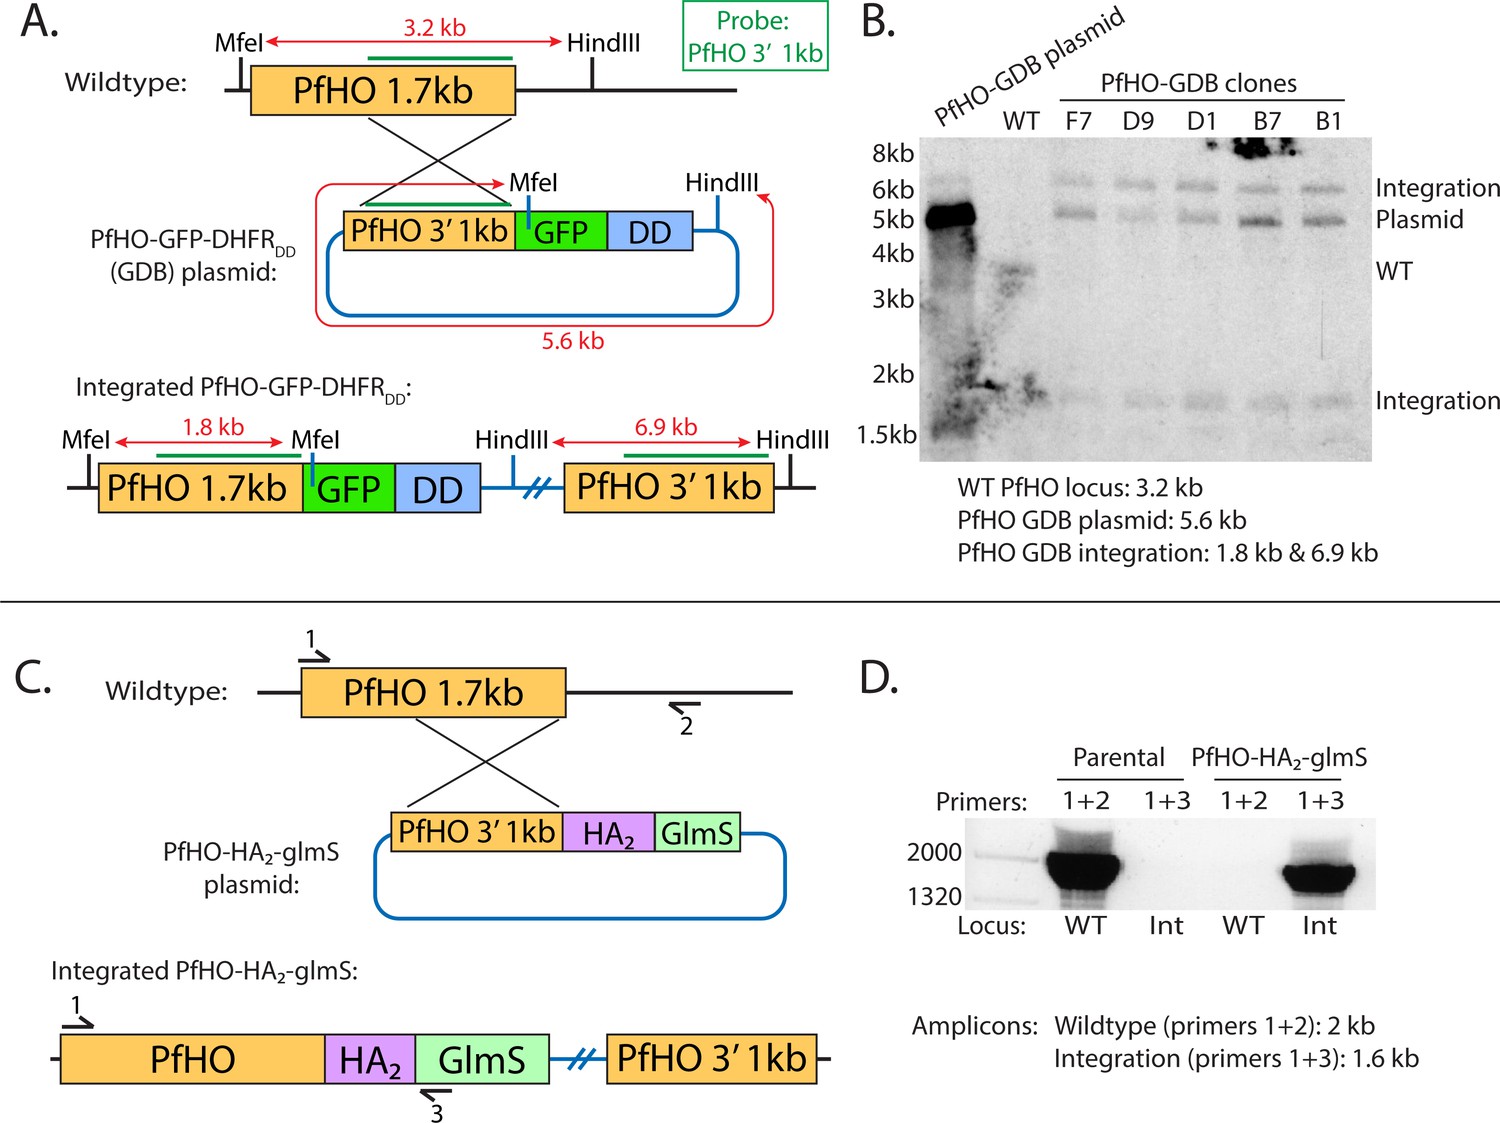
Schemes for modification of the PfHO genomic locus to integrate C-terminal GFP-DHFRDD or HA2-glmS tags.
(A) Schematic of single-crossover strategy for tagging PfHO gene locus with C-terminal GFP-DHFRDD. 1 kb sequence at 3’ of PfHO coding region (green line) was used as a probe to test for integration by Southern blot, and enzyme digestion sites with expected sizes are indicated. (B) Southern blot of digested parasite DNA harvested from wildtype, polyclonal PfHO-GFP-DHFRDD, and select clonal PfHO-GFP-DHFRDD cultures. (C) Schematic of single-crossover integration strategy for tagging PfHO gene locus with C-terminal HA2-glmS. Primer sites used to probe integration by genome PCR are indicated. (D) Genome PCR of parasite DNA harvested from wildtype parental and PfHO- HA2-glmS cultures.
-
Figure 3—figure supplement 1—source data 1
Uncropped and labeled Southern blot image of Figure 3—figure supplement 1B.
- https://cdn.elifesciences.org/articles/100256/elife-100256-fig3-figsupp1-data1-v1.zip
-
Figure 3—figure supplement 1—source data 2
Original and unlabeled Southern blot image of Figure 3—figure supplement 1B.
- https://cdn.elifesciences.org/articles/100256/elife-100256-fig3-figsupp1-data2-v1.zip
-
Figure 3—figure supplement 1—source data 3
Uncropped and labeled PCR gel image of Figure 3—figure supplement 1D.
- https://cdn.elifesciences.org/articles/100256/elife-100256-fig3-figsupp1-data3-v1.zip
-
Figure 3—figure supplement 1—source data 4
Original and unlabeled PCR gel image of Figure 3—figure supplement 1D.
- https://cdn.elifesciences.org/articles/100256/elife-100256-fig3-figsupp1-data4-v1.zip
Figure 3—figure supplement 2
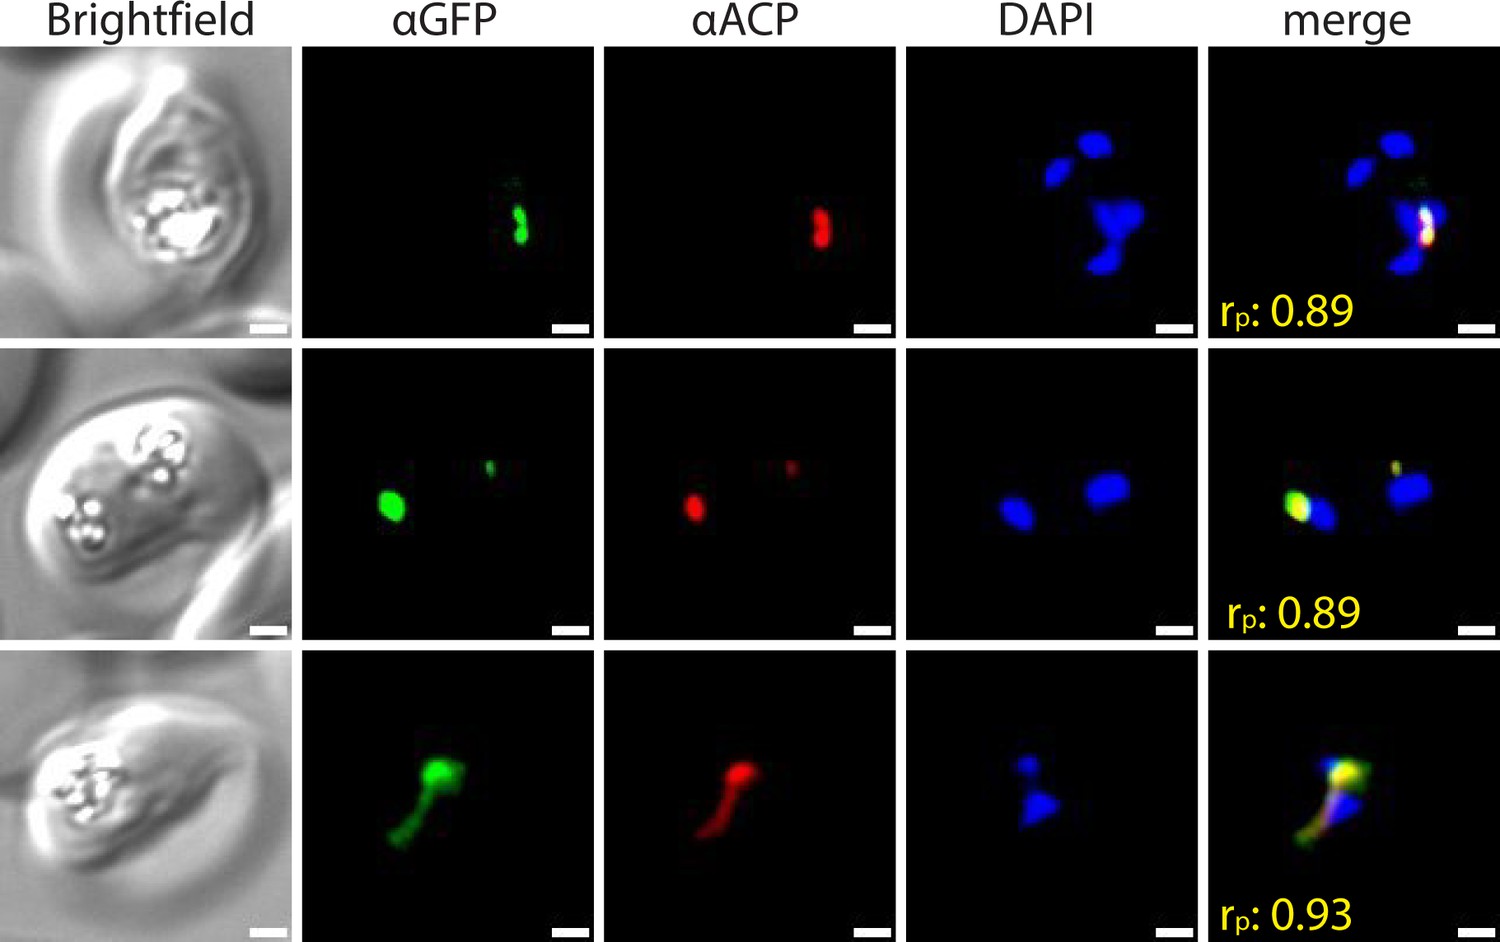
Widefield immunofluorescence microscopy of fixed 3D7 parasites endogenously expressing PfHO-GFP-DHFRDD and stained with anti-GFP and anti-apicoplast acyl carrier protein (ACP) antibodies, and DAPI.
White scale bars in bottom right corners are 1 µm. Pearson correlation coefficient (rp) of red and green channels is shown in merged images in yellow.
Figure 3—figure supplement 3
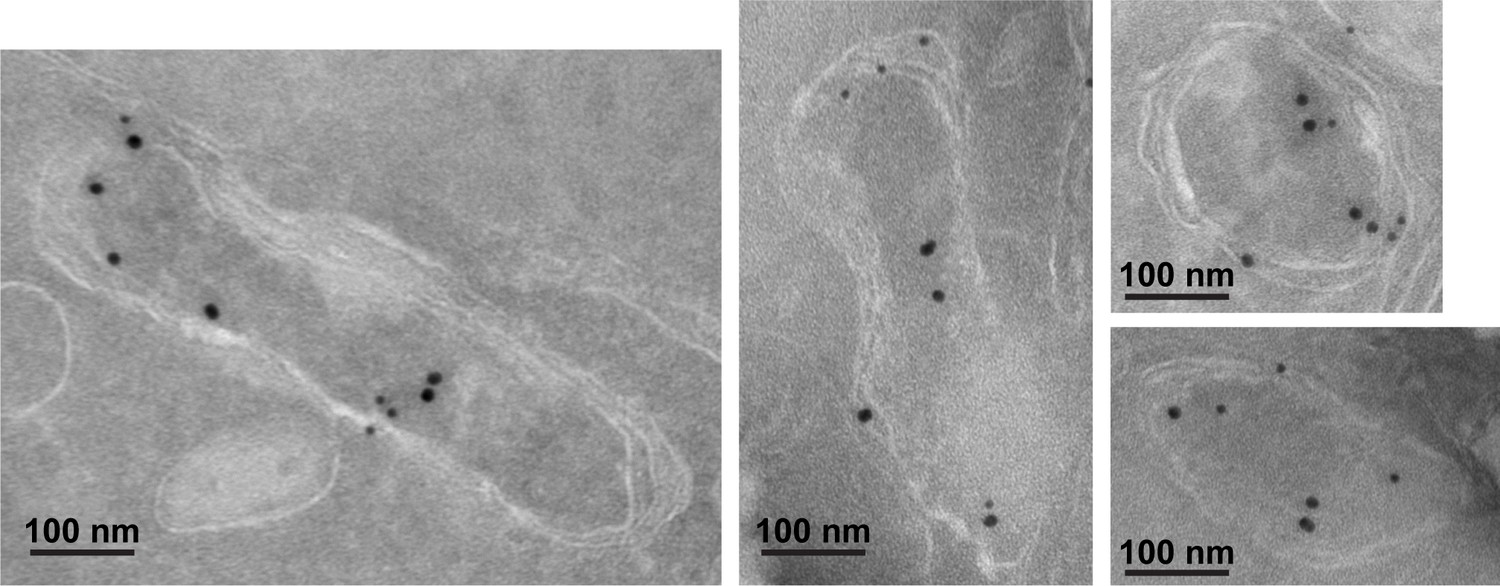
Additional immunogold transmission electron microscopy images of apicoplasts from fixed 3D7 parasite endogenously expressing PfHO-GFP-DHFRDD and stained with anti-GFP (12 nM, green arrows) and anti-apicoplast ACP (18 nM) antibodies.
Figure 3—figure supplement 4
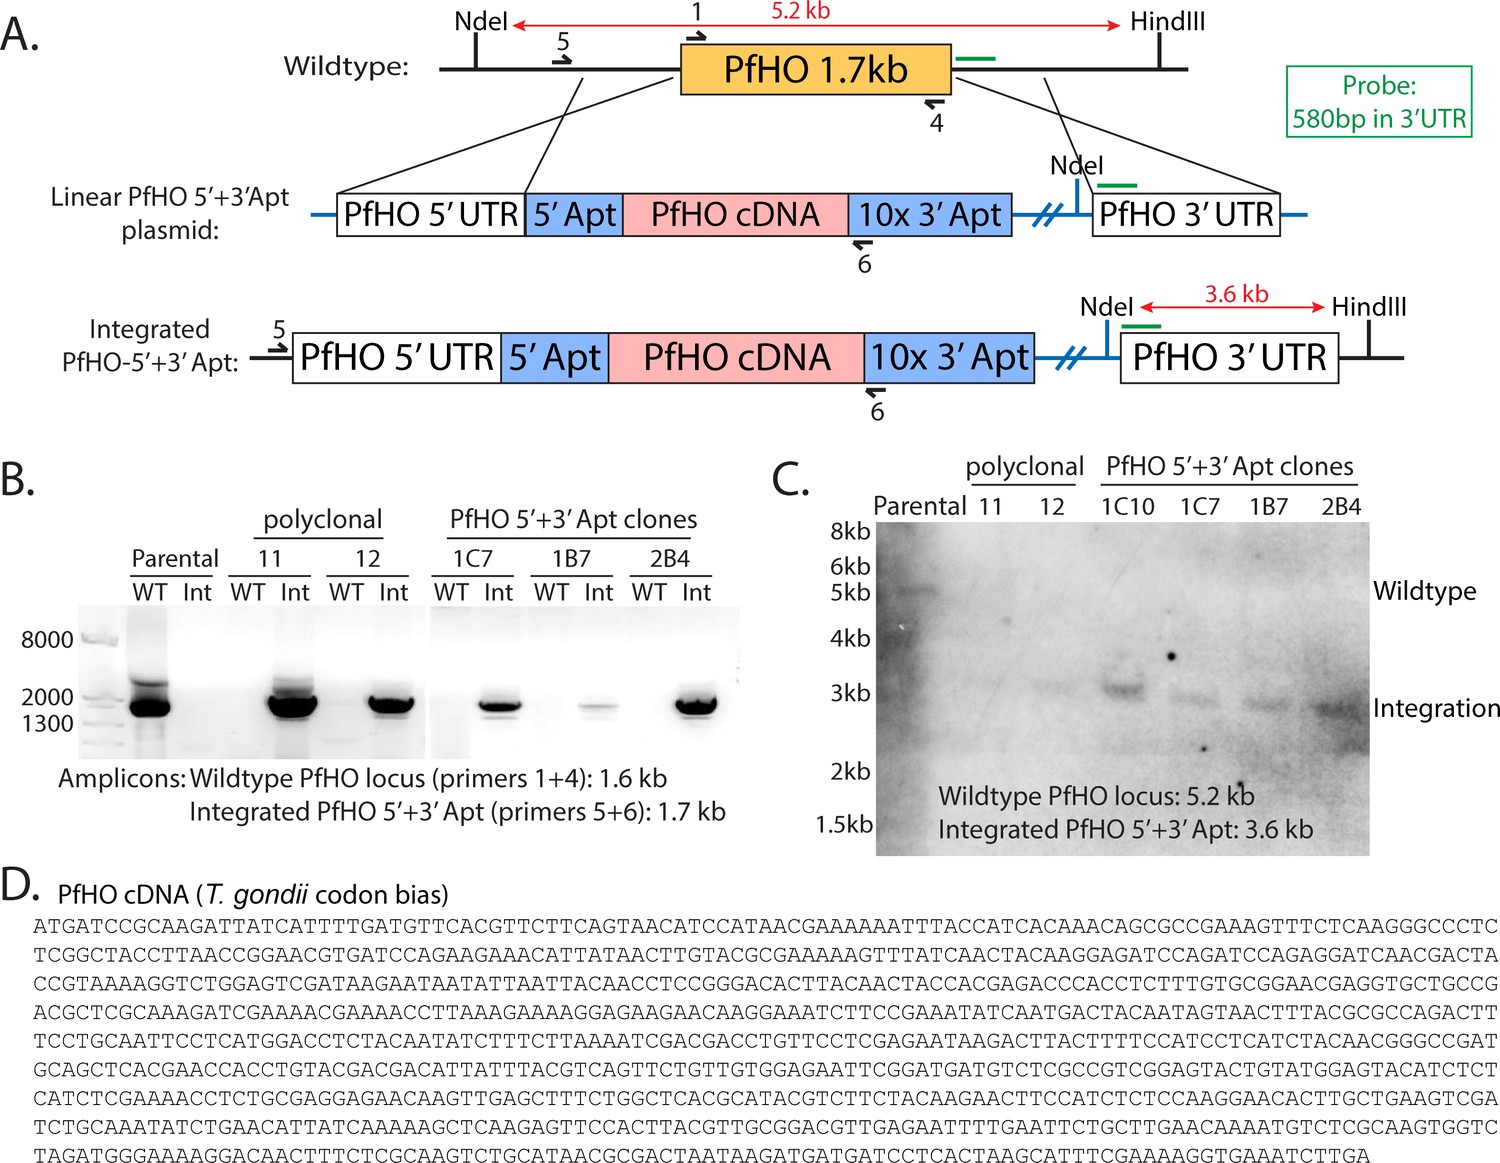
Scheme for modification of the PfHO genomic locus to integrate the aptamer/TetR-DOZI system.
(A) Schematic of double-crossover integration strategy for replacing PfHO gene with cDNA encoding PfHO (Toxoplasma gondii codon bias) and RNA aptamers at the 5’ and 3’ ends of the gene. 580 bp sequence in 3’ UTR of PfHO (green line) was used as a probe to test for integration by Southern blot, and enzyme digestion sites with expected sizes marked on locus and plasmid. Primers used to probe integration by genome PCR are marked on wildtype and tagged loci. (B) Genome PCR of parasite DNA harvested from wildtype parental, polyclonal PfHO-aptamer/TetR-DOZI, and select PfHO-aptamer/TetR-DOZI clonal cultures. (C) Southern blot of digested parasite DNA harvested from wildtype, polyclonal PfHO-aptamer/TetR-DOZI, and select clonal PfHO-aptamer/TetR-DOZI cultures. (D) Complete PfHO cDNA sequence used to replace the endogenous PfHO gene (identical encoded protein sequence).
-
Figure 3—figure supplement 4—source data 1
Uncropped and labeled PCR gel image of Figure 3—figure supplement 4B.
- https://cdn.elifesciences.org/articles/100256/elife-100256-fig3-figsupp4-data1-v1.zip
-
Figure 3—figure supplement 4—source data 2
Original and unlabeled PCR gel image of Figure 3—figure supplement 4B.
- https://cdn.elifesciences.org/articles/100256/elife-100256-fig3-figsupp4-data2-v1.zip
-
Figure 3—figure supplement 4—source data 3
Uncropped and labeled Southern blot image of Figure 3—figure supplement 4C.
- https://cdn.elifesciences.org/articles/100256/elife-100256-fig3-figsupp4-data3-v1.zip
-
Figure 3—figure supplement 4—source data 4
Original and unlabeled Southern blot image of Figure 3—figure supplement 4C.
- https://cdn.elifesciences.org/articles/100256/elife-100256-fig3-figsupp4-data4-v1.zip
Figure 3—figure supplement 5
Validation of custom PfHO antibody specificity.
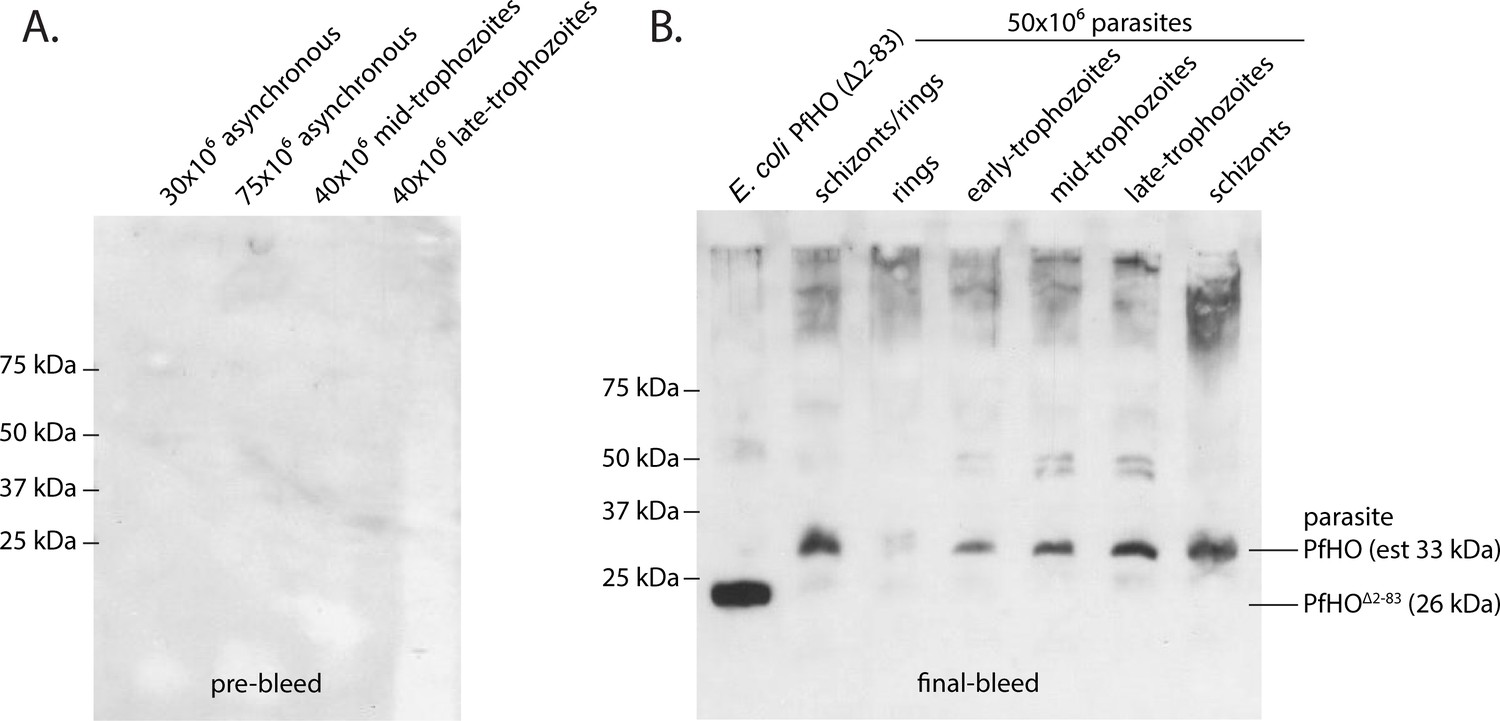
Western blot specificity tests of custom PfHO rabbit antibody in parasite lysates. (A) Lysates from asynchronous or synchronous parasite cultures stained with 1:1000 dilution of rabbit serum prior to inoculation with PfHO protein antigen. (B) Lysates from E. coli expressing PfHO84-305 and from equal numbers of synchronous 3D7 parasites stained with 1:1000 dilution of crude serum from the final bleed of a rabbit inoculated with PfHO protein antigen. Both blots were stained with an anti-rabbit HRP secondary antibody and visualized by chemiluminescence.
-
Figure 3—figure supplement 5—source data 1
Uncropped and labeled western blot images of Figure 3—figure supplement 5A.
- https://cdn.elifesciences.org/articles/100256/elife-100256-fig3-figsupp5-data1-v1.zip
-
Figure 3—figure supplement 5—source data 2
Original and unlabeled western blot images of Figure 3—figure supplement 5A.
- https://cdn.elifesciences.org/articles/100256/elife-100256-fig3-figsupp5-data2-v1.zip
-
Figure 3—figure supplement 5—source data 3
Original and unlabeled western blot images of Figure 3—figure supplement 5B.
- https://cdn.elifesciences.org/articles/100256/elife-100256-fig3-figsupp5-data3-v1.zip
Figure 3—figure supplement 6
Quantitative PCR and additional western blot analysis of PfHO expression ±aTC with 200 µM IPP.
(A) Quantitative PCR of PfHO expression ±aTC with 200 µM IPP. Transcript levels of endogenous PfHO from PfHO-aptamer/TetR-DOZI parasites grown 2 or 4 d±aTC with 200 µM IPP. PfHO transcript abundance is normalized to the average abundance of nuclear-encoded I5P (Pf3D7_0802500), ADSL (Pf3D7_0206700), and STL (Pf3D7_0717700) transcripts, and +aTC is normalized to 100%. Normalized ratios and error bars are the average ± SD of biological triplicates. (B) Additional western blot of Dd2 parasites tagged with PfHO-Aptamer/TetR-DOZI grown ±aTC + 200 µM IPP for 7 d, stained with rabbit anti-Ef1α and custom rabbit anti-PfHO primary antibodies and anti-rabbit-IRDye800 secondary antibody. Stained membrane was visualized on a Licor Odyssey CLx imager. Densitometry of western blot bands indicated >85% reduction of PfHO expression.
-
Figure 3—figure supplement 6—source data 1
Uncropped and labeled western blot image of Figure 3—figure supplement 6B.
- https://cdn.elifesciences.org/articles/100256/elife-100256-fig3-figsupp6-data1-v1.zip
-
Figure 3—figure supplement 6—source data 2
Original and unlabeled western blot image of Figure 3—figure supplement 6B.
- https://cdn.elifesciences.org/articles/100256/elife-100256-fig3-figsupp6-data2-v1.zip
Figure 3—figure supplement 7
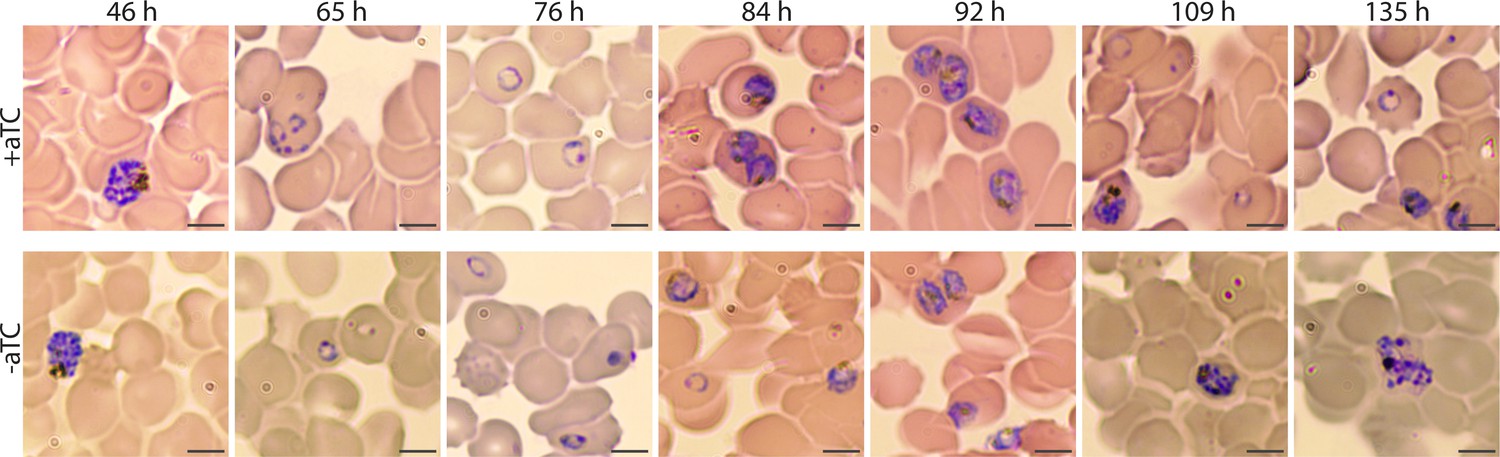
Giemsa-stained smears of PfHO-aptamer/TetR-DOZI parasites grown in ± aTC.
Times indicated are hours post-synchronization. Grey scale bars in bottom right of images mark 5 µm.
Figure 3—figure supplement 8
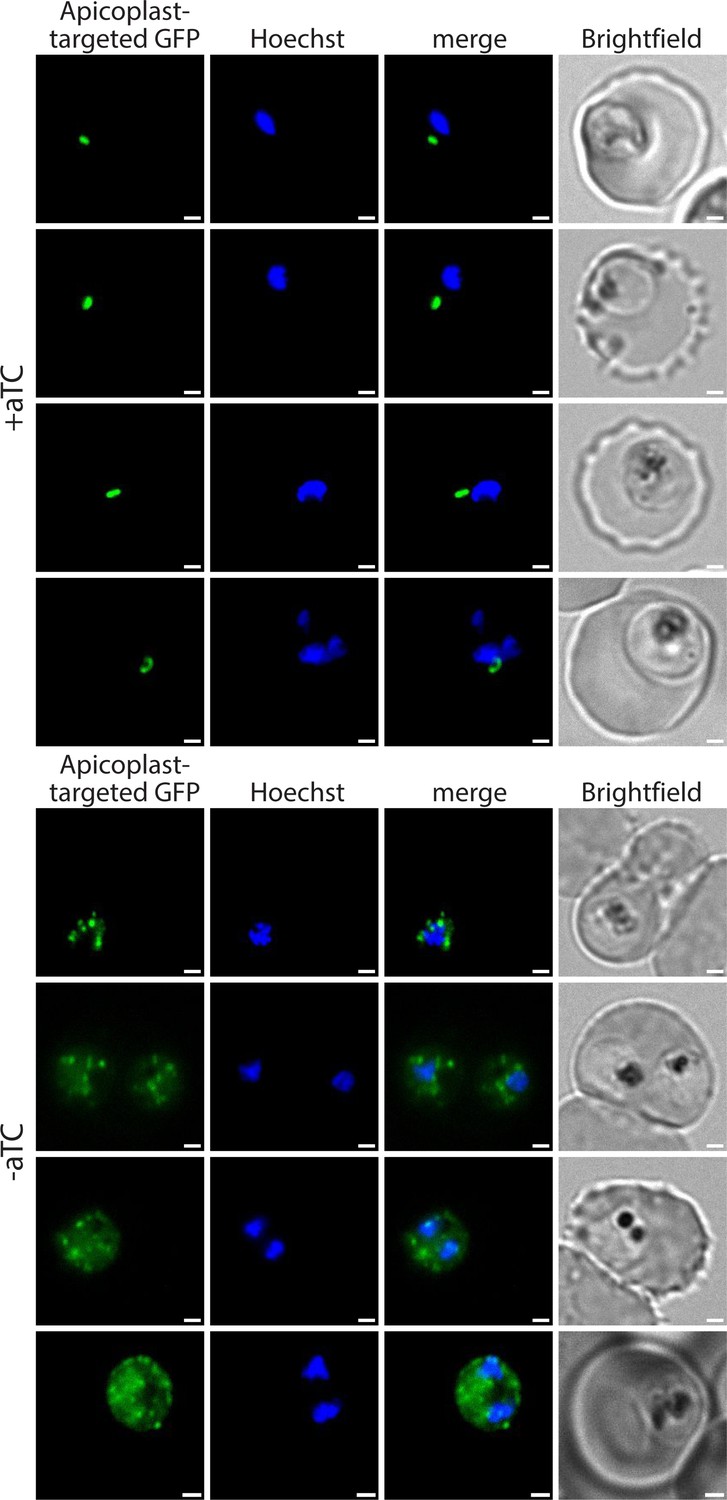
Additional live-parasite fluorescence microscopy images of apicoplast morphology after PfHO knockdown.
PfHO-aptamer/TetR-DOZI parasites episomally expressing apicoplast-localized GFP were grown 5 d±aTC with 200 µM IPP and stained with 10 nM Hoechst.
Figure 4 with 4 supplements
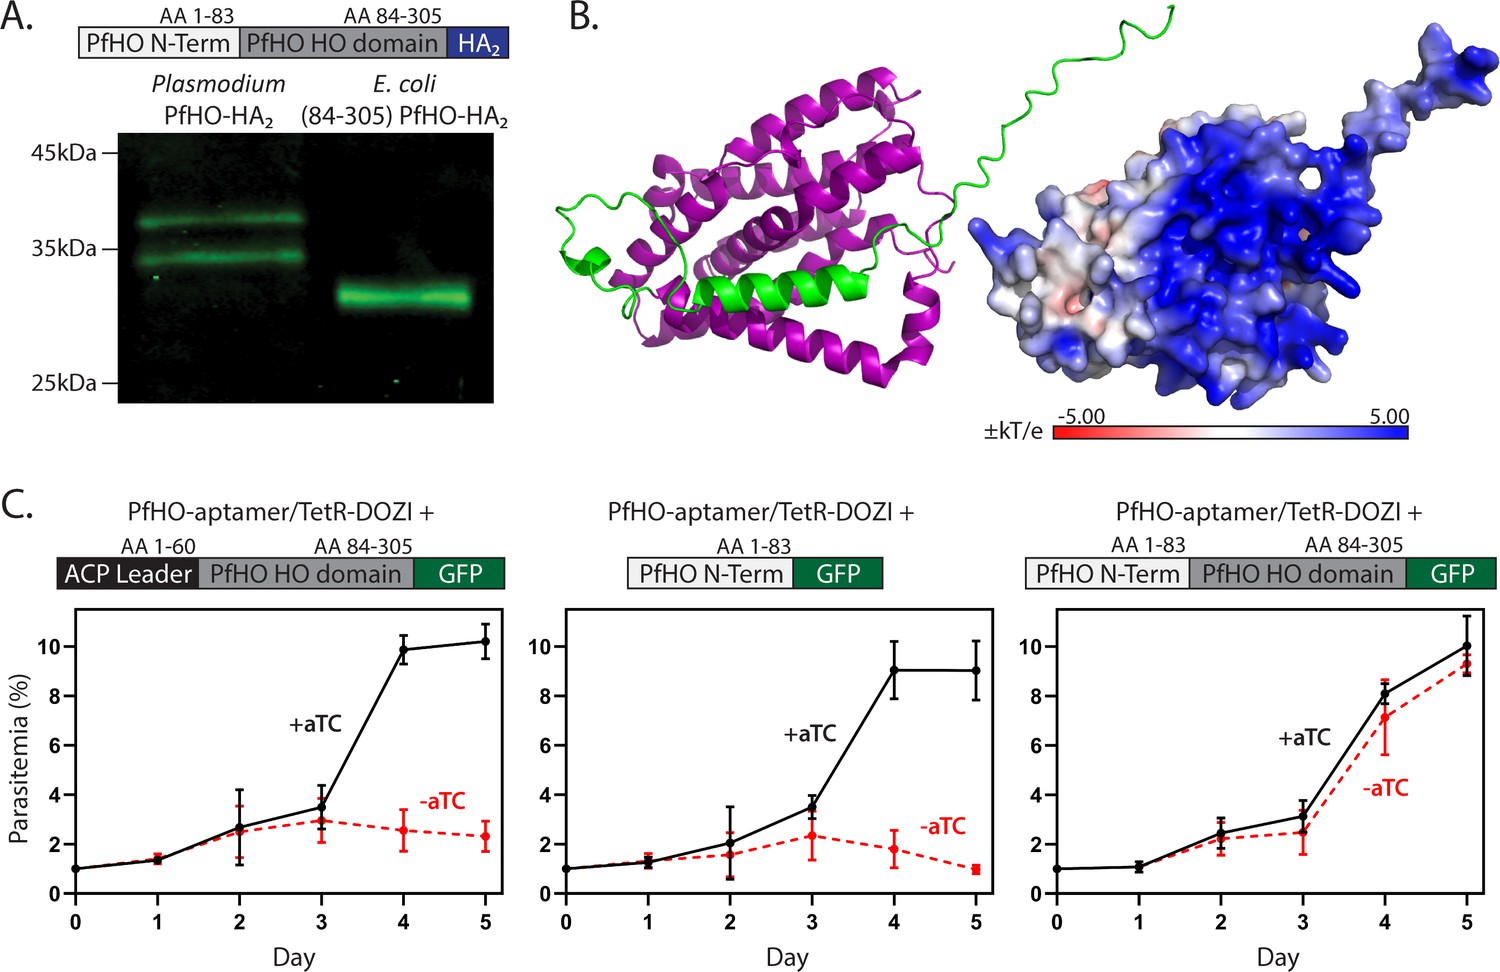
Processing and essentiality of the PfHO N-terminus.
(A) Western blot of lysates from Dd2 parasites endogenously expressing PfHO-HA2 and from E. coli recombinantly expressing PfHO84-305-HA2. (B) AlphaFold structure and electrostatic surface charge predicted for PfHO33-305 corresponding to mature PfHO after apicoplast import. (C) Synchronized growth assays of PfHO knockdown Dd2 parasites complemented by episomal expression of the indicated PfHO constructs in ±1 µM aTC. Growth assay data points are the average ± SD of biological triplicates.
-
Figure 4—source data 1
Uncropped and labeled western blot image of Figure 4A.
- https://cdn.elifesciences.org/articles/100256/elife-100256-fig4-data1-v1.zip
-
Figure 4—source data 2
Original and unlabeled western blot image of Figure 4A.
- https://cdn.elifesciences.org/articles/100256/elife-100256-fig4-data2-v1.zip
Figure 4—figure supplement 1
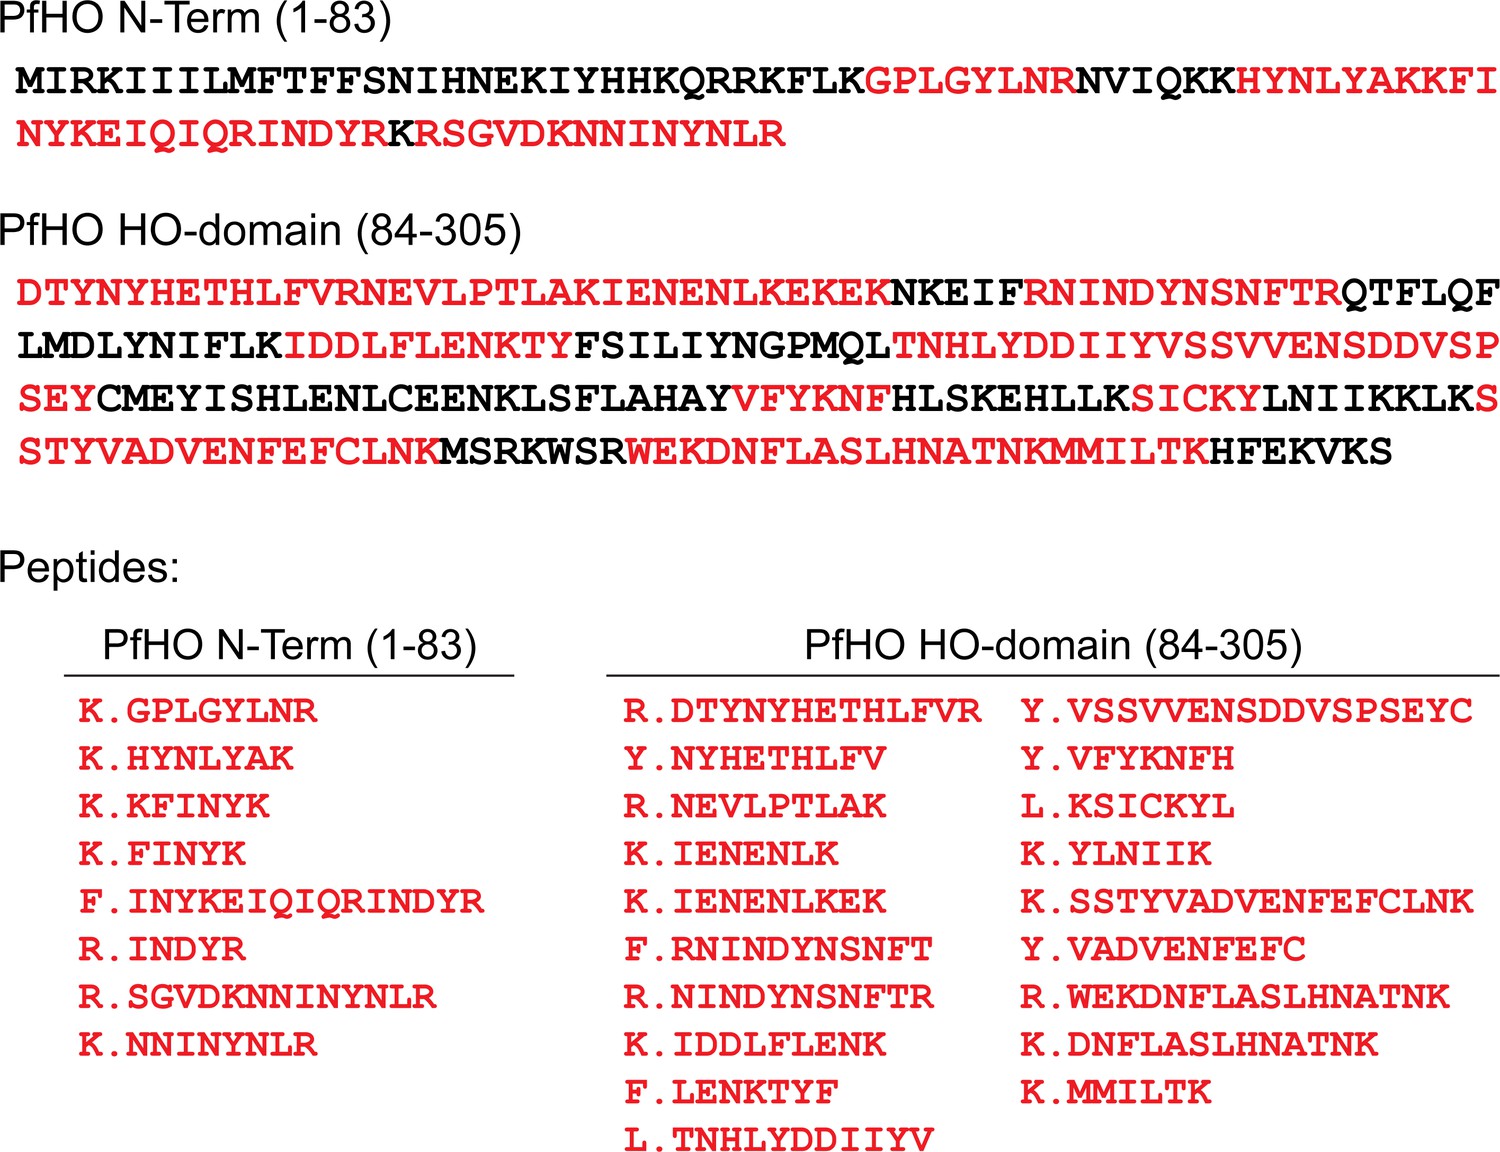
Peptide coverage of PfHO sequence detected by mass spectrometry.
(A) Red residues correspond to sequence detected by tryptic digest and tandem mass spectrometry after PfHO isolation from parasites. (B) List of individual peptides detected within PfHO N-term and HO-domains.
-
Figure 4—figure supplement 1—source data 1
- https://cdn.elifesciences.org/articles/100256/elife-100256-fig4-figsupp1-data1-v1.docx
Figure 4—figure supplement 2
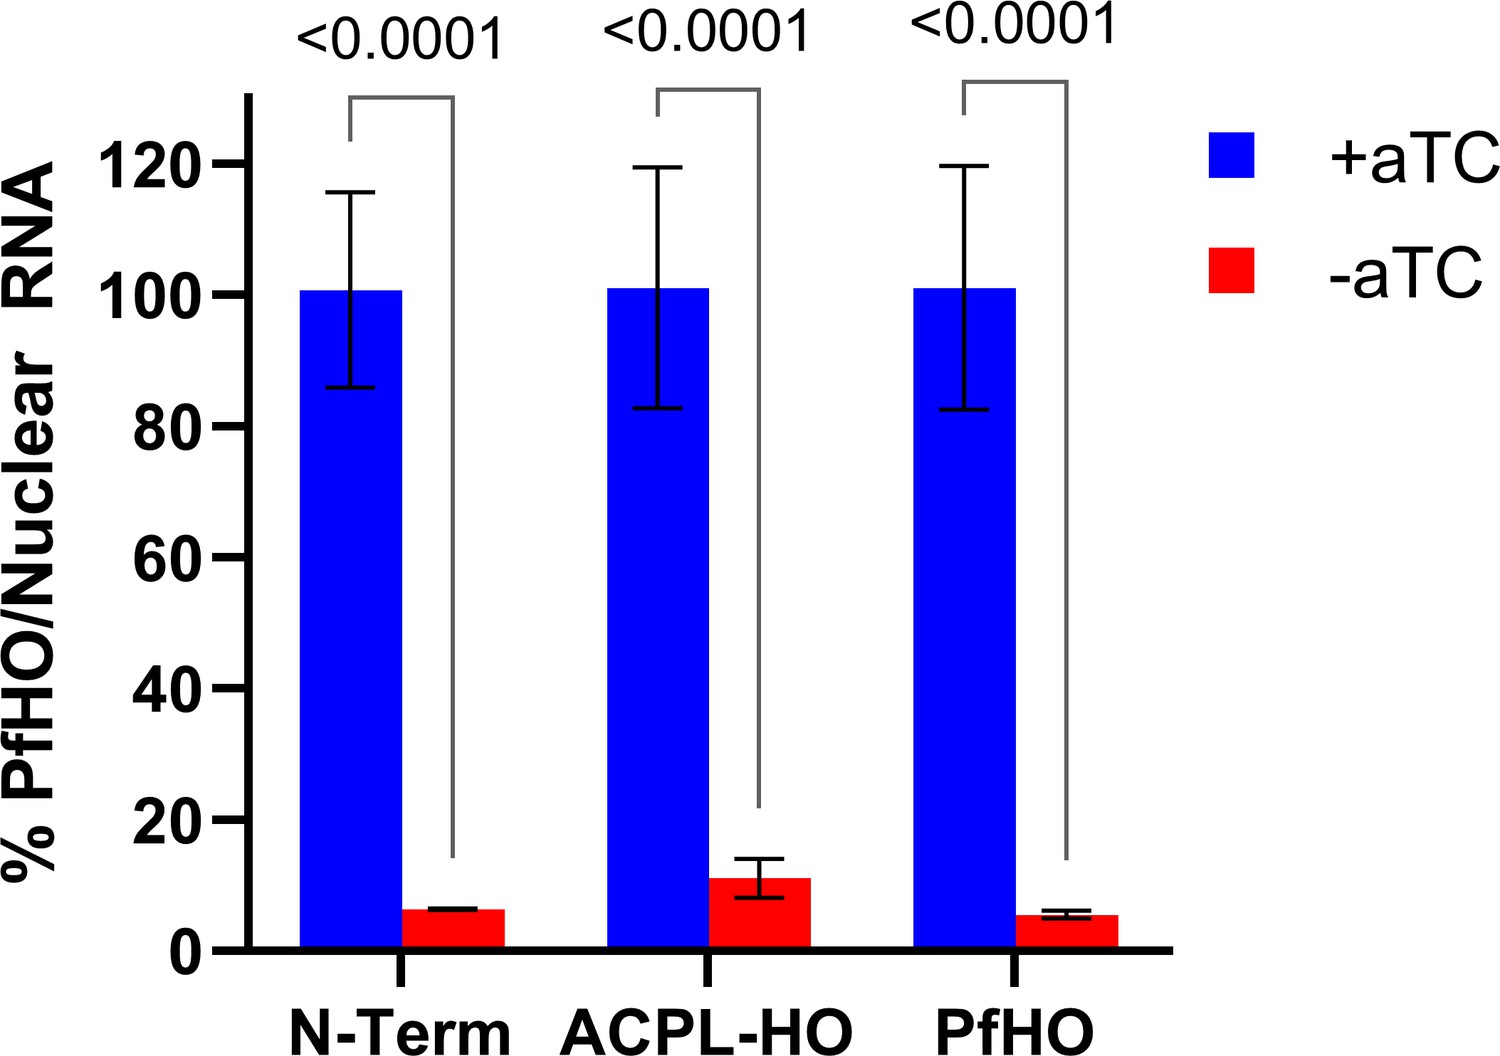
qPCR analysis of PfHO knockdown in PfHO-aptamer/TetR-DOZI parasites complemented with indicated episomes.
Transcript levels of endogenous PfHO from PfHO-Aptamer/TetR-DOZI+episomal complement parasites grown in ±aTC with 200 µM IPP for 5 d. PfHO transcript abundance was normalized to the average abundance of nuclear-encoded I5P (Pf3D7_0802500), ADSL (Pf3D7_0206700), and STL (Pf3D7_0717700) transcripts, and +aTC was normalized to 100%. Normalized ratios and error bars are the average ± SD of biological triplicates.
Figure 4—figure supplement 3

Western blot of PfHO-aptamer/TetR-DOZI parasites complemented with episomes expressing PfHO-GFP, ACPL-HO-GFP, or PfHO N-Term-GFP.
Membrane was stained with goat anti-GFP primary and anti-goat-HRP secondary antibodies and visualized by chemiluminescence. PfHO-GFP parasites were grown in ±aTC with 200 µM IPP for 5 d prior to lysis.
-
Figure 4—figure supplement 3—source data 1
Uncropped and labeled western blot image of Figure 4—figure supplement 3.
- https://cdn.elifesciences.org/articles/100256/elife-100256-fig4-figsupp3-data1-v1.zip
-
Figure 4—figure supplement 3—source data 2
Original and unlabeled western blot image of Figure 4—figure supplement 3.
- https://cdn.elifesciences.org/articles/100256/elife-100256-fig4-figsupp3-data2-v1.zip
Figure 4—figure supplement 4
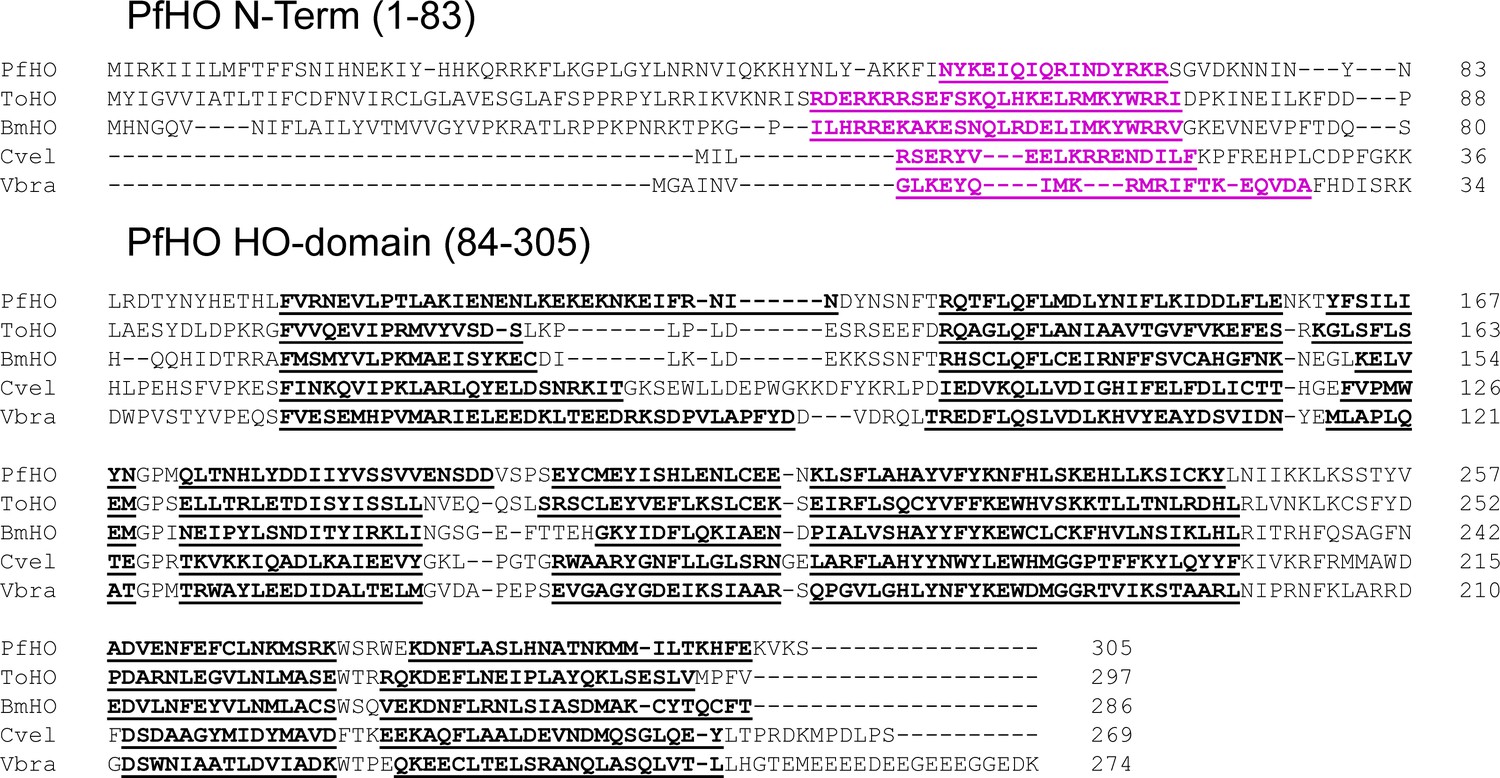
Sequence alignment of alveolate HO-like proteins in Plasmodium falciparum, Theileria orientalis, Babesia microti, Chromera velia, and Vitrella brassicaformis.
Secondary α-helical structure, predicted by AlphaFold structural models, is underlined. Alveolate-specific N-terminal α-helix is underlined in pink.
Figure 5 with 8 supplements
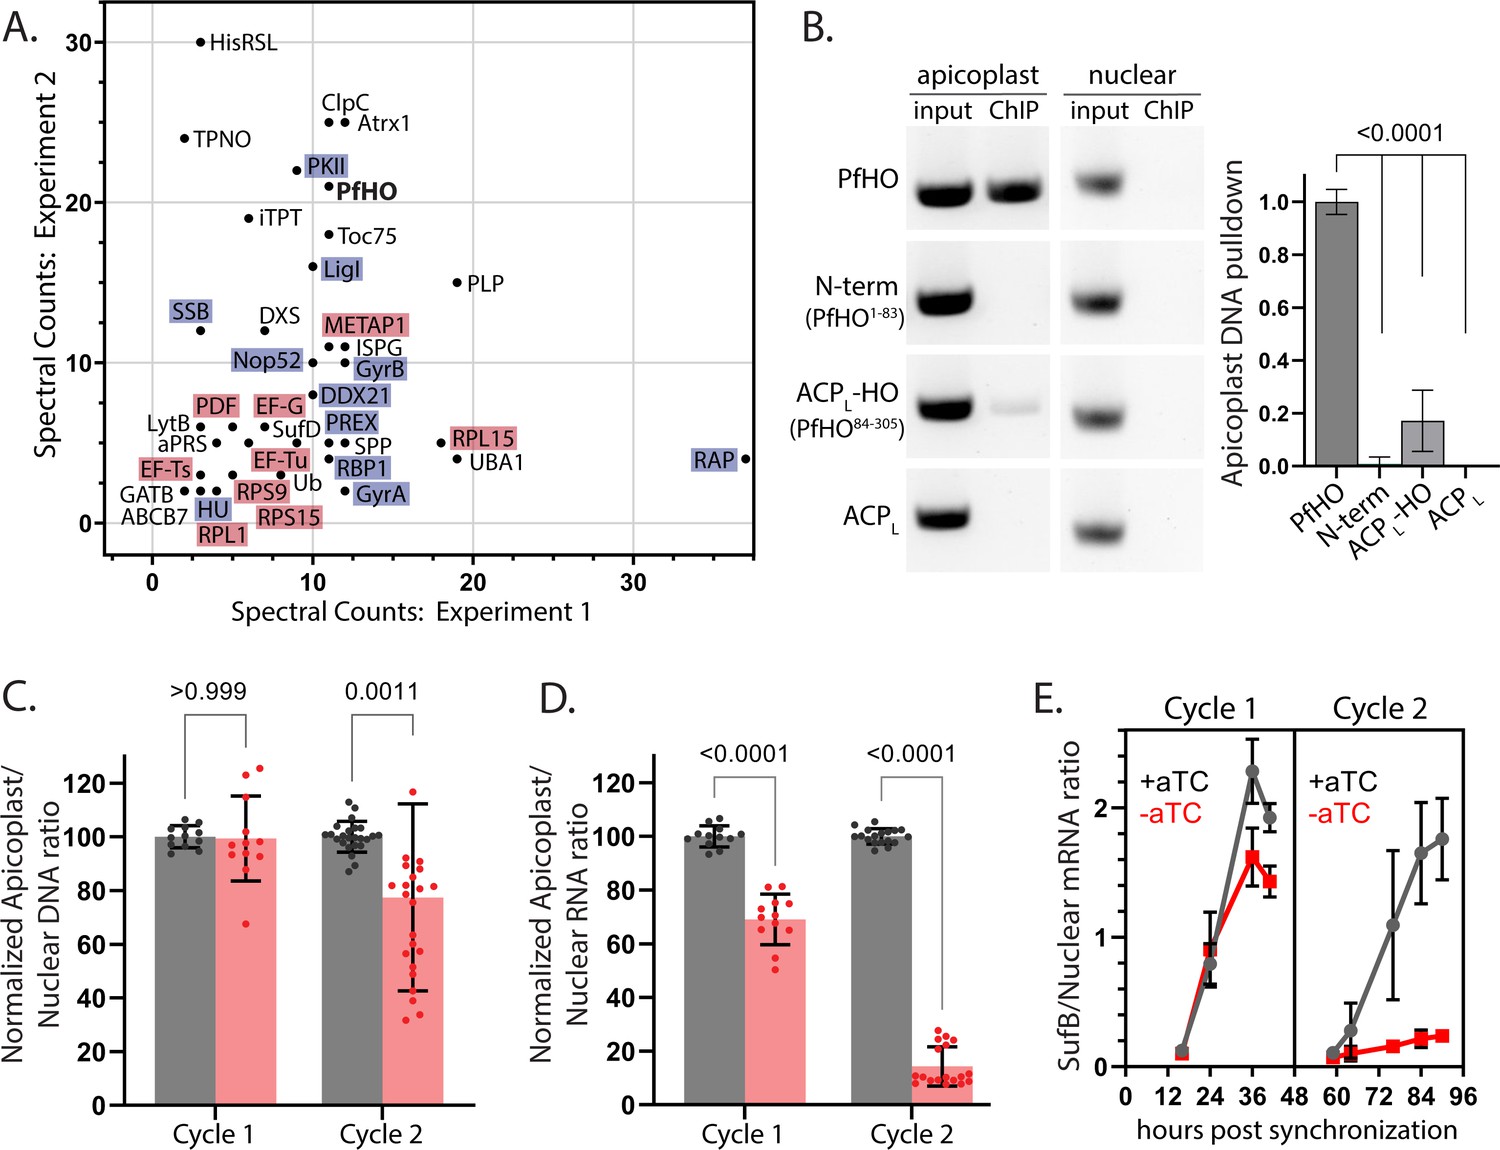
PfHO interactions with proteins and DNA and impacts of its knockdown on apicoplast DNA and RNA levels.
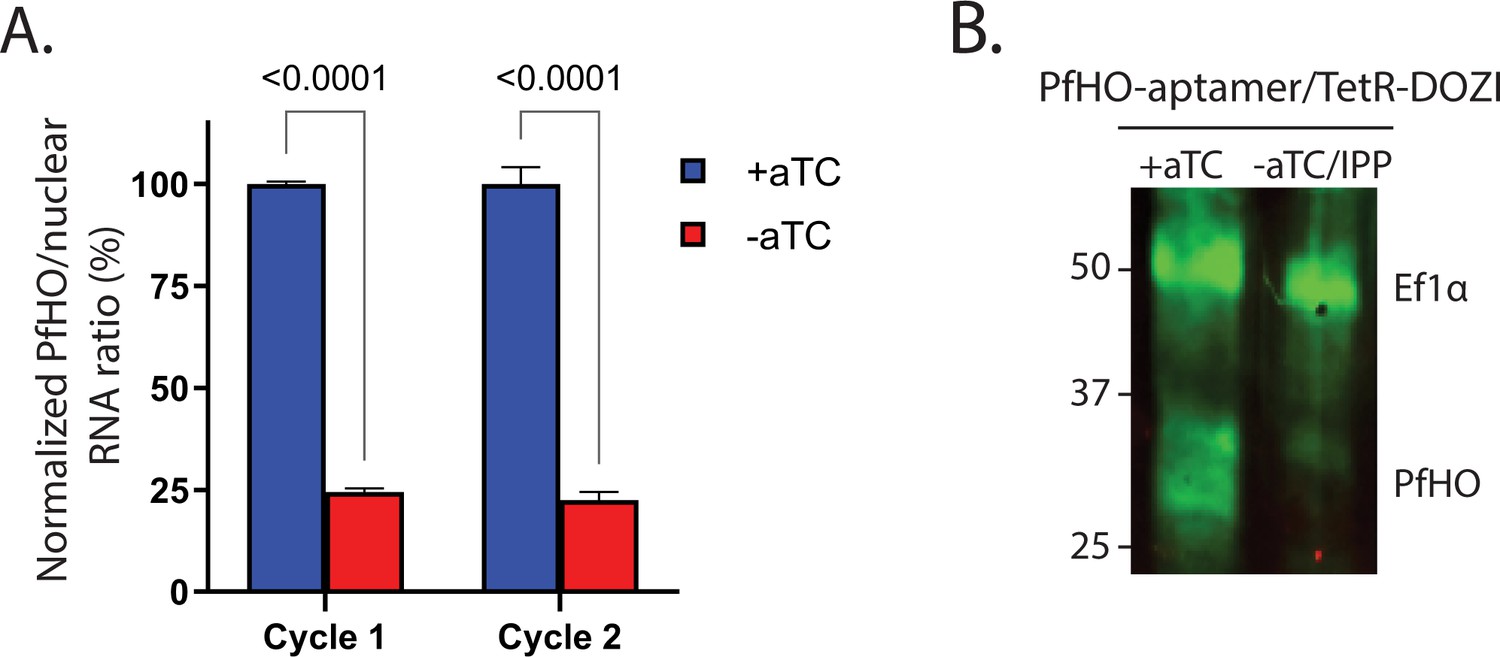
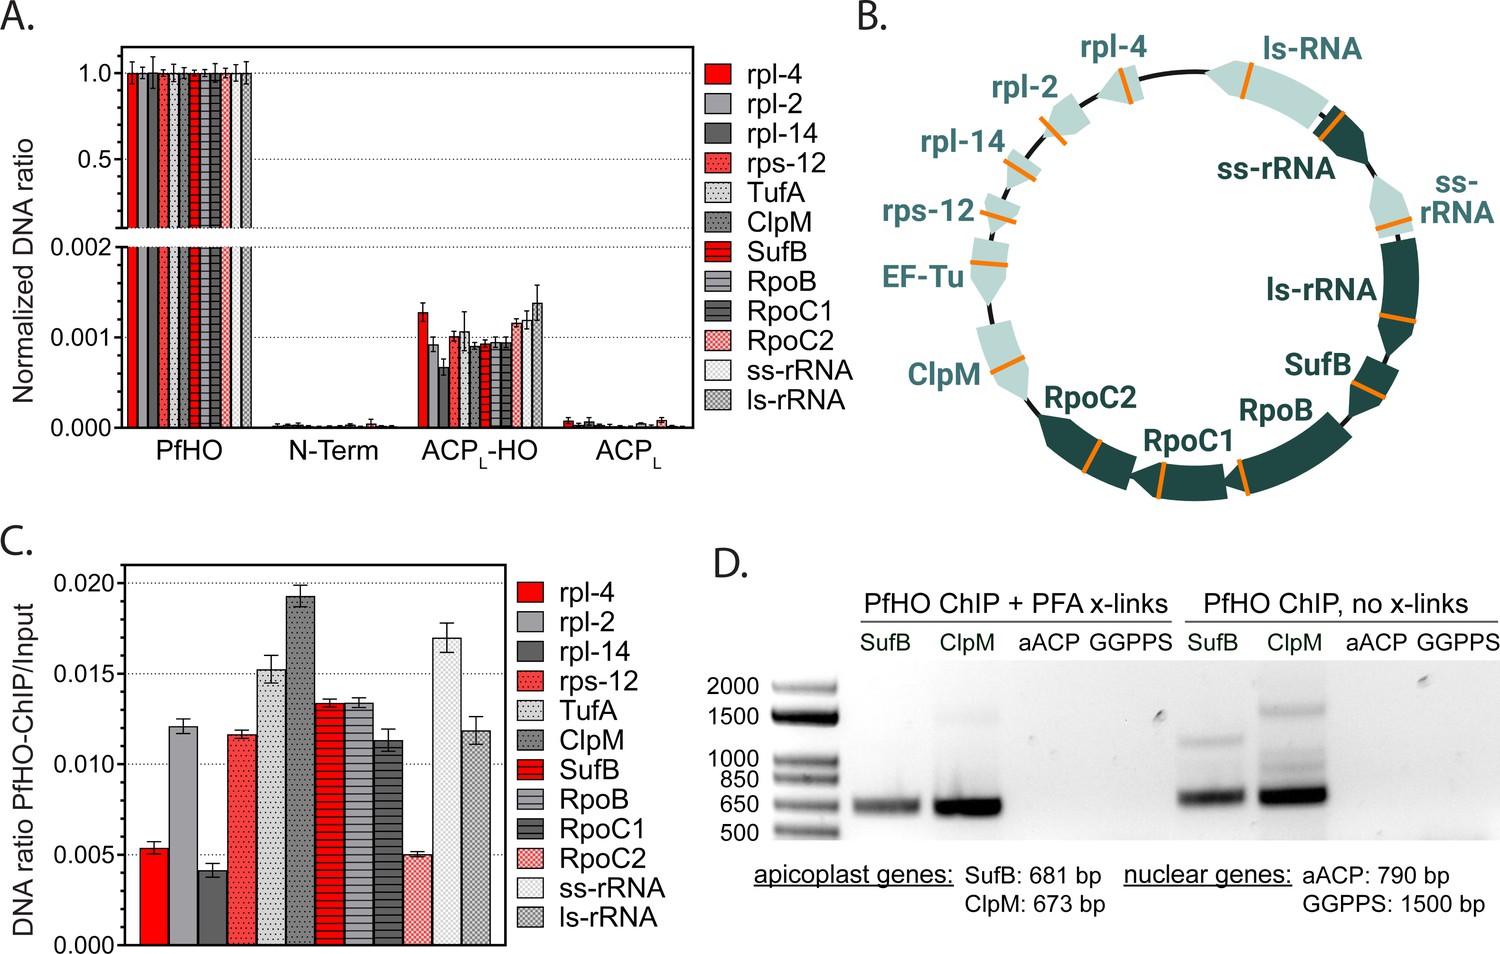
(A) Spectral counts of functionally annotated, apicoplast-targeted proteins detected in two independent anti-HA IP/MS experiments on endogenously tagged PfHO-HA2. The names of proteins in DNA/RNA metabolism are highlighted blue and proteins in translation are highlighted in red. A list of all detected proteins can be found in Figure 5—source data 1. (B) Representative image showing PCR amplification of nuclear-encoded (apicoplast ACP: Pf3D7_0208500) and apicoplast-encoded (SufB: Pf3D7_API04700) genes from DNA co-purified with full-length PfHO-GFP, PfHO1-83-GFP, ACPL-PfHO84-305-GFP, or ACPL-GFP by αGFP ChIP. ‘Input’ is total parasite DNA collected after parasite lysis and sonication, and “ChIP” is DNA eluted after αGFP IP. Densitometry quantification of three biological replicates is plotted on right. Statistical significance of differences between PfHO and each other construct was calculated by Student’s t-tests. (C) Quantitative PCR analysis of DNA isolated from tightly synchronized PfHO-aptamer/TetR-DOZI parasites grown ±1 µM aTC with 200 µM IPP and harvested at 36 and 84 hr in biological triplicates, with normalization of Ct values averaged from three apicoplast genes (SufB, TufA, ClpM) to Ct values averaged from three nuclear (STL, I5P, ADSL) genes. Grey bars represent +aTC and red bars represent –aTC, and observed ratios are displayed as percentages. (D) Quantitative RT-PCR on RNA isolated from the same parasites as in panel C to determine the normalized ratio of apicoplast transcripts (SufB, TufA, ClpM) relative to nuclear (STL, I5P, ADSL) transcripts. Significance of ±aTC differences for C and D were analyzed by Student’s t-test. (E) Representative time-course showing Ct values of SufB normalized to three nuclear (STL, I5P, ADSL) genes at indicated time in PfHO-aptamer/TetR-DOZI parasites grown ±1 µM aTC with 200 µM IPP. Data points are the average ± SD of biological triplicates.
-
Figure 5—source data 1
Table of proteins identified in PfHO IP/MS experiments.
- https://cdn.elifesciences.org/articles/100256/elife-100256-fig5-data1-v1.xlsx
-
Figure 5—source data 2
Uncropped and labeled PCR gel images of Figure 5B, Figure 5—figure supplement 5.
- https://cdn.elifesciences.org/articles/100256/elife-100256-fig5-data2-v1.zip
-
Figure 5—source data 3
Original and unlabeled PCR gel images of Figure 5B, Figure 5—figure supplement 5.
- https://cdn.elifesciences.org/articles/100256/elife-100256-fig5-data3-v1.zip
Figure 5—figure supplement 1
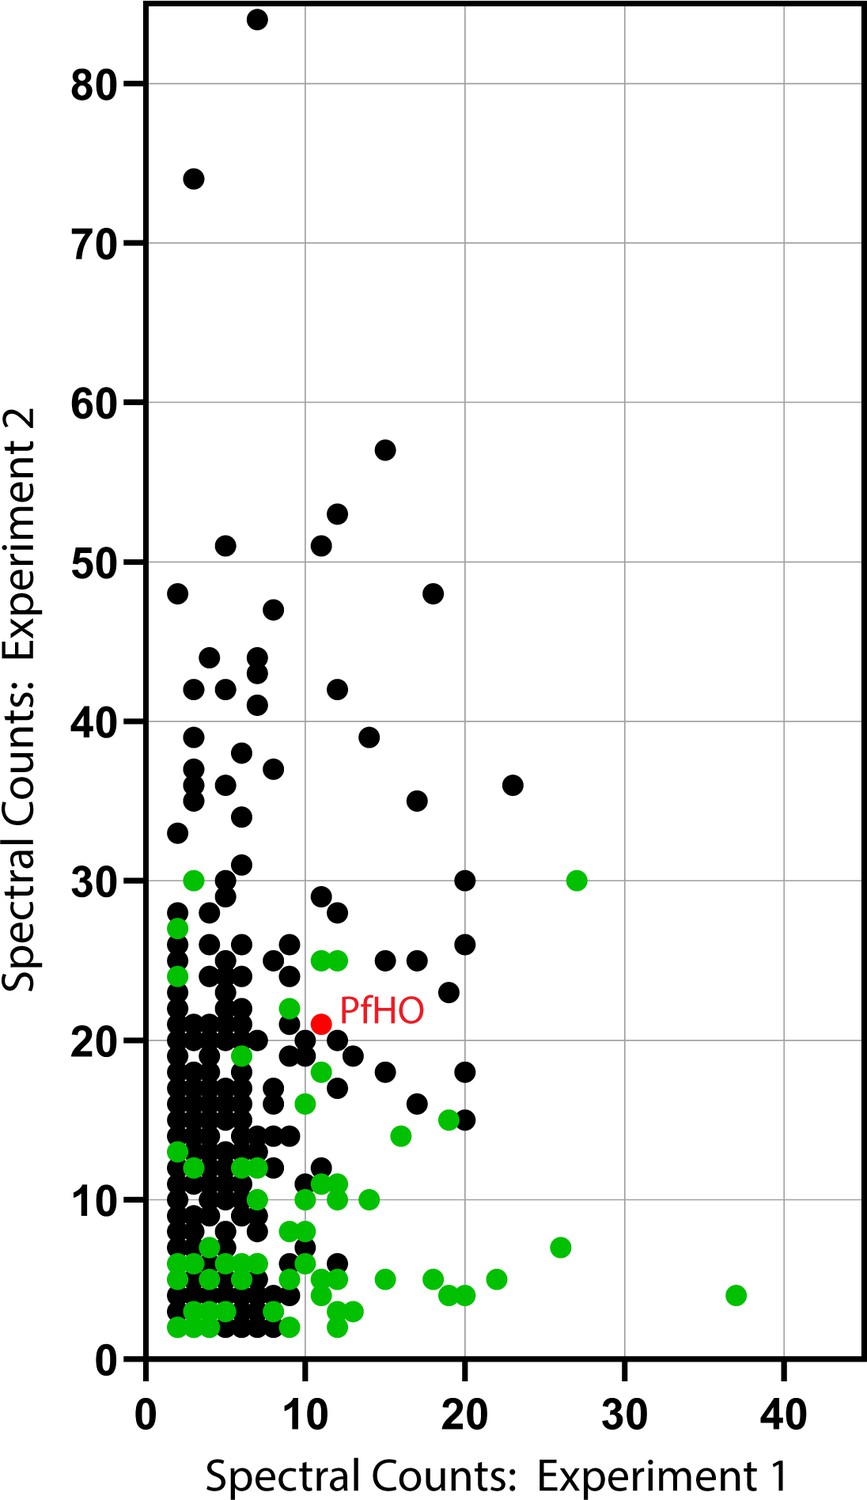
Spectral counts for proteins that co-purified with PfHO and not with either mitochondrial control in both IP/MS experiments.
PfHO is marked in red, and proteins predicted to be apicoplast localized based on prior IP/MS studies are marked in green. The full list of proteins is provided in Figure 5—source data 1.
Figure 5—figure supplement 2
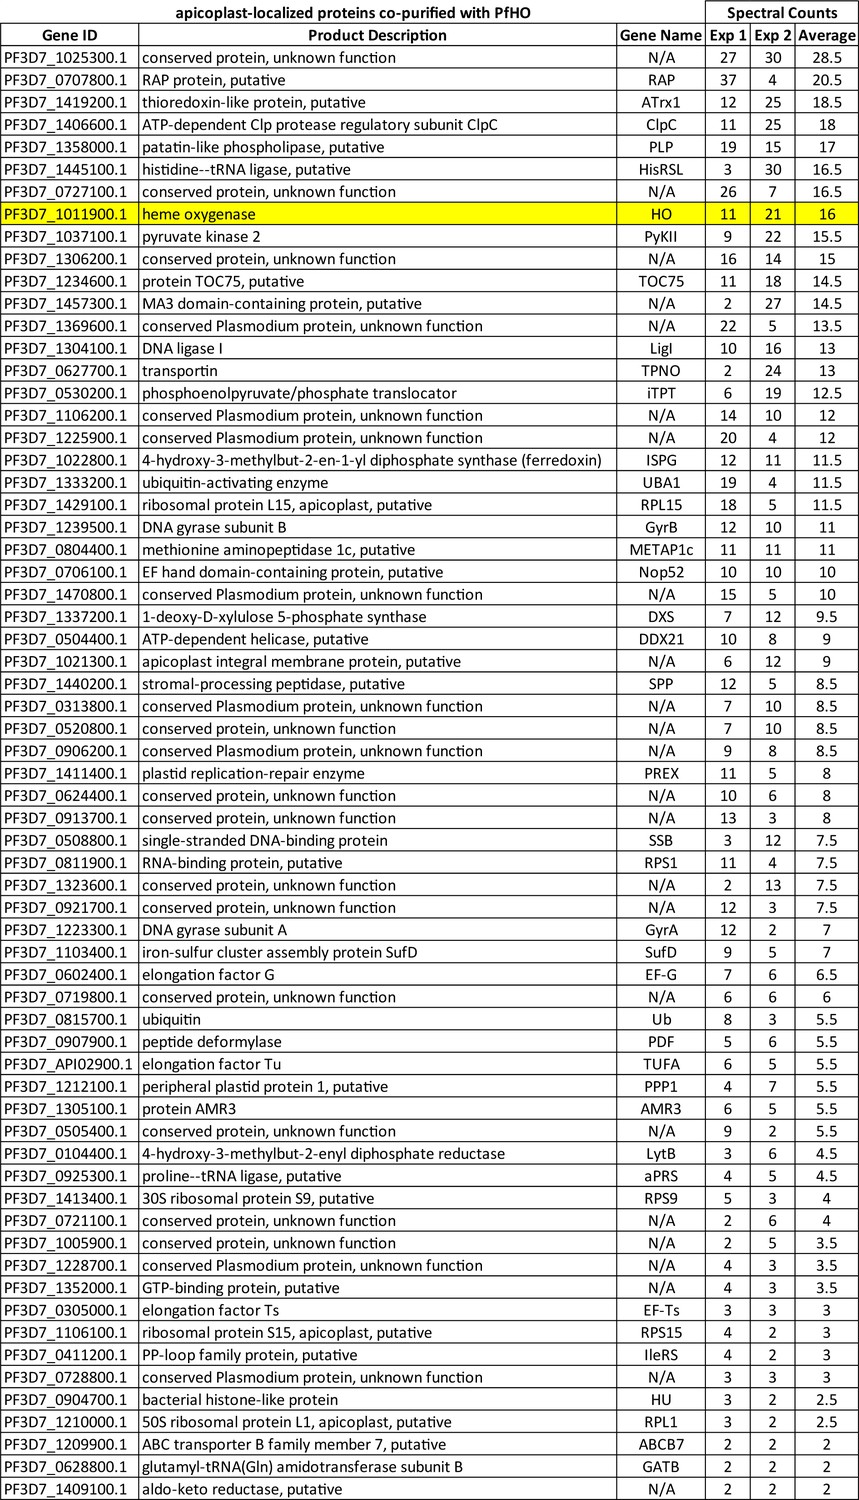
List of apicoplast-localized proteins co-purified with PfHO in two IP/MS experiments ordered by average of spectral counts for each experiment.
-
Figure 5—figure supplement 2—source data 1
- https://cdn.elifesciences.org/articles/100256/elife-100256-fig5-figsupp2-data1-v1.xlsx
Figure 5—figure supplement 3
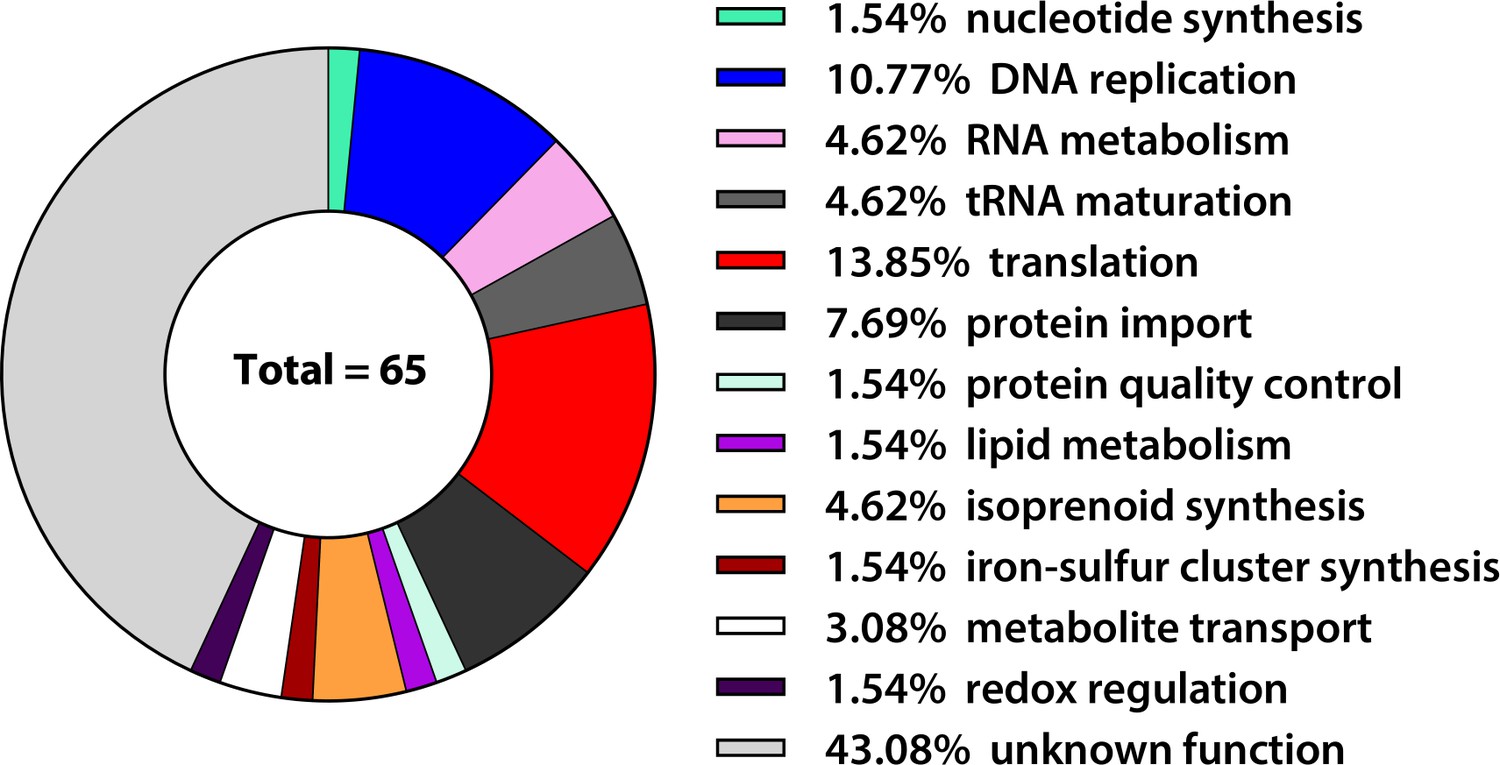
Functional pathway predictions for the 65 apicoplast-localized proteins that co-purified with PfHO in two IP/MS experiments.
Figure 5—figure supplement 4
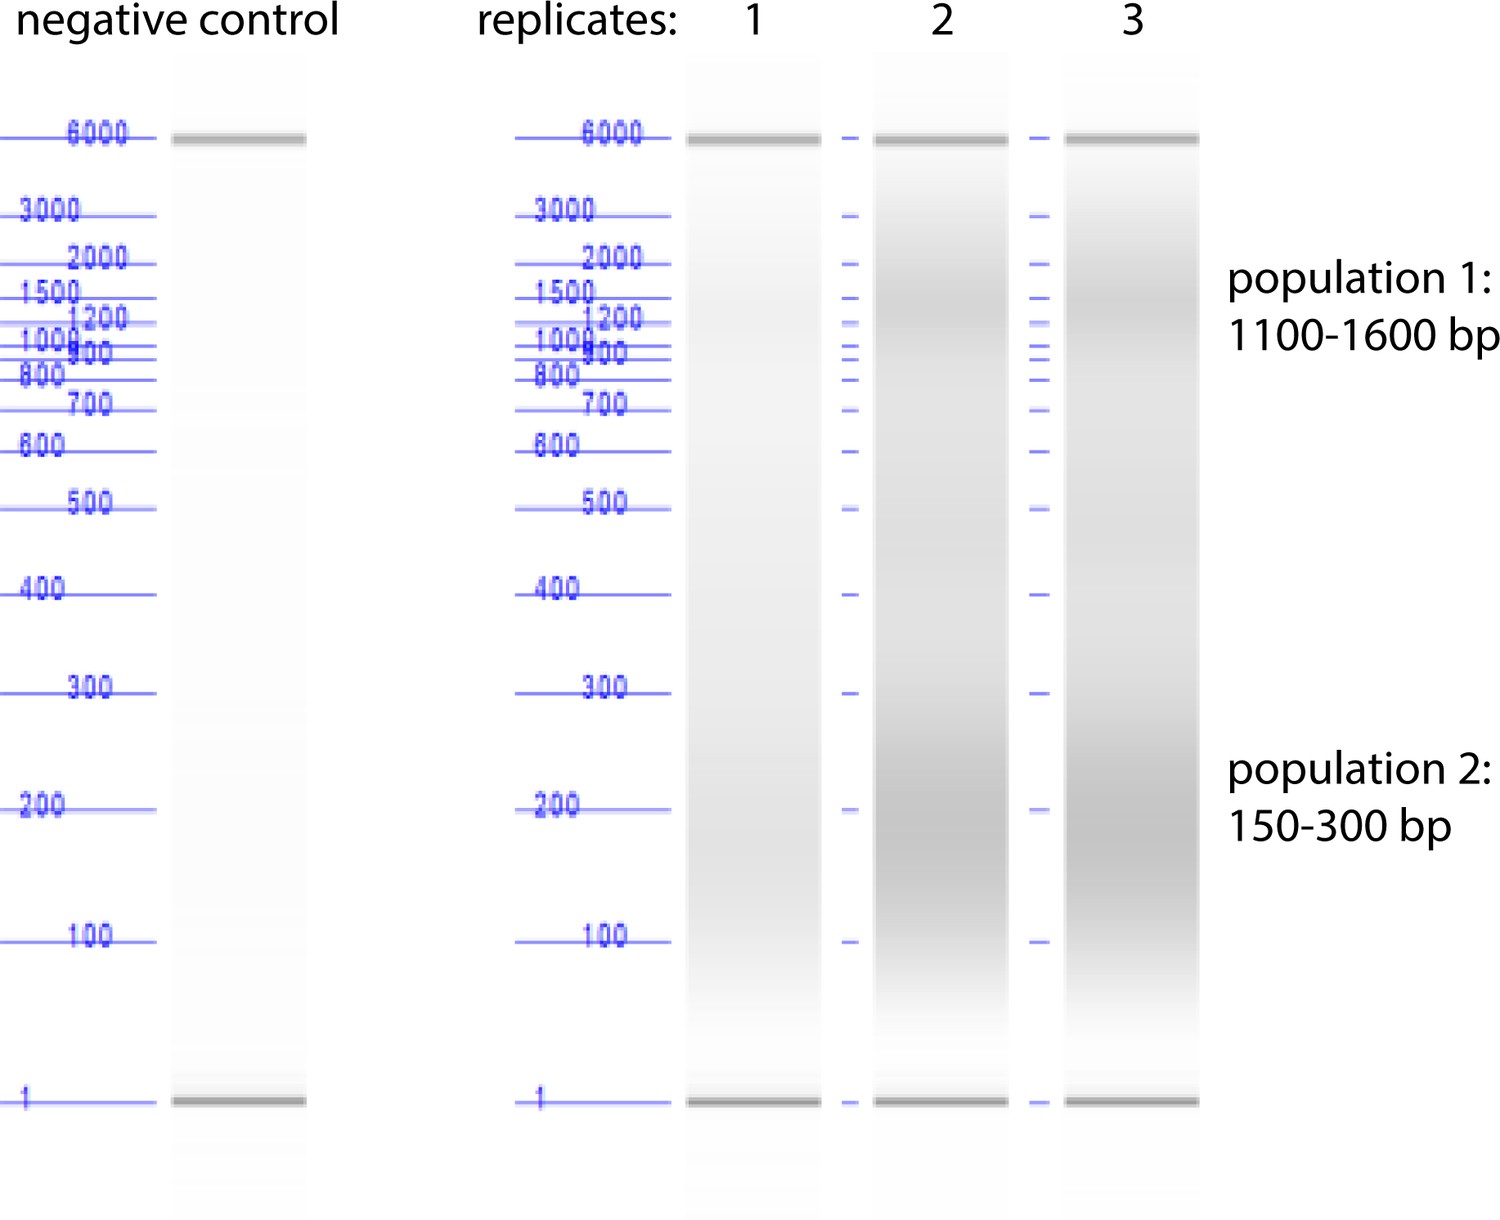
Quantification of parasite DNA fragment size by Agilent Bioanalyzer DNA analysis after pulse-sonication shearing of parasite lysates.
Our DNA shearing method produced two populations of DNA fragment sizes, 1100–1600 bp and 150–300 bp.
Figure 5—figure supplement 5

Steady-state PCR amplification of additional nuclear (mACP: Pf3D7_1208300) and apicoplast (ClpM: Pf3D7_API03600) genes from DNA co-purified with indicated PfHO constructs.
Figure 5—figure supplement 6
Additional ChIP experiments in parasites with GFP-tagged PfHO constructs.
(A) Relative abundance of apicoplast-encoded genes in DNA co-purified with the indicated GFP-tagged PfHO constructs by ChIP normalized to PfHO-GFP. (B) Distribution and orientation of target genes on 35 kb apicoplast genome. Orange lines mark the location of the ~100 bp qPCR amplicon for each gene. (C) Relative abundance of apicoplast-encoded genes in DNA co-purified with PfHO-GFP by ChIP normalized to input. (D) Steady-state PCR amplification of nuclear-encoded (aACP: Pf3D7_0208500, GGPPS: Pf3D7_1128400) and apicoplast-encoded (SufB: Pf3D7_API04700, ClpM: Pf3D7_API03600) genes from DNA co-purified with full-length PfHO-GFP by ChIP ±PFA crosslinking.
-
Figure 5—figure supplement 6—source data 1
Uncropped and labeled PCR gel image of Figure 5—figure supplement 6D.
- https://cdn.elifesciences.org/articles/100256/elife-100256-fig5-figsupp6-data1-v1.zip
-
Figure 5—figure supplement 6—source data 2
Original and unlabeled PCR gel image of Figure 5—figure supplement 6D.
- https://cdn.elifesciences.org/articles/100256/elife-100256-fig5-figsupp6-data2-v1.zip
Figure 5—figure supplement 7

RT-qPCR data for additional apicoplast genes.
Transcript levels of apicoplast, nuclear, and mitochondrial genes were assessed in PfHO-Aptamer/TetR-DOZI parasites grown in ±aTC with 200 µM IPP for 3 d (84 hr post-synchronization). Each transcript is normalized to average of two nuclear transcripts – I5P (Pf3D7_0802500) and ADSL (Pf3D7_0206700). As an additional control, mitochondrial-encoded CytB (Pf3D7_MIT02300) transcript abundance is also measured relative to nuclear controls. Error bars represent average ± SD of independent biological triplicates.
Figure 5—figure supplement 8

Representative time-course showing ClpM: nuclear transcript levels at indicated times during first and second cycle of parasite growth ±aTC in the presence of IPP.
Large error bars between independent replicate experiments are due to large variance in total ClpM expression. Within each experiment, ClpM transcripts are > tenfold less abundant in -aTC parasites at cycle 2 time-points 72, 84, and 90 hr. Error bars represent average ± SD of independent biological triplicates.
Figure 6
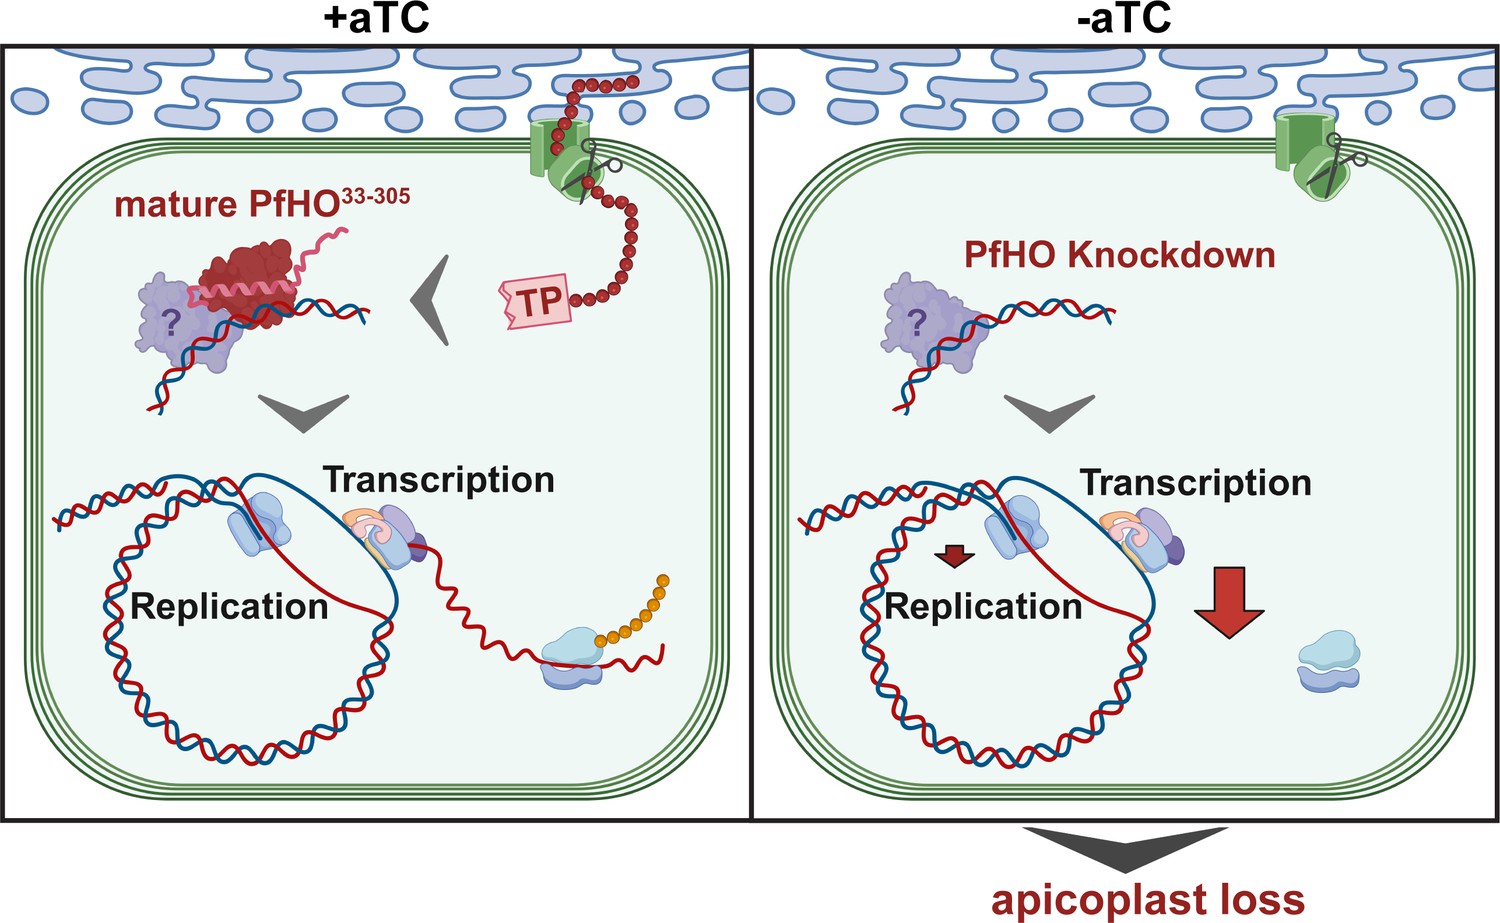
Model for essential PfHO function in apicoplast genome expression and organelle biogenesis.
TP = transit peptide. Scissors represent proteolytic processing of the PfHO N-terminal TP upon apicoplast import.
Tables
Key resources table
| Reagent type (species) or resource | Designation | Source or reference | Identifiers | Additional information |
|---|---|---|---|---|
| Cell line (Plasmodium falciparum) | Dd2 | PMID:1970614 | ||
| Cell line (Plasmodium falciparum) | Dd2 +PfHO(1-305)-GFP/TEOE | this paper | PfHO-GFP | randomly integrated with pHTH (PMID:16260745), Can be obtained from Sigala lab |
| Cell line (Plasmodium falciparum) | Dd2 +PfHO(1-83)-GFP/TEOE | this paper | N-term-GFP | randomly integrated with pHTH (PMID:16260745), Can be obtained from Sigala lab |
| Cell line (Plasmodium falciparum) | 3D7 - PfHO-DHFRDD-GFP | this paper | Can be obtained from Sigala lab | |
| Cell line (Plasmodium falciparum) | Dd2 - PfHO-GlmS-HA2 | this paper | Can be obtained from Sigala lab | |
| Cell line (Plasmodium falciparum) | Dd2 - PfHO-aptamer/TetR-DOZI | this paper | PfHO-Aptamer/TetR-DOZI | Can be obtained from Sigala lab |
| Cell line (Plasmodium falciparum) | Dd2 - PfHO-aptamer/TetR-DOZI+PfHO(1-83)-GFP/TEOE | this paper | PfHO-Apt +N-term-GFP | Can be obtained from Sigala lab |
| Cell line (Plasmodium falciparum) | Dd2 - PfHO-aptamer/TetR-DOZI+PfHO(84-305)-GFP/TEOE | this paper | PfHO-Apt +ACPL-HO-GFP | Can be obtained from Sigala lab |
| Cell line (Plasmodium falciparum) | Dd2 - PfHO-aptamer/TetR-DOZI+PfHO(1-305)-GFP/TEOE | this paper | PfHO-Apt +PfHO-GFP | Can be obtained from Sigala lab |
| Strain, strain background (Escherichia coli) | BL21(DE3) +PfHO(Δ2–83)-His6/pET21d | PMID:22992734 | ||
| Strain, strain background (Escherichia coli) | BL21(DE3) + His6-PfHO(Δ2–83)/pET28a | PMID:22992734 | ||
| Strain, strain background (Escherichia coli) | BL21(DE3) +PfHO(Δ2–83) HA2/pET28a | this paper | Can be obtained from Sigala lab | |
| Chemical compound, drug | ampicillin | Sigma-Aldrich | Cat. No. A9518 | 50 µg/mL |
| Chemical compound, drug | isopropyl β-D-1-thiogalactopyranoside | Sigma-Aldrich | Cat. No. 16758 | 0.5 mM |
| Chemical compound, drug | Ni_NTA agarose column | Qiagen | Cat. No. 30210 | |
| Chemical compound, drug | RPMI-1640 | Thermo Fisher | Cat. No. 23400021 | |
| Chemical compound, drug | Albumax I Lipid-Rich BSA | Thermo Fisher | Cat. No. 11020039 | 2.5 g/L |
| Chemical compound, drug | anhyrdrotetracycline | Cayman Chemicals | Cat. No. 10009542 | 1 µM |
| Chemical compound, drug | doxycycline | Sigma-Aldrich | Cat. No. D3447 | 1 µM |
| Chemical compound, drug | isopentenyl pyrophosphate | Isoprenoids | Cat. No. IPP001 | 200 µM |
| Chemical compound, drug | D-sorbitol | Sigma-Aldrich | Cat. No. S7900 | 5% w/v |
| Commercial assay or kit | MACS LD Columns | Miltenyi Biotec | Cat. No. 130-042-901 | |
| Commercial assay or kit | NEBuilder HIFI DNA Assembly Mix | New England Biolabs | Cat. No. E2621 | |
| Chemical compound, drug | WR99210 | Jacobus Pharmaceutical Co | 5 nM | |
| Chemical compound, drug | Blasticidin S | Sigma-Aldrich | Cat. No. 15205 | 6 µM |
| Chemical compound, drug | DSM1 | Sigma-Aldrich | Cat. No. 53330401 | 2 µM |
| Chemical compound, drug | acridine orange | Invitrogen | Cat. No. A3568 | 1 µg/mL |
| Chemical compound, drug | Mitotracker Red CMXRos | Invitrogen | Cat. No. M7512 | 25 nM |
| Chemical compound, drug | Hoechst 33342 | Invitrogen | Cat. No. H3570 | 5 µg/mL |
| Chemical compound, drug | Prolong Diamond Antifade Mountant with DAPI | Invitrogen | Cat. No. P36971 | |
| Chemical compound, drug | protease inhibitor tablets | Invitrogen | Cat. No. A32955 | |
| Chemical compound, drug | saponin from quillaja bark | Sigma-Aldrich | Cat. No. S7900 | |
| Commercial assay or kit | protein A dynabeads | Invitrogen | Cat. No. 1001D | |
| Chemical compound, drug | acridine orange | Invitrogen | Cat. No. A3568 | |
| Commercial assay or kit | QIAamp DNA Blood Mini kit | Qiagen | Cat. No. 51106 | |
| Commercial assay or kit | TRIzol reagent | Invitrogen | Cat. No. 15596026 | |
| Commercial assay or kit | Superscript IV VILO RT kit | Invitrogen | Cat. No. 11766050 | |
| Chemical compound, drug | Proteinase K | Invitrogen | Cat. No. 25530049 | |
| Commercial assay or kit | Qiaquick PCR purification kit | Qiagen | Cat. No. 28104 | |
| Chemical compound, drug | salmon sperm DNA | Invitrogen | Cat. No. AM9680 | |
| Commercial assay or kit | Prometheus ProSignal Femto ECL reagent | Genesee Scientific | Cat. No. 20–302 | |
| Antibody | anti-GFP (goat, polyclonal) | Abcam | Cat. No ab5450 | WB (1:1000), IFA (1:200) |
| Antibody | anti-GFP (mouse, monoclonal 3E6) | Invitrogen | Cat. No. A-11120 | IFA (1:200) |
| Antibody | anti-HA (rat, monoclonal 3F10) | Roche | Cat. No 11-867-423-01 | WB (1:1000), IFA (1:200) |
| Antibody | anti-ACP (rabbit, polyclonal) | PMID:19768685 | IFA (1:200) | |
| Antibody | anti-EF1α (rabbit, polyclonal) | PMID:11251817 | WB (1:1000) | |
| Antibody | anti-PfHO (rabbit, polyclonal) | This study | WB (1:500), Can be obtained from Sigala lab | |
| Antibody | anti-goat HRP (rabbit, polyclonal) | Santa Cruz Biotechnology | Cat. No. sc-2768 | WB (1:10,000) |
| Antibody | anti-rabbit HRP (goat, polyclonal) | Invitrogen | Cat. No. A-27036 | WB (1:10,000) |
| Antibody | anti-rabbit IRDye800CW (donkey, polyclonal) | LiCor | Cat. No. 926–32213 | WB (1:10,000) |
| Antibody | anti-rabbit IRDye680 (donkey, polyclonal) | LiCor | Cat. No. 926–68023 | WB (1:10,000) |
| Antibody | anti-goat IRDye800CW (donkey, polyclonal) | LiCor | Cat. No. 926–32214 | WB (1:10,000) |
| Antibody | anti-rat IRDye800CW (goat, polyclonal) | LiCor | Cat. No. 926–32219 | WB (1:10,000) |
| Antibody | anti-mouse AF488 (goat, polyclonal) | Invitrogen | Cat. No. A-11001 | IFA (1:1000) |
| Antibody | anti-rabbit AF647 (goat, polyclonal) | Invitrogen | Cat. No. A-21244 | IFA (1:1000) |
| Antibody | anti-goat AF488 (donkey, polyclonal) | Abcam | Cat. No. ab150129 | IFA (1:1000) |
| Software, algorithm | Prism 9 | GraphPad | RRID:SCR_002798 |
Additional files
-
Supplementary file 1
Table of PCR primers.
- https://cdn.elifesciences.org/articles/100256/elife-100256-supp1-v1.xlsx
-
MDAR checklist
- https://cdn.elifesciences.org/articles/100256/elife-100256-mdarchecklist1-v1.docx
Download links
A two-part list of links to download the article, or parts of the article, in various formats.
Downloads (link to download the article as PDF)
Open citations (links to open the citations from this article in various online reference manager services)
Cite this article (links to download the citations from this article in formats compatible with various reference manager tools)
Malaria parasites require a divergent heme oxygenase for apicoplast gene expression and biogenesis
eLife 13:RP100256.
https://doi.org/10.7554/eLife.100256.3


