Pericytes are progenitors for coronary artery smooth muscle
- Stanford School of Medicine, United States
- Stanford University, United States
- Institute for Stem Cell and Regenerative Medicine, Stanford School of Medicine, Ludwig Center, United States
- Columbia University Medical Center, United States
- Ludwig Center for Cancer Stem Cell Biology and Medicine at Stanford University, United States
Figures
Figure 1 with 1 supplement
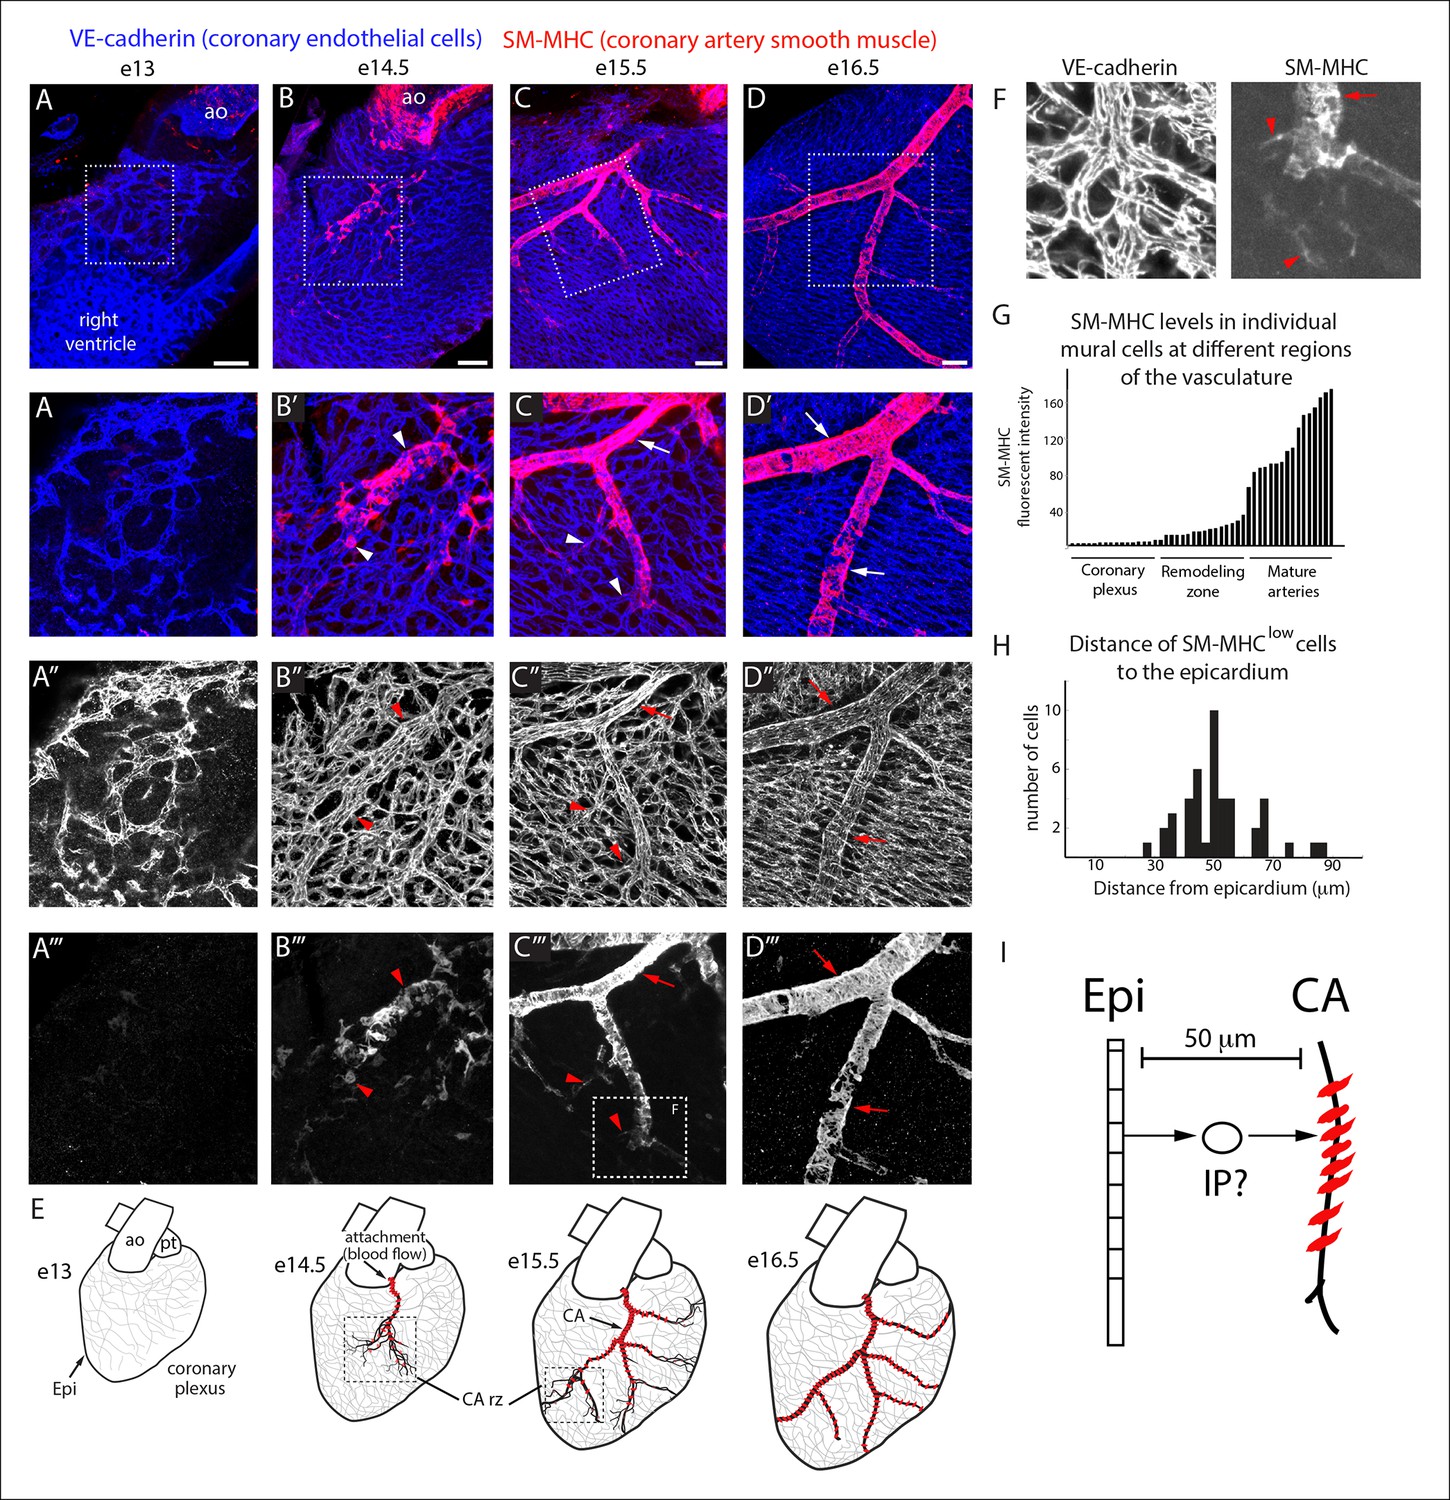
Coronary artery smooth muscle differentiation is initiated early during vascular remodeling.
(A–D) Whole mount confocal images of the developing right coronary artery at embryonic (e) days 13 (A–A’’’), 14.5 (B–B’’’), 15.5 (C–C’’’), and 16.5 (D–D’’’) immunostained with VE-cadherin (blue) and SM-MHC (red). Higher magnification views (z-stack subsets) from boxed regions (A’–D’) and separated channels (A”–D”’) show that smooth muscle first appears at early remodeling zones (arrowheads) and further accumulates as these transform into coronary arteries (arrows). (E) Schematic representation showing coronary artery (CA) smooth muscle cell (red) development coincident with aortic attachment and initiation of blood flow at the coronary artery remodeling zone (CA rz). (F) Boxed region in C”’ highlighting SM-MHClow cells (arrowheads) at the remodeling zone in comparison to the higher expression in cells surrounding a more mature coronary artery (arrow). (G) Histogram plotting SM-MHC expression shows that mural cells of the remodeling zone are SM-MHClow while those around mature arteries are SM-MHChigh (n = 16 cells/region from 4 embryos). (H) Histogram plotting distance of SM-MHClow cells from the epicardium (n = 22 cells from 5 hearts). (I) Proposed model where an intermediate progenitor (IP) bridges epicardial cells (Epi) and coronary artery smooth muscle. Ao, aorta; pt, pulmonary trunk. Scale bars, 100 µm.
Figure 1—figure supplement 1

Morphology of SM-MHClow cells.
(A) SM-MHClow cells (lower intensity green) develop among PDGFRβ+ perivascular cells (red) that coat coronary vessels (blue). (B) Boxed region with SM-MHClow cells (arrowheads) show their cellular morphology. Scale bar, 100 µm.
Figure 2 with 5 supplements
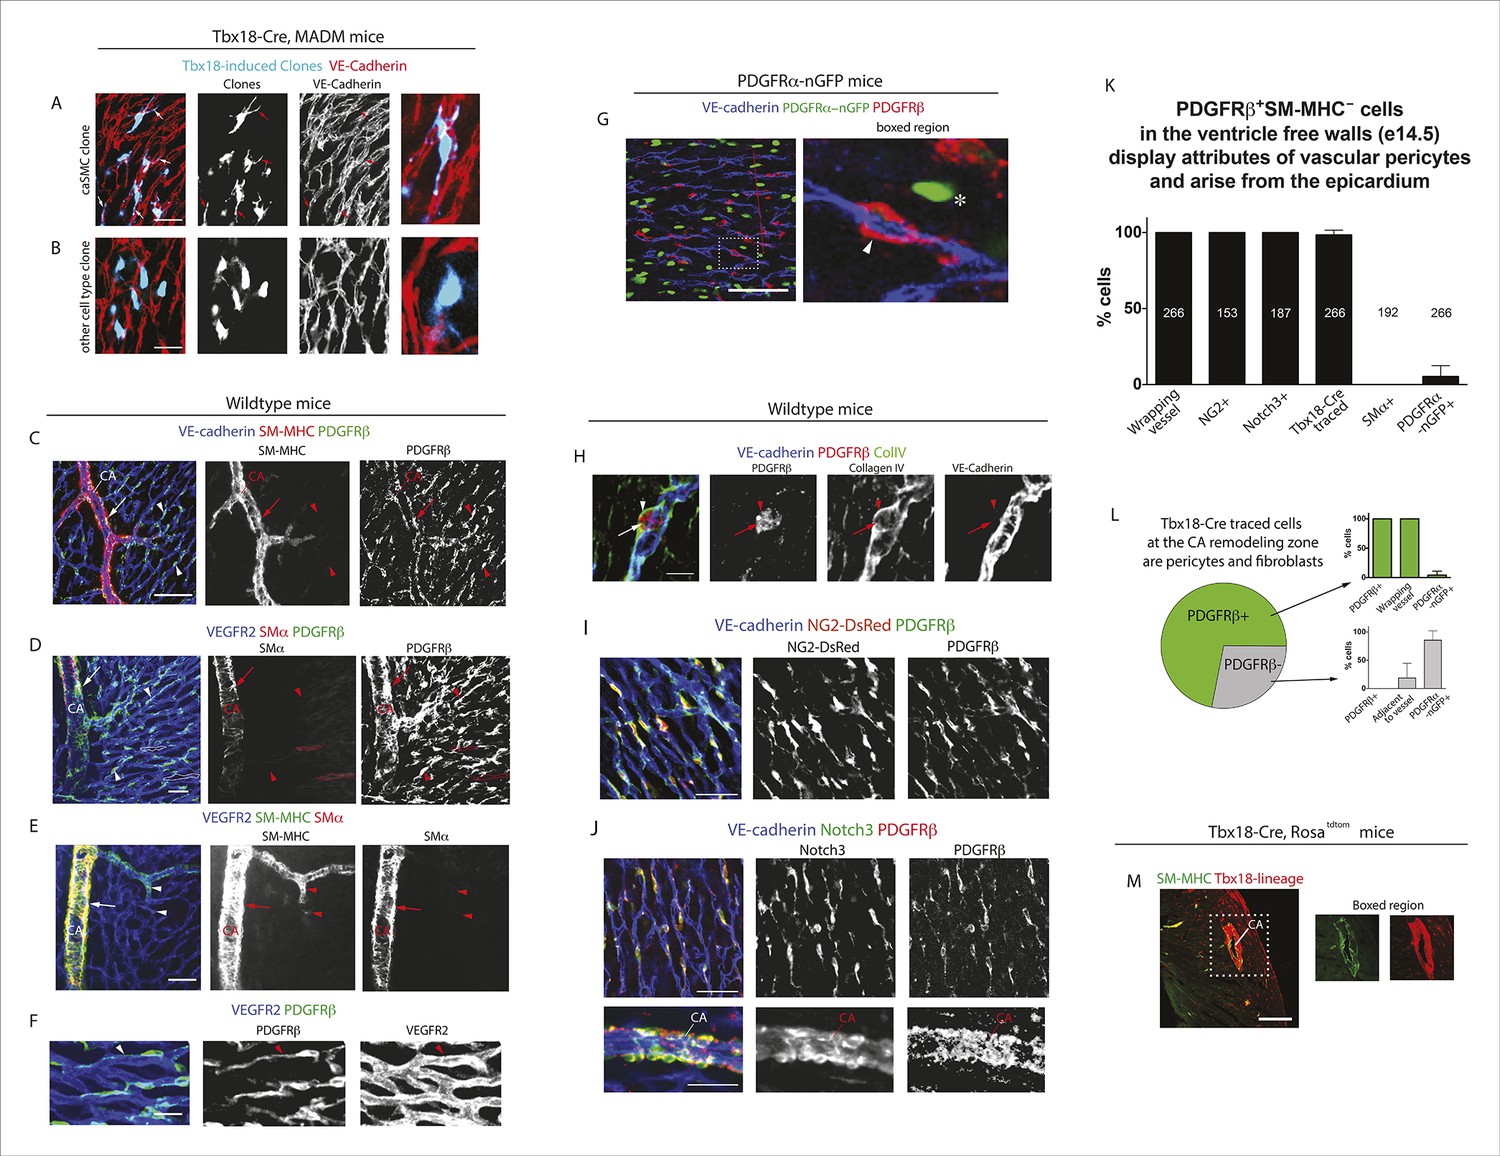
Characterization of epicardial-derived pericytes in the developing heart.
(A–G) Whole mount confocal images of hearts immunostained with the indicated antibodies and/or fluorescent labels. (A and B) Images from Tbx18-Cre, MADM hearts show that coronary artery smooth muscle cell (caSMC) containing clones (blue) always include pericyte-like sister cells with long extended processes (arrows) that travel along VE-cadherin+ blood vessels (red) (A). In contrast, cells within clones not containing caSMCs (other cell type clone) are generally located in between vessels (B). High magnifications are shown on the right. (C–J) Mural cell characterization in hearts from mice of the indicated genotypes. (C and D) Smooth muscle and pericytes can be distinguished by immunolabeling for smooth muscle cell contractile proteins (SM-MHC and SMα) and PDGFRβ. (C) Smooth muscle surrounding coronary arteries (CA) is positive for SM-MHC and PDGFRβ (arrows) while pericytes only stain for PDGFRβ (arrowheads). (D) PDGFRβ+ pericytes are not labeled with SMα-specific antibodies (arrowheads). caSMCs around large arteries are positive for both markers (arrows). Some cardiomyocytes expression low levels of SMα (outlines). (E) SM-MHC is expressed in small and large arteries (arrowheads), while SMα only marks the caSMC coating around larger, more mature vessels (arrows). (F) PDGFRβ+ cells display a pericyte-like morphology with long processes that wrap around microvessels (arrowheads). (G) PDGFRβ immunostaining of PDGFRα-GFP hearts demonstrate that the two markers do not significantly overlap. PDGFRβ+ cells (red) wrap around the vessel (arrowhead), while PDGFRα+ cells usually exist in-between vessels (asterisk). (H) PDGFRβ+ cells (arrow) are embedded within a Collagen IV+ basement membrane (arrowhead). (I and J) PDGFRβ overlaps with NG2-DsRed labeling (I) and Notch3 immunostaining (J). (K) Quantification of marker expression and lineage labeling in PDGFRβ+ cells in the free walls of the developing heart ventricles. The number of cells analyzed are indicated. (L) PDGFRβ+ pericytes are the most numerous epicardial-derived cell type at the e14.5 coronary artery remodeling zone. 72% of Tbx18-Cre, Rosatdtomato lineage traced cells are pericytes (PDGFRβ+) (n = 14 hearts from 6 litters). The epicardial derived PDGFRβ- fraction contains mostly PDGFRα+ fibroblasts. (M) Tbx18-Cre, Rosatdtomato lineage tracing shows that the majority of caSMCs are epicardial derived. Scale bars, A and B, 20 µm; C–E, 50 µm; F and H, 10 µm; G, 50 µm; I and J, 100 µm; M, 200 µm.
Figure 2—figure supplement 1
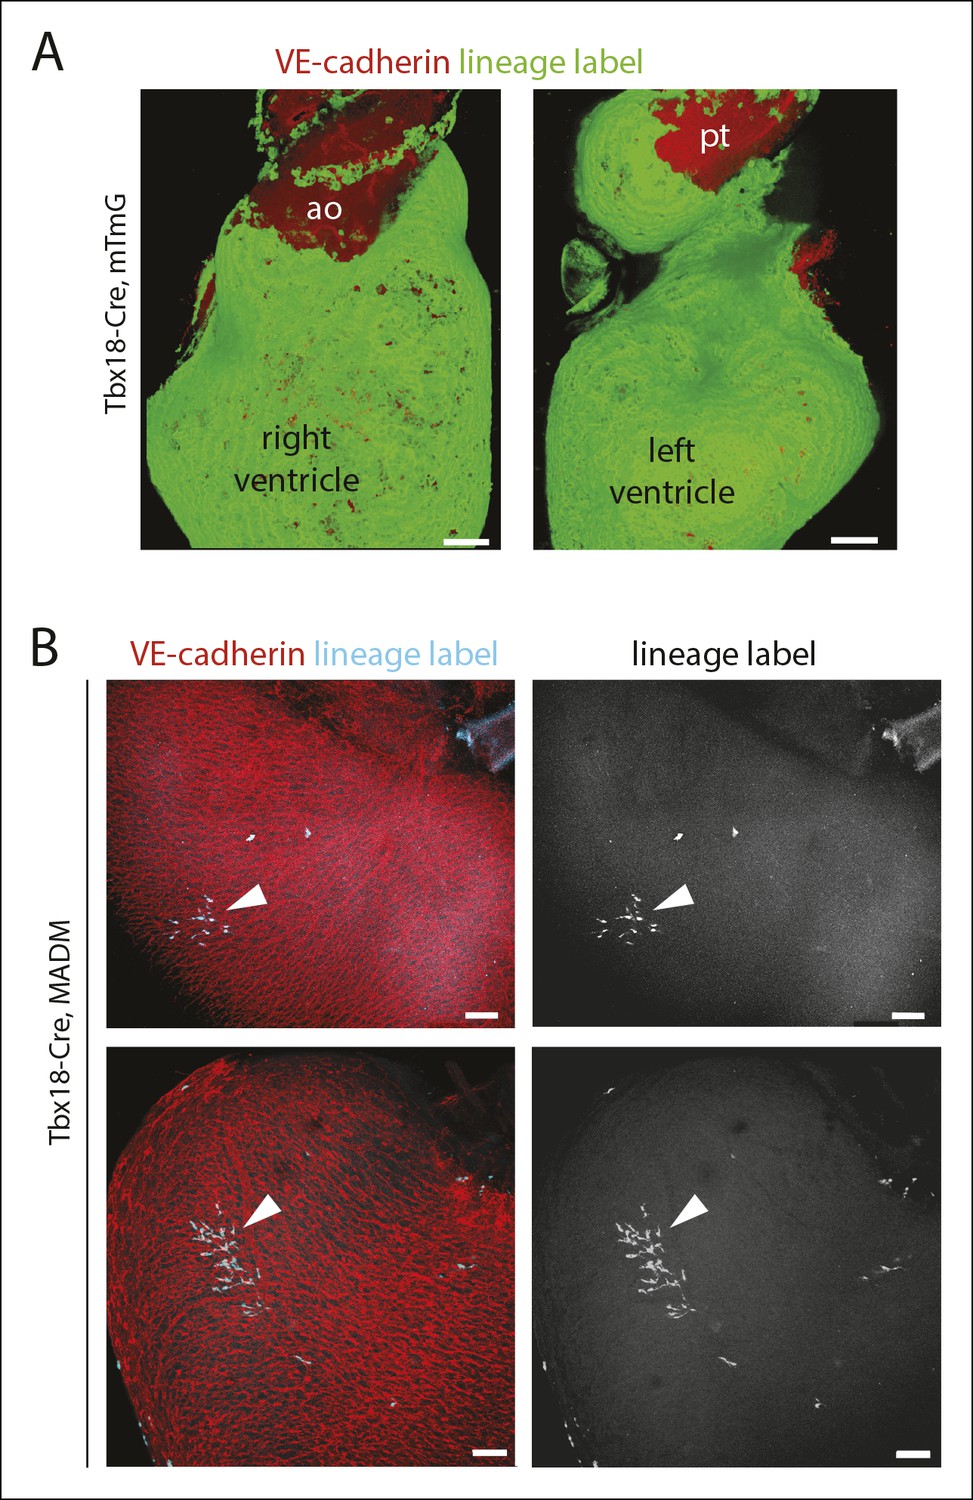
Tbx18-Cre lineage tracing and clonal analysis.
(A) Widespread epicardial labeling (green) in Tbx18-Cre hearts containing the RosamTmG Cre reporter allele. (B) Examples of labeled clonal clusters (teal, arrowheads) in Tbx18-Cre hearts containing the MADM Cre reporter alleles. Ao, aorta; pt, pulmonary trunk. Scale bars: 100 µm.
Figure 2—figure supplement 2
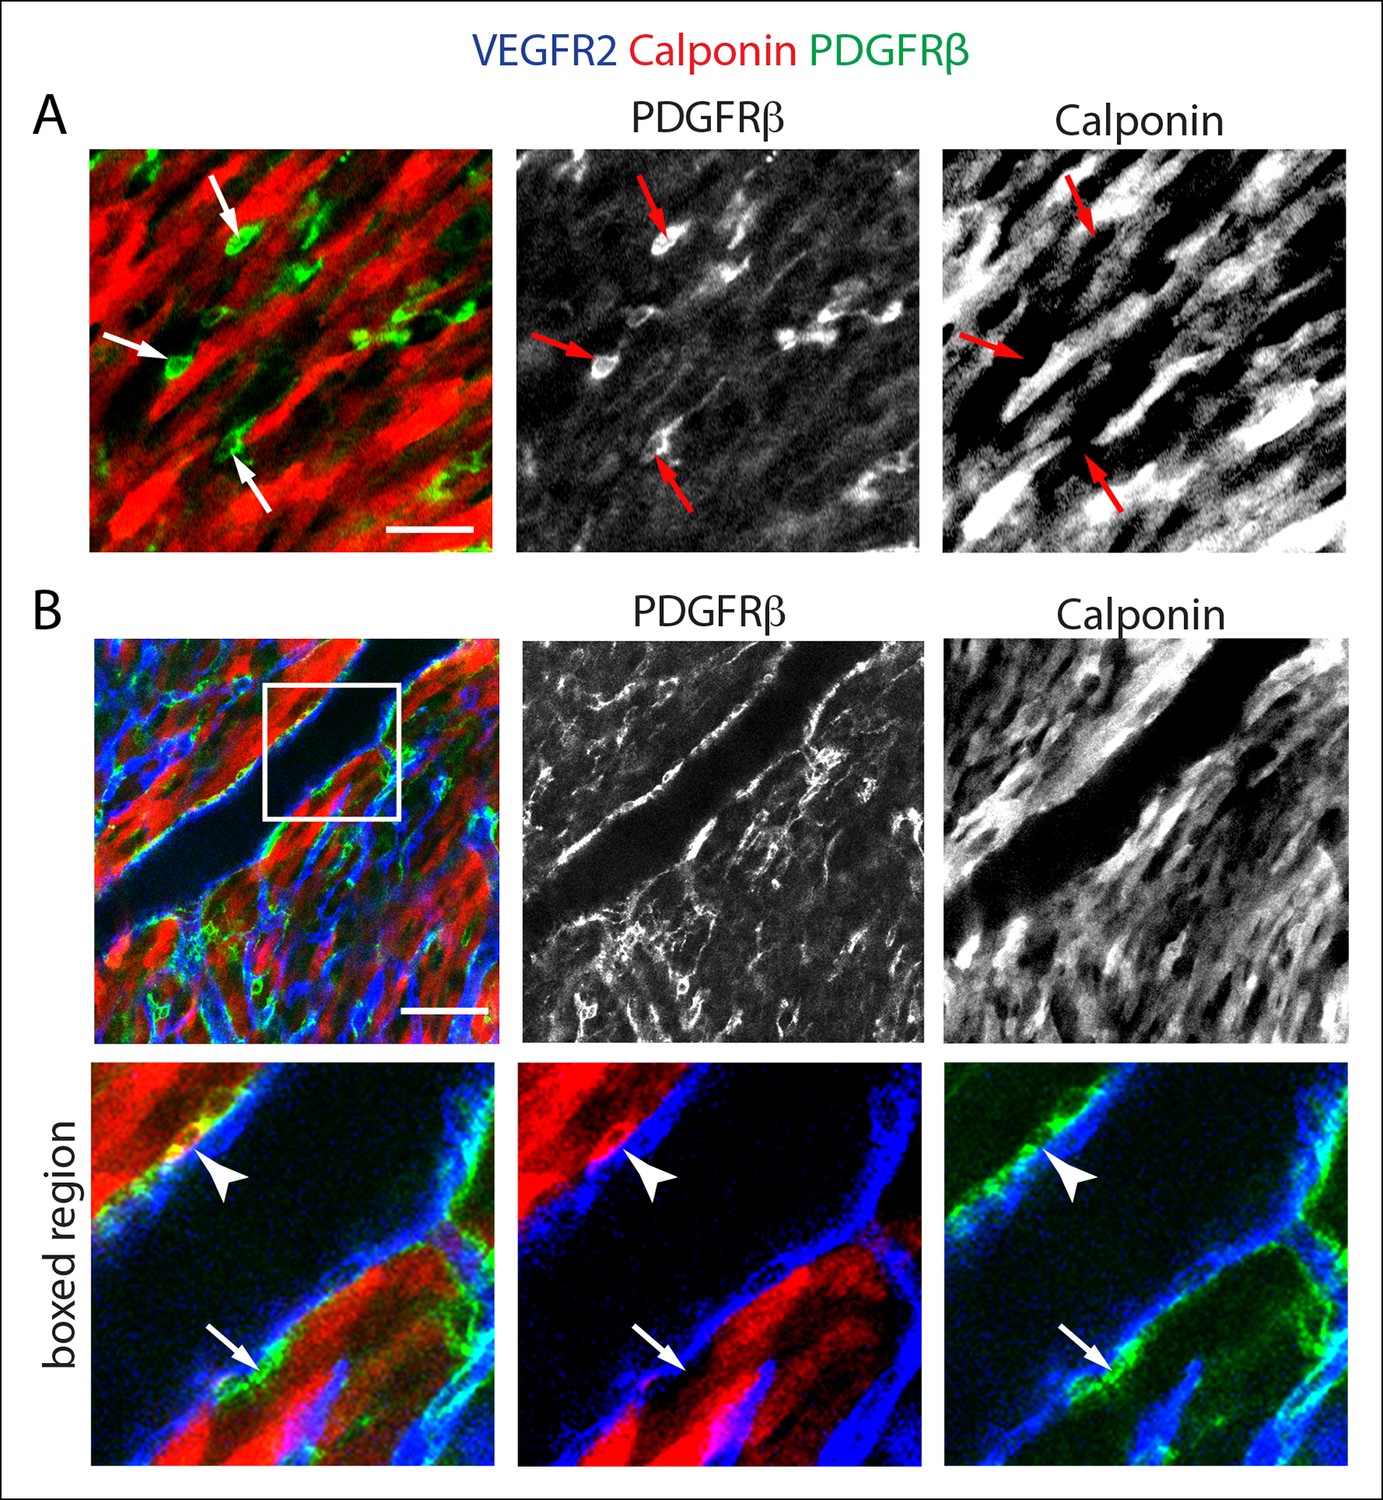
Calponin is not expressed in PDGFRβ+ perivascular cells that wrap microvessels.
(A) PDGFRβ+ perivascular cells that surround capillary plexus vessels (arrows) are not labeled with a Calponin 1-specific antibody, while surrounding cardiomyocytes are intensely labeled (red). (B) Calponin1 labels a subset of smooth muscle cells around large coronary arteries (arrowheads). Many smooth muscle cells are negative (arrow). Scale bars: A, 20 µm; B, 50 µm.
Figure 2—figure supplement 3
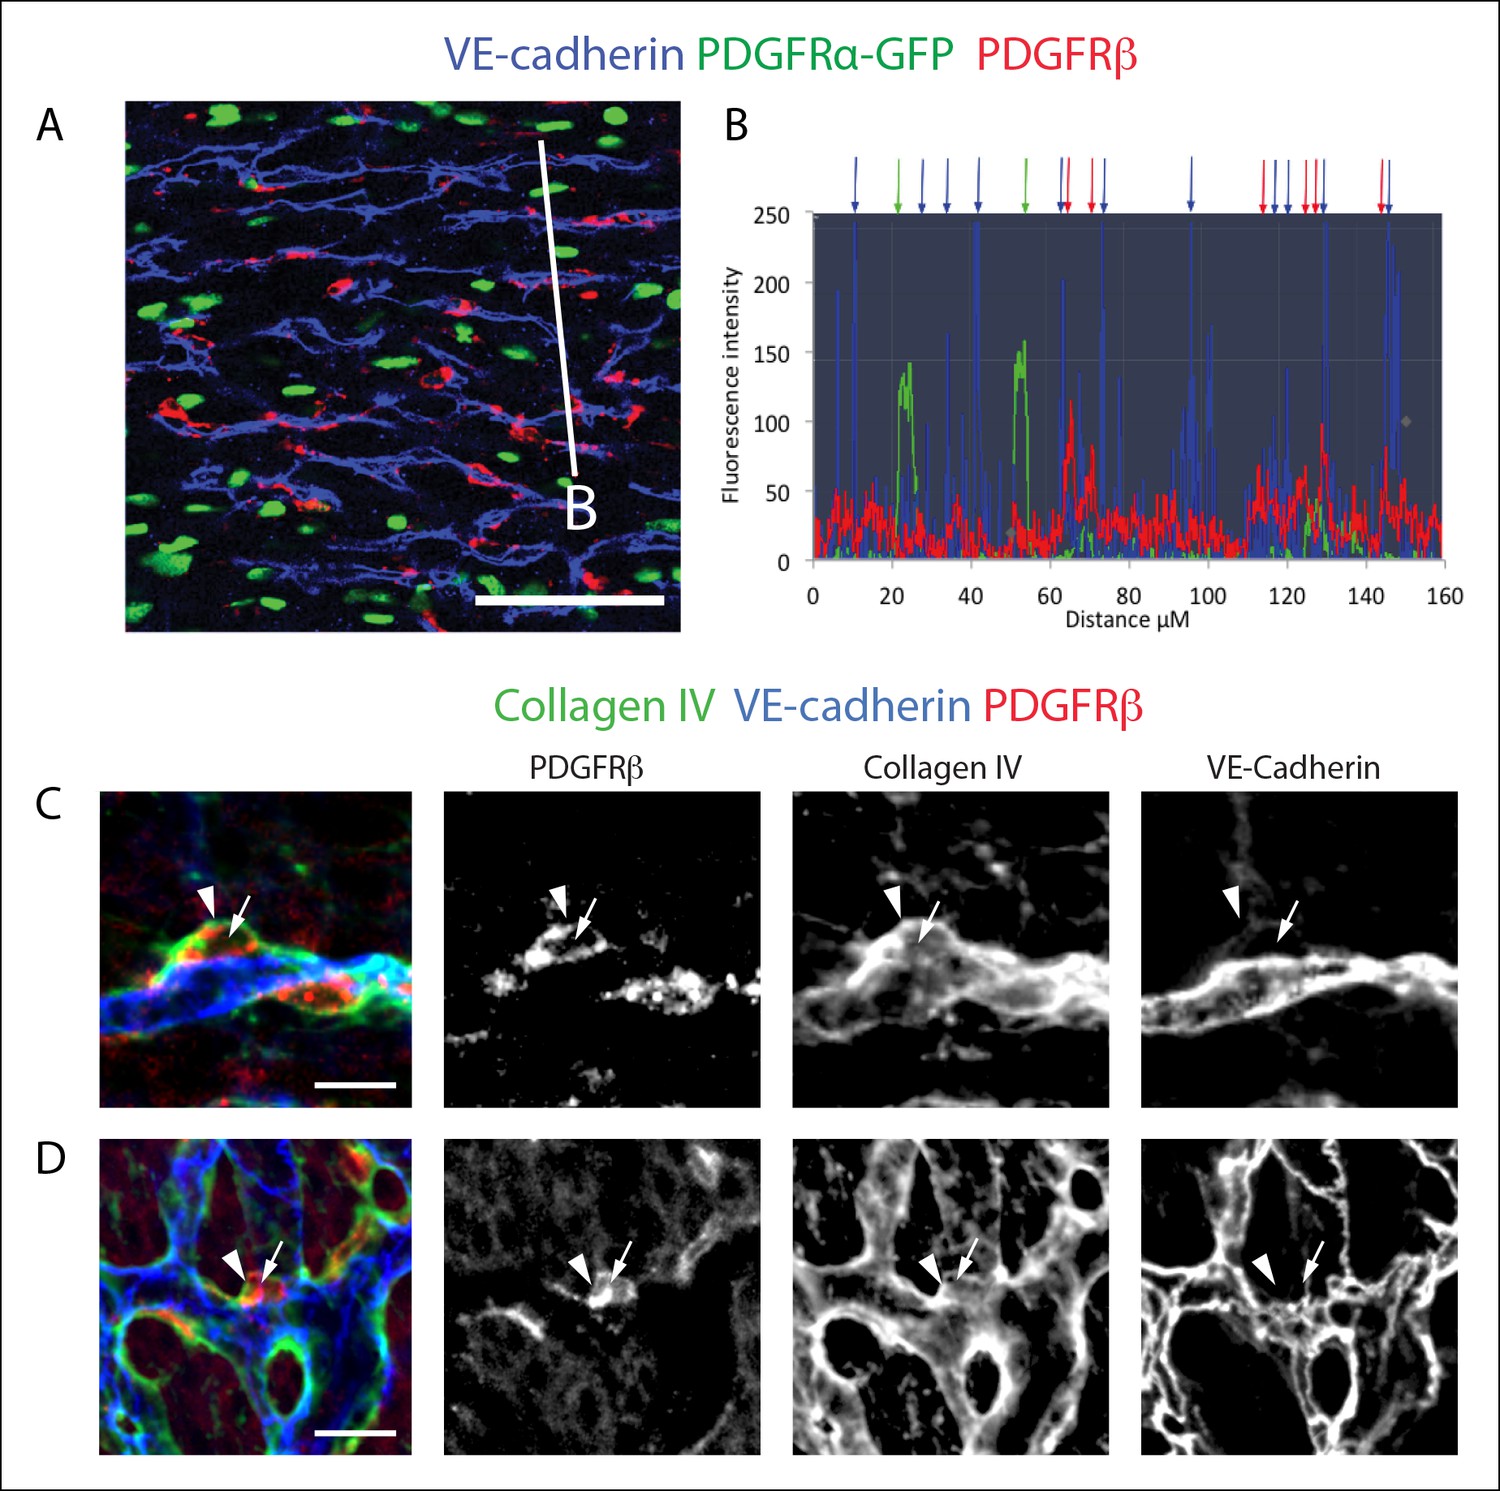
PDGFRβ+ perivascular cells are adjacent to vessels and within the basement membrane.
(A) PDGFRβ immunostaining of PDGFRα-GFP hearts demonstrates that PDGFRβ+ cells (red) are adjacent to vessels while PDGFRα+ cells (green) are interspersed. (B) Fluorescent intensity measurements along the white line in A show that PDGFRβ+ cells (red peaks and arrows) are closely associated with vessels (blue peaks and arrows) while PDGFRα+ cells (green peaks and arrows) frequently reside in between vessels. (C and D) Whole mount confocal microscope images of e13.5 hearts showing that PDGFRβ+ (red) perivascular cells (arrows) are embedded within a collagen IV+ basement membrane (arrowheads). Images in C are z-stack projections, and D represents a single Z plane. Scale bars: A, 50 µm; C and D, 10 µm.
Figure 2—figure supplement 4

Characterization of PDGFRβ perivascular cells in the developing heart.
(A and B) PDGFRβ pericytes co-develop with coronary vessels (CV). Dorsal view of the e11.5 heart (A) and right lateral view at e13.5 (B) showing CVs with associated pericytes (arrowheads). Right panels are boxed regions. Solid lines outline the heart. (C) Dorsal view of the e13.5 heart. PDGFRβ cells coat the developing coronary plexus. Ao, aorta; epi, epicardium; endo, endocardium; sv, sinus venosus. Scale bars, 100 µm.
Figure 2—figure supplement 5
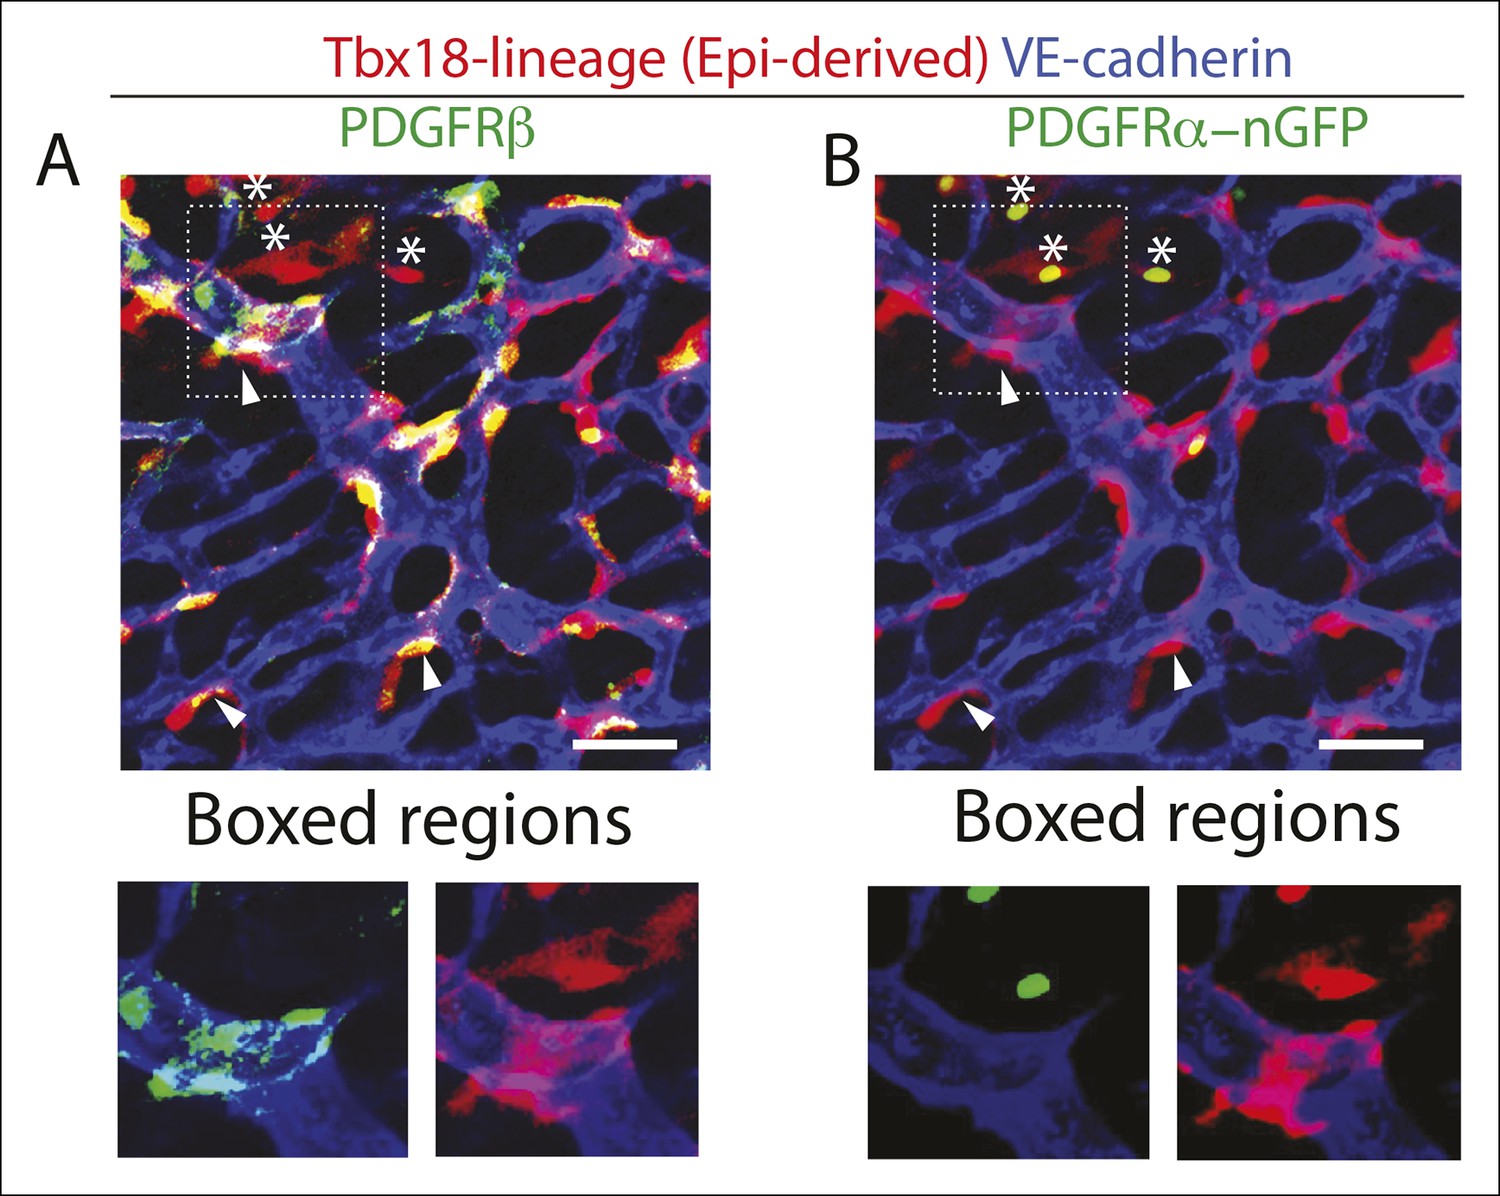
Epicardial-derived cells at the arterial remodeling zone are largely pericytes.
Confocal images of an arterial remodeling zone from a Tbx-18-Cre, RosatdTomato lineage traced heart immunostained for VE-cadherin, PDGFRβ+ (A), and PDGFRα (B). The majority of epicardial-derived cells are PDGFRβ+ and tightly associate with the vessel (arrowheads)(A) while fewer are PDGFRα+ and localize in between vessels (asterisks)(B). Note in (A) that PDGFRβ has a punctate distribution on perivascular cells and, unlike the lineage marker, does not uniformly label the entire cell and all of its cell processes. Quantification is shown in (Figure 2K). Scale bars: 20 µm.
Figure 3 with 2 supplements

Coronary artery smooth muscle cells and pericytes are clonally related.
(A–C) Simulation-Based Analysis of Clonality as outlined in Materials and methods. Mathematical modeling was performed to estimate the underlying clone generation rate that best fit the experimental data (denoted by the horizontal red line) (A), and to evaluate the corresponding overall average rate of clonality (denoted by the vertical red line) (B) as well as the clonality rates for simulated half heart regions with the designated numbers of observed clusters (C). (D) Confocal images of clones from indicated ages (e13.5, e15.5, and adult). Left panels are low magnification views of entire clones and middle panels are internal views of circled clones, which are near coronary arteries in e15.5 and adult. Boxed regions are separated channels as examples of marker expression with white showing clone label for morphology. Note that PDGFRβ staining is punctate while the clone label is uniform throughout the cell. Asterisks indicate long cellular processes in adult pericytes. Schematics of each are on the far right. (E) Graph showing cell types within individual clones. (F) Quantification of the percentage of pericytes and smooth muscle cells in clones and their ratios among total mural cells in adult hearts. caSMC, coronary artery smooth muscle cell; epi, epicardial cell; LV, left ventricle; peri, pericyte; RV, right ventricle; Sep, septum. Scale bars: left panels, 100 µm; middle panels, 20 µm.
Figure 3—figure supplement 1
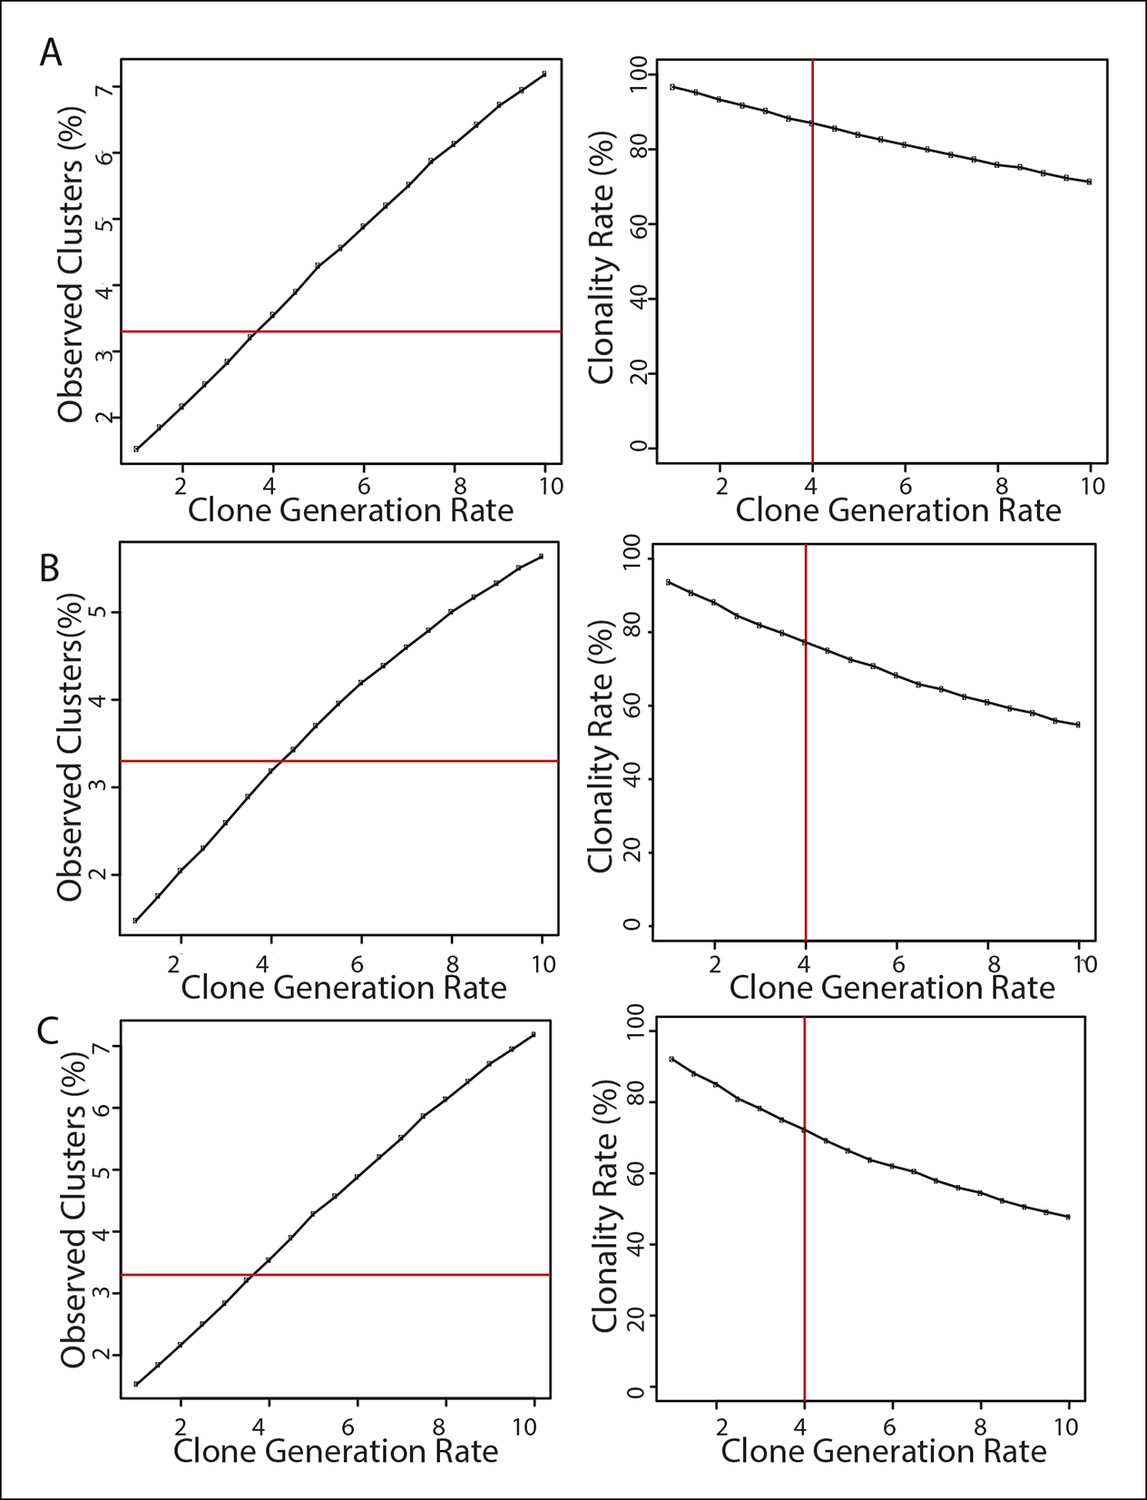
Influence of discrimination distance parameter on estimated clonality rate.
The results of our mathematical simulations to evaluate the clonality of the observed fluorescently labeled cell clusters is presented as in Figure 3A–C. Simulations were performed as described (Materials and methods), with the value of the discrimination distance parameter set to be 25 µm (A), 75 µm (B), or 100 µm (C). Left panels display the mean number of observed clusters per simulation plotted against the underlying clone generation rate (representing the average number of clones produced per half heart region). The horizontal red line indicates the mean number of clusters recorded in the experimental dataset (3.3 clusters per half heart). Right panels show the resulting clonality rate (defined as the fraction of observed clusters consisting of a single clone) plotted as a function of the underlying clone generation rate. The vertical red line indicates the estimated clone generation rate that best fit the experimental data, and its associated clonality rate. The estimated clonality rates were 88% for a discrimination distance of 25 µm (A), 77% for a value of 75 µm (B), and 69% for a value of 100 µm (C). Each data point in both panels represents the results of 10,000 simulated half heart regions containing at least one clone.
Figure 3—figure supplement 2
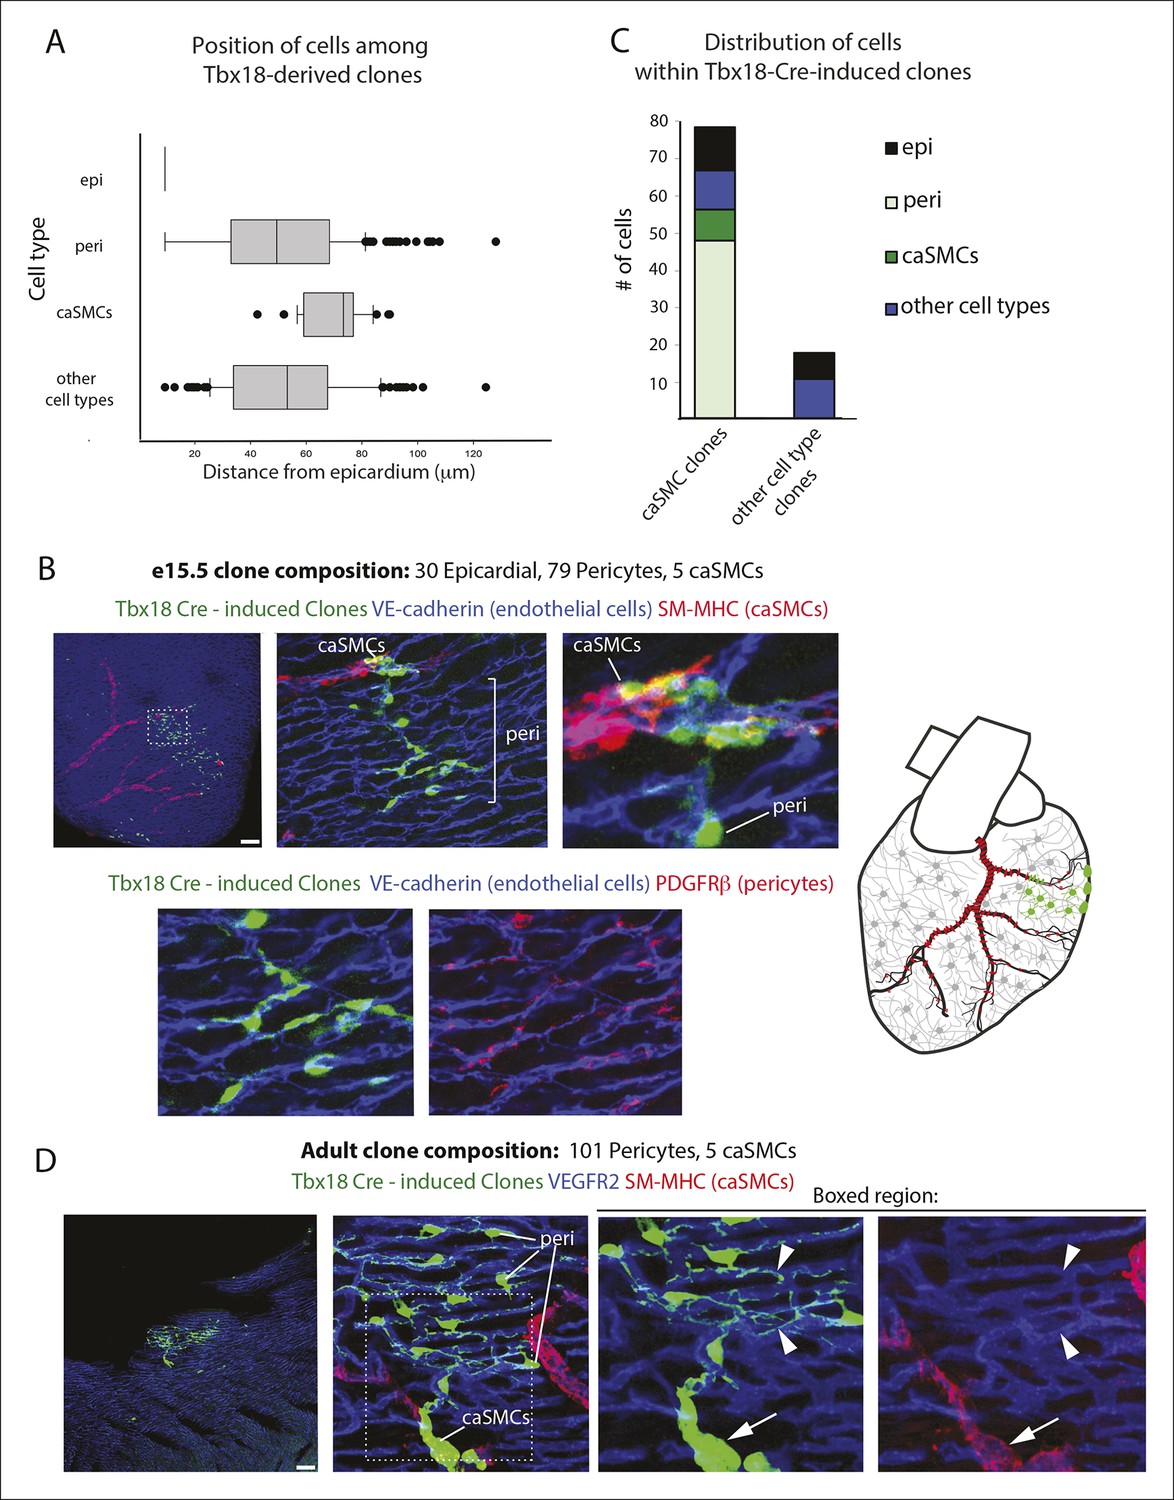
Additional examples of pericyte-coronary artery smooth muscle clones and quantification of cell location and number.
(A) Box-and-whisker plot depicting the location of cell types in e15.5 clones with respect to the epicardium [n = 91, 249, 37 and 150 for epicardial cells (epi), pericytes (peri), coronary artery smooth muscle cells (caSMCs), and other cell types, respectively]. (B) A pericyte-caSMC clone (green) located near a coronary artery (CA)(red). Endothelial cells shown in blue. Top left: low magnification. Top middle: A deeper slice from the boxed region shows continuous sister cells with pericyte and caSMC identity. Top right: higher magnification of middle panel. Lower panels show PDGFRβ staining in pericytes from top middle panel. Schematic is on the far right. (C) Quantification of the number of cells contained in e15.5 Tbx18-Cre, MADM clones. (D) An adult pericyte-caSMC clone (green) located near a CA (red). Pericytes display long extended processes (arrowheads) along capillaries (blue). Arrows point to caSMCs. Low magnification is left, higher magnification is middle, and separated channels of boxed regions are right. Scale bars: 100 µm.
Figure 4
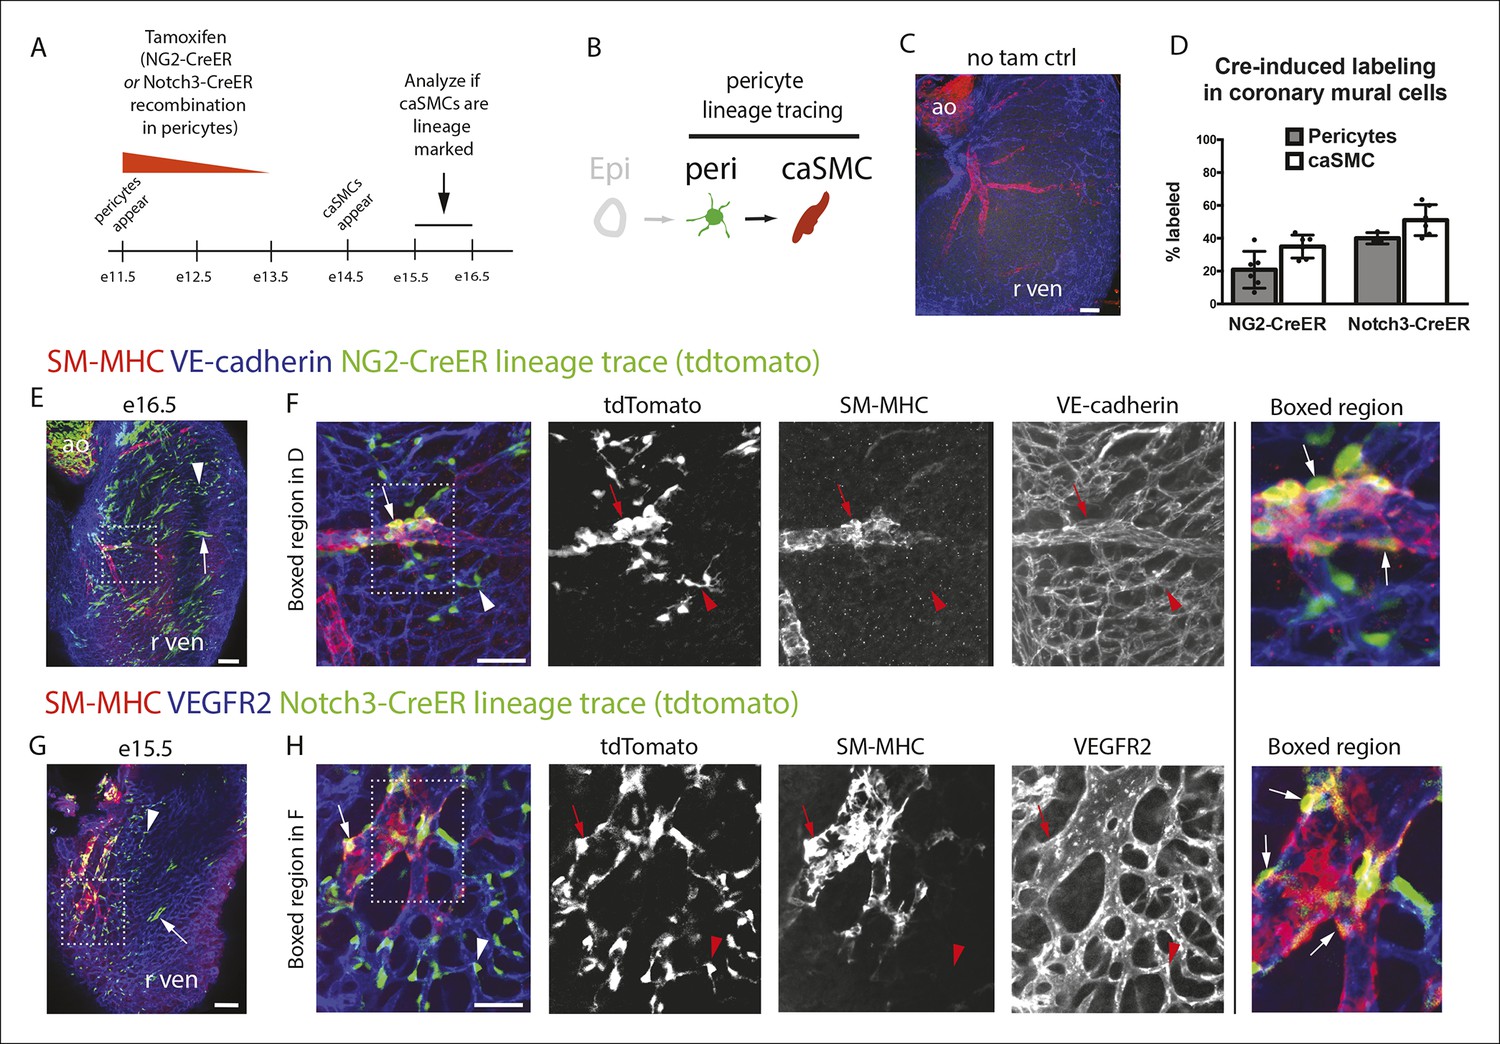
Pericytes differentiate into coronary artery smooth muscle.
(A and B) Schematics describing the experimental design for cardiac pericyte lineage tracing (A) and part of the differentiation pathway being interrogated (B). (C) No recombination occurs in NG2-CreER, Rosatdtomato animals in the absence of tamoxifen (tam). (D) Quantification of Cre labeling (i.e. recombination efficiency) in NG2+Notch3+ pericytes alongside levels of smooth muscle lineage labeling. (E) E11.5 dosing of NG2-CreER induces lineage labeling (green) in pericytes (arrowhead), smooth muscle, and some cardiomyocytes (arrow). (F) Boxed region in E showing lineage labeled pericytes (green, arrowheads) and coronary artery smooth muscle (yellow, arrows) (n = 10 hearts from 3 litters). Endothelial cells are in blue (VE-cadherin+). Right panel is boxed region in far left panel. (G) Labeled pericytes (arrowhead), smooth muscle, and rare cardiomyocytes (arrow) in Notch3-CreER lineage trace. (H) Boxed region in F showing lineage labeled pericytes (green, arrowheads) and coronary artery smooth muscle (yellow, arrows) (n = 11 hearts from 2 litters). Endothelial cells are in blue (VEGFR2+). Right panel is boxed region in far left panel. Ao, aorta; caSMC, coronary artery smooth muscle cell; epi, epicardium; r ven, right ventricle, Scale bars: C, E and G,100 µm; F and H 50 µm.
Figure 5
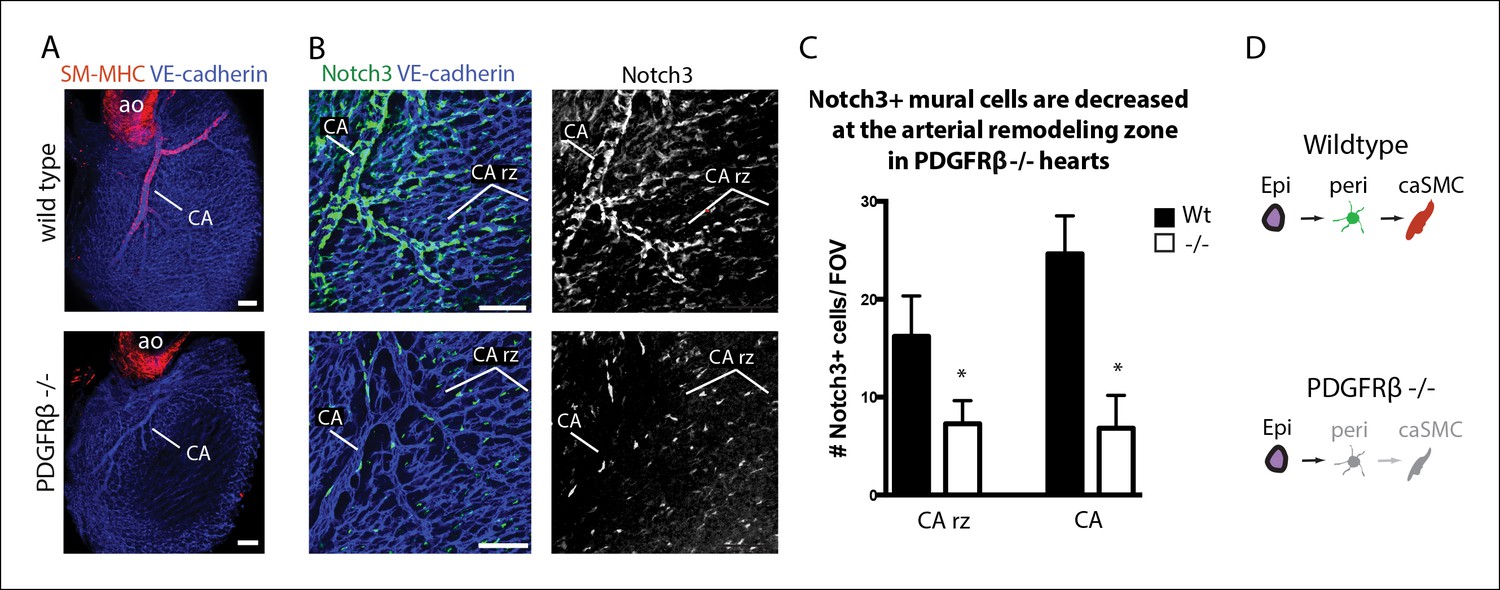
Coronary artery smooth muscle and pericytes are decreased in PDGFRβ-null mice.
(A) Absence of SM-MHC+ smooth muscle around coronary arteries (CA) in PDGFRβ knockout hearts. (B) Notch3+ mural cells (green) are decreased at the coronary artery remodeling zone (CA rz) in PDGFRβ-deficient hearts (n = 8 from 4 litters). (C) Quantification of pericyte numbers per field of view (FOV) (wild type, n = 7 hearts; mutant, n = 5). Error bars are s.d.; *p≤0.05. (D) Schematic demonstrating the hypothesized epicardial to smooth muscle differentiation pathway and how it is affected in PDGFRβ-null mice. Greyed cells are reduced or absent. Ao, aorta; CA rz, coronary artery remodeling zone; caSMC, coronary artery smooth muscle cell; epi, epicardium; r ven, right ventricle. Scale bars: A, 100 µm; B, 50 µm.
Figure 6 with 1 supplement
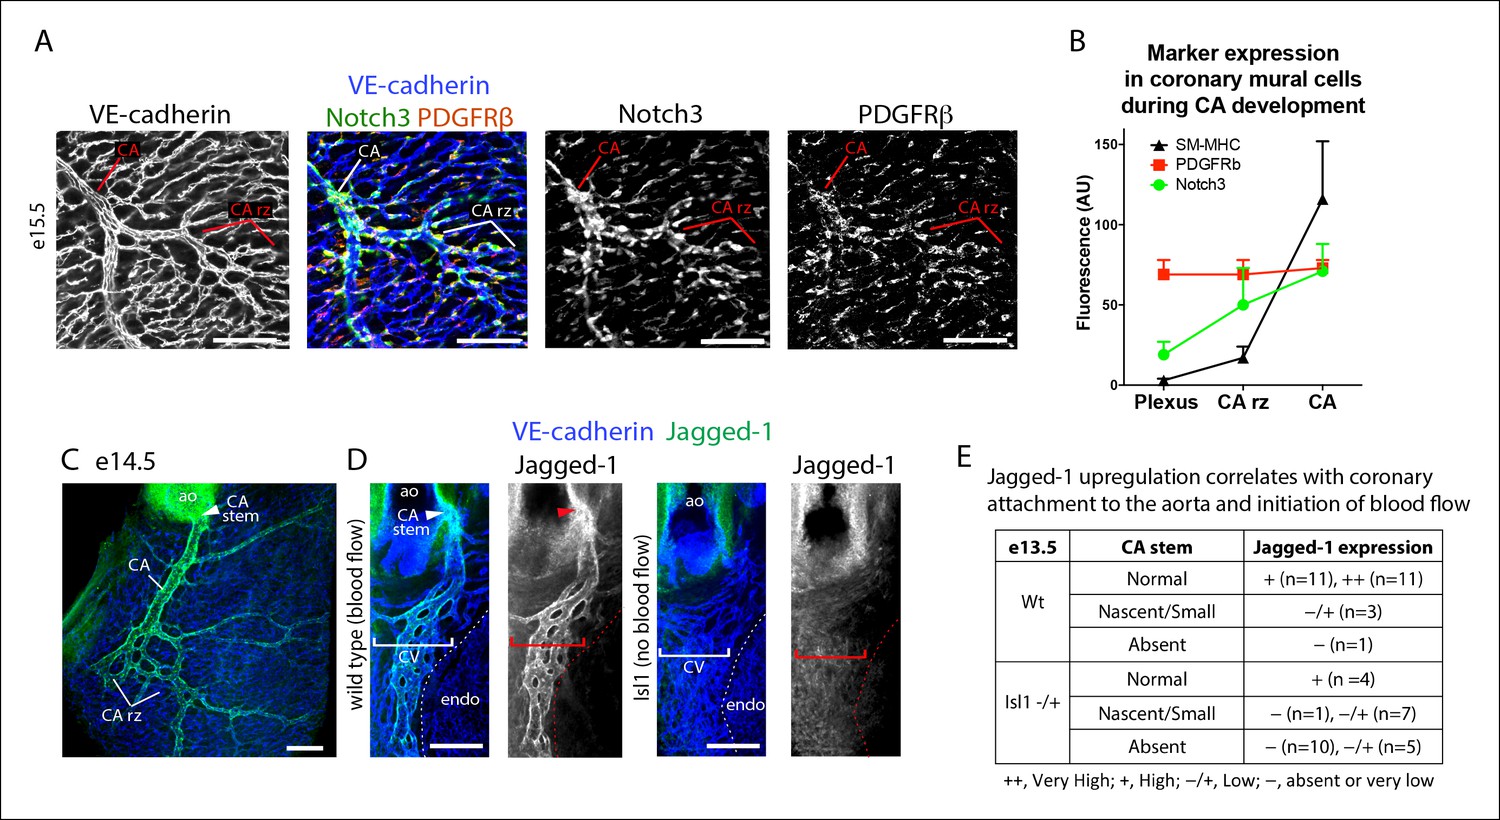
Notch3 and Jagged-1 expression at the arterial remodeling zone.
(A and B) Mural cells around coronary vessels increase Notch3 protein expression at the coronary artery remodeling zone (CA rz) while PDGFRβ levels remain the same. (A) Confocal image of a representative remodeling zone. (B) Quantification of marker expression. Error bars are s.d. (C and D) Confocal images immunostained for VE-cadherin (blue) and Jagged-1 (green). (C) Jagged-1 is specifically expressed in coronary arteries (CA) and the CA rz after attachment to the aorta (ao) and induction of blood flow. (D) Jagged-1 is expressed in coronary vessels at e13.5 soon after aortic attachment and CA stem formation, but not in Isl1 mutant littermates with delays in attachment and arterial blood flow. (E) Table of Jagged-1 protein expression in wild type (Wt) and Isl1 mutants. Scale bars: 100 µm
Figure 6—figure supplement 1

Characterization of Jagged-1 expression during coronary artery development.
Confocal images of VE-cadherin and Jagged-1 immunostaining in hearts from the indicated ages. Jagged-1 expression is initiated right after coronary vessels (VE-cadherin+) connect to the aorta in the vessels directly downstream of the attachment site (arrowheads). Ao, aorta; ca, coronary artery; cv, coronary vessels. Scale bars: 50 µm.
Figure 7
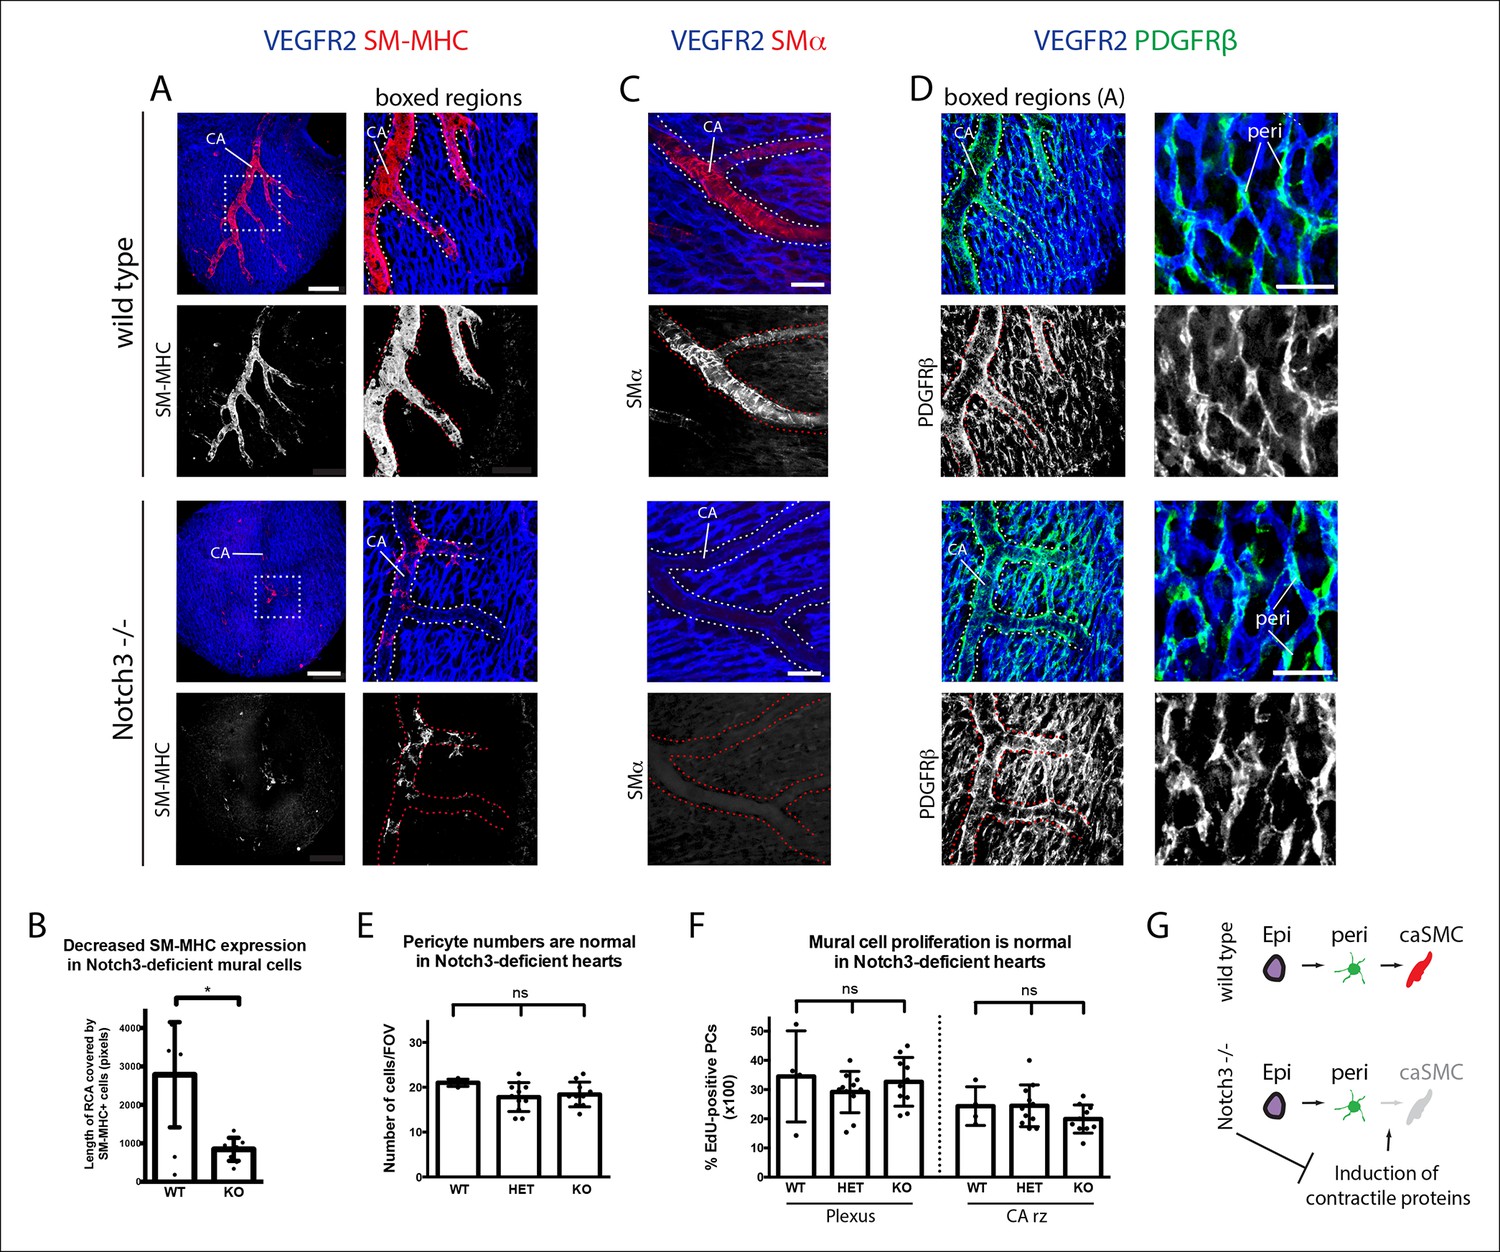
Notch3 is required for coronary artery smooth muscle development.
(A) SM-MHC+ coronary artery smooth muscle cell (caSMCs) are significantly reduced in Notch3-null hearts although coronary artery (CA) caliber (dotted lines) is comparable. (B) Quantification of caSMC coverage in Notch3-deficient hearts where dots are individual samples and error bars are s.d. *p≤0.05. (C) SMα protein expression is reduced on arteries from Notch3-deficient hearts. (D) PDGFRβ+ cells cover CAs in both wild type and knockout, and pericytes (peri) are not significantly reduced. (E) Quantification of pericyte numbers in Notch3-deficient hearts. (F) Quantification of mural cell proliferation in Notch3-deficient hearts at the capillary plexus and CA remodeling zone (CA rz). (G) Schematic demonstrating the hypothesized epicardial to smooth muscle differentiation pathway and how it is affected in the absence of Notch3. Greyed cells are reduced. Scale bars: A, 100 µm; C, 50 µm; D, 25 µm.
Figure 8

NG2+ and Notch3+ cells differentiate into smooth muscle cells in the kidney.
(A) Whole mount confocal imaging of embryonic kidneys (outlined with dotted lines) from the indicated ages immunostained for SM-MHC and VE-cadherin. Mature smooth muscle differentiation is detected at e14. (B) Schematic describing lineage tracing experimental design. (C) e11.5 dosing of NG2-CreER, Rosatdtomato animals induces labeling (green) in smooth muscle (red, arrows) (n = 11 kidneys from 2 litters). Cells within the glomerulus are also labeled (arrowheads). Scale bars: 100 µm.
Figure 9
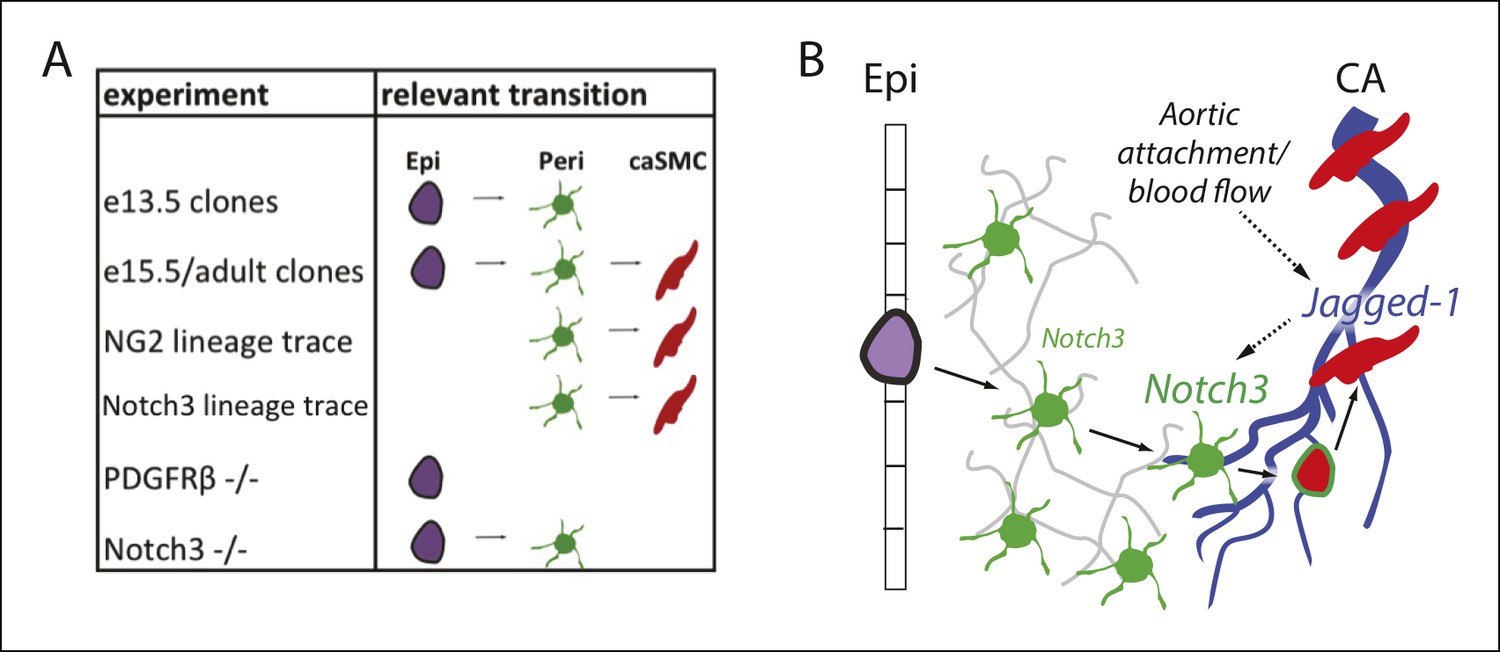
Model and summary.
(A) Different parts of the hypothesized epicardial to caSMC pathway were dissected using the indicated experiments. (B) Working model for caSMC differentiation. CA, coronary artery; caSMC, coronary artery smooth muscle cell; Epi, epicardium; Peri, pericytes.
Videos
Video 1
Following an epicardial/pericyte/smooth muscle cell clone from the surface of the heart to a coronary artery deep in the myocardium.
Movie showing single confocal Z-planes of the clone in Figure 3A-e15.5 going from the surface of the heart to deeper regions where a coronary artery is located (μms from the epicardium are indicated). A single epicardial cell is present at the surface while tightly clustered pericytes span the region between the surface and coronary artery where clonal cells are incorporated into the smooth muscle cell layer. VE-Cadherin (blue) labels the vasculature, SM-MHC (red) labels coronary artery smooth muscle, and the Tbx18-Cre, MADM lineage label is green.
Video 2
Pericytes and smooth muscle clone cells express PDGFRβ.
Clone in Video 1 (Figure 3A-e15.5) showing the fluorescent channels for PDGFRβ in red and the Tbx18-Cre, MADM lineage label in green. Note that PDGFRβ is localized in a punctate pattern while the lineage label fills the entire cell so that only portions of the cell appear as double positive (yellow).
Download links
A two-part list of links to download the article, or parts of the article, in various formats.
Downloads (link to download the article as PDF)
Open citations (links to open the citations from this article in various online reference manager services)
Cite this article (links to download the citations from this article in formats compatible with various reference manager tools)
Pericytes are progenitors for coronary artery smooth muscle
eLife 4:e10036.
https://doi.org/10.7554/eLife.10036


