A general mechanism for initiating the bacterial general stress response
- Department of Biochemistry, Brandeis University, United States
- Graduate program in Biochemistry and Biophysics, Brandeis University, United States
- Biophysics Collaborative Access Team (BioCAT), Department of Physics, Illinois Institute of Technology, United States
- Biophysics Collaborative Access Team (BioCAT), Department of Biology, Illinois Institute of Technology, United States
- Graduate program in Molecular and Cell Biology, Brandeis University, United States
Figures
Figure 1 with 3 supplements
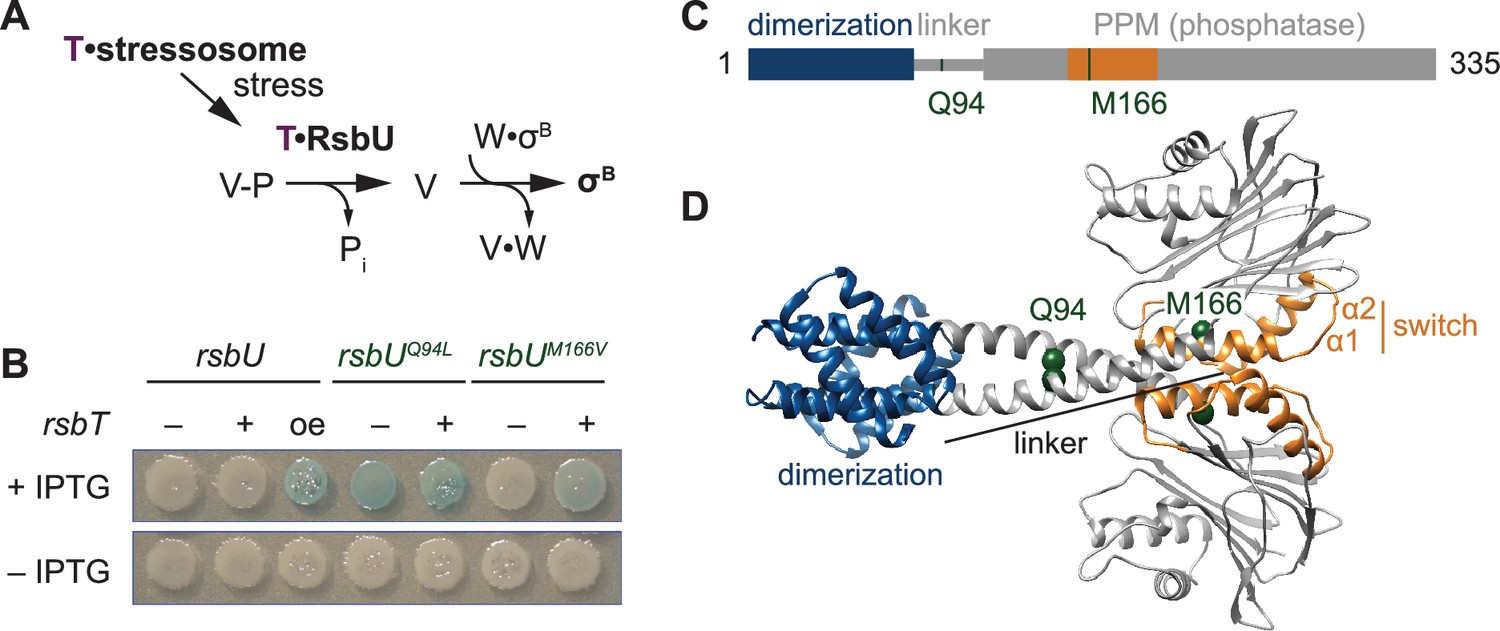
The linker controls RsbU activation through a conserved switch element.
(A) Reaction scheme of the RsbU-dependent pathway of the environmental stress response. RsbU is activated by its partner protein RsbT (T, purple) to dephosphorylate its substrate protein RsbV-P (V–P). This initiates transcription by displacing σB from inhibition by the anti-sigma factor RsbW (W). (B) Amino acid substitutions in RsbU (Q94L and M166V) cause enhanced σB activity in B. subtilis. Strains carrying a lacZ reporter of σB activity (ctc-lacZ) were plated on X-gal indicator plates in the presence (top) or absence (bottom) of IPTG to induce expression of the rsbU constructs. Strains were deleted for rsbT (–) or not (+). A strain overexpressing rsbT is indicated by oe. Plates were imaged after 24 h of growth at 37 °C, which was shorter than the time used to visualize lacZ expression from the rsbUM166V strain previously (Ho and Bradshaw, 2021). (C) Domain diagram of RsbU. The N-terminal domain of RsbU (blue; amino acids 1–81) is joined to the α-helical linker domain (grey; 82-112), which connects it to the PPM phosphatase domain (grey box; 121-335). The regulatory switch element of the PPM phosphatase domain is colored orange (156-201). The location of RsbT-bypass mutations are highlighted in green. (D) AlphaFold2 model of RsbU dimer. Domains are colored as in (C) and the Cα atoms of residues Q94 and M166 are shown as spheres.
Figure 1—figure supplement 1
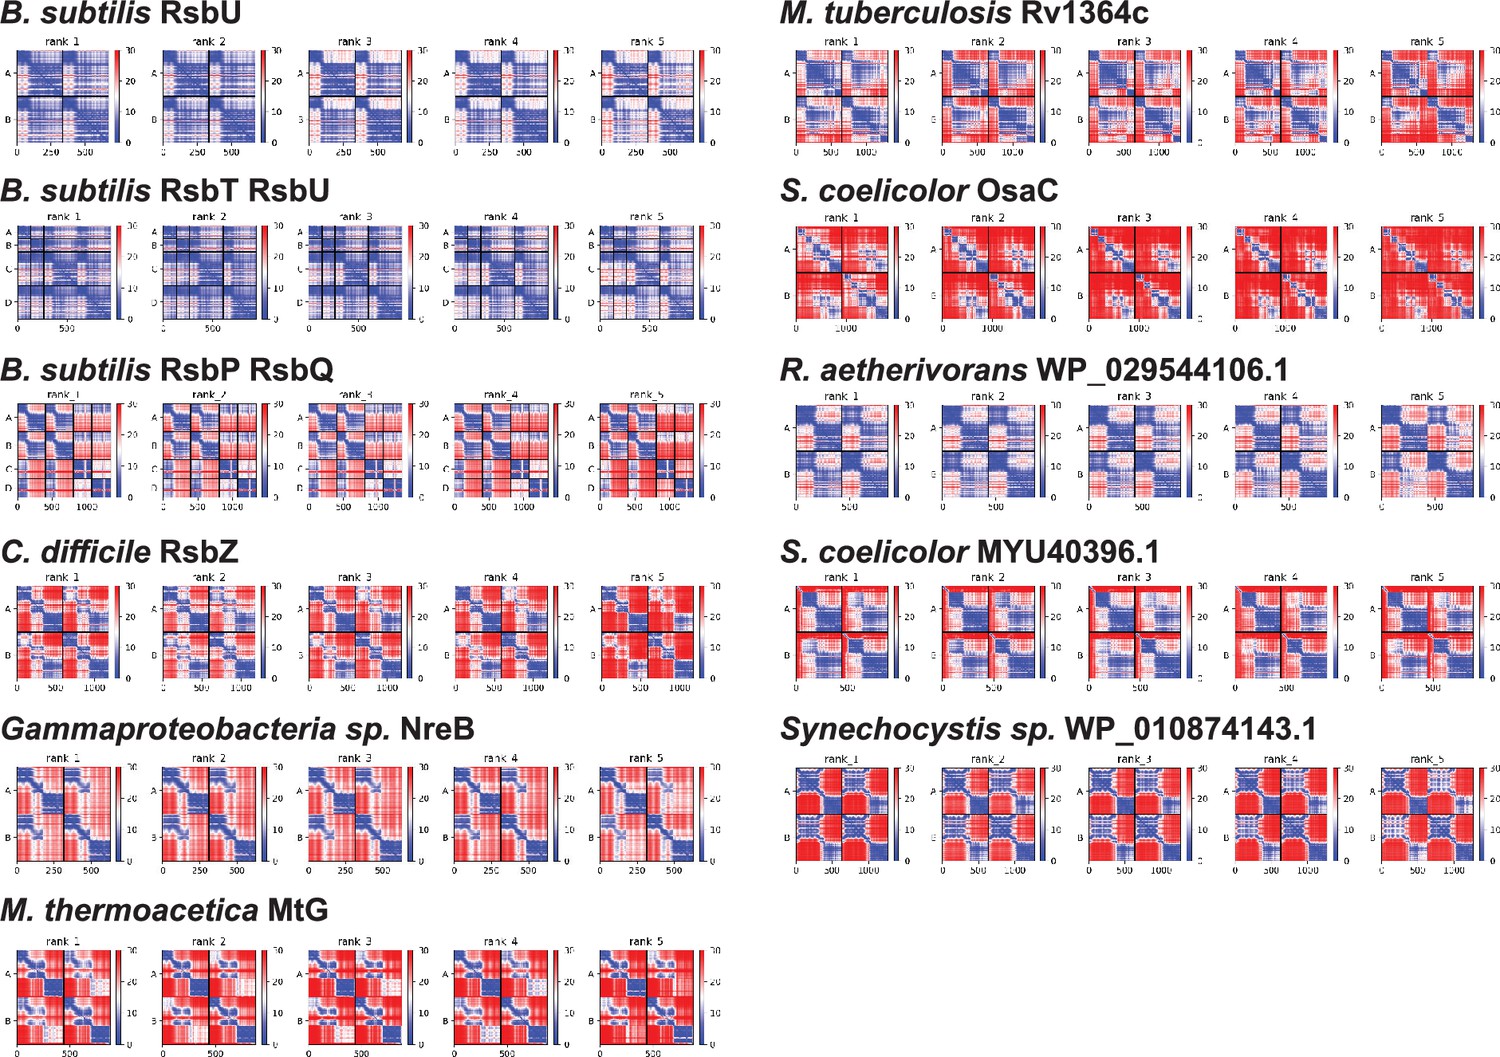
PAE plots of AlphaFold2 structure predictions.
Predicted aligned error of the AlphaFold2 structure predictions of the following proteins: B. subtilis RsbU, B. subtilis 2RsbT (chains A, B)/2RsbU (chains C,D) complex, B. subtilis 2RsbP (chains A,B)/2RsbQ complex (chains C,D), C. difficile RsbZ, Gammaproteobacteria sp. NreB, M. thermoacetica MtG, M. tuberculosis Rv1364c, S. coelicolor OsaC, R. aetherivorans WP_029544106.1, S. coelicolor MYU40396.1, and Synechocystis sp. WP_010874143.1. Blue indicates high confidence (0 Å) and red indicates low confidence (30 Å).
Figure 1—figure supplement 2
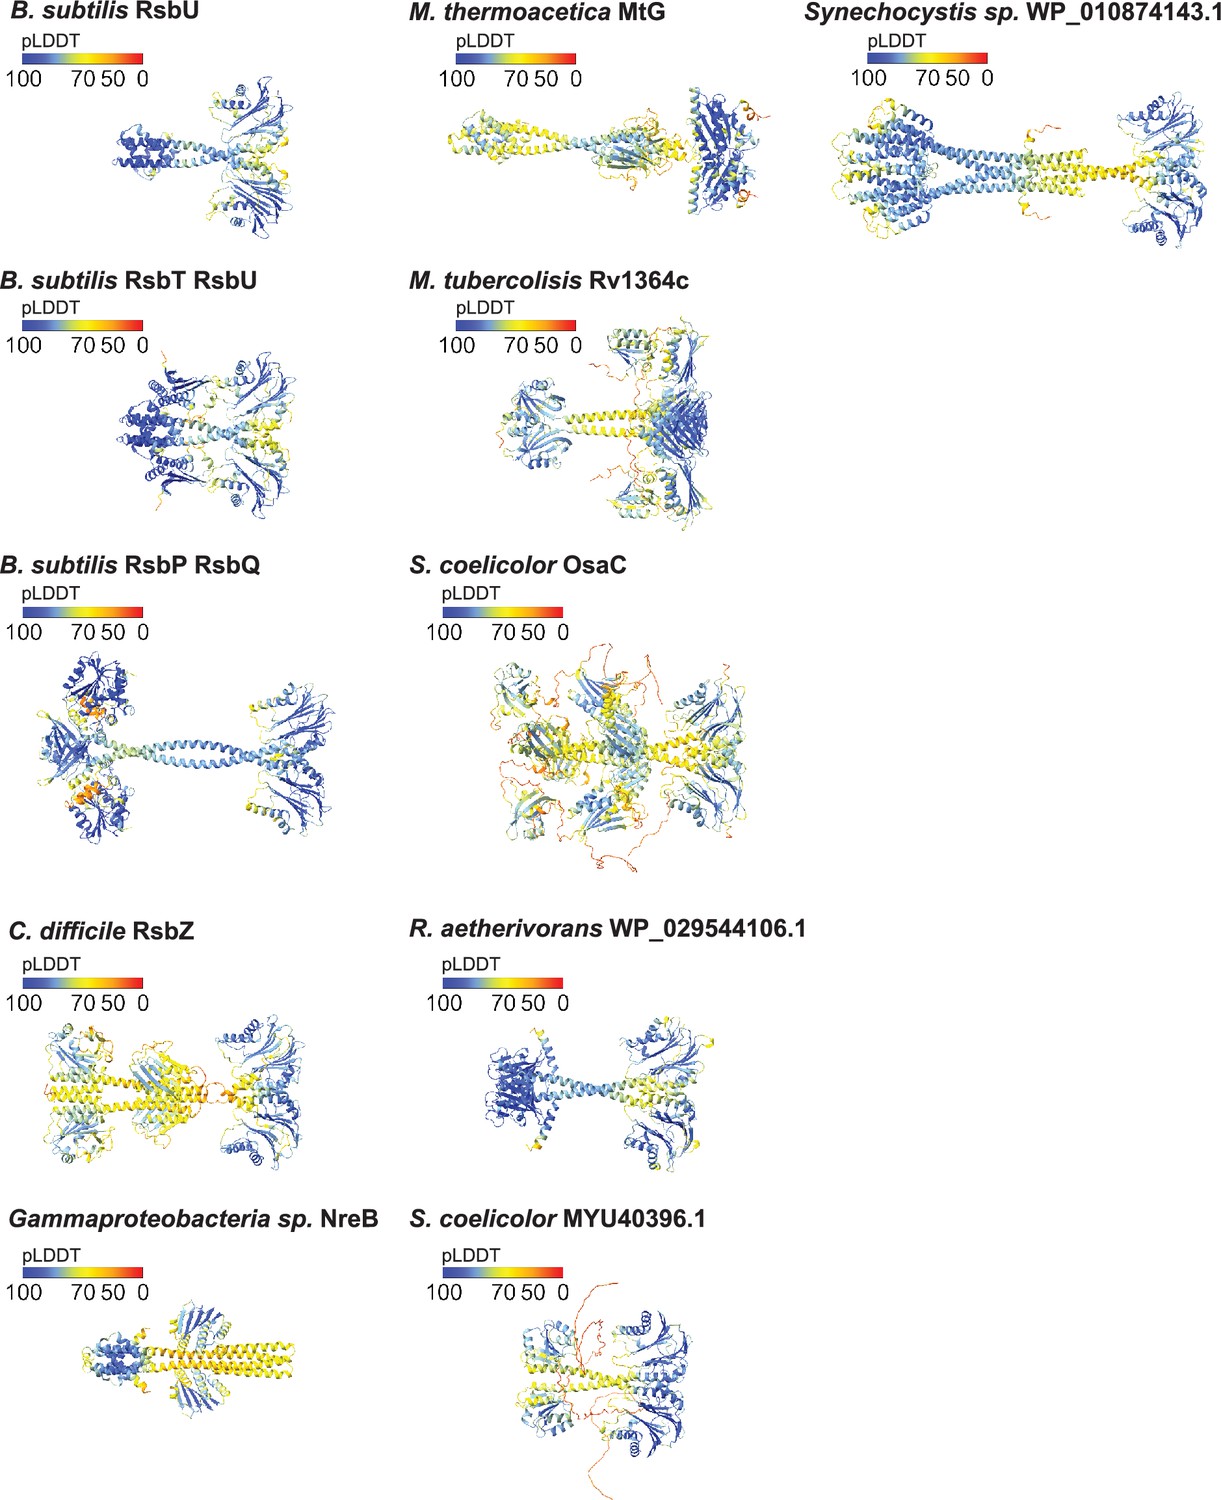
AlphaFold2 structure predictions with mapped pLDDT scores.
Predicted local distance difference test scores (pLDDT) mapped onto the AlphaFold2 structure predictions of the following proteins: B. subtilis RsbU, B. subtilis 2RsbT/2RsbU complex, B. subtilis 2RsbP/2RsbQ complex, C. difficile RsbZ, Gammaproteobacteria sp. NreB, M. thermoacetica MtG, M. tuberculosis Rv1364c, S. coelicolor OsaC, R. aetherivorans WP_029544106.1, S. coelicolor MYU40396.1, and Synechocystis sp. WP_010874143.1. The score key is above each structure model. Blue corresponds to a pLDDT score of 90–100 (high confidence), orange to yellow corresponds to a pLDDT score of 50–70 (medium confidence), and red corresponds to a pLDDT score of 0 (low confidence).
Figure 1—figure supplement 3
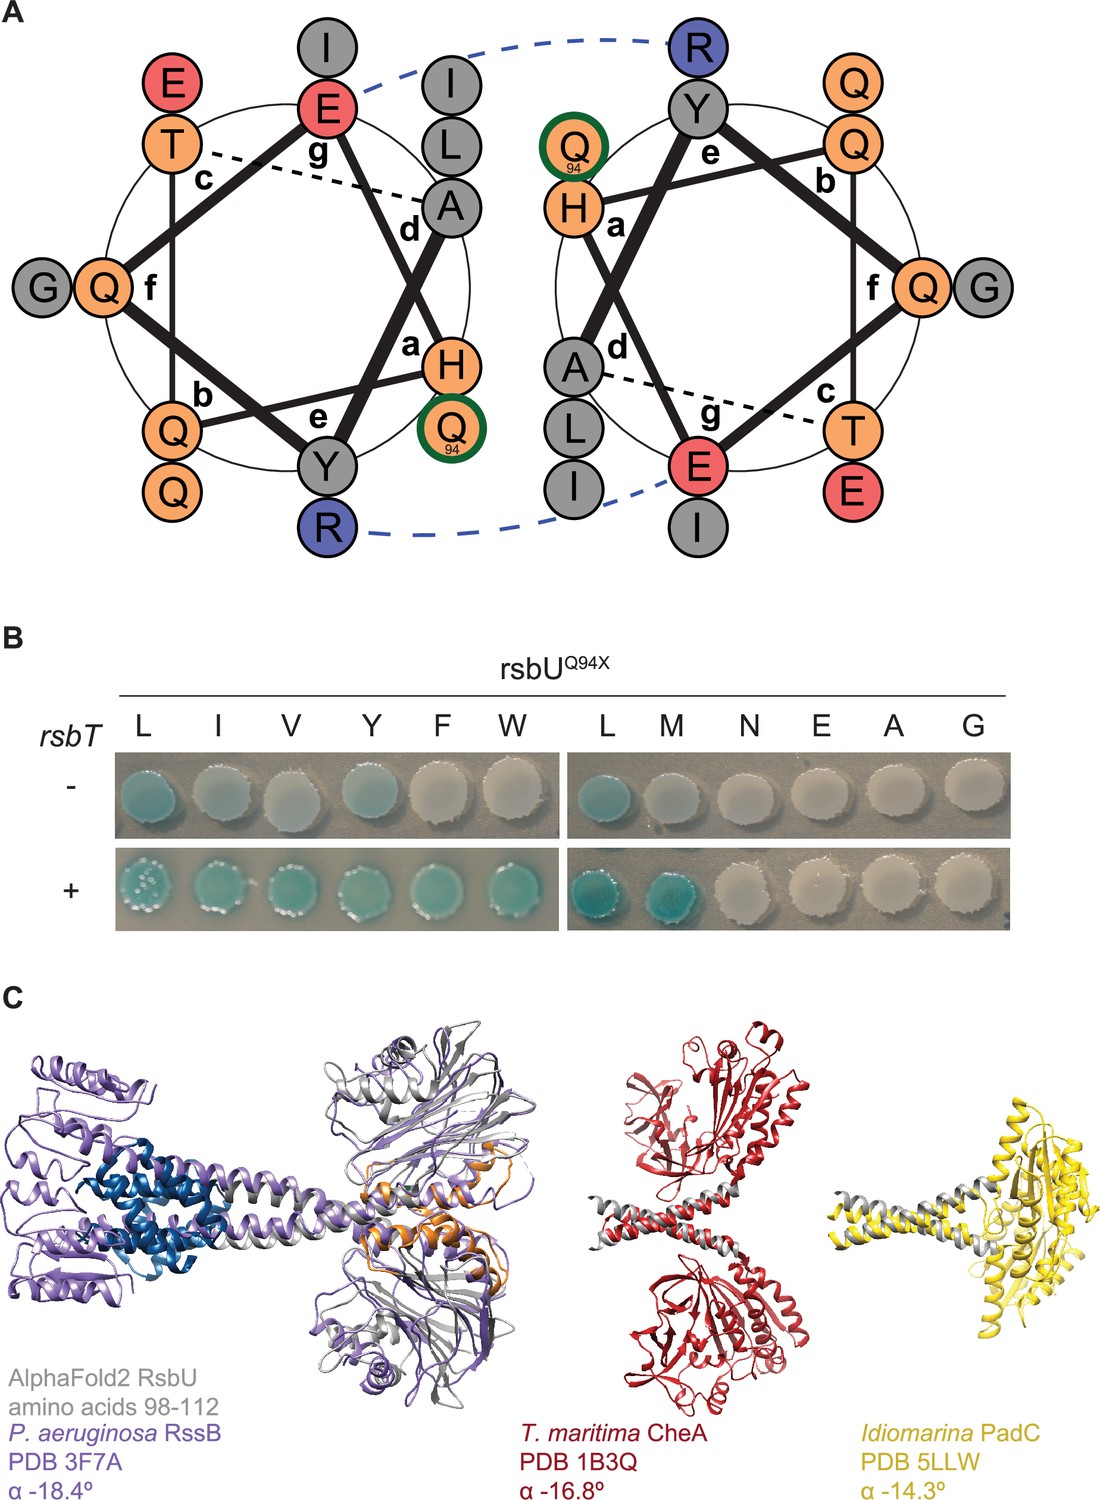
Q94L stabilizes the packing interface of the coiled-coil of the linker.
(A) Coil diagram of RsbU residues 83–97 generated using DrawCoil. Grey circles indicate non-polar residues, orange indicate polar residues, red indicate negatively charged residues, and blue indicate positively charged residues. The blue dashed line depicts a putative salt bridge. Residue Q94 (circled in green) sits in the interface of the coils and is shown packing with L90. (B) An allelic series of amino acid substitutions at position 94 of RsbU was generated in an rsbU expression plasmid. Plasmids were introduced into B. subtilis cells containing a LacZ reporter of σB activity that were deleted for rsbT (top) or with rsbT retained on the chromosome (bottom). Cells were plated on IPTG/X-gal plates to induce rsbU expression and to indicate σB activity (blue pigmentation). (C) α-helical pitch analysis of coiled-coil domains. The AlphaFold2 model of an RsbU dimer is overlayed with crystal structure of P. aeruginosa RssB (PDB 3F7A, purple, left). The helical linker region extending out of the coiled coil (RsbU98-112) is shown (grey) overlaid with T. maritima transducing histidine kinase CheA (PDB 1B3Q, red, middle) and Idiomarina A28L diguanylyl cyclases PadC (PDB 5LLW, yellow, right). α angles from Crick parameterization analysis using CCCP are shown for the overlaid region.
Figure 2

RsbU linker influences RsbT binding and phosphatase activity.
(A) Mean anisotropy of RsbT-TMR (200 nM) is plotted as a function of RsbU concentration. The curves are fits to a quadratic binding equation using non-linear curve fitting (RsbU (black) KD = 4.5 ± 0.96 µM, RsbUQ94L (green) KD = 0.56 ± 0.15 µM). The lower plot shows the same data plotted to display RsbU concentrations to 10 µM. Below is the reaction scheme of RsbT binding to RsbU with the values for the calculated KD below. (B) The rate of dephosphorylation of RsbV-P is plotted as a function of concentration of MnCl2 for RsbU (black) and RsbUQ94L (green) in the presence (dark) and absence (light) of RsbT. Curves are fits to the Michaelis-Menten equation using non-linear curve fitting. The kcat of wild-type RsbU is 15±0.35 min–1 with RsbT and 1.4±0.077 min–1 without RsbT and the kcat of RsbUQ94L is 9.0±0.64 min–1 with RsbT and 2.4±0.084 min–1 without RsbT. The KMMnCl2 of wild-type RsbU is 0.98±0.069 mM with RsbT and 77±9.0 mM without RsbT and the KMMnCl2 of RsbUQ94L is 1.4±0.19 mM with RsbT and 1.9±0.56 mM without RsbT. The lower plot shows the data for wild-type RsbU in the absence of RsbT shown in the upper plot including higher MnCl2 concentrations and with rescaled Y-axis. Below is a summary of a reaction scheme of RsbU dephosphorylating RsbV-P (denoted as S) with the KMMnCl2 and kcat values below. Data for RsbU are reproduced from Ho and Bradshaw, 2021. (C) A cartoon model of how the switch helices rotate to activate RsbU. Binding of RsbT or mutation moves the switch helices into place during activation to coordinate metal M2. The residues of RsbU that are hypothesized to coordinate metals are shown as sticks (based on homology to RsbX).
Figure 3 with 1 supplement

RsbT has a hybrid interface with RsbU N-terminal dimerization domain and linker.
(A) An AlphaFold2 model of a heterotetrameric 2RsbT/2RsbU complex is shown in ribbon representation. RsbT (purple) binds with an interface that spans the N-terminal domains (blue) and α-helical linkers (grey) of both RsbU protomers. The PPM phosphatase domains are colored grey and the regulatory switch elements (α1 and α2) are colored orange. The Cα positions of RsbUY28 (red), rsbUY28I suppressor substitutions (green), RsbUR91 (dark pink), and RsbTD92 (pink) are shown as spheres with the residue numbers indicated. (B) Strains with a σB LacZ reporter were plated on IPTG/X-gal plates to induce expression of plasmid borne rsbT and rsbUY28I and visualize σB activity (indicated by blue pigmentation after 24 hr of growth at 37 °C). Additional amino acid substitutions in the rsbU gene are indicated above. (C) Strains with indicated changes to the RsbT and RsbU amino acid sequence were plated as in (B) and plates were imaged after 36 hr of growth at 37 °C. (D) R91E does not decrease the basal phosphatase activity of RsbU. Plots show dephosphorylation of RsbV-P (25 µM) by RsbU (black) and RsbUR91E (pink) (0.5 µM) in the presence of 10 mM MnCl2 and the presence or absence of 10 µM RsbT (light colors). Linear fits of the data are shown, with the slopes indicating the observed rates (kobs): RsbU 0.0206±0.00124 min–1, RsbU +RsbT 10.0±0.628 min–1, RsbUR91E is 0.0379±0.00543 min–1, RsbUR91E + RsbT 0.142±0.0161 min–1. The lower plot is RsbU in the presence of RsbT to 30 min.
Figure 3—figure supplement 1

RsbT binds to the linker.
Interface of RsbT and N-terminal domain of RsbU. A ribbon representation is shown of the AlphaFold2 model of the heterotetrameric 2RsbT/2RsbU complex with RsbU N-terminal dimerization domain colored blue, the switch element of the PPM domain (α1 and α2) colored orange, and RsbT colored purple. The Cα of positions of amino acids implicated in the binding interface of RsbT and RsbU N-terminal dimerization domain (Hardwick et al., 2007) are represented on the AlphaFold2 structure as yellow spheres (RsbU) and green spheres (RsbT) with the residue numbers.
Figure 4 with 4 supplements

RsbU linker is flexible in the absence of RsbT, and is rigidified by RsbT binding.
(A) I(q) versus q plot of the dimer component of SAXS scattering data from RsbU (blue) overlaid with a FoXS generated profile fit of the AlphaFold2 RsbU dimer structure (red). The lower plot shows the uncertainty normalized residuals of the fit ((experimental-computed)/error), χ2 of 12.53. (B) Dimensionless Kratky plot of SAXS scattering data from the dimer component of RsbU experimental data (blue). The experimental profile was logarithmically binned to reduce noise at high qRg. (C) Normalized P(r) plot from the RsbU dimer (blue) and heterotetrameric RsbT/RsbUQ94L complex (light blue) is shown. (D) I(q) versus q plot of the dimer component of SAXS scattering data from RsbU (blue) is shown overlaid with a MultiFoXS generated two-state profile fit with flexibility allowed for residues 82–96 (pink). The lower plot shows the uncertainty normalized residuals of the fit ((experimental-computed)/error), χ2 of 1.2. (E) Dimensionless Kratky plot of the heterotetrameric component of RsbT/RsbUQ94L complex is shown binned logarithmically to reduce noise at high qRg values. (F) I(q) versus q plot of the heterotetrameric RsbT/RsbUQ94L complex (blue) overlaid with a FoXS generated profile fit of the AlphaFold2 RsbT/RsbU heterotetramer structure (red). The lower plot shows the uncertainty normalized residuals of the fits ((experimental-computed)/error), χ2 of 1.83. (G) Schematic of the conformational change of RsbU upon RsbT binding. The two best fit flexible models of RsbU generated from MultiFoXS in panel (B) are shown with the calculated Rg and percentage of each model used in the fit. Squiggly arrows are shown to indicate that these models are approximate and likely represent an average of many flexible conformations.
Figure 4—figure supplement 1
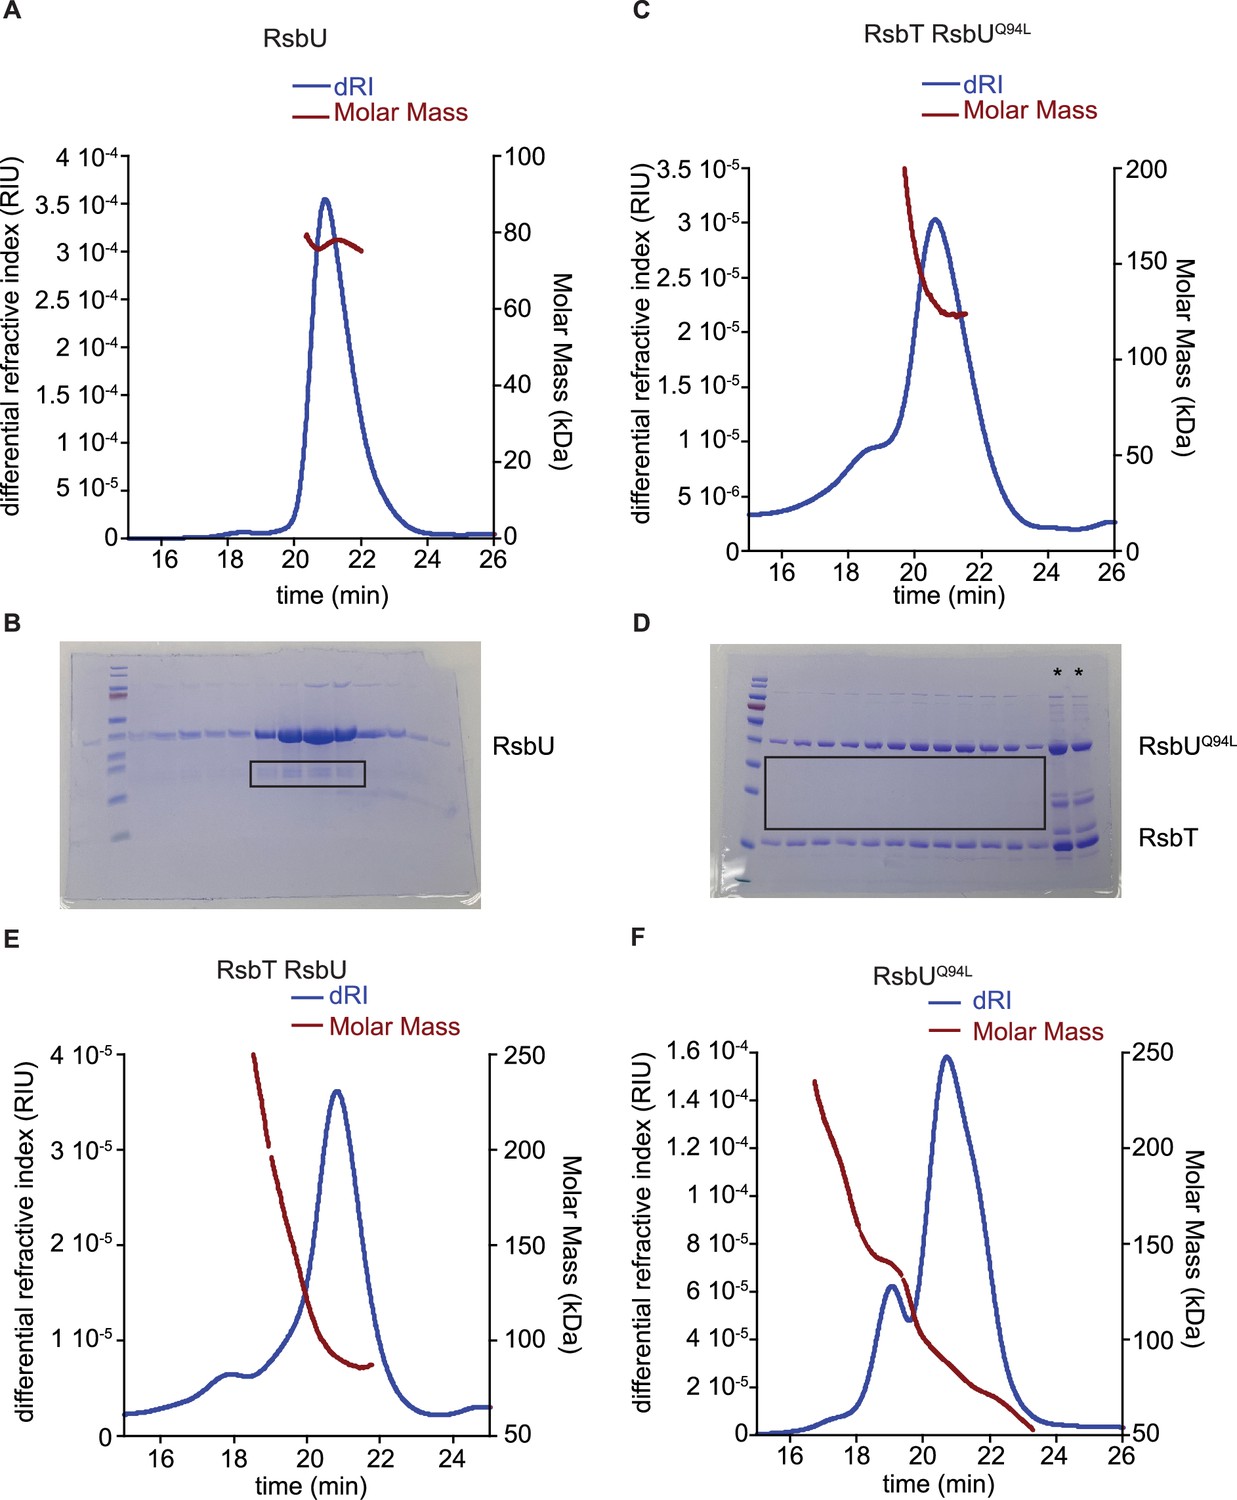
MALS estimate of molecular weight of RsbU dimer, RsbT/RsbUQ94L complex, RsbT/RsbU complex, and RsbUQ94L.
(A) Plot of inline SEC-MALS analysis of RsbU with measured differential refractive index (blue, left axis) and the molecular weight calculated from MALS (red, right axis). (B) Denaturing SDS-PAGE gel of successive fractions from the equivalent range of the elution as shown in (A) from preparative size exclusion chromatography of the sample of RsbU used for SEC-MALS-SAXS. Black box denotes the C-terminal truncation product present in each lane of the main peak. Benchmark prestained molecular weight marker is shown on the left with bands 180, 115, 82, 64 (red), 49, 37, 26, 19, 15, 6 kDa. (C) Plots from inline SEC-MALS analysis of RsbT/RsbUQ94L complex with measured differential refractive index (blue, left axis) and the molecular weight calculated from MALS (red, right axis). (D) Denaturing SDS-PAGE gel of successive fractions from the equivalent range of the elution of RsbT/UQ94L as shown in (C) from preparative size exclusion chromatography of the sample used for SEC-MALS-SAXS. Black box denotes lack of C-terminal truncation product during co-expression and purification of RsbT/RsbUQ94L complex. * Denotes load samples on gel. Benchmark prestained molecular weight marker is shown on the left with bands 180, 115, 82, 64 (red), 49, 37, 26, 19, 15, 6 kDa. (E) Plots from inline SEC-MALS analysis of RsbT/U complex with measured differential refractive index (blue, left axis) and the molecular weight calculated from MALS (red, right axis). (F) Plot inline SEC-MALS analysis of RsbUQ94L with measured differential refractive index (blue, left axis) and the molecular weight calculated from MALS (red, right axis).
-
Figure 4—figure supplement 1—source data 1
Original uncropped images of the gels shown in Figure 4—figure supplement 1B and D.
- https://cdn.elifesciences.org/articles/100376/elife-100376-fig4-figsupp1-data1-v1.pdf
-
Figure 4—figure supplement 1—source data 2
Original image files for the gels shown in Figure 4—figure supplement 1B and D.
- https://cdn.elifesciences.org/articles/100376/elife-100376-fig4-figsupp1-data2-v1.zip
Figure 4—figure supplement 2
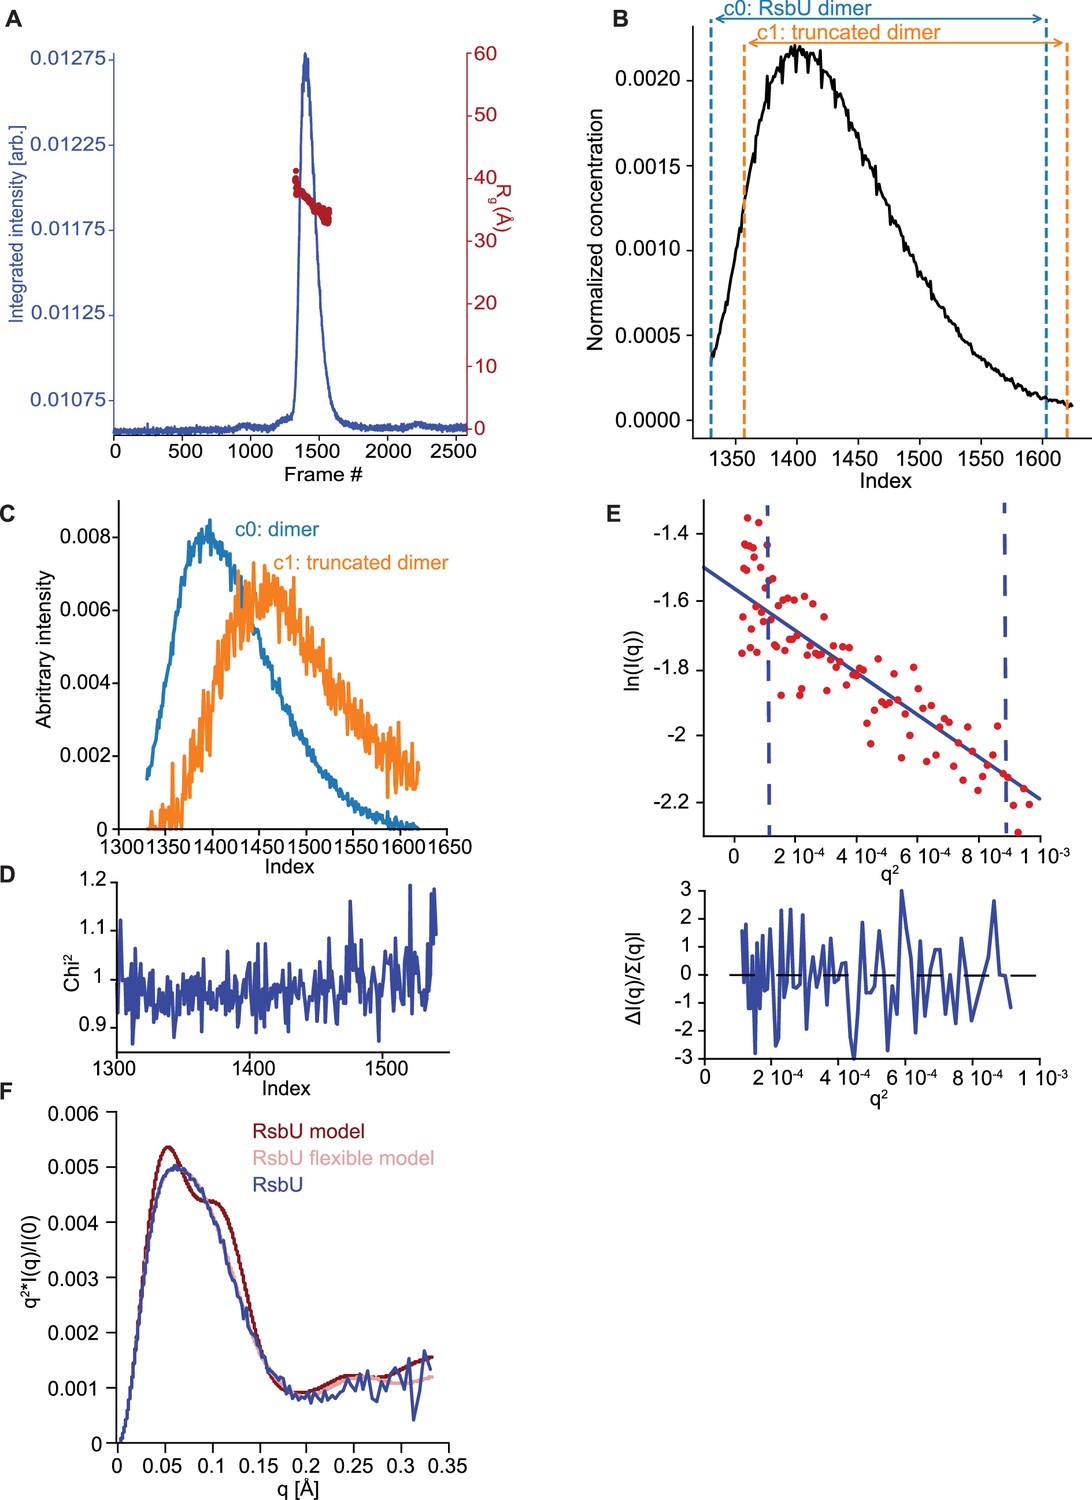
EFA deconvolution and Guinier analysis of RsbU dimer SAXS profiles.
(A) SAXS data summary for RsbU. Series intensity (blue, left axis) versus frames, and Rg versus frame (red, right axis) are plotted. (B) The selected intensity range for EFA (black; frame index 1330–1620), and the individual component ranges for deconvolution; blue denotes the range of frames where the scattering component we assigned as the c0, RsbU dimer, was detected (frame index 1330–1603) and orange denotes the range of frames where the scattering component that is c1, presumably from a RsbU heterodimer containing a c-terminal truncation product dimer (frame index 1357–1620). (C) Area normalized concentration profiles for the c0, RsbU dimer component (blue) and c1, RsbU heterodimer containing c-terminal truncation product dimer (orange). (D) Mean χ2 values for the fit of the EFA deconvolution to the original scattering data. (E) Guinier fit for RsbU dimer component on the upper plot and uncertainty normalized residuals of the fit on the lower plot. The scattering data for the dimer component (red) is fit to the Guinier approximation (blue). The blue dashed lines are the qmin and qmax at values 0.00356 Å–1 and 0.0234 Å–1, respectively. (F) Kratky plot of SAXS scattering data from the dimer component of RsbU experimental data (blue) overlaid with the profile computed by FoXS based on the AlphaFold2 model of an RsbU dimer (red) and the profile of the flexible model computed by MultiFoXS (pink). The experimental profile was logarithmically binned to reduce noise at high q.
Figure 4—figure supplement 3

Varying constraints and flexibility of RsbU model.
(A) I(q) versus q plot of the dimer component of SAXS scattering data from RsbU (blue) overlaid with a MultiFoXS generated two-state profile fit with flexibility allowed for residues 82–86 (pink). The upper plot shows I(q) versus q on log-linear axes while the lower plot shows the uncertainty normalized residuals of the fit ((experimental-computed)/error), χ2 of 1.26. (B) I(q) versus q plot of the dimer component of SAXS scattering data from RsbU (blue) overlaid with a MultiFoXS generated two-state profile fit with flexibility allowed for residues 82–92 (pink). The upper plot shows I(q) versus q on log-linear axes while the lower plot shows the uncertainty normalized residuals of the fit ((experimental-computed)/error), χ2 of 1.25. (C) I(q) versus q plot of the dimer component of SAXS scattering data from RsbU (blue) overlaid with a MultiFoXS generated two-state profile fit with flexibility allowed for residues 92–99 (pink). The upper plot shows I(q) versus q on log-linear axes while the lower plot shows the uncertainty normalized residuals of the fit ((experimental-computed)/error), χ2 of 1.26. (D) I(q) versus q plot of the dimer component of SAXS scattering data from RsbU (blue) overlaid with a MultiFoXS generated two-state profile fit with flexibility allowed for residues 82–96 (pink) and the C-terminal domains constrained. The upper plot shows I(q) versus q on log-linear axes while the lower plot shows the uncertainty normalized residuals of the fit ((experimental-computed)/error), χ2 of 5.4.
Figure 4—figure supplement 4
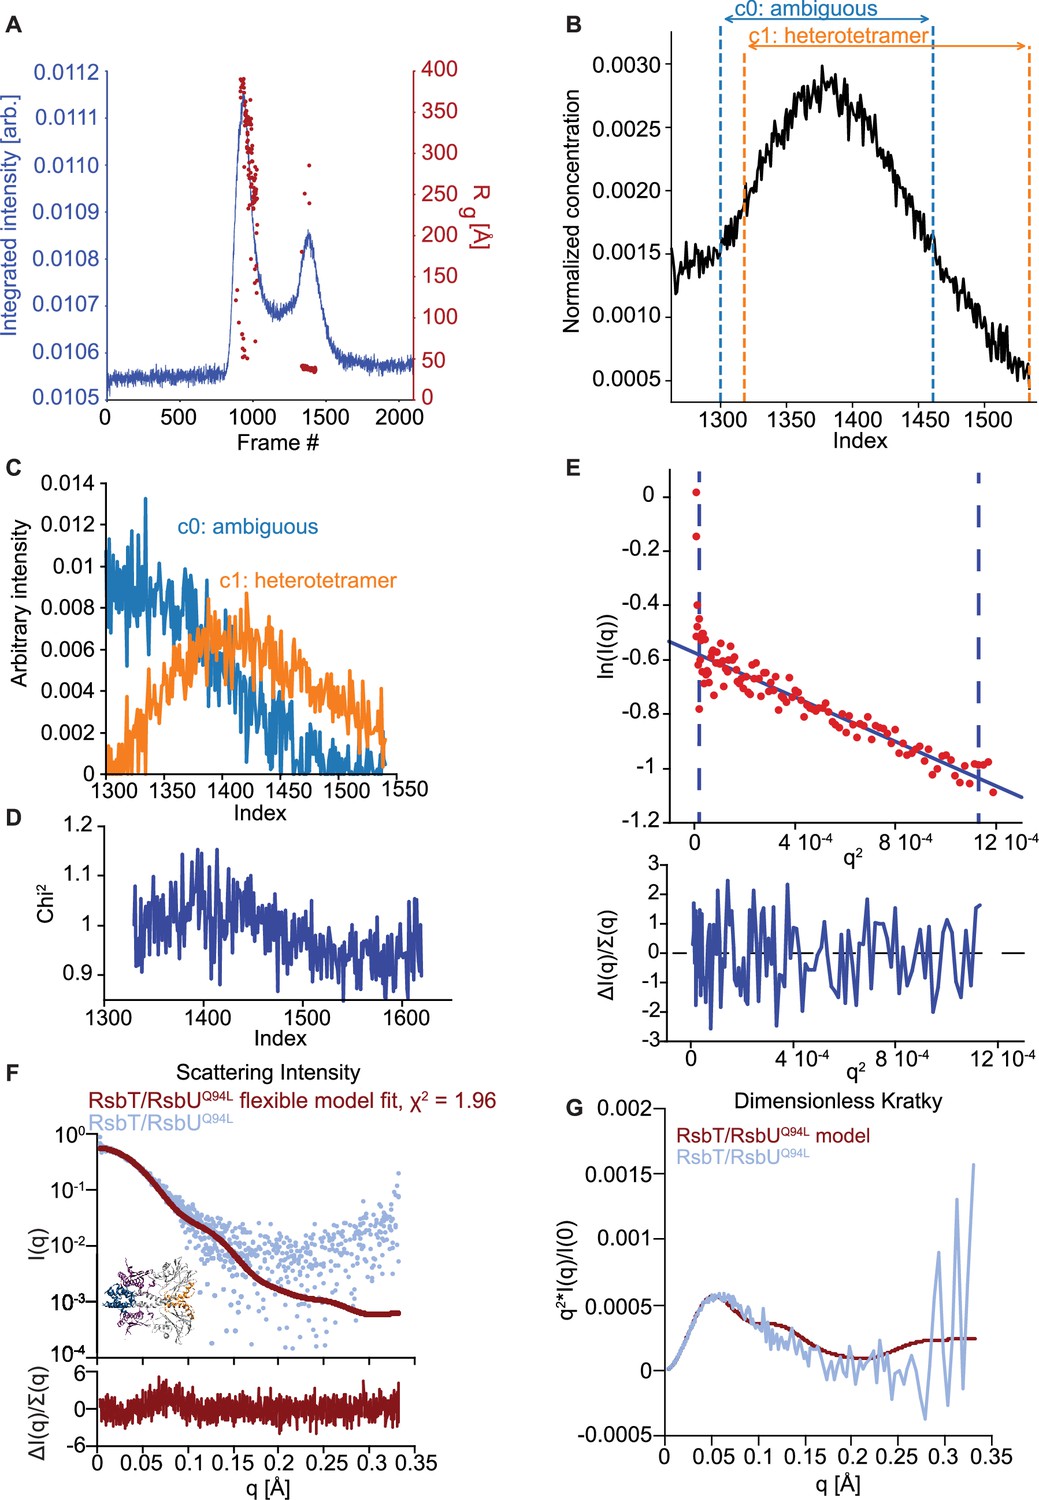
EFA deconvolution and Guinier analysis of RsbT/RsbUQ94L SAXS profiles.
(A) SAXS data summary for RsbT/RsbUQ94L. Series intensity (blue, left axis) versus frames, and Rg versus frame (red, right axis) are plotted. (B) The selected intensity range for EFA (black) (frame index 1300–1540), and the individual component ranges for deconvolution; blue denotes the range of frames where the scattering component we assigned as c0, ambiguous component, was detected (1300–1461) and orange denotes the range of frames where the scattering component we assigned as c1, the 2RsbT/2RsbUQ94L heterotetrametric complex, was detected (1318–1540). (C) Area normalized concentration profiles for 2RsbT/2RsbUQ94L heterotetrameric complex (orange) and ambiguous component (blue). (D) Mean χ2 values for the EFA deconvolution fit to the original scattering data. (E) Guinier fit for 2RsbT/2RsbUQ94L heterotetrameric complex component on the upper plot and uncertainty normalized residuals of the fit on the lower plot. The scattering data for the dimer component (red) is fit to the Guinier approximation (blue). The blue dashed lines are the qmin and qmax at values 0.0033 Å–1 and 0.0336 Å–1, respectively. (F) I(q) versus q plot of the heterotetrameric complex component of SAXS scattering data from 2RsbT/2RsbU (blue) overlaid with a MultiFoXS generated two-state profile fit with flexibility allowed for residues 82–96 (red). The upper plot shows I(q) versus q on log-linear axes while the lower plot shows the uncertainty normalized residuals of the fit ((experimental-computed)/error), χ2 of 1.96. The one-state flexible model is shown with a RMSD to the AlphaFold2 prediction of 2RsbT/2RsbU of 1.36 Å. (G) Kratky plot of SAXS scattering data from the heterotetrameric component of 2RsbT/2RsbU experimental data (blue) overlaid with the profile computed by FoXS based on the AlphaFold2 model of an RsbT/RsbU heterotetramer (red). The experimental profile was logarithmically binned to reduce noise at high q.
Figure 5 with 2 supplements
An exchangeable toolkit for bacterial signal transduction.
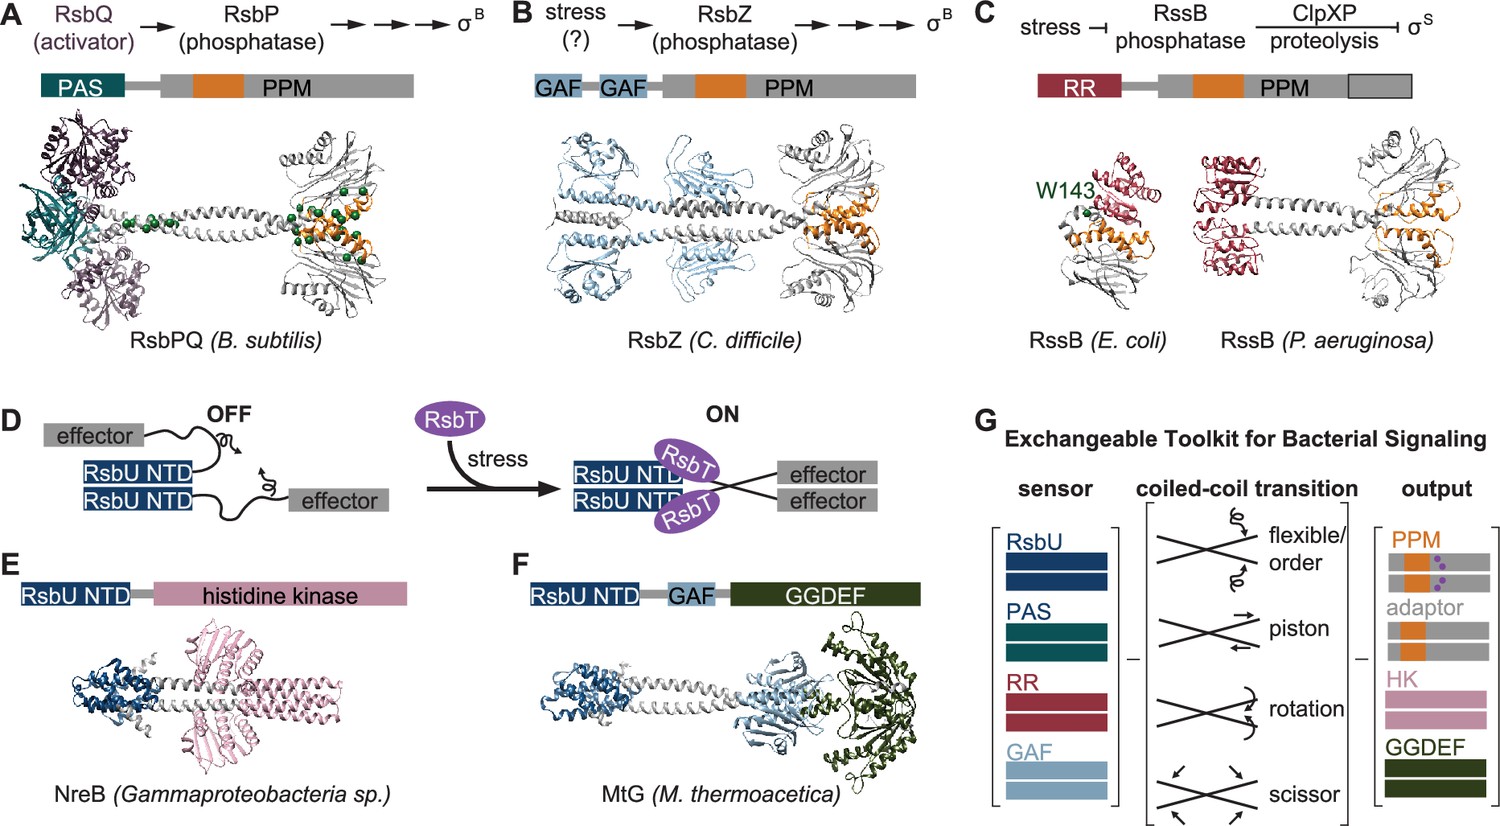
(A) An AlphaFold2 model of the B. subtilis energy stress phosphatase RsbP is shown bound to its activating α/β-hydrolase protein RsbQ (purple) with a schematic of the σB activation pathway shown above. RsbP has an N-terminal PAS domain (turquoise) that is connected to the PPM phosphatase domain by a predicted coiled coil linker. The Cα positions of bypass suppressor mutations that render RsbP active in the absence of RsbQ (Brody et al., 2009) are shown as green spheres. The switch element of the PPM phosphatase domain (α1 and α2) is colored orange. (B) An AlphaFold2 model of the C. difficile GSR phosphatase RsbZ is shown with a schematic of the σB activation pathway shown above. RsbZ has tandem N-terminal GAF domains (blue) that connect to the PPM phosphatase domain by a predicted coiled coil linker. The switch element of the PPM phosphatase domain (α1 and α2) is colored orange. (C) Experimental structures of the GSR initiating adaptor protein RssB from E. coli (left, 8T85) and P. aeruginosa (right, 3F7A) are shown with a schematic of the σS activation pathway shown above. The Cα positions of a bypass suppressor mutation (W143R) that renders RssB insensitive to anti-adapter proteins is shown as a green sphere. The switch element of the PPM phosphatase domain (α1 and α2) is colored orange. The black outline shows the portion of the PPM phosphatase domain that is missing in the E. coli RssB adaptor protein, which lacks phosphatase activity. (D) A cartoon schematic of activation by RsbT of proteins with RsbU NTD through ordering of a flexible linker. The protein is depicted with dimerized RsbU N-terminal dimerization domains (blue) with flexible linkers (black) that extend into two effector domains (grey). During stress conditions, RsbT (purple) activates the protein through binding to the N-terminal dimerization domains and linkers, rigidifying the linkers to dimerize the effector domains. (E) An AlphaFold2 model of a dimer of the histidine kinase NreB from a Gammaproteobacteria species (MBI3545564.1) is shown with the RsbU N-terminal domain colored blue and the histidine kinase domain colored pink. (F) An AlphaFold2 model of a dimer of the GGDEF diguanylate cyclase MtG from M. thermoacetica (WP_011392981.1) is shown with RsbU N-terminal domain colored blue, GAF domain colored lite blue, and GGDEF domain colored green. (G) Schematic illustrating how various sensor domains (RsbU N-terminal dimerization domain, PAS, response receiver (RR), and GAF) can control various output activities serine/threonine phosphatase (PPM), histidine kinase (HK), protease adaptor, and diguanylate cyclase (GGDEF). We hypothesize that the shared regulatory mechanism through a dimeric coiled-coil linker makes these regulatory domains modularly exchangeable across effector domains. Known mechanisms for how allosteric regulation is transmitted through the linker are listed and shown with arrow diagrams.
Figure 5—figure supplement 1
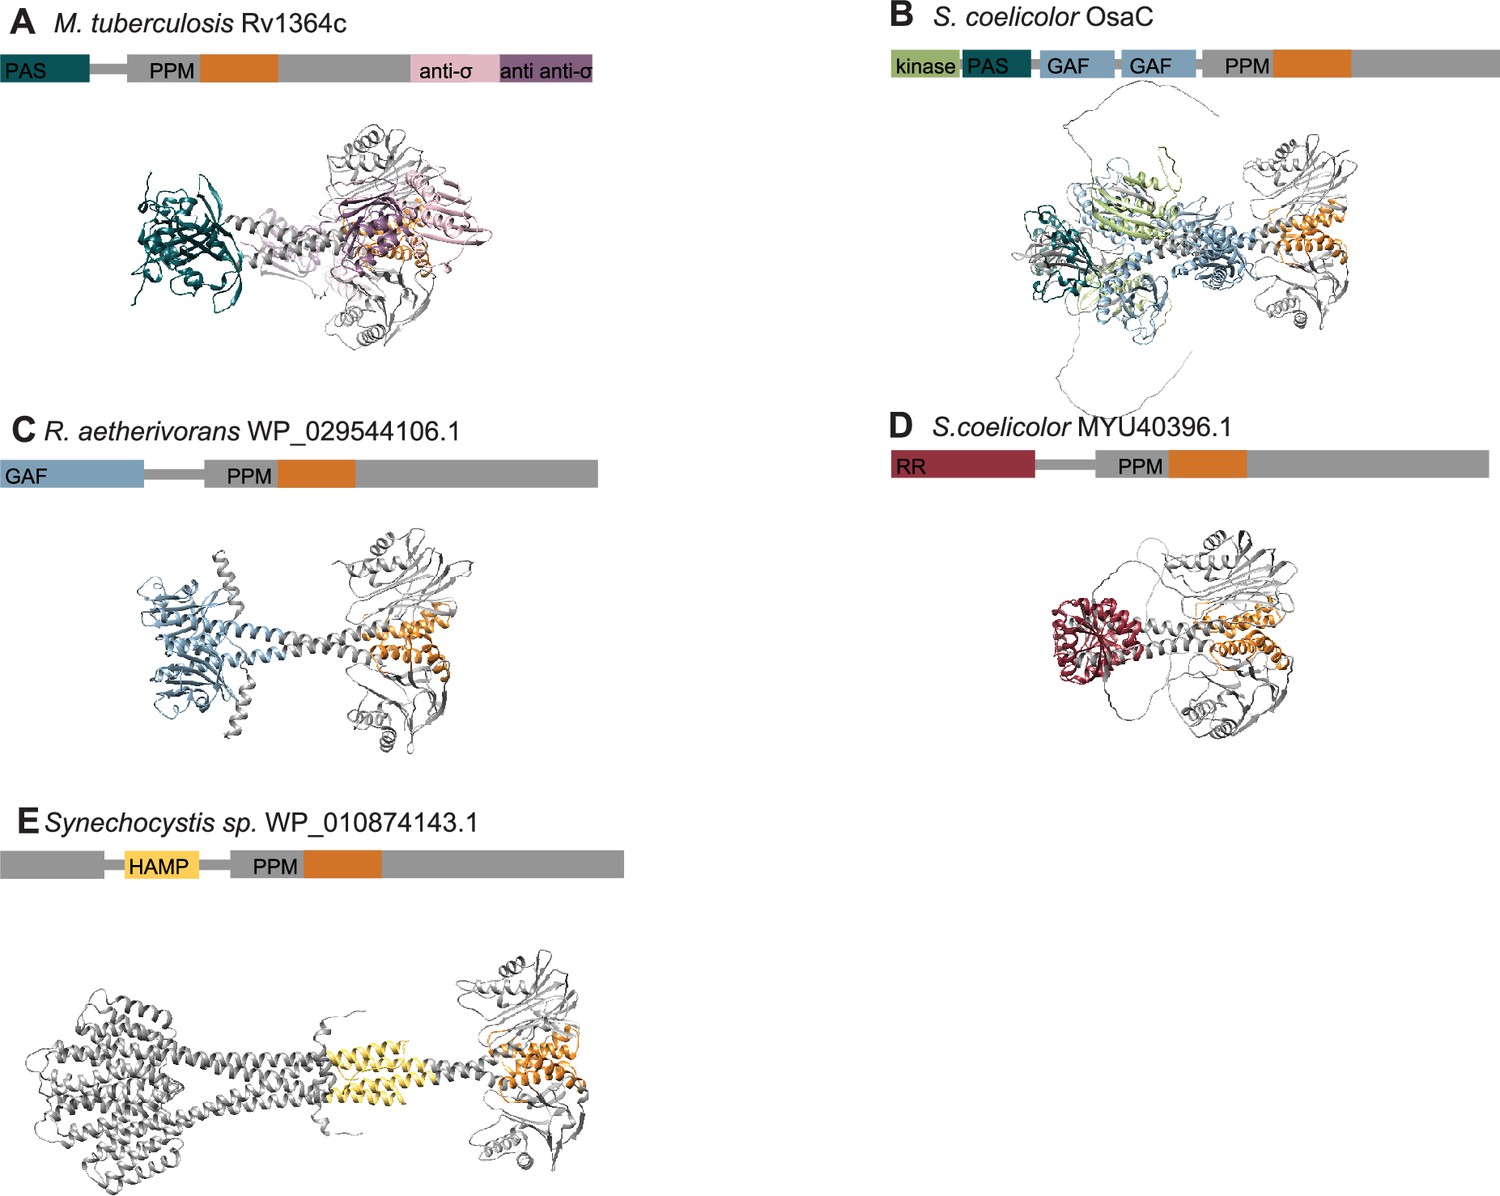
AlphaFold2 predictions of varying signaling PPM phosphatases.
(A) An AlphaFold2 model of the M. tubercolisis GSR phosphatase Rv1364c is shown with a N-terminal PAS domain colored turquoise that connects to the PPM phosphatase domain colored grey, an anti-σ domain (related to RsbW) colored pink and an anti-anti-σ domain (related to RsbV) colored purple. The switch element of the PPM phosphatase domain (α1 and α2) is colored orange. (B) An AlphaFold2 model of the S. coelicolor OsaC GSR phosphatase is shown with a N-terminal RsbW-like kinase domain colored in green, connected to a PAS domain colored in turquoise, tandem GAF domains colored in blue, and a PPM phosphatase colored in grey. The switch element of the PPM phosphatase domain (α1 and α2) is colored orange. (C) An AlphaFold2 model of a dimer of the phosphatase from R. aetherivorans (WP_029544106.1) is shown with the GAF domain colored in blue connected to the PPM phosphatase colored in grey. The switch element of the PPM phosphatase domain (α1 and α2) is colored orange. (D) An AlphaFold2 model of a dimer of the phosphatase from S. coelicolor (MYU40396.1) is shown with the response receiver domain colored in red connected to the PPM phosphatase colored in grey. The switch element of the PPM phosphatase domain (α1 and α2) is colored orange. (E) An AlphaFold2 model of a dimer of the phosphatase from Synechocystis species (WP_010874143.1) is shown with the HAMP domain colored in yellow connected to the PPM phosphatase colored in grey. The switch element of the PPM phosphatase domain (α1 and α2) is colored orange. The structure models in all panels are shown aligned by the top PPM domain to highlight the conservation of the PPM dimer in predictions of dimeric phosphatases with diverse regulatory domains.
Figure 5—figure supplement 2
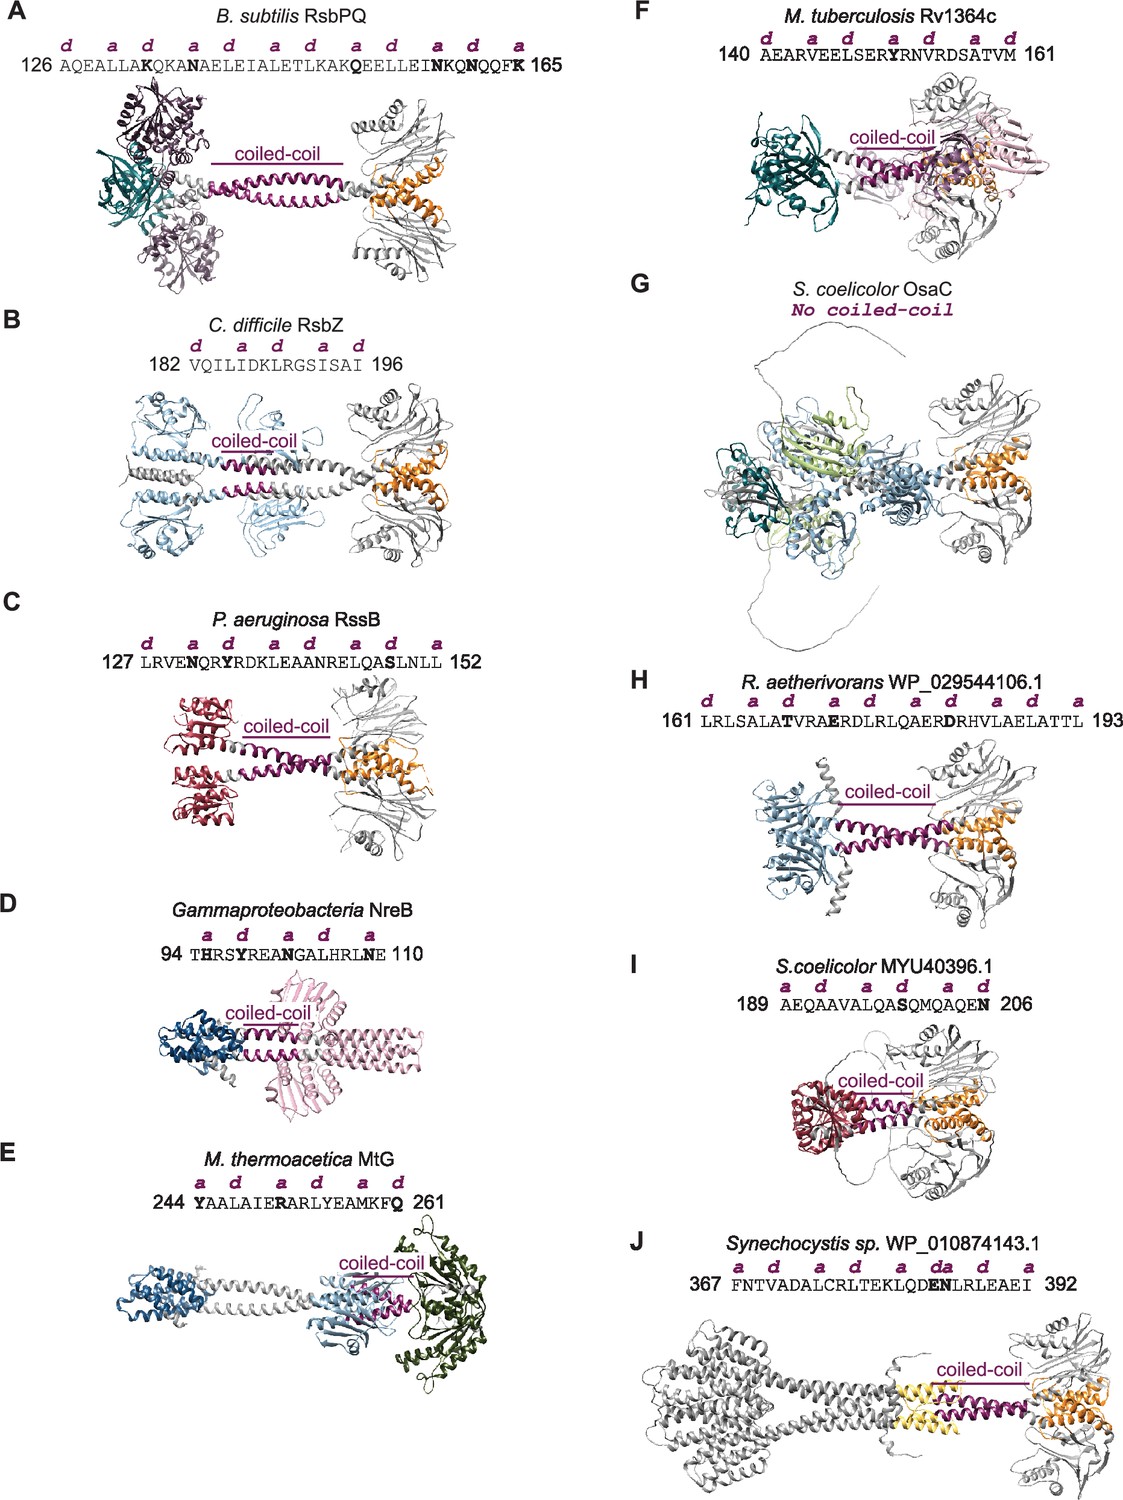
Coiled-coil analysis of structures of bacterial signaling enzymes.
Models of selected phosphatases are shown (A) heterotetramer of RsbPQ from B. subtilis; (B) RsbZ from C. difficile; (C) RssB from P. aeruginosa (PDB: 3EQ2); (D) NreB from Gammaproteobacteria; (E) MtG from M. thermoacetica; (F) Rv1364c from M. tuberculosis; (G) OsaC from S. coelicolor; (H) WP_029544106.1 from R. aetherivorans; (I) MYU40396.1 from S. coelicolor; (J) WP_010874143.1 from Synechocystis sp. Coiled-coil sequences identified by Socket2 are shown above the model with the non-polar positions of a and d shown in pink above the sequence. Polar residues at the a and d positions are in bold. The coiled-coil region on the model is shown in pink, the switch helices of the PPM domains are shown in orange, and the various regulatory domains are shown in the following colors: RsbU NTD (blue), PAS (green), GAF (light blue), response receiver (red), and HAMP (yellow).
Tables
Table 1
SAXS experimental details.
| (a) Sample details | ||
| RsbU SASDU85 | RsbUQ94L/RsbT SADSDU95 | |
| Organism | B. subtilis | B. subtilis |
| Description: | RsbU (1-335) Uniprot ID: P40399 GPG scar from 6His cleavage | RsbUQ94L (1-335) Uniprot ID: P40399; RsbT (1-133) Uniprot ID: P42411, 6His with 3 C cleavage site |
| Extinction coefficient ε (280 nm) | 26,820 M–1cm–1 | RsbUQ94L: 26,820 M–1cm–1 RsbT: 13,980 M–1cm–1 |
| Molecular mass M from chemical composition | 38.6 kDa | RsbT: 14.3 kDa RsbUQ94L: 38.6 kDa |
| For SEC-SAX, loading volume/concentration injection volume, flow rate | 3.5 mg ml–1 300 µl, 0.6 ml min–1 | 2.5 mg ml–1 300 µl, 0.6 ml min–1 |
| Solvent composition and source | 20 mM HEPES pH 7.5, 100 mM NaCl, 5 mM DTT | 20 mM HEPES pH 7.5, 100 mM NaCl, 5 mM DTT |
| (b) SAX data collection parameters | ||
| Source, instrument and description | BioCAT facility at the Advanced Photon Source beamline 18ID with Pilatus3 X1 M (Dectris) detector | |
| Wavelength | 1.033 Å | |
| Beam size (μm2) | 150 (h) x 25 (v) focused at the detector | |
| Camera length | 3.682 m | |
| q-measurement range | 0.0027–0.33 Å–1 | |
| Absolute scaling method | Glassy Carbon, NIST SRM 3600 | |
| Basis for normalization to constant counts | To transmitted intensity by beam-stop counter | |
| Method for monitoring radiation damage | Automated frame-by-frame comparison of relevant regions using CORMAP algorithm (Franke et al., 2015) implemented in BioXTAS RAW | |
| Exposure time | 0.5 s exposure time with a 1 s total exposure period (0.5 s on, 1.5 s off) of entire SEC elution | |
| Sample configuration | SEC-MALS-SAXS. Size separation used a Superdex 200 10/300 Increase GL column and a 1260 Infinity II HPLC (Agilent Technologies). UV data was measured in the Agilent, and MALS-DLS-RI data by DAWN HELEOS-II (17 MALS +1 DLS channels) and Optilab T-rEX (RI) instruments (Wyatt Technology). SAXS data was measured in a sheath-flow cell (Kirby et al., 2016), effective path length 0.542 mm. | |
| Sample temperature | 22 °C | |
| (c) Software employed for SAXS data reduction, analysis and interpretation | ||
| MALS-DLS-RI analysis | Astra 7 (Wyatt) | |
| SAX data reduction | Radial averaging; frame comparison, averaging, and subtraction done using BioXTAS RAW 2.1.4 (Hopkins et al., 2017). Deconvolution of overlapping peaks by EFA (Meisburger et al., 2016) as implemented in RAW. | |
| Basic analyses: | Guinier fit and molecular weight using BioXTAS RAW 2.1.4, P(r) function using GNOM (Svergun, 1992). RAW uses MoW and Vc molecular weight methods (Rambo and Tainer, 2011; Piiadov et al., 2019) ATSAS Version 3.2.1 (Manalastas-Cantos et al., 2021). | |
| FoXS | Calculated predicted scattering profiles from the model (FoXS) (Schneidman-Duhovny et al., 2013; Schneidman-Duhovny et al., 2016) | |
| MultiFoxS | Calculated predicted scattering profiles from the multicomponent fits from a generated flexible structure ensemble (MultiFoXS) (Schneidman-Duhovny et al., 2016) | |
| (d) Structural parameters | ||
| Figure 4 components | c0: RsbU dimer | c1: 2T/2UQ94L heterotetramer |
| Guinier Analysis | ||
| I(0) (Arb.) | 5.632±0.008 | 0.564±0.003 |
| Rg | 39.05±0.16 Å | 35.06±0.43 Å |
| q-range | 0.0036–0.0234 Å–1 | 0.0033–0.0336 Å–1 |
| qmaxRg | 0.916 | 1.178 |
| Coefficient of correlation, r2 | 0.995 | 0.88 |
| Volume (adjusted VP as SAXS MoW2) | 116000 Å3 | 124000 Å3 |
| MW, MoW2 method (ratio to expected) | 96.2 kDa (1.25) | 103.2 kDa (0.98) |
| MW, Vc method (kDa) (ratio to expected) | 75.6 kDa (0.98) | 83.9 kDa (0.80) |
| P(r) analysis | ||
| I(0) (Arb.) | 5.648±0.007 | 0.561±0.003 |
| Rg | 39.98±0.12 Å | 34.87±0.36 Å |
| Dmax | 168 Å | 176 Å |
| q-range | 0.0035–0.3327 Å–1 | 0.005–0.3327 Å–1 |
| χ2 (total estimate from GNOM) | 1.257 (0.729) | 1.374 (0.691) |
| FoXS | ||
| Rg | 34.05 Å | 33.68 Å |
| χ2 | 12.53 | 1.83 |
| c1 | 1.02 | 1.04 |
| c2 | 1.91 | –1.77 |
| MultiFoXS | ||
| # of conformations | 10,000 | 10,000 |
| flexible residues | 82–96 | 82–96 |
| # of states | 2 | 1 |
| Rg | 34.91 Å (71%) 45.69 Å (29%) | 33.28 Å |
| χ2 | 1.2 | 1.96 |
| c1 | 1.0 | 0.99 |
| c2 | 3.91 | –0.5 |
| Additional EFA components | c1: truncated dimer | c0: ambiguous |
| Guinier Analysis | ||
| I(0) (Arb.) | 1.042±0.004 | 0.478±0.003 |
| Rg | 28.14±0.17 Å | 42.18±0.48 Å |
| q-range | 0.0027–0.0461 Å–1 | 0.005–0.0305 Å–1 |
| qmaxRg | 1.298 | 1.295 |
| Coefficient of correlation, r2 | 0.931 | 0.948 |
| Volume (adjusted VP as SAXS MoW2) | 64,500 Å3 | 197000 Å3 |
| MW, MoW2 method (ratio to expected) | 53.6 kDa | 163.5 kDa (1.55) |
| MW, Vc method (kDa) (ratio to expected) | 48.8 kDa | 145.3 kDa (1.37) |
| P(r) analysis | ||
| I(0) (Arb.) | 1.055±0.004 | 0.486±0.004 |
| Rg | 29.29±0.13 Å | 45.18±0.48 Å |
| Dmax | 98.0 Å | 124 Å |
| q-range | 0.0027–0.3327 Å–1 | 0.0027–0.3327 Å–1 |
| χ2 (total estimate from GNOM) | 1.421 (0.924) | 1.628 (0.84) |
| Additional MultiFoXS runs (Figure 4—figure supplement 3) | S6A, N-terminus constraint | S6B, N-terminus constraint |
| MultiFoXS | ||
| # of conformations | 10,000 | 10,000 |
| flexible residues | 82–86 | 82–92 |
| # of states | 2 | 2 |
| Rg | 34.09 Å (62%) 45.20 Å (38%) | 33.54 Å (55%) 43.17 Å (45%) |
| χ2 | 1.26 | 1.25 |
| c1 | 1.0 | 1.0 |
| c2 | 4.0 | 4.0 |
| S6C, N-terminus constraint | S6D, N-terminus constraint | |
| MultiFoXS | ||
| # of conformations | 10,000 | 10,000 |
| flexible residues | 92–96 | 82–96 |
| # of states | 2 | 2 |
| Rg | 41.40 Å (61%) 31.92 Å (39%) | 37.09 Å (47%) 34.08 Å (53%) |
| χ2 | 1.26 | 5.4 |
| c1 | 1.01 | 1.01 |
| c2 | 3.91 | 0.94 |
Table 2
B. subtilis strains.
All B. subtilis strains are in the background of PY79.
| Strain # | Genotype | Reference |
|---|---|---|
| RB01 | ΔrsbPQ ΔrsbU rsbV-FLAG amyE::ctc-lacZ Pspank-rsbU | Ho and Bradshaw, 2021 |
| RB02 | ΔrsbPQ ΔrsbTU rsbV-FLAG amyE::ctc-lacZ Pspank-rsbU | Ho and Bradshaw, 2021 |
| RB03 | ΔrsbPQ ΔrsbTU rsbV-FLAG amyE::ctc-lacZ Pspank-rsbTU | Ho and Bradshaw, 2021 |
| RB04 | ΔrsbPQ ΔrsbU rsbV-FLAG amyE::ctc-lacZ Pspank-rsbUQ94L | This study |
| RB05 | ΔrsbPQ ΔrsbTU rsbV-FLAG amyE::ctc-lacZ Pspank-rsbUQ94L | This study |
| RB06 | ΔrsbPQ ΔrsbU rsbV-FLAG amyE::ctc-lacZ Pspank-rsbUM166V | Ho and Bradshaw, 2021 |
| RB07 | ΔrsbPQ ΔrsbTU rsbV-FLAG amyE::ctc-lacZ Pspank-rsbUM166V | Ho and Bradshaw, 2021 |
| RB08 | ΔrsbPQ ΔrsbTU rsbV-FLAG amyE::ctc-lacZ Pspank-rsbTUY28I | This study |
| RB09 | ΔrsbPQ ΔrsbTU rsbV-FLAG amyE::ctc-lacZ Pspank-rsbTUY28I,S49G | This study |
| RB10 | ΔrsbPQ ΔrsbTU rsbV-FLAG amyE::ctc-lacZ Pspank-rsbTUY28I,K53E | This study |
| RB11 | ΔrsbPQ ΔrsbTU rsbV-FLAG amyE::ctc-lacZ Pspank-rsbTUY28I,T89A | This study |
| RB12 | ΔrsbPQ ΔrsbTU rsbV-FLAG amyE::ctc-lacZ Pspank-rsbTUY28I,G92R | This study |
| RB13 | ΔrsbPQ ΔrsbTU rsbV-FLAG amyE::ctc-lacZ Pspank-rsbTUY28I,G92E | This study |
| RB14 | ΔrsbPQ ΔrsbTU rsbV-FLAG amyE::ctc-lacZ Pspank-rsbTUY28I,Q94L | This study |
| RB15 | ΔrsbPQ ΔrsbTU rsbV-FLAG amyE::ctc-lacZ Pspank-rsbTUY28I,T110S | This study |
| RB16 | ΔrsbPQ ΔrsbTU rsbV-FLAG amyE::ctc-lacZ Pspank-rsbTUY28I,V142A | This study |
| RB17 | ΔrsbPQ ΔrsbTU rsbV-FLAG amyE::ctc-lacZ Pspank-rsbTUY28I,K143E | This study |
| RB18 | ΔrsbPQ ΔrsbTU rsbV-FLAG amyE::ctc-lacZ Pspank-rsbTUY28I,C165Y | This study |
| RB19 | ΔrsbPQ ΔrsbTU rsbV-FLAG amyE::ctc-lacZ Pspank-rsbTUY28I,M173I | This study |
| RB20 | ΔrsbPQ ΔrsbTU rsbV-FLAG amyE::ctc-lacZ Pspank-rsbTUR91E | This study |
| RB21 | ΔrsbPQ ΔrsbTU rsbV-FLAG amyE::ctc-lacZ Pspank-rsbTD92KU | This study |
| RB22 | ΔrsbPQ ΔrsbTU rsbV-FLAG amyE::ctc-lacZ Pspank-rsbTD92KUR91E | This study |
| RB23 | ΔrsbPQ ΔrsbU rsbV-FLAG amyE::ctc-lacZ Pspank-rsbUQ94I | This study |
| RB24 | ΔrsbPQ ΔrsbTU rsbV-FLAG amyE::ctc-lacZ Pspank-rsbUQ94I | This study |
| RB25 | ΔrsbPQ ΔrsbU rsbV-FLAG amyE::ctc-lacZ Pspank-rsbUQ94V | This study |
| RB26 | ΔrsbPQ ΔrsbTU rsbV-FLAG amyE::ctc-lacZ Pspank-rsbUQ94V | This study |
| RB27 | ΔrsbPQ ΔrsbU rsbV-FLAG amyE::ctc-lacZ Pspank-rsbUQ94Y | This study |
| RB28 | ΔrsbPQ ΔrsbTU rsbV-FLAG amyE::ctc-lacZ Pspank-rsbUQ94Y | This study |
| RB29 | ΔrsbPQ ΔrsbU rsbV-FLAG amyE::ctc-lacZ Pspank-rsbUQ94F | This study |
| RB30 | ΔrsbPQ ΔrsbTU rsbV-FLAG amyE::ctc-lacZ Pspank-rsbUQ94F | This study |
| RB31 | ΔrsbPQ ΔrsbU rsbV-FLAG amyE::ctc-lacZ Pspank-rsbUQ94W | This study |
| RB32 | ΔrsbPQ ΔrsbTU rsbV-FLAG amyE::ctc-lacZ Pspank-rsbUQ94W | This study |
| RB33 | ΔrsbPQ ΔrsbU rsbV-FLAG amyE::ctc-lacZ Pspank-rsbUQ94M | This study |
| RB34 | ΔrsbPQ ΔrsbTU rsbV-FLAG amyE::ctc-lacZ Pspank-rsbUQ94M | This study |
| RB35 | ΔrsbPQ ΔrsbU rsbV-FLAG amyE::ctc-lacZ Pspank-rsbUQ94N | This study |
| RB36 | ΔrsbPQ ΔrsbTU rsbV-FLAG amyE::ctc-lacZ Pspank-rsbUQ94N | This study |
| RB37 | ΔrsbPQ ΔrsbU rsbV-FLAG amyE::ctc-lacZ Pspank-rsbUQ94E | This study |
| RB38 | ΔrsbPQ ΔrsbTU rsbV-FLAG amyE::ctc-lacZ Pspank-rsbUQ94E | This study |
| RB39 | ΔrsbPQ ΔrsbU rsbV-FLAG amyE::ctc-lacZ Pspank-rsbUQ94A | This study |
| RB40 | ΔrsbPQ ΔrsbTU rsbV-FLAG amyE::ctc-lacZ Pspank-rsbUQ94A | This study |
| RB41 | ΔrsbPQ ΔrsbU rsbV-FLAG amyE::ctc-lacZ Pspank-rsbUQ94G | This study |
| RB42 | ΔrsbPQ ΔrsbTU rsbV-FLAG amyE::ctc-lacZ Pspank-rsbUQ94G | This study |
| RB43 | ΔrsbPQ ΔrsbU rsbV-FLAG amyE::ctc-lacZ Pspank-rsbUT89A | This study |
| RB44 | ΔrsbPQ ΔrsbU rsbV-FLAG amyE::ctc-lacZ Pspank-rsbUC165Y | This study |
Table 3
E. coli strains.
| Strain # | Genotype | Reference |
|---|---|---|
| RB45 | BL21 (DE3) pET47b 6H-3C-rsbT | Ho and Bradshaw, 2021 |
| RB46 | BL21 (DE3) pET47b 6H-3C-rsbU | Ho and Bradshaw, 2021 |
| RB47 | BL21 (DE3) pET47b 6H-3C-rsbV | Ho and Bradshaw, 2021 |
| RB48 | BL21 (DE3) pET47b 6H-3C-rsbW | Ho and Bradshaw, 2021 |
| RB49 | BL21 (DE3) pET47b 6H-3C-rsbVW | This study |
| RB50 | BL21 (DE3) pET47b 6H-3C-rsbUQ94L | This study |
| RB51 | BL21 (DE3) pET47b 6H-3C-rsbUM166V | Ho and Bradshaw, 2021 |
| RB52 | BL21 (DE3) pET47b 6H-3C-rsbTU | This study |
| RB53 | BL21 (DE3) pET47b 6H-3C-rsbUR91E | This study |
| RB54 | BL21 (DE3) pET47b 6H-3C-rsbTUQ94L | This study |
| RB55 | DH5 α Pspank-rsbU | Ho and Bradshaw, 2021 |
| RB56 | DH5 α Pspank-rsbTU | Ho and Bradshaw, 2021 |
| RB57 | DH5 α rsbUQ94L | |
| RB58 | DH5 α Pspank-rsbUM166V | Ho and Bradshaw, 2021 |
| RB59 | DH5 α Pspank-rsbTUY28I | This study |
| RB60 | DH5 α Pspank-rsbTUY28I,S49G | This study |
| RB61 | DH5 α Pspank-rsbTUY28I,K53E | This study |
| RB62 | DH5 α Pspank-rsbTUY28I,T89A | This study |
| RB63 | DH5 α Pspank-rsbTUY28I,G92R | This study |
| RB64 | DH5 α Pspank-rsbTUY28I,G92E | This study |
| RB65 | DH5 α Pspank-rsbTUY28I,Q94L | This study |
| RB66 | DH5 α Pspank-rsbTUY28I,T110S | This study |
| RB67 | DH5 α Pspank-rsbTUY28I,V142A | This study |
| RB68 | DH5 α Pspank-rsbTUY28I,K143E | This study |
| RB69 | DH5 α Pspank-rsbTUY28I,C165Y | This study |
| RB70 | DH5 α Pspank-rsbTUY28I,M173I | This study |
| RB71 | DH5 α Pspank-rsbTUR91E | This study |
| RB72 | DH5 α Pspank-rsbTD92KU | This study |
| RB73 | DH5 α Pspank-rsbTD92KUR91E | This study |
| RB74 | DH5 α Pspank-rsbUQ94I | This study |
| RB75 | DH5 α Pspank-rsbUQ94V | This study |
| RB76 | DH5 α Pspank-rsbUQ94Y | This study |
| RB77 | DH5 α Pspank-rsbUQ94Y | This study |
| RB78 | DH5 α Pspank-rsbUQ94F | This study |
| RB79 | DH5 α Pspank-rsbUQ94W | This study |
| RB80 | DH5 α Pspank-rsbUQ94M | This study |
| RB81 | DH5 α Pspank-rsbUQ94N | This study |
| RB82 | DH5 α Pspank-rsbUQ94E | This study |
| RB83 | DH5 α Pspank-rsbUQ94A | This study |
| RB84 | DH5 α Pspank-rsbUQ94G | This study |
| RB85 | DH5 α Pspank-rsbUT89A | This study |
| RB86 | DH5 α Pspank-rsbUC165Y | This study |
Additional files
Download links
A two-part list of links to download the article, or parts of the article, in various formats.
Downloads (link to download the article as PDF)
Open citations (links to open the citations from this article in various online reference manager services)
Cite this article (links to download the citations from this article in formats compatible with various reference manager tools)
A general mechanism for initiating the bacterial general stress response
eLife 13:RP100376.
https://doi.org/10.7554/eLife.100376.3


