Control of 3′ splice site selection by the yeast splicing factor Fyv6
- Department of Biochemistry, University of Wisconsin-Madison, United States
- Department of Chemistry, University of Wisconsin-Madison, United States
- MRC Laboratory of Molecular Biology, United Kingdom
Figures
Figure 1 with 1 supplement
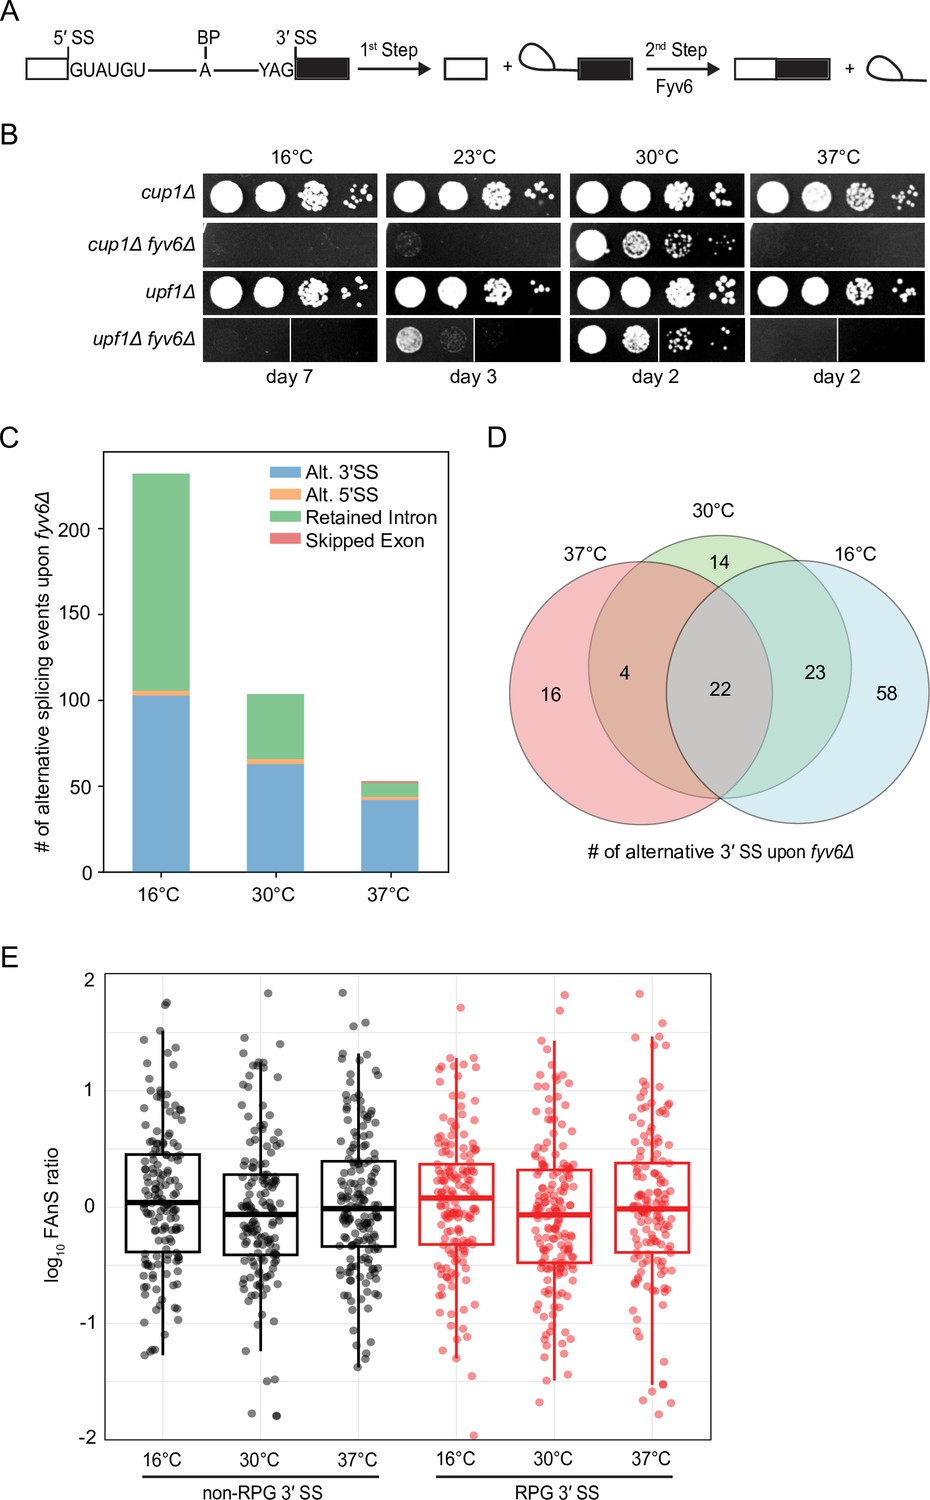
Widespread splicing changes due to loss of Fyv6.
(A) Precursor messenger RNA (pre-mRNA) splicing reaction steps and products. (B) Growth of WT (cup1Δ), fyv6Δ, upf1Δ, and fyv6Δupf1Δ yeast at 16°C, 23°C, 30°C, and 37°C. Images were taken on the indicated days. White lines indicate where images were cropped, as all dilutions for all strains were on the same plate, but not necessarily directly adjacent to one another. (C) Number of alternative splicing events observed in a fyv6Δupf1Δ strain relative to a strain containing FYV6 after a temperature shift to 16°C, 30°C, and 37°C. (D) Venn diagram of shared alternative 3′ splice site (SS) splicing events at 16°C (blue), 30°C (green), and 37°C (red). (E) Box plots of the log10 of the ratios of fyv6Δ upf1Δ to WT (upf1Δ) fraction of annotated splicing (FAnS) values for ribosomal protein genes (RPGs) (red) and non-RPGs (black) for 3′ SS splicing events. FAnS values represent the ratio of the alternative splicing event (here, selection of an alternate 3′ SS) to the annotated, canonical splice isoform.
Figure 1—figure supplement 1
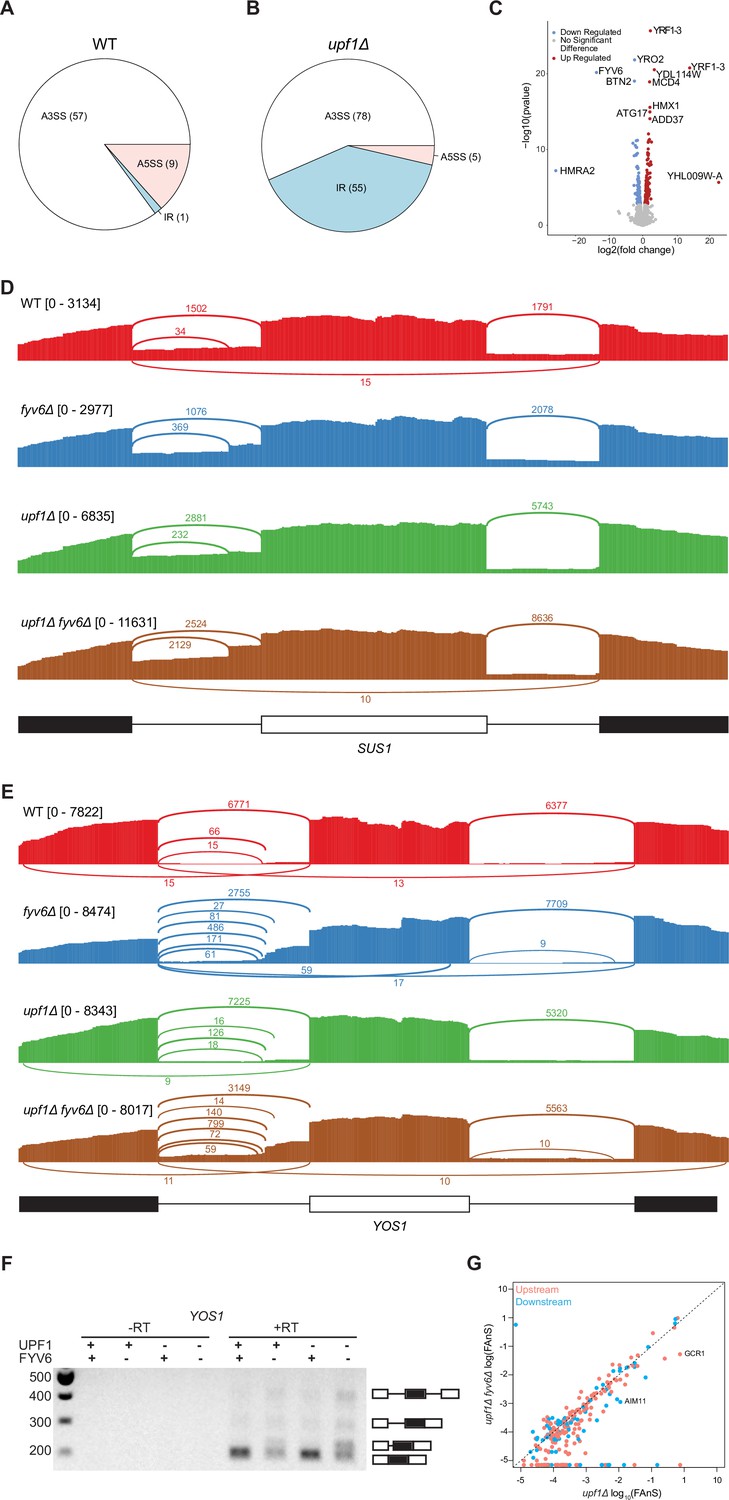
Gene expression analysis based on the RNA sequencing (RNA-seq) results and an example of Fyv6-dependent splicing changes in YOS1.
(A, B) Pie charts comparing alternative splicing events discovered by SpliceWiz at 10 percent spliced in (PSI) in (A) fyv6Δ and (B) upf1Δ fyv6Δ strain backgrounds relative to when Fyv6 is present. A3SS = alternate 3ʹ SS; A5SS = alternate 5ʹ SS; IR = intron retention. Note that these datasets were collected at higher read depth than those shown in Figure 1. As a result, the number of detected changes in splicing cannot be directly compared between the two. (C) Differential expression analysis in a upf1Δ background with presence or absence of Fyv6. Colored points are significant with p<0.05 with blue points being downregulated gene expression and red being upregulated. (D) Sashimi plots showing coverage across splice junctions of SUS1 in WT (red), fyv6Δ (blue), upf1Δ (green), and fyv6Δ upf1Δ (brown). (E) Sashimi plots showing coverage across splice junctions of YOS1 in WT (red), fyv6Δ (blue), upf1Δ (green), and fyv6Δ upf1Δ (brown). (F) RT-PCR of YOS1 mRNA showing a higher molecular weight band in strains lacking FYV6 corresponding to use of an alternative 3ʹ SS in the first intron. (G) Fraction of annotated splicing (FAnS) plot for alternative 5ʹ SS junctions with canonical 3ʹ SS in upf1Δ compared to fyv6Δ upf1Δ. SS, splice site.
-
Figure 1—figure supplement 1—source data 1
TIF file containing original gel image for Figure 1—figure supplement 1F, indicating the relevant bands.
- https://cdn.elifesciences.org/articles/100449/elife-100449-fig1-figsupp1-data1-v1.zip
-
Figure 1—figure supplement 1—source data 2
The original gel image for Figure 1—figure supplement 1F.
- https://cdn.elifesciences.org/articles/100449/elife-100449-fig1-figsupp1-data2-v1.zip
Figure 2 with 1 supplement
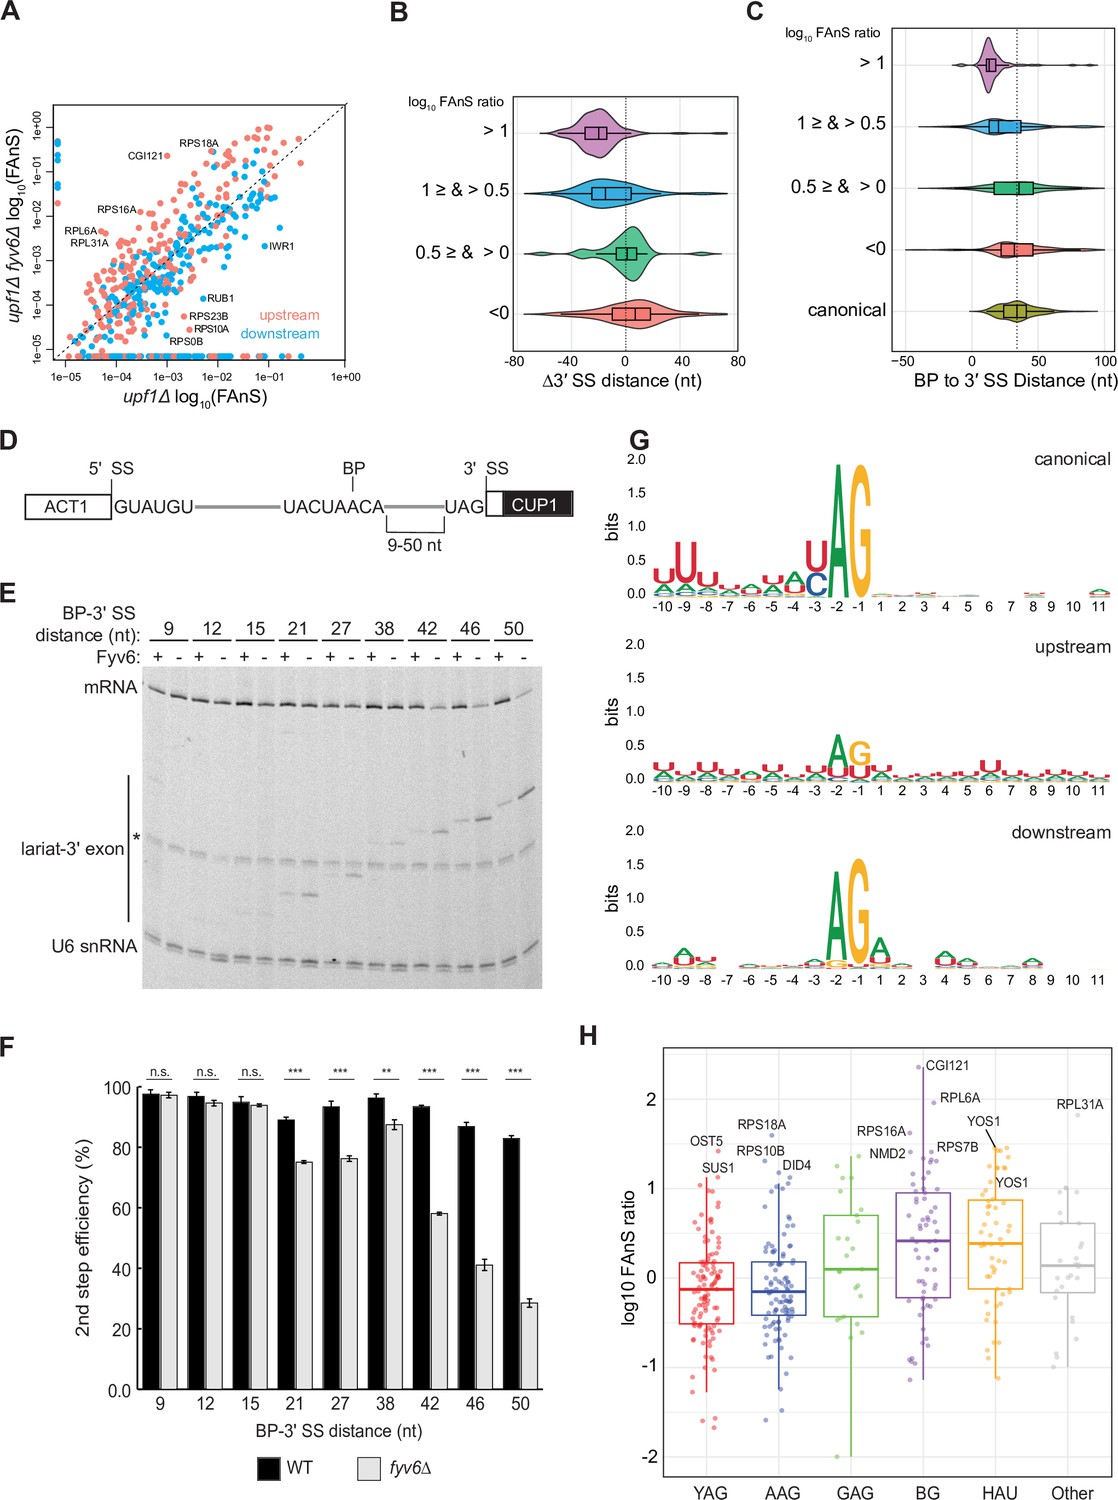
Loss of Fyv6 activates branch point (BP) proximal, non-consensus 3ʹ splice site (SS).
(A) Plot of the log10 of fraction of annotated splicing (FAnS) values for differences between alternative 3ʹ SS usage in fyv6Δ upf1Δ and upf1Δ strains. High FAnS values indicate increased usage of the alternate 3ʹ SS relative to the annotated site. Points are colored based on whether they are upstream (pink) or downstream (blue) to the canonical 3ʹ SS. (B) Violin plots of the ratios of fyv6Δupf1Δ to the upf1Δ FAnS values based on the distances between the alternative and canonical 3ʹ SS (Δ3ʹ SS = 3ʹ SSAlt. – 3ʹ SScanonical). FAnS ratios>0 are indicative of the site being upregulated in fyv6Δ. (C) Violin plots of the ratios of fyv6Δupf1Δ to the upf1Δ FAnS values based on the distances between the alternative 3ʹ SS and the annotated BP. FAnS ratios >0 are indicative of the site being upregulated in fyv6Δ. (D) Diagram of ACT1-CUP1 reporter showing BP-3ʹ SS distances. (E) Representative primer extension analysis of RNA products generated from splicing of the ACT1-CUP1 reporter in the presence (WT) or absence of Fyv6 (fyv6Δ). Bands for fully spliced mRNA and lariat intermediate are indicated. U6 small nuclear RNA (snRNA) was detected as a loading control. The * indicates an unknown product present in every lane. (F) Quantification of the primer extension results from N=3 biological replicates represented by the ratio of band intensities for mRNA/(mRNA+lariat intermediate). Bars represent the average ratio of the replicates ± SD. Means between WT and fyv6Δ groups for each reporter were compared with an unpaired Welch’s two-tailed t-test. Significance is indicated: n.s., no significance; **p<0.01; ***p<0.001. (G) Sequence logos of alternative 3ʹ SS with FAnS>0 sorted by either upstream or downstream of the canonical 3ʹ SS compared against the canonical 3ʹ SS for genes with FAnS>0. (H) The log10 of the FAnS ratio for alternative 3ʹ SS sorted by the sequences of the 3ʹ SS.
-
Figure 2—source data 1
TIF file containing original gel image for Figure 2E, indicating the relevant bands.
- https://cdn.elifesciences.org/articles/100449/elife-100449-fig2-data1-v1.zip
-
Figure 2—source data 2
The original gel image for Figure 2E.
- https://cdn.elifesciences.org/articles/100449/elife-100449-fig2-data2-v1.zip
Figure 2—figure supplement 1
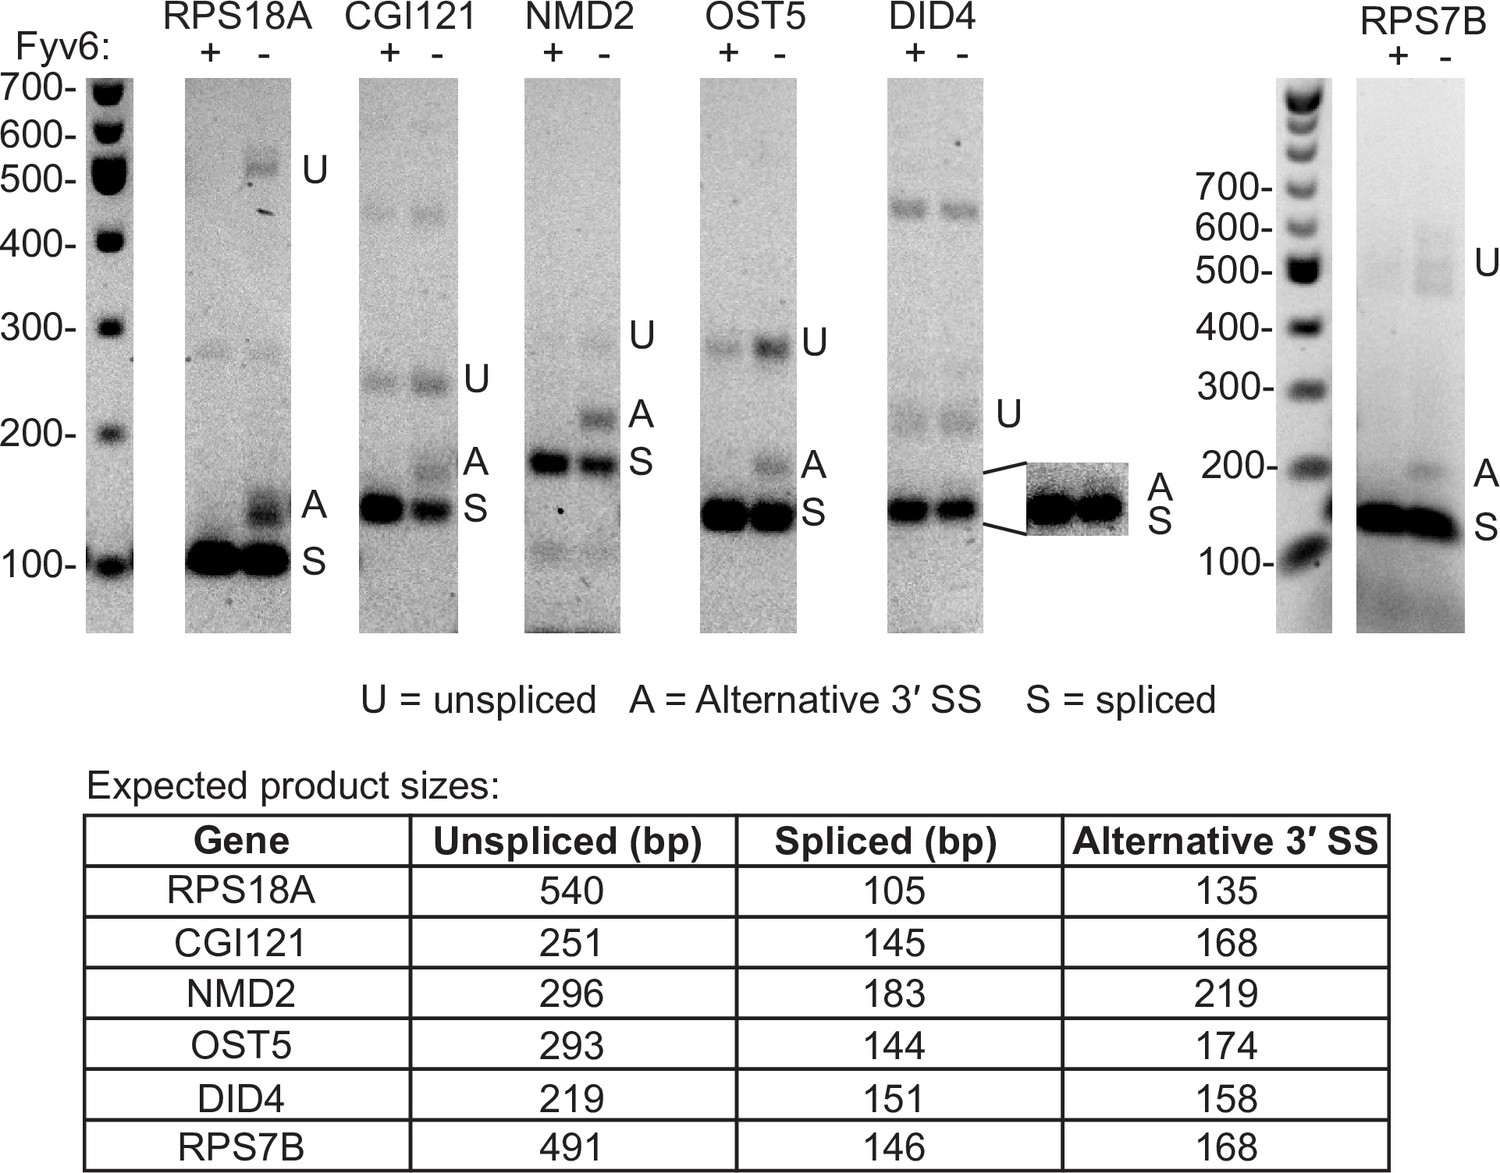
Examples of Fyv6-dependent alternative 3′ splice site (SS) usage.
RT-PCR of RNAs from upf1Δ and fyv6Δ upf1Δ strains targeting introns in genes identified in the RNA sequencing (RNA-seq) data as having alternative 3′ SS with high fraction of annotated splicing (FAnS) ratios in fyv6Δ upf1Δ (see Figure 2H). The bands for the unspliced, spliced, and alternative 3′ SS products are indicated with U, S, and A, respectively, and their expected sizes are listed.
-
Figure 2—figure supplement 1—source data 1
TIF files containing original gel images for Figure 2—figure supplement 1, indicating the relevant bands.
- https://cdn.elifesciences.org/articles/100449/elife-100449-fig2-figsupp1-data1-v1.zip
-
Figure 2—figure supplement 1—source data 2
The original gel images for Figure 2—figure supplement 1.
- https://cdn.elifesciences.org/articles/100449/elife-100449-fig2-figsupp1-data2-v1.zip
Figure 3 with 4 supplements
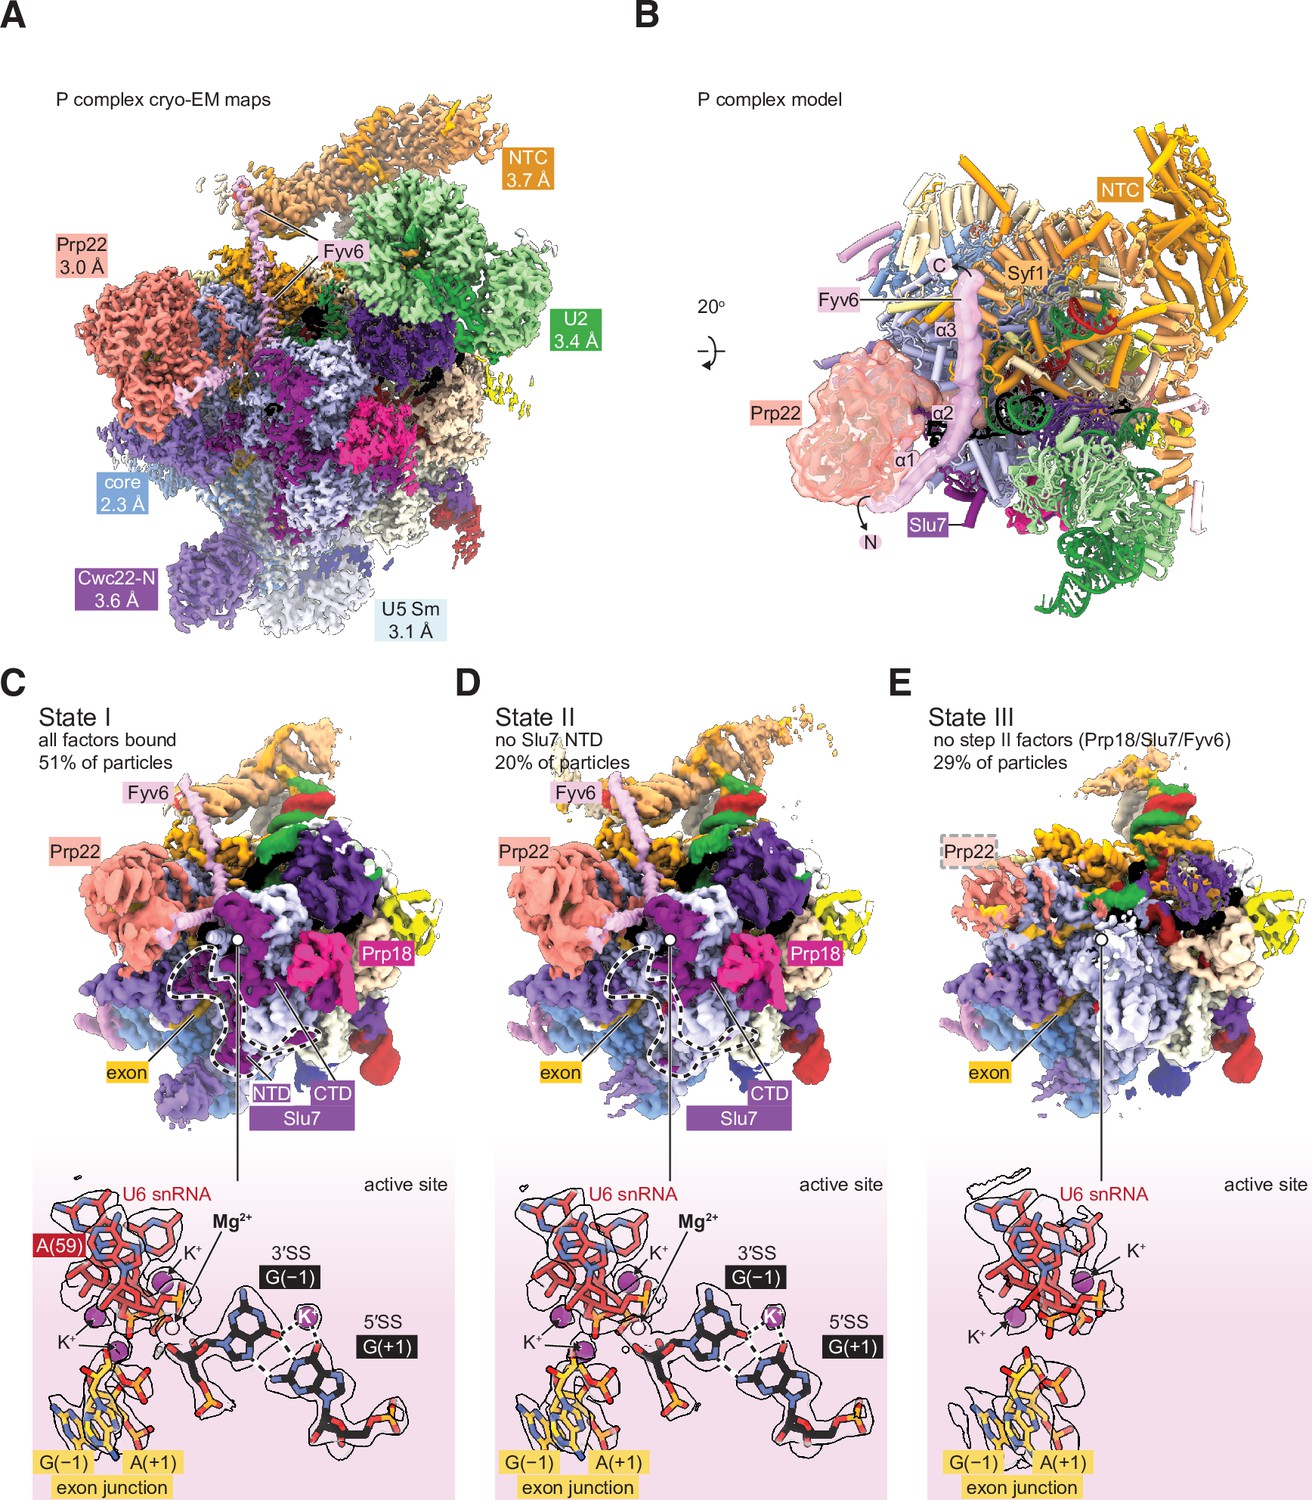
Cryo-electron microscopy (cryo-EM) structure of the yeast P complex spliceosome at 2.3 Å resolution.
(A) A composite density map for P complex showing focused refinements of the Prp22, NTC, U2 small nuclear ribonucleoprotein (snRNP), U5 Sm ring, and Cwc22 N-terminal domain regions. (B) Overall model for the P complex spliceosome. (C) Cryo-EM density for state I of P complex (above, low-pass filtered) and for the active site and 3ʹ SS (below, sharpened). (D, E) As for (C) but for states II (D) and III (E).
Figure 3—figure supplement 1
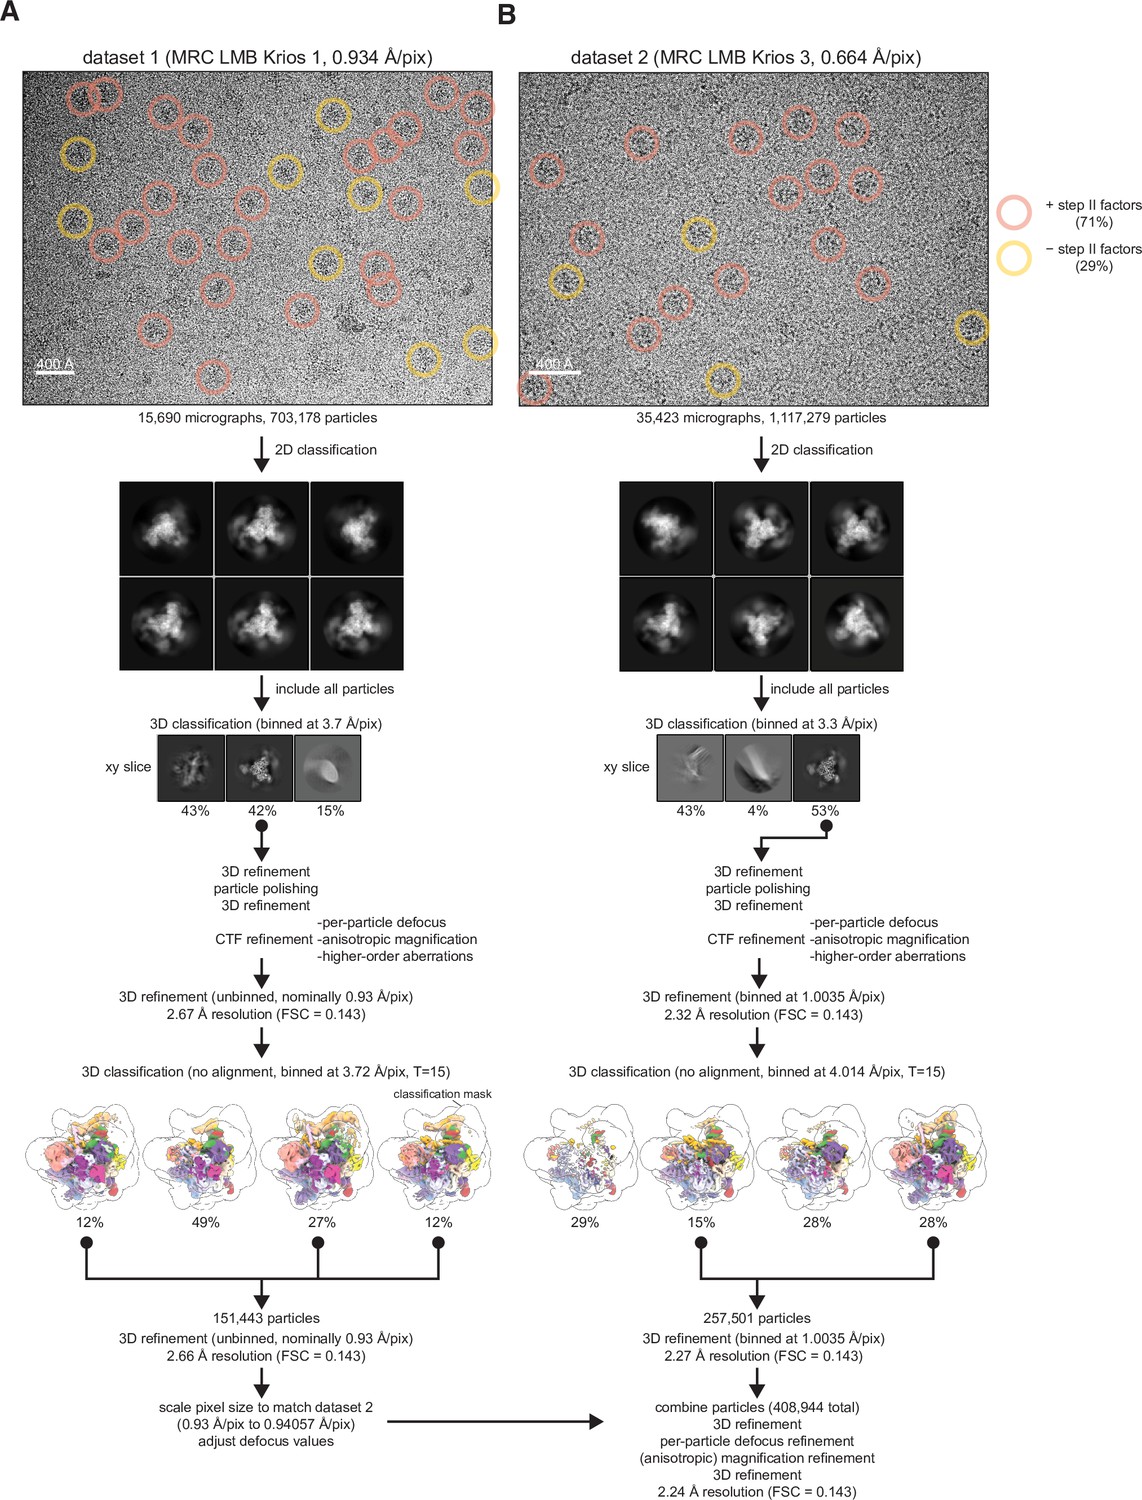
Spliceosome cryo-electron microscopy (cryo-EM) data collection and general processing.
(A) Example micrograph for dataset 1 with particles in state I or II circled in red and particles in state III circled in yellow. Example 2D classes are shown below, but 2D classification was not used for selection of particles for further processing. (B) As (A) but for dataset 2.
Figure 3—figure supplement 2
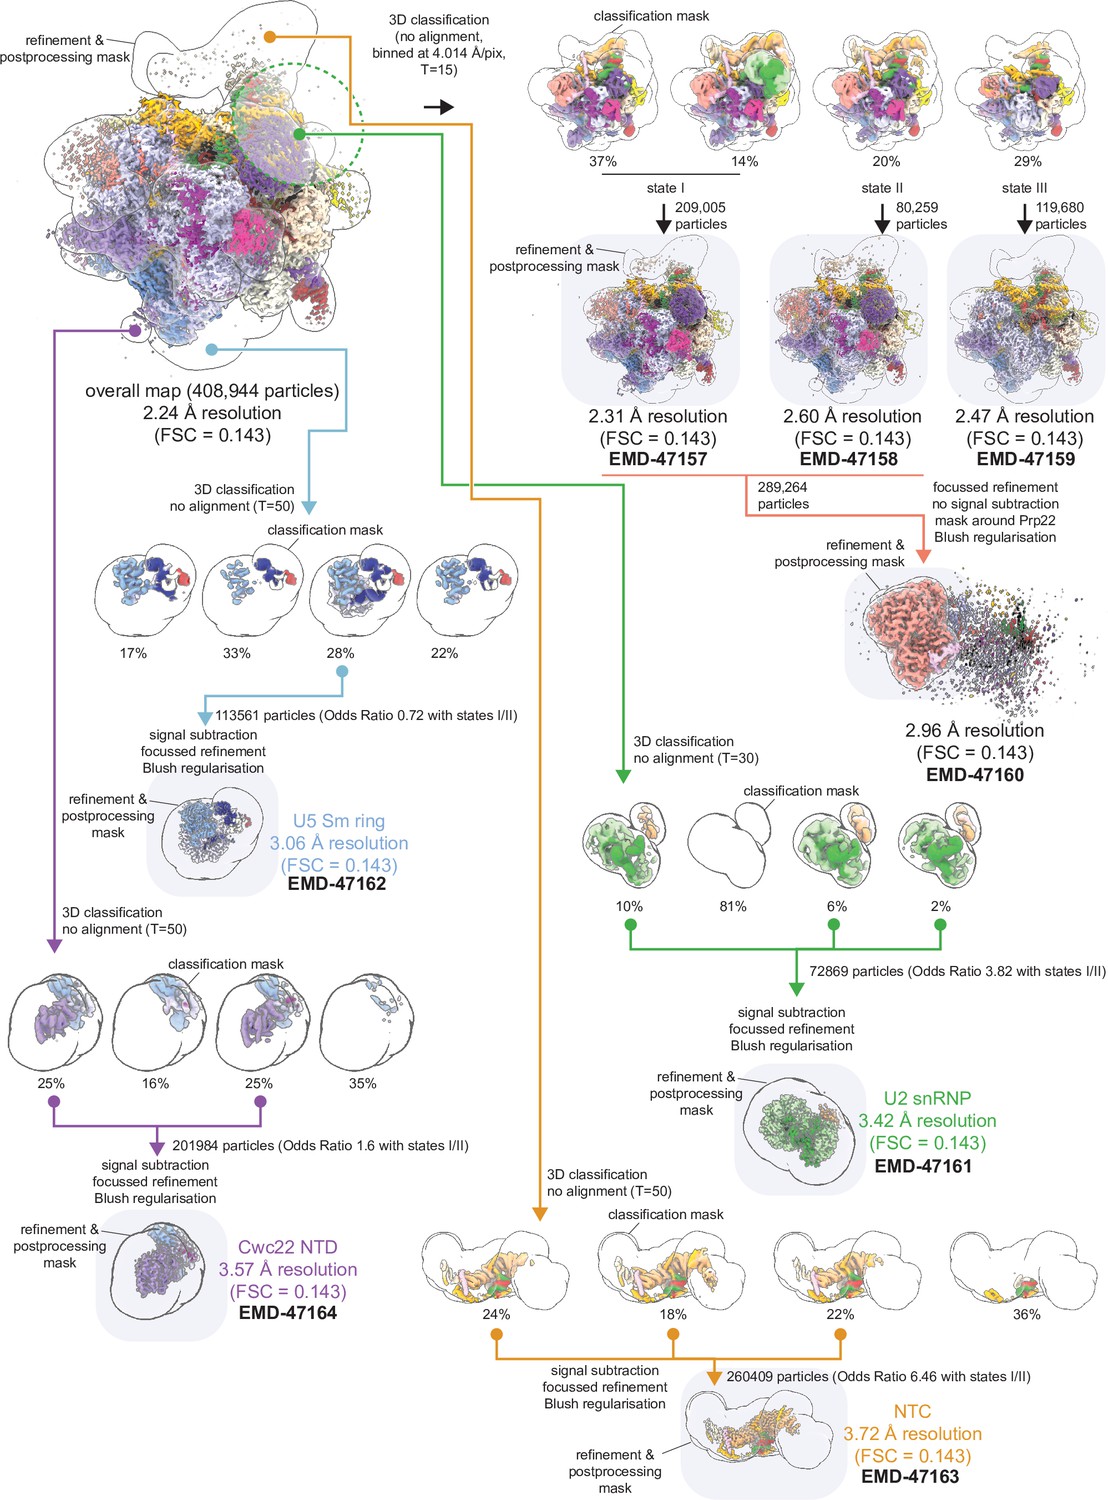
Focused classification and refinement scheme for regions of P complex.
Final maps deposited to the EMDB are highlighted.
Figure 3—figure supplement 3
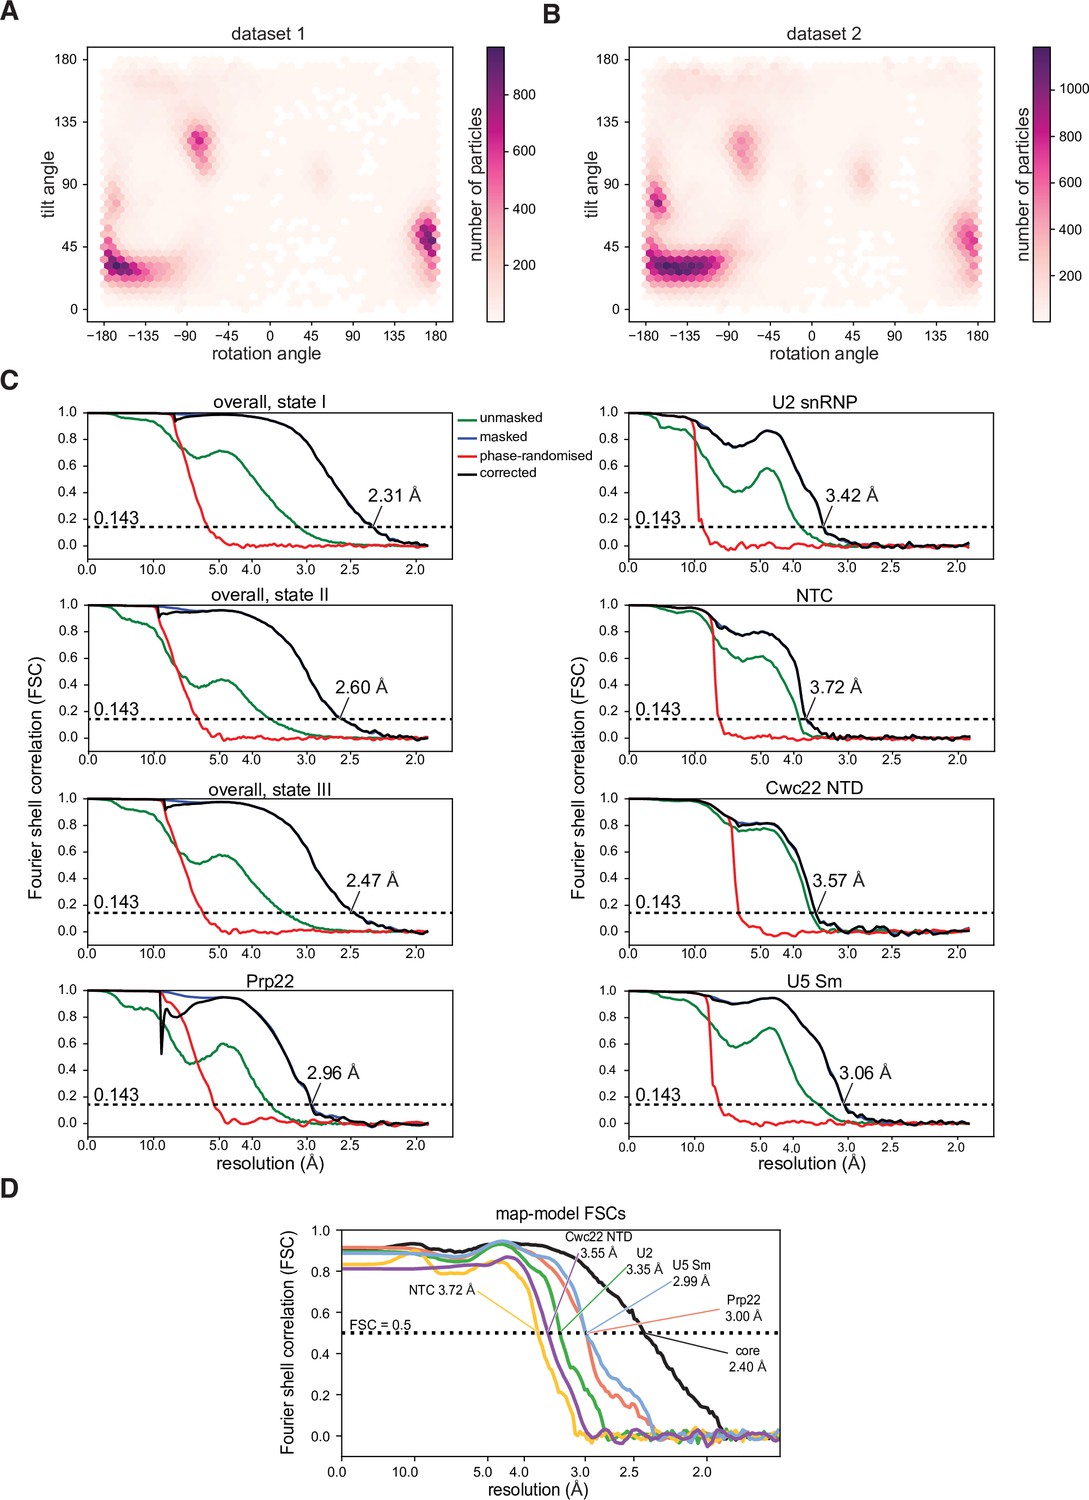
Properties of the cryo-electron microscopy (cryo-EM) datasets and models.
(A, B) Orientation distribution plot for state I separated by datasets. (C) Gold-standard Fourier shell correlation curves for the overall reconstructions and focus-refined maps. (D) Map-model Fourier shell correlation, calculated using PHENIX.
Figure 3—figure supplement 4
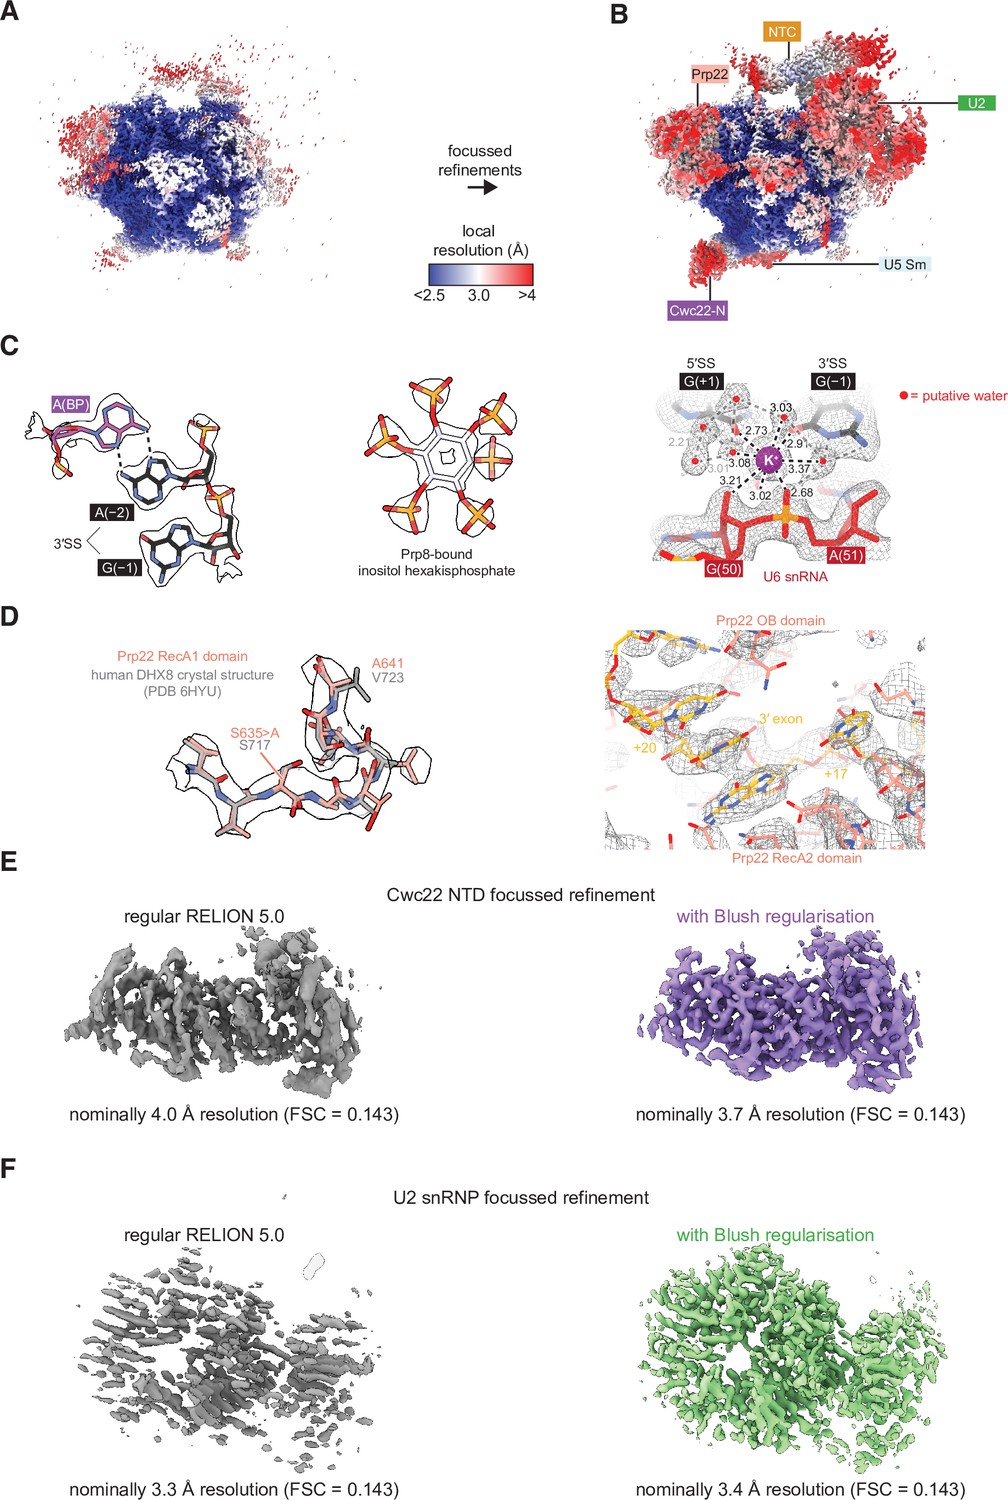
Features of the cryo-electron microscopy (cryo-EM) model of P complex.
(A) The overall P complex reconstruction (state I) colored by local resolution as calculated within RELION. (B) Local resolution after focused refinements, colored as in (A). (C) Representative densities for the P complex core, IP6, and assigned K+ ion. (D) (Left) Density for the loop containing the S635A dominant-negative mutation in Prp22. The model is superimposed over the crystal structure of DHX8 (human Prp22) in the same region (PDB ID 6HYU; Felisberto-Rodrigues et al., 2019). (Right) Density for the 3' exonic RNA within Prp22. (E) Focused refinement of the Cwc22 NTD without and with Blush regularization. All refinement settings and inputs were the same except for the usage of Blush. Only dataset 2 particles were used for this comparison. (F) As for (E) but with the U2 small nuclear ribonucleoprotein (snRNP). Note that the resolution estimate is inflated without Blush regularization.
Figure 4 with 2 supplements
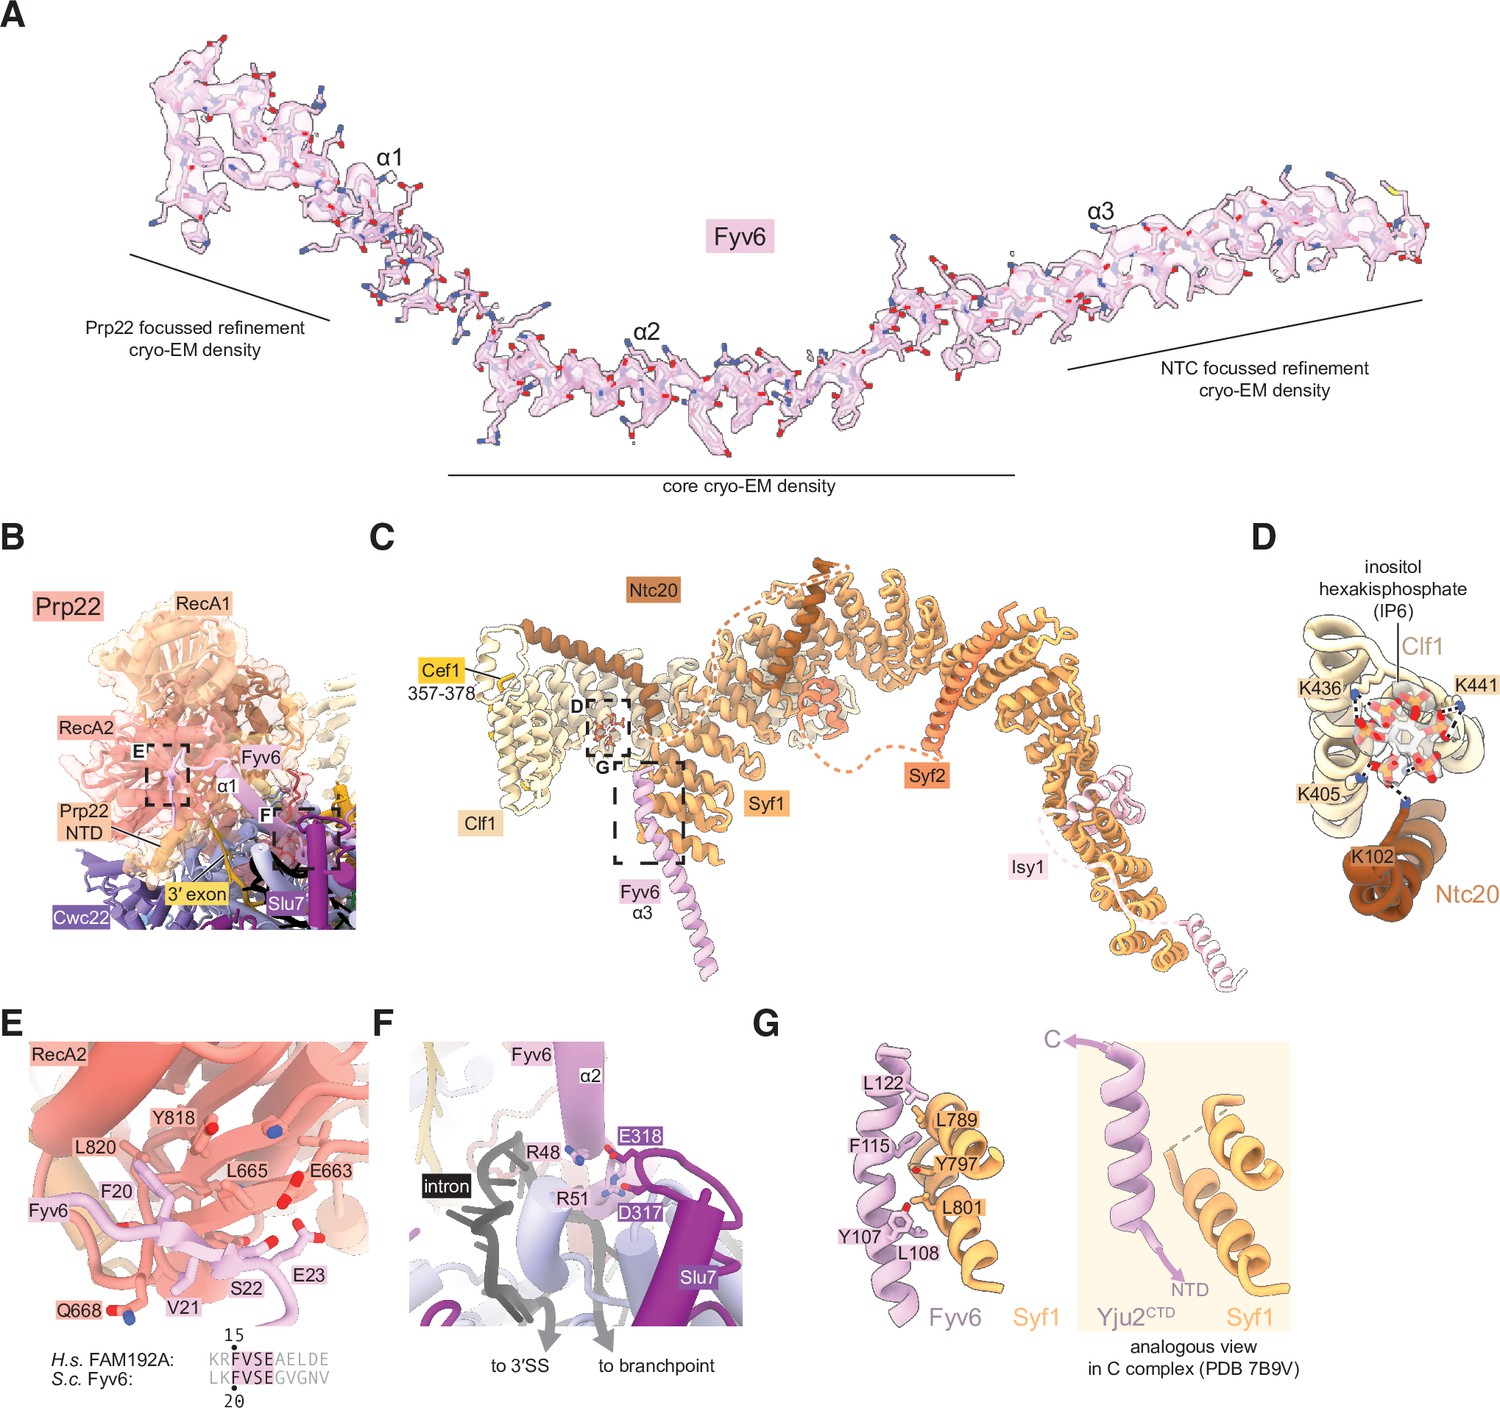
Fyv6 and its interactors in the P complex cryo-electron microscopy (cryo-EM) structure.
(A) Cryo-EM density segmented around Fyv6. (B) Structure of Prp22. (C) Structure of the NTC within P complex. (D) IP6 site and cryo-EM density in NTC. (E) Interaction of the hook domain of Fyv6 with the Prp22 RecA2 domain. (F) Interaction of Fyv6 with Slu7 and the region of the intron between the branch point (BP) and 3ʹ splice site (SS). (G) Interaction of Fyv6 with Syf1 and an analogous view of the interaction of Syf1 with Yju2 in C complex (Wilkinson et al., 2021).
Figure 4—figure supplement 1
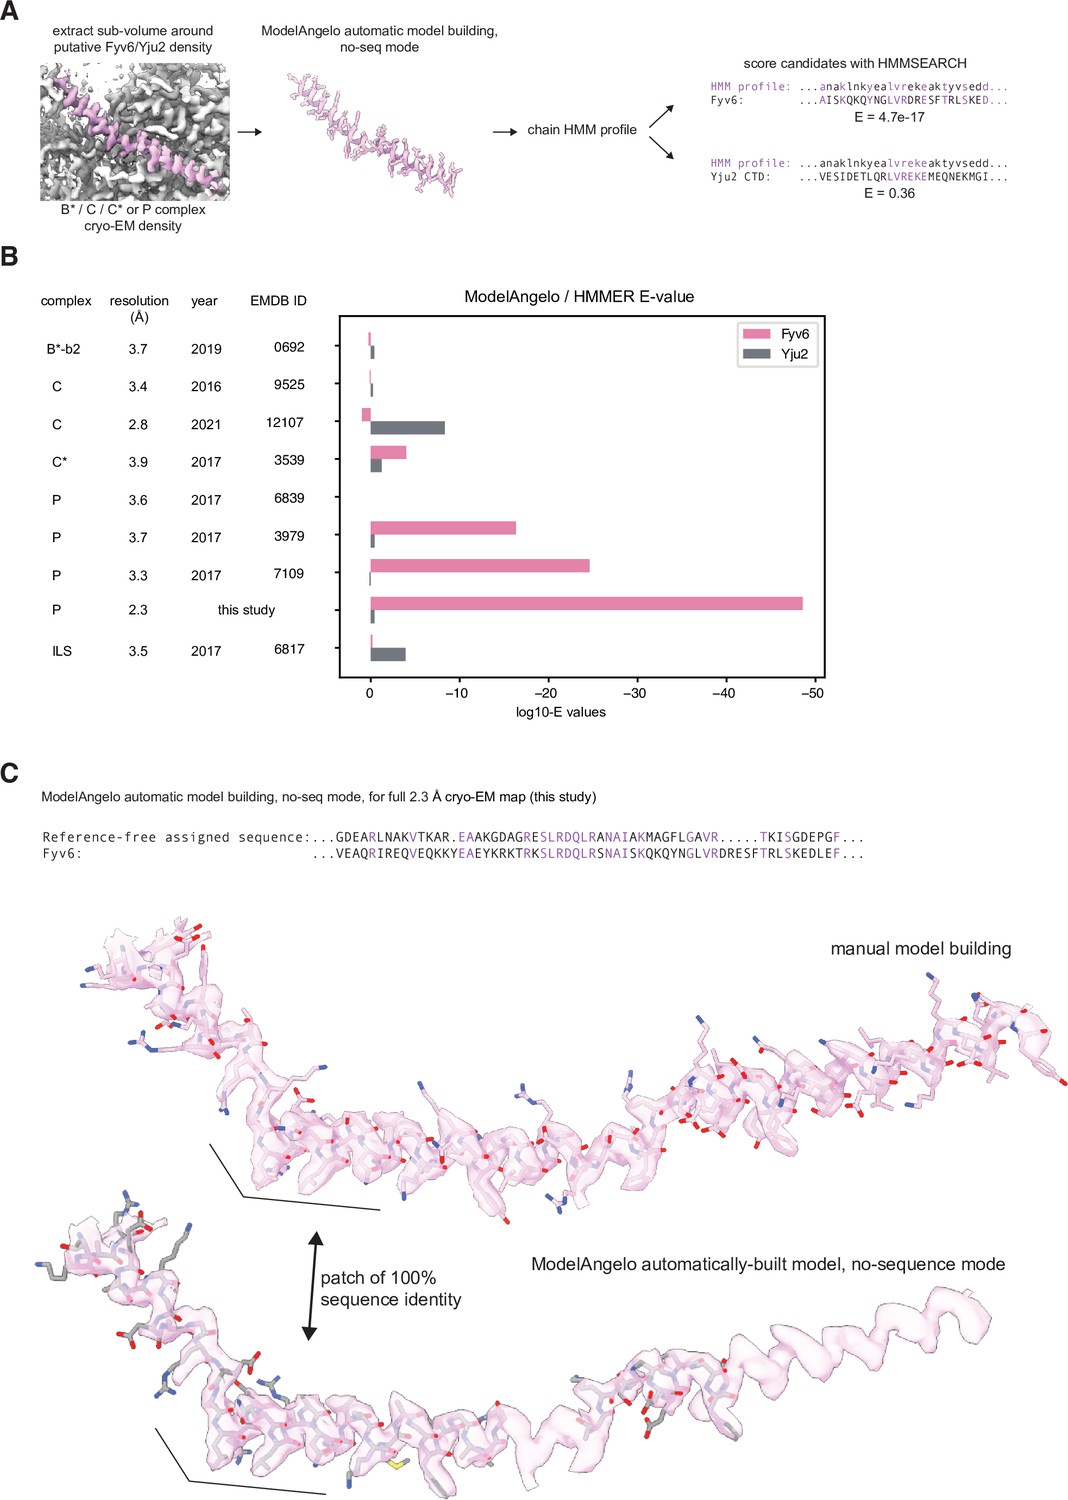
Comparison of fits to density of Yju2 vs. Fyv6 in each complex.
(A) Cryo-electron microscopy (cryo-EM) densities were boxed around Fyv6 or Yju2 using ChimeraX. These were used as inputs to ModelAngelo operated in ‘no-seq’ mode. The HMM profiles for the chains built into the putative Fyv6/Yju2 density were used to score all spliceosomal proteins using hmmsearch. (B) Expectation values (E-values) for hmmsearch against Fyv6 or Yju2 protein sequences. Lower E-values indicate a better match to the profile. (C) Comparison of the model built by ModelAngelo in no-seq mode to the manually built model for Fyv6 in P complex state I (this study). Despite not providing the sequence for Fyv6, several patches had 100% sequence identity.
Figure 4—figure supplement 2
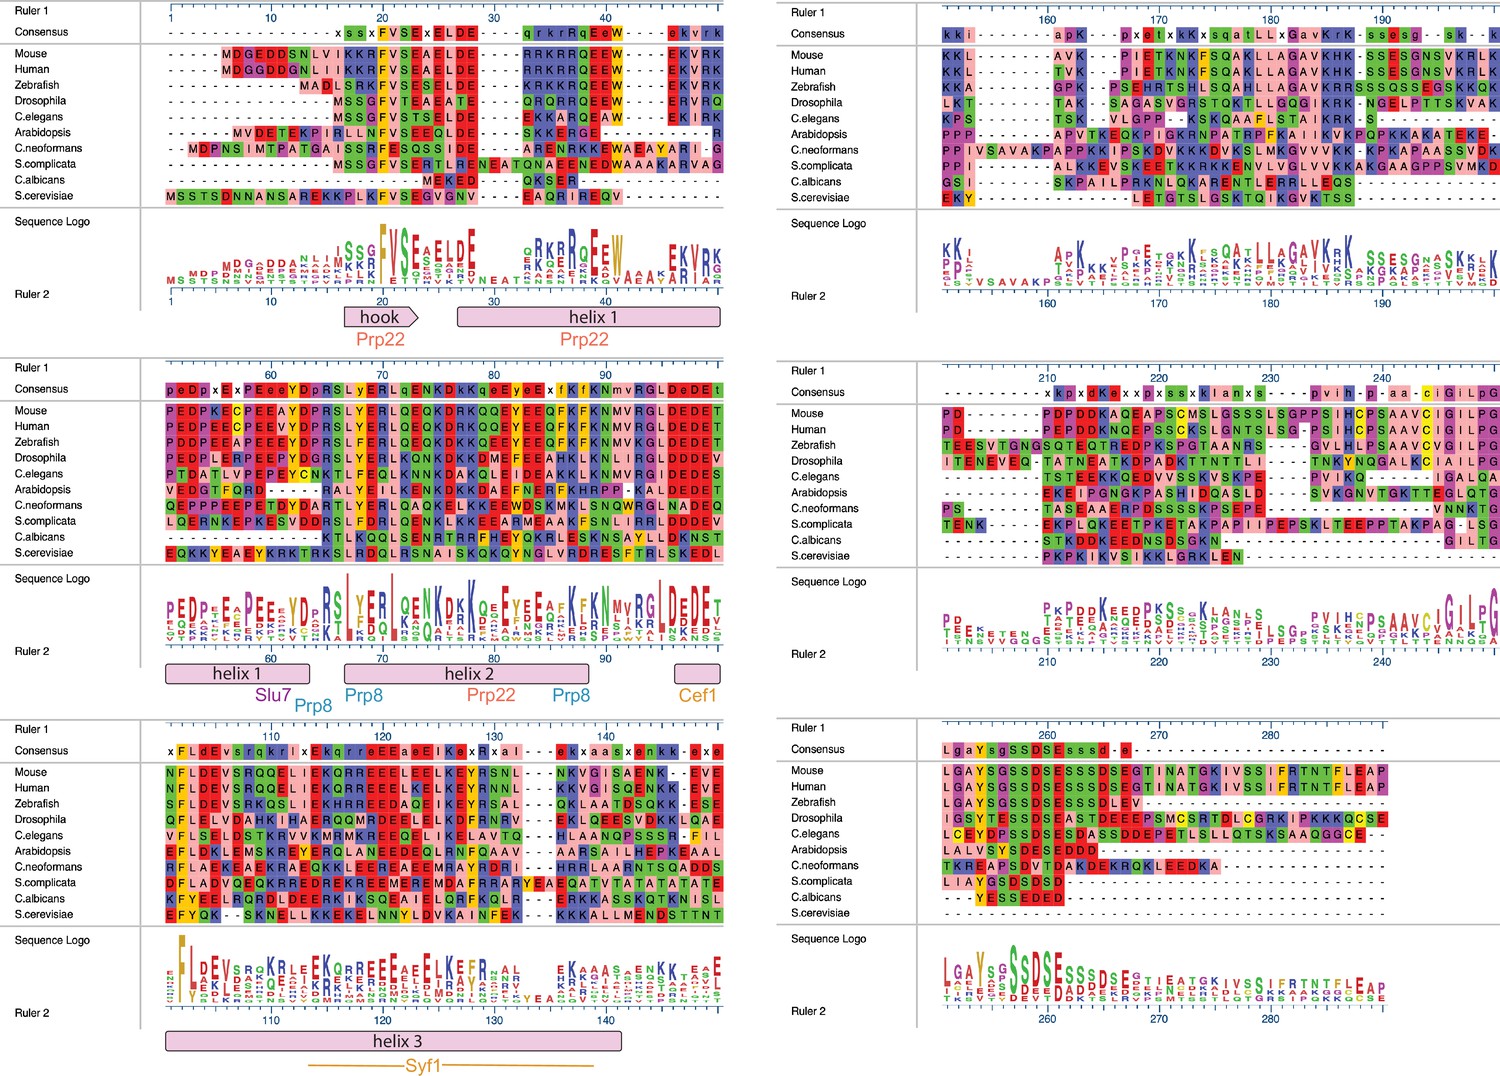
Alignments of Fyv6 homolog protein sequences.
Sequence-based alignment of Fyv6 and homologs from other model organisms. Alignment, consensus, and sequence logos are shown. Regions of Fyv6 protein structure determined from cryo-electron microscopy (cryo-EM) model are annotated below corresponding sequence. Sequences were aligned and visualized using MegAlign Pro (DNAStar) and Clustal Omega.
Figure 5 with 1 supplement
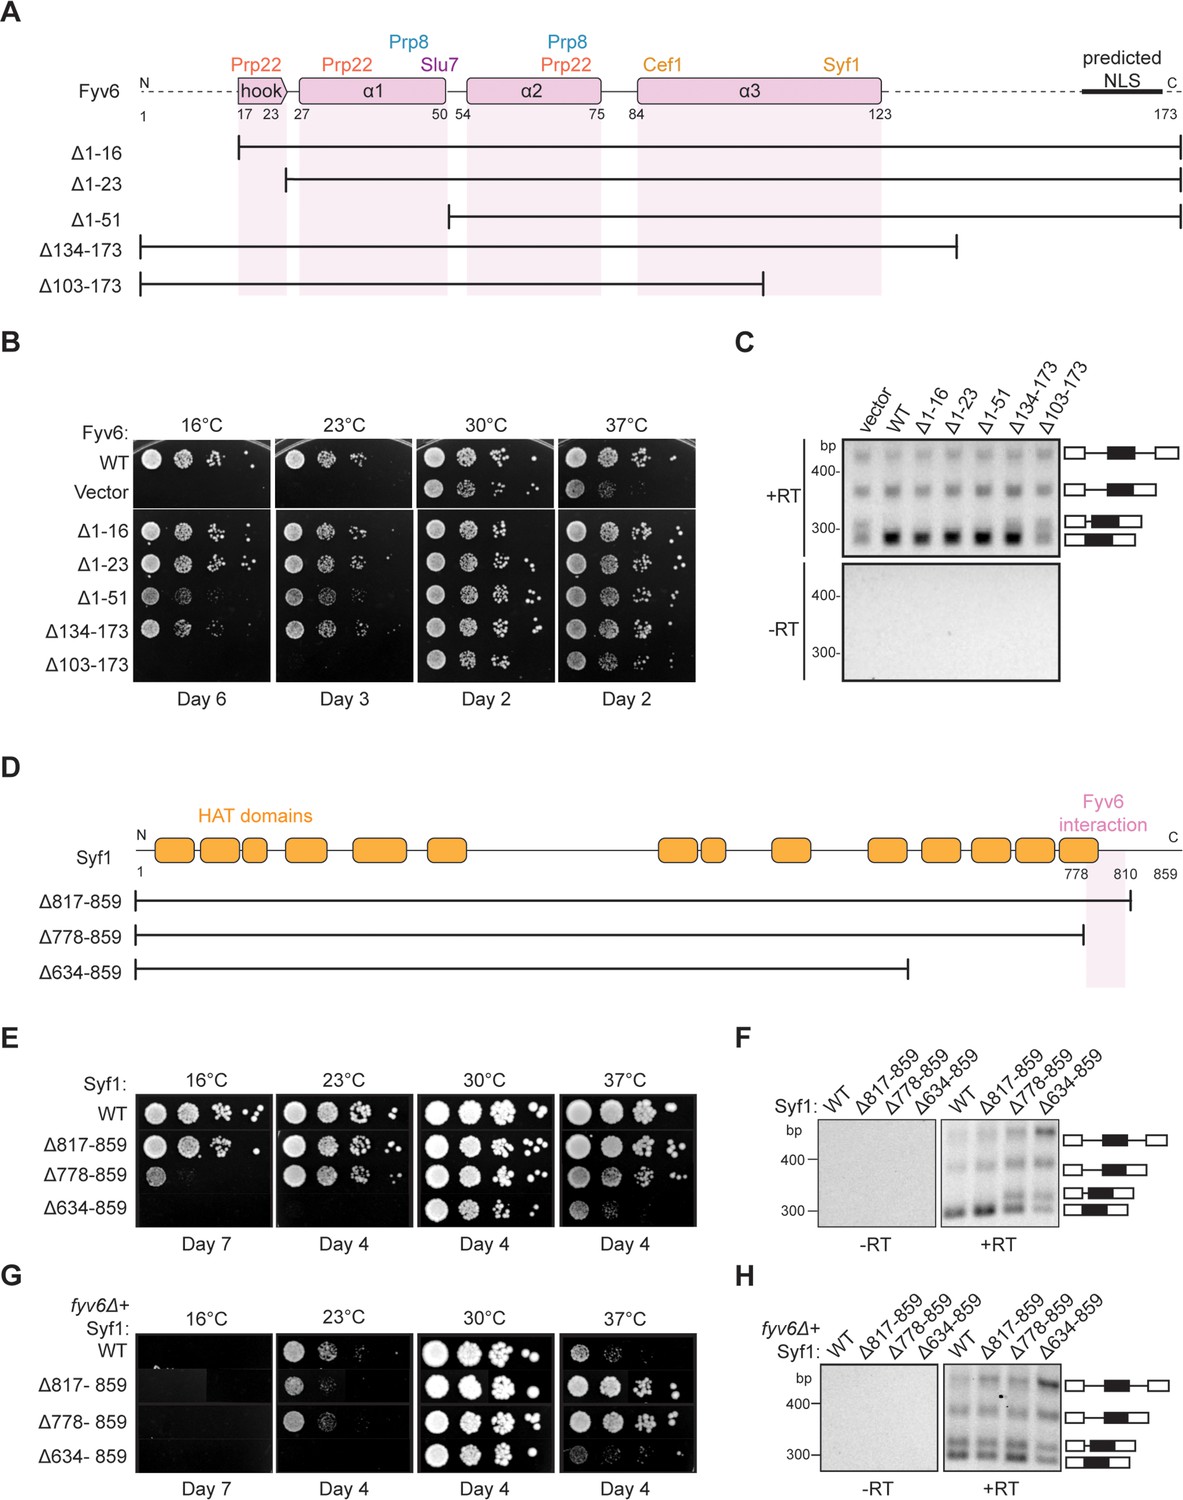
Structure-based analysis of Fyv6 domain function.
(A) Diagram of Fyv6 protein structure, protein interactors, and protein truncations. NLS = nuclear localization signal. (B) Spot dilution assay of strains with Fyv6 truncations on –Trp DO plates at different temperatures. Plates were imaged after the number of days indicated. (C) Representative gel image of SUS1 RT-PCR in strains with an empty vector or expressing the indicated Fyv6 variant. (+RT reactions contain reverse transcriptase; –RT control reactions do not contain reverse transcriptase.) (D) Diagram of Syf1 protein structure and truncations. (E) Spot dilution assay of strains with Syf1 truncations on –Trp DO plates at different temperatures. Plates were imaged after the number of days indicated. (F) Representative gel image of SUS1 RT-PCR in strains with an empty vector or expressing the indicated Syf1 variant. (G) Temperature growth assay of strains with Syf1 truncations in a fyv6Δ background on YPD plates. Plates were imaged after the number of days indicated. (H) Representative gel image of RT-PCR of SUS1 in strains with plasmids containing WT Syf1 or a Syf1 truncation in a fyv6Δ background.
-
Figure 5—source data 1
TIF files containing original blot images for Figure 5C, F, and H, indicating the relevant bands.
- https://cdn.elifesciences.org/articles/100449/elife-100449-fig5-data1-v1.zip
-
Figure 5—source data 2
The original gel images for Figure 5C, F, and H.
- https://cdn.elifesciences.org/articles/100449/elife-100449-fig5-data2-v1.zip
Figure 5—figure supplement 1
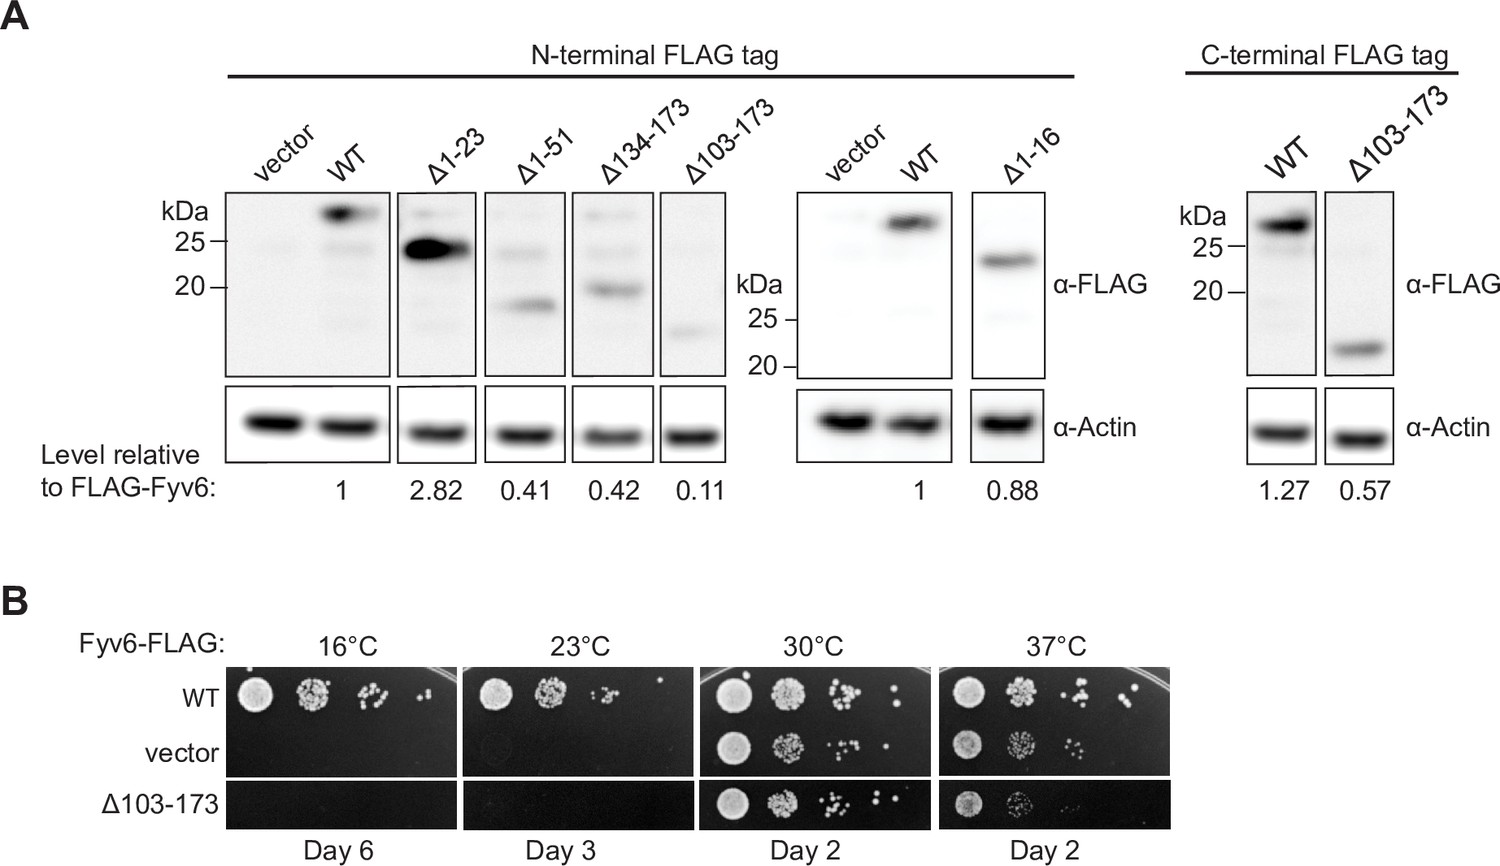
Expression of tagged Fyv6 constructs.
(A) Expression of FLAG-tagged Fyv6 truncations visualized by western blot using anti-FLAG antibody. Actin was used as a loading control. (B) Temperature growth assay of C-terminally FLAG-tagged WT Fyv6 and the Δ103–173 truncation on –Trp plates. Plates were imaged after days indicated.
-
Figure 5—figure supplement 1—source data 1
TIF files containing original blot images for Figure 5—figure supplement 1A, indicating the relevant bands.
- https://cdn.elifesciences.org/articles/100449/elife-100449-fig5-figsupp1-data1-v1.zip
-
Figure 5—figure supplement 1—source data 2
The original images for Figure 5—figure supplement 1A.
- https://cdn.elifesciences.org/articles/100449/elife-100449-fig5-figsupp1-data2-v1.zip
Figure 6 with 2 supplements
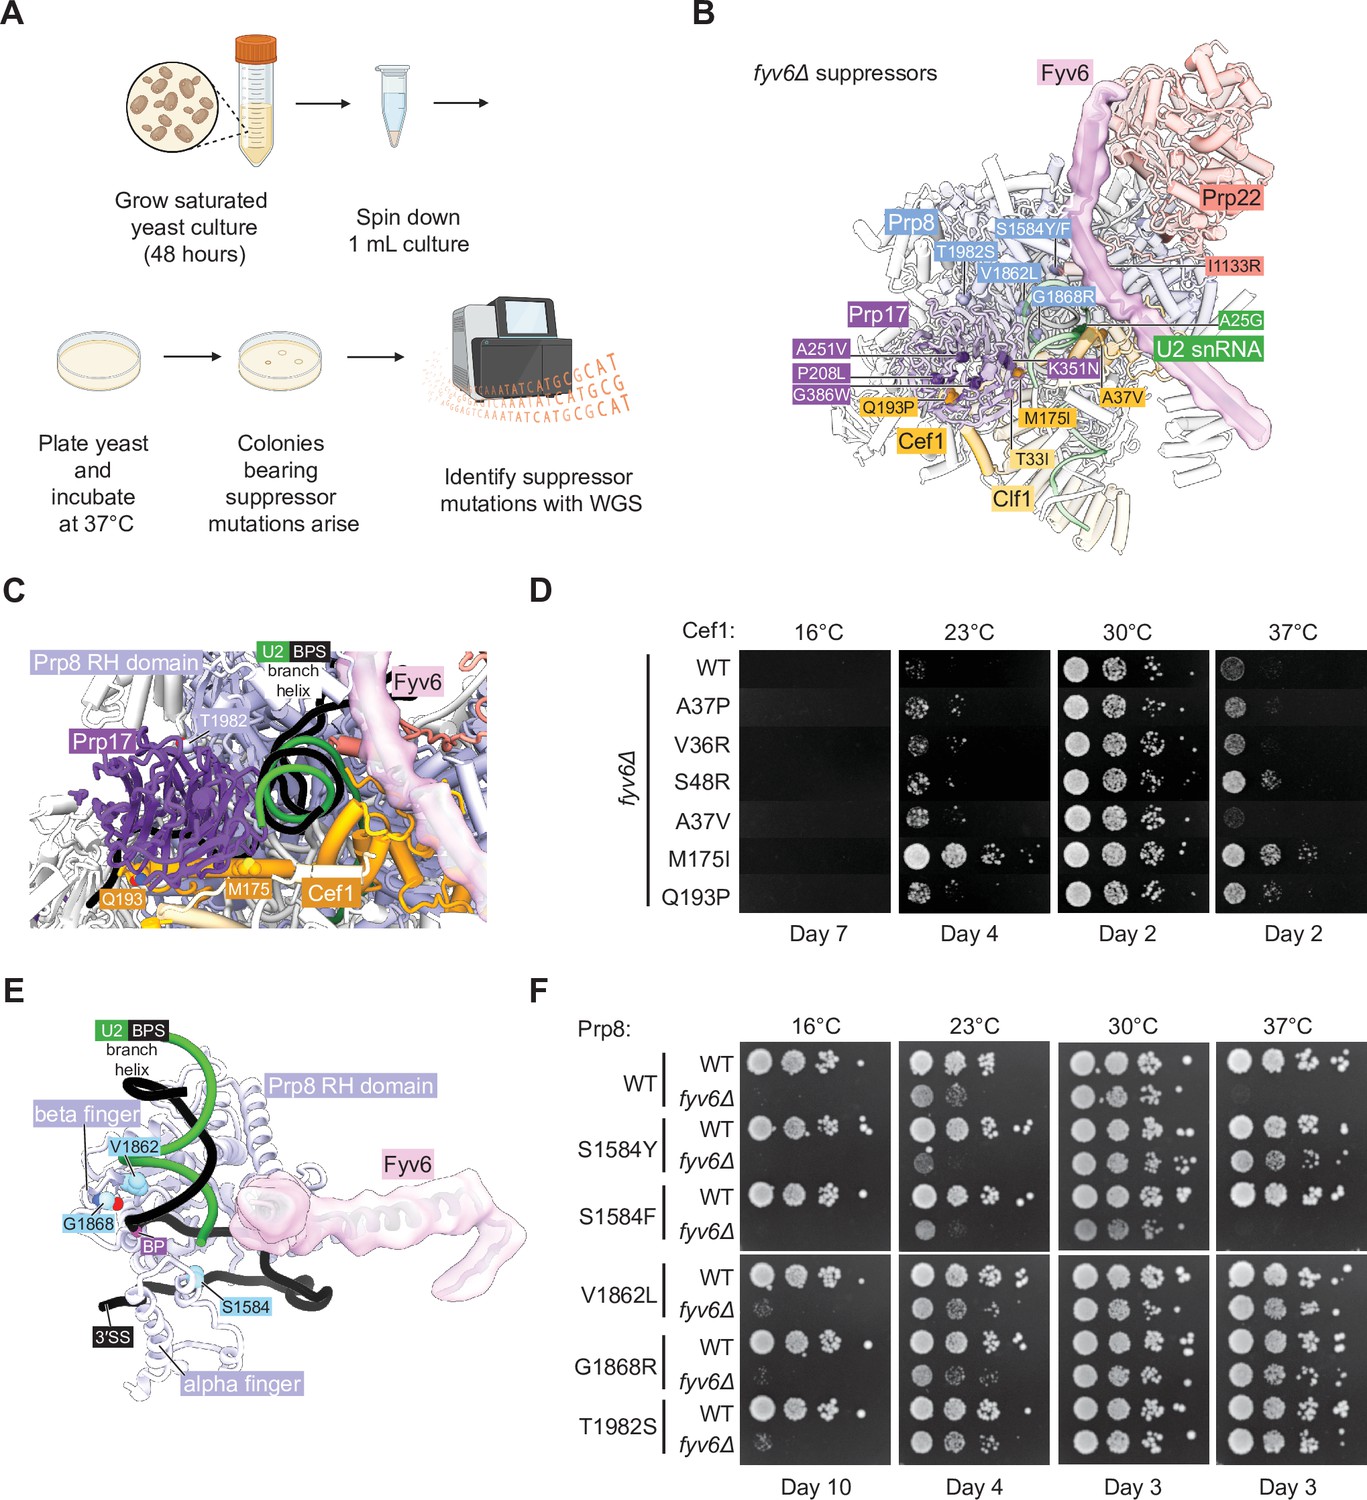
Identification of novel suppressors of fyv6Δ temperature sensitivity.
(A) Workflow for the suppressor screen. (B) P complex spliceosome structure with fyv6Δ suppressor mutations labeled (see Supplementary file 5). (C) Close-up view of Cef1 and Prp8 suppressor mutations in P complex. (D) Spot dilution temperature growth assay with Cef1 mutants on YPD plates. Plates were imaged after the number of days indicated. (E) Close-up view of Prp8 mutations in P complex. (F) Spot dilution temperature growth assay with Prp8 mutants on YPD plates. Plates were imaged after the number of days indicated.
Figure 6—figure supplement 1
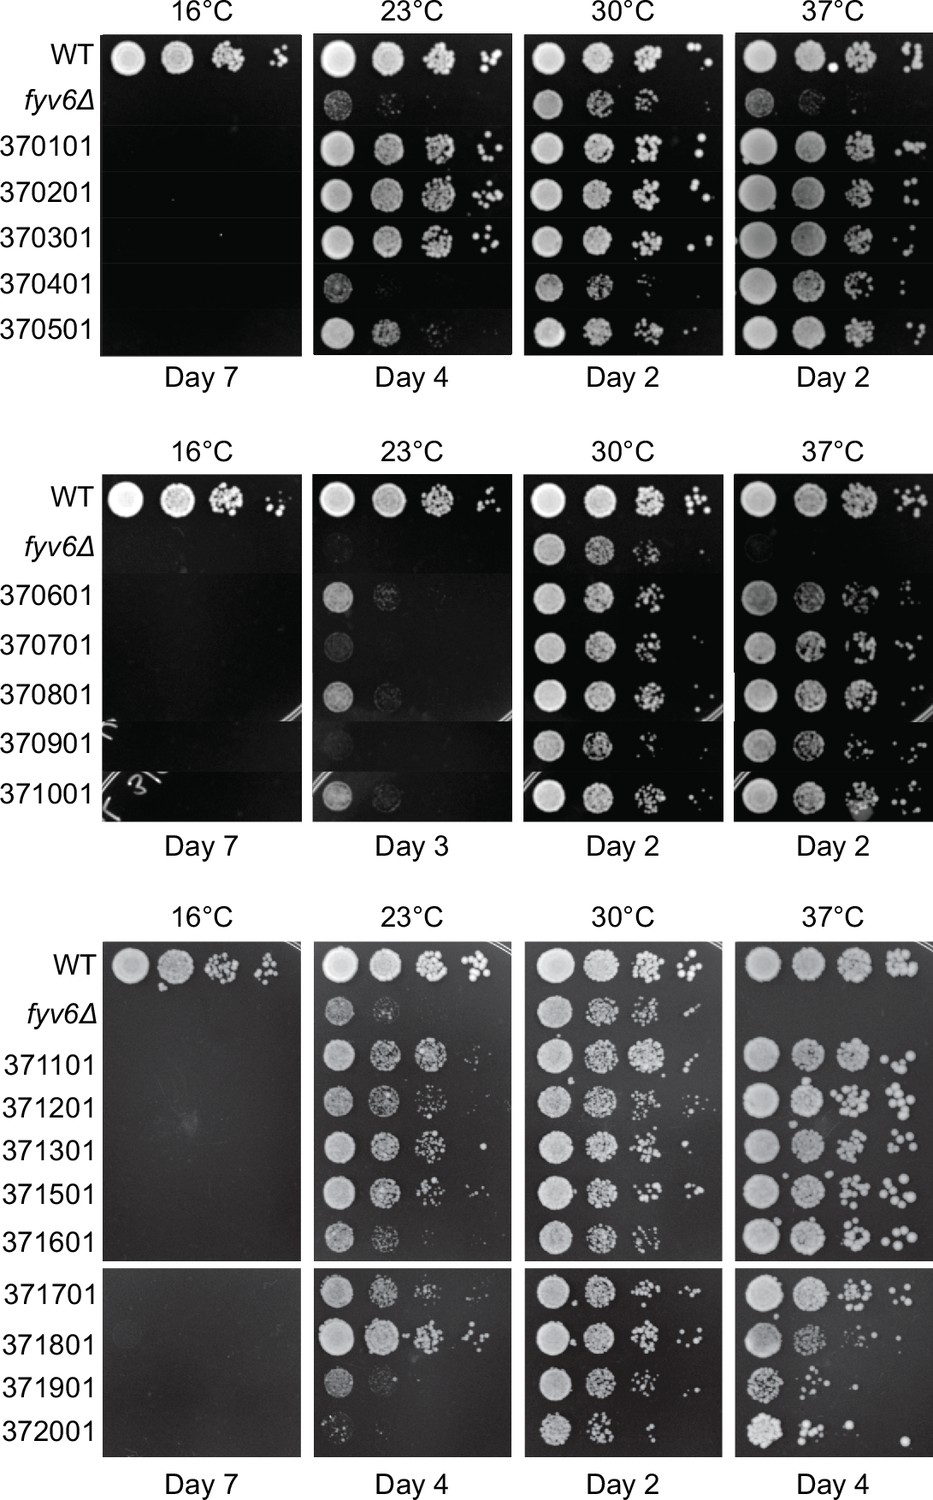
Isolated suppressor strains for fyv6Δ grown at different temperatures.
Strains were grown on YPD plates and imaged after the number of days indicated.
Figure 6—figure supplement 2
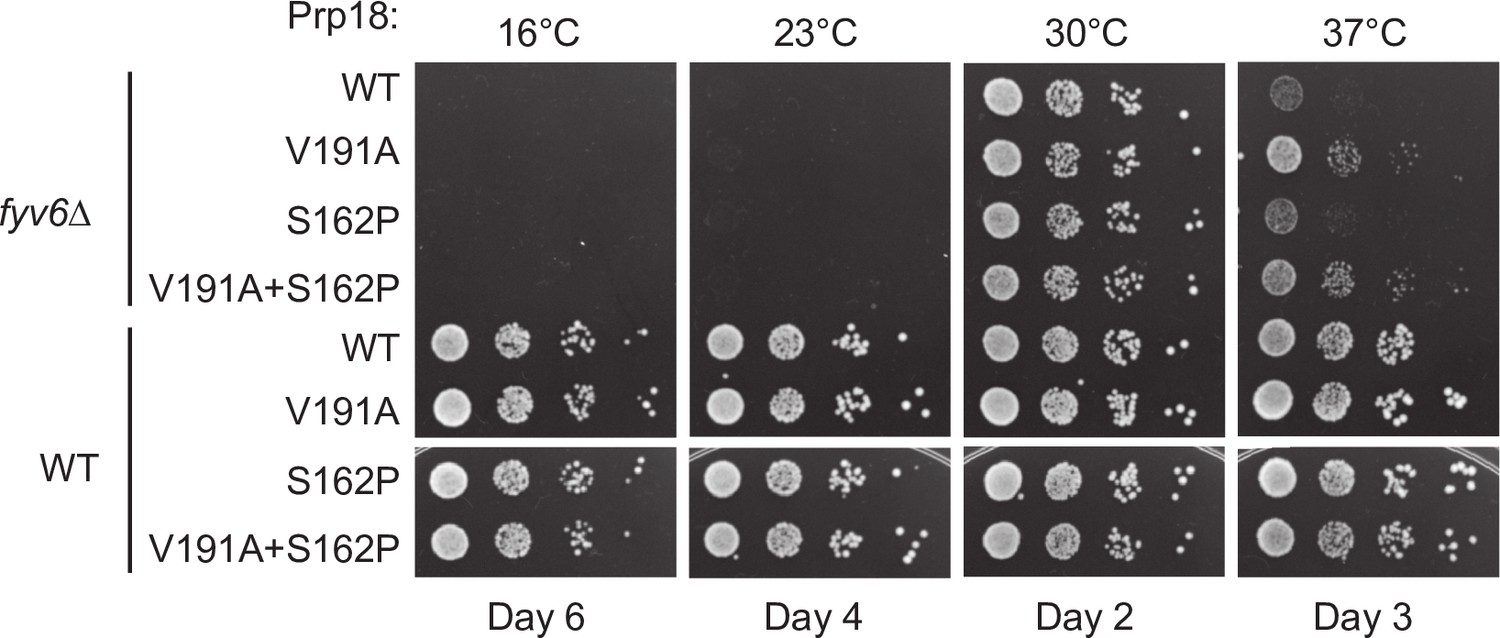
Genetic interactions between Prp18 and Fyv6.
Spot dilution temperature growth assay for genetic interactions of FYV6 deletion with Prp18 alleles on –Ura DO plates. Plate images were taken on days indicated.
Figure 7 with 2 supplements
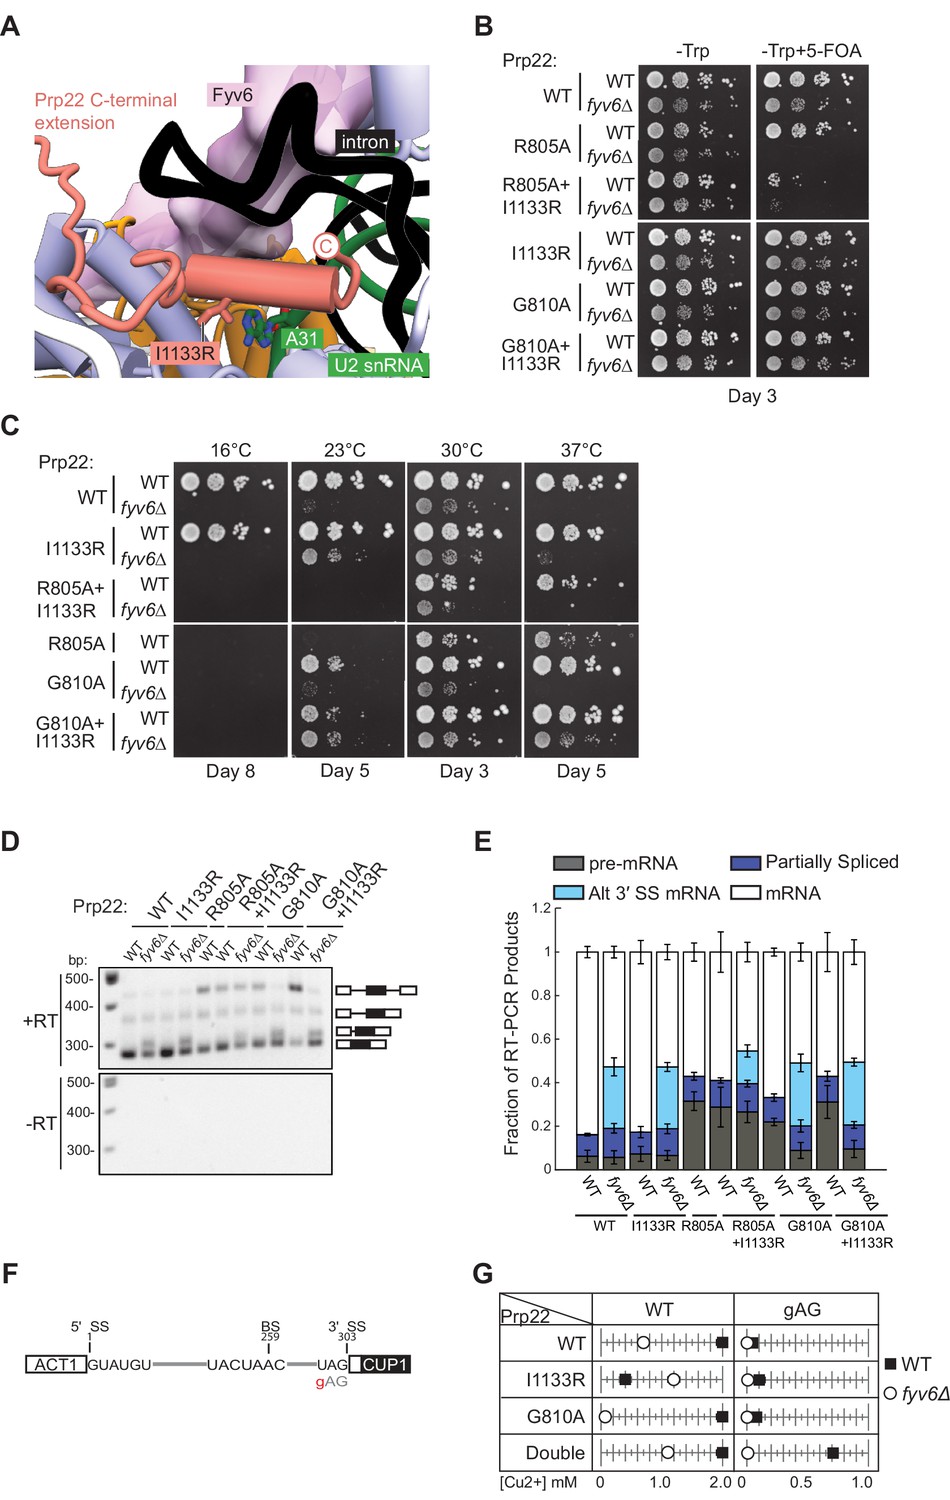
Genetic interactions between Prp22 and Fyv6.
(A) Location of the Prp22 I1133R fyv6Δ suppressor in the P complex structure. (B) Spot dilution growth assay with Prp22 mutants in WT or fyv6Δ backgrounds grown on –Trp DO or –Trp +5 FOA plates. Plates were imaged after 3 days at 30°C. (C) Spot dilution growth assay with strains containing Prp22 mutants on YPD plates at different temperatures. Plates were imaged after the number of days indicated. (D) Representative gel of SUS1 RT-PCR products in strains with Prp22 mutants in the presence or absence of Fyv6. (E) Quantitation of band intensities for each SUS1 splice isoform as a fraction of total product in the lane. Bars indicate average ± SD of N=3 biological replicates. (F) ACT1-CUP1 reporter construct with the location of the 3ʹ splice site (SS) substitution noted. (G) Copper tolerance for each ACT1-CUP1 reporter with each Prp22 allele in strains with (■) or without (○) Fyv6 present. Shown is a representative, single biological replicate of N=3.
-
Figure 7—source data 1
TIF files containing original gel images for Figure 7D, indicating the relevant bands.
- https://cdn.elifesciences.org/articles/100449/elife-100449-fig7-data1-v1.zip
-
Figure 7—source data 2
The original gel images for Figure 7D.
- https://cdn.elifesciences.org/articles/100449/elife-100449-fig7-data2-v1.zip
Figure 7—figure supplement 1

ACT1-CUP1 plate images for the data shown in Figure 7H.
Images of yeast growth on copper-containing –Leu DO media shown after 48 (WT) or 72 hr (fyv6Δ) for strains containing the indicated ACT1-CUP1 reporters.
Figure 7—figure supplement 2
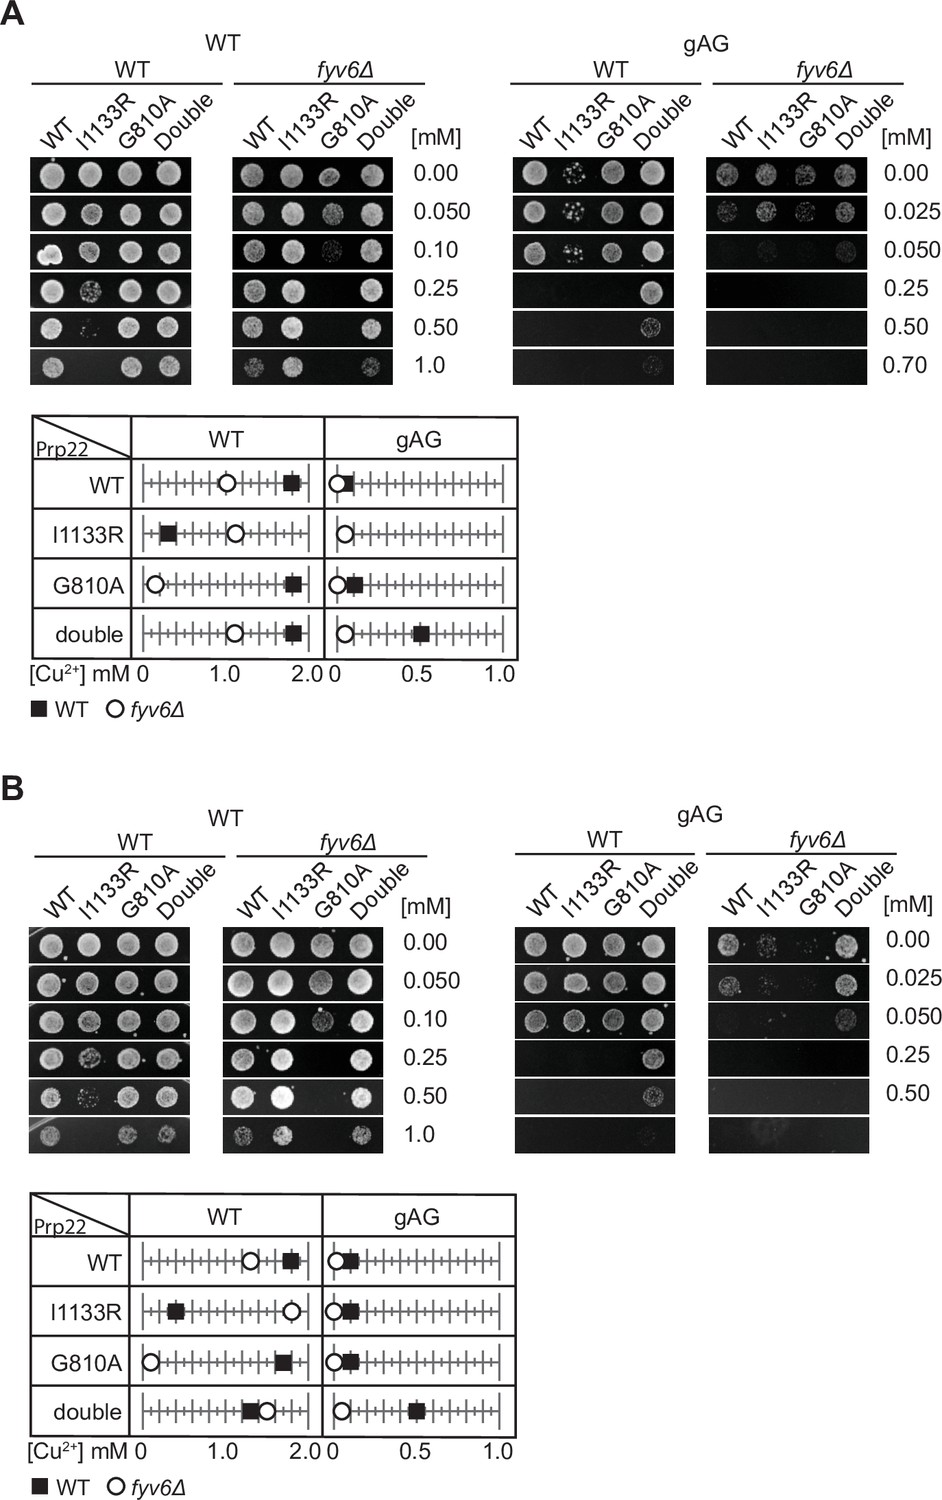
Replicate ACT1-CUP1 assays to those shown in Figure 7.
(A, B) Plate images and quantitation of copper tolerances for two additional biological replicates of the assay shown in Figure 7G. Images of representative yeast growth on copper-containing –Leu DO media shown after 48 (WT) or 72 hr (fyv6Δ) for strains containing the indicated ACT1-CUP1 reporters.
Figure 8

Model for the role of Fyv6 during the second step.
Fyv6 interacts with Syf1 and Prp22 and promotes usage of BP distal 3ʹ splice site (SS). When Fyv6 is absent, branch point (BP) proximal 3ʹ SS are favored. It is possible that lack of Fyv6 also results in the presence of Yju2 during exon ligation and relaxing of the requirement for Prp22 at this step.
Tables
Key resources table
| Reagent type (species) or resource | Designation | Source or reference | Identifiers | Additional information |
|---|---|---|---|---|
| Strain, strain background (Saccharomyces cerevisiae) | Various S. cerevisiae strains | Various sources, see Supplementary file 6 for a full list | See Supplementary file 6 for full list | |
| Recombinant DNA reagent | Various plasmids | Various sources, see Supplementary file 7 for a full list | See Supplementary file 7 for full list | |
| Sequence-based reagent | Various oligonucleotides | Integrated DNA Technologies Inc (IDT); see Supplementary file 8 for additional details | See Supplementary file 8 for full list | |
| Antibody | Anti-FLAG (Mouse monoclonal) | Sigma-Aldrich | Cat #: F1804; RRID:AB_262044 | WB (1:1000) |
| Antibody | Anti-actin (mouse monoclonal) | Sigma-Aldrich | Cat #: MAB1501; RRID:AB_2223041 | WB (1:5000) |
| Antibody | Anti-mouse IgG – HRP (Goat polyclonal) | Bio-Rad | Cat #: 1706516; RRID:AB_11125547 | WB (1:8000) |
| Peptide, recombinant protein | Bovine Serum Albumin | Sigma | Cat#: A7906 | |
| Commercial assay or kit | Clarity Western ECL substrate | Bio-Rad | Cat #: 1705060 | |
| Commercial assay or kit | Monarch RNA Cleanup Kit (50 µg) | New England Biolabs | Cat #: T2040 | |
| Commercial assay or kit | TURBO DNA-free kit | Thermo Fisher Scientific | Cat #: AM1907 | |
| Commercial assay or kit | TruSeq Stranded mRNA kit | Illumina | Cat #: 20020594 | |
| Commercial assay or kit | MasterPure Yeast RNA Purification kit | LGC Biosearch Technologies | Cat #: MPY03100 | |
| Commercial assay or kit | Access RT-PCR System | Promega | Cat #: A1250 | |
| Chemical compound, drug | Ni-NTA agarose | QIAGEN | Cat #: 30210 | |
| Chemical compound, drug | Amylose resin | New England Biolabs | Cat #: E8022S | |
| Chemical compound, drug | Fluorescein-5-thiosemicarbazide | Sigma-Aldrich | Cat #: 46985-100MG-F | |
| Software, algorithm | RELION-5.0 | Kimanius et al., 2024 | RRID:SCR_016274 | https://relion.readthedocs.io/en/latest/index.html |
| Software, algorithm | Topaz | Bepler et al., 2019 | https://cb.csail.mit.edu/topaz/ | |
| Software, algorithm | Coot | Casañal et al., 2020 | RRID:SCR_014222 | https://www2.mrc-lmb.cam.ac.uk/personal/pemsley/coot/ |
| Software, algorithm | ISOLDE | Croll, 2018 | RRID:SCR_025577 | https://tristanic.github.io/isolde/ |
| Software, algorithm | PHENIX | Liebschner et al., 2019 | RRID:SCR_014224 | https://phenix-online.org/ |
| Software, algorithm | UCSF ChimeraX | Pettersen et al., 2021 | RRID:SCR_015872 | http://www.cgl.ucsf.edu/chimerax/ |
| Software, algorithm | R Project for Statistical Computing | R Foundation for Statistical Computing | RRID:SCR_001905 | https://www.r-project.org/ |
| Software, algorithm | FASTQC | Andrews, 2010 | RRID:SCR_014583 | http://www.bioinformatics.babraham.ac.uk/projects/fastqc/ |
| Software, algorithm | Fastp | Chen et al., 2018 | RRID:SCR_016962 | https://github.com/OpenGene/fastp |
| Software, algorithm | STAR | Dobin et al., 2013 | RRID:SCR_004463 | https://github.com/alexdobin/STAR/releases |
| Software, algorithm | SAMtools | Li et al., 2009 | RRID:SCR_002105 | https://www.htslib.org/ |
| Software, algorithm | Salmon | Patro et al., 2017 | RRID:SCR_017036 | https://combine-lab.github.io/salmon/ |
| Software, algorithm | DeSeq2 | Love et al., 2014 | RRID:SCR_015687 | https://bioconductor.org/packages/release/bioc/html/DESeq2.html |
| Software, algorithm | featureCounts | Liao et al., 2014 | RRID:SCR_012919 | https://bioconductor.org/packages/release/bioc/html/Rsubread.html |
| Software, algorithm | SpliceWiz | Wong et al., 2023 | https://github.com/alexchwong/SpliceWiz | |
| Software, algorithm | Image J 1.53v | Schneider et al., 2012 | RRID:SCR_003070 | https://imagej.net/ij/ |
| Other | Cryo-EM grid | Quantifoil | Cat #: Q350CR2-2NM | Used to prepare samples for cryo-EM |
| Other | NuPAGE Bis-Tris mini protein gel | Invitrogen | Cat #: NP0322 | Used for SDS-PAGE analysis of proteins and western blotting |
| Other | NuPAGE MES SDS Running Buffer | Invitrogen | Cat #: NP0002 | Used for SDS-PAGE analysis of proteins and western blotting |
| Other | Standard Vitrobot Filter Paper, Ø55/20 mm, Grade 595 | Ted Pella | Cat #: 47000-100 | Used to prepare samples for cryo-EM |
| Other | Mixed cellulose ester filter paper | Whatman | WHA7140104 | Used for yeast isolation |
| Other | TRIzol | Thermo Fisher Scientific | Cat #: 15596018 | Used for RNA extraction from yeast |
| Other | SuperScript III reverse transcriptase | Thermo Fisher Scientific | Cat #: 18080044 | Used for RT-PCR |
| Other | Zymolyase | Zymo Research | Cat #: E1005 | Used at 50 U/mL; used for RNA extraction from yeast |
Additional files
-
Supplementary file 1
Read mapping and other information for RNA-sequencing (RNA-seq) datasets.
- https://cdn.elifesciences.org/articles/100449/elife-100449-supp1-v1.xlsx
-
Supplementary file 2
RNA-sequencing (RNA-seq) datasets used for analysis for each figure.
- https://cdn.elifesciences.org/articles/100449/elife-100449-supp2-v1.docx
-
Supplementary file 3
ACT1-CUP1 reporter sequences with variable BS to 3' splice site (SS) distances.
- https://cdn.elifesciences.org/articles/100449/elife-100449-supp3-v1.docx
-
Supplementary file 4
Cryo-electron microscopy (cryo-EM) data collection and refinement statistics.
- https://cdn.elifesciences.org/articles/100449/elife-100449-supp4-v1.xlsx
-
Supplementary file 5
Mutations identified in fyv6Δ suppressor strains.
- https://cdn.elifesciences.org/articles/100449/elife-100449-supp5-v1.docx
-
Supplementary file 6
Yeast strains used in these studies.
- https://cdn.elifesciences.org/articles/100449/elife-100449-supp6-v1.docx
-
Supplementary file 7
Plasmids used in these studies.
- https://cdn.elifesciences.org/articles/100449/elife-100449-supp7-v1.docx
-
Supplementary file 8
Oligonucleotides used in these studies.
- https://cdn.elifesciences.org/articles/100449/elife-100449-supp8-v1.docx
-
MDAR checklist
- https://cdn.elifesciences.org/articles/100449/elife-100449-mdarchecklist1-v1.docx
Download links
A two-part list of links to download the article, or parts of the article, in various formats.
Downloads (link to download the article as PDF)
Open citations (links to open the citations from this article in various online reference manager services)
Cite this article (links to download the citations from this article in formats compatible with various reference manager tools)
Control of 3′ splice site selection by the yeast splicing factor Fyv6
eLife 13:RP100449.
https://doi.org/10.7554/eLife.100449.3


