A causal role of the NMDA receptor in recurrent processing during perceptual integration
- Department of Psychology, University of Amsterdam, Netherlands
- Amsterdam Brain and Cognition, University of Amsterdam, Netherlands
- Department of Psychiatry, Amsterdam UMC, University of Amsterdam, Netherlands
- Amsterdam Neuroscience, Netherlands
- Department of Applied and Experimental Psychology, Vrije Universiteit Amsterdam, Netherlands
Figures
Figure 1
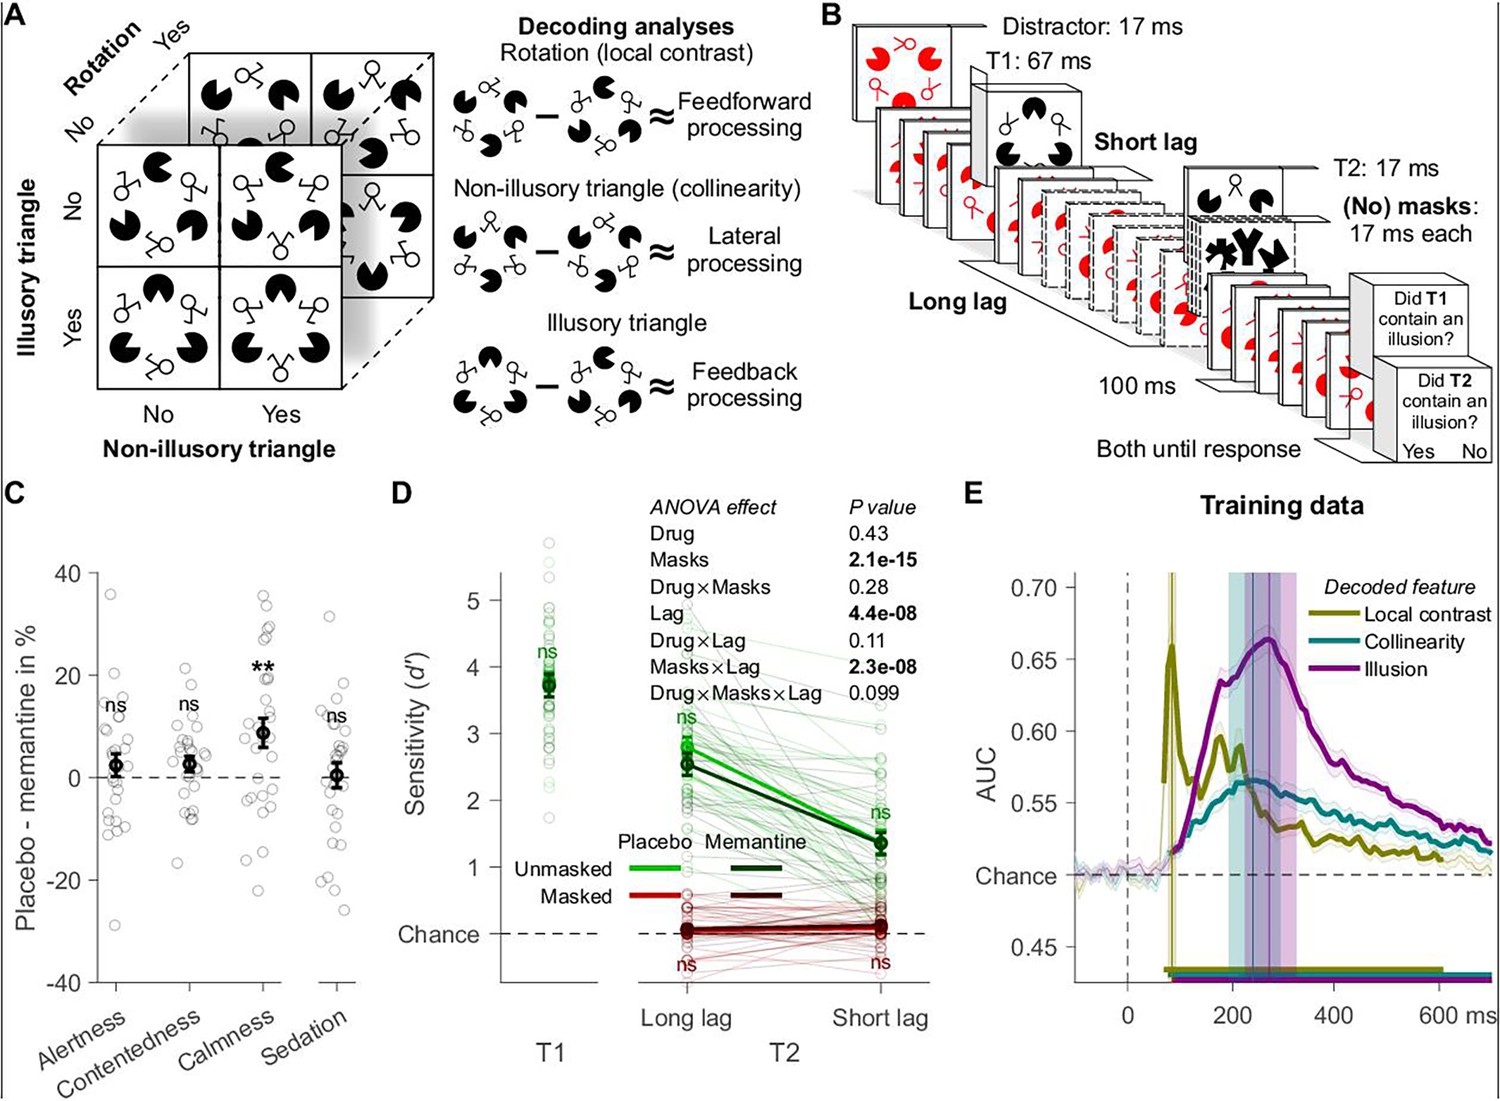
Experiment 1: design, behavior, and training data.
(A) Target stimulus set and schematic of the markers for the different types of processing (showing example stimuli). (B) Trial design. (C) Effects of memantine on subjective state assessed with the visual analog scale (n = 29). The categories alertness, contentedness, and calmness are based on Bond and Lader, 1974, sedation on Danion et al., 1989. For details, see Methods. (D) Participants’ ability to detect the Kanizsa illusion in the second target stimulus (T2). (E) Tenfold cross-validation decoding scheme applied to an independent training dataset. Mean decoding performance, area under the receiver operating characteristic curve (AUC), over time ± standard error of the mean (SEM) is shown. Thick lines differ from chance: p < 0.05, cluster-based permutation test. Local contrast, collinearity, and illusion decoding accuracy peaked at 86, 242, and 273 ms after stimulus onset, and these peaks were encompassed by a 78–94, 192–292, and 223–323 ms time window, respectively. Error bars are mean ± SEM. Individual data points are plotted using low contrast. Ns is not significant (p > 0.05). **p = 0.005.
Figure 2 with 1 supplement
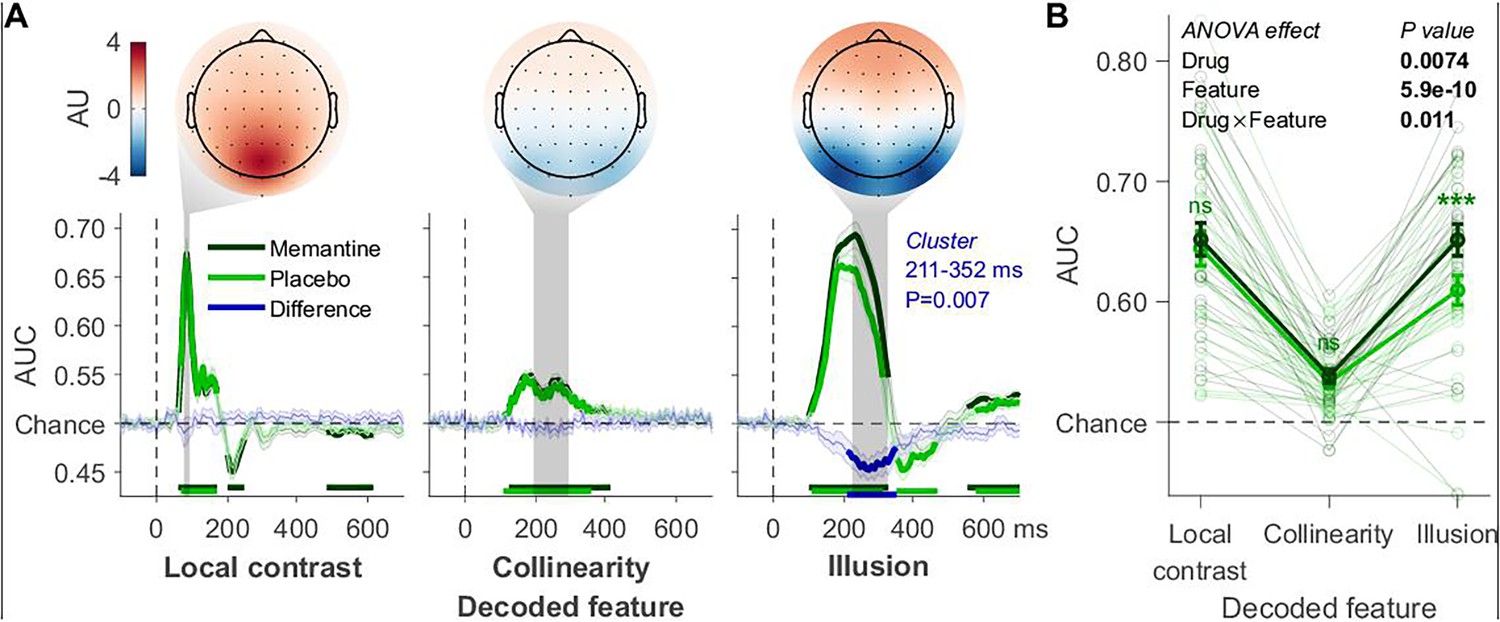
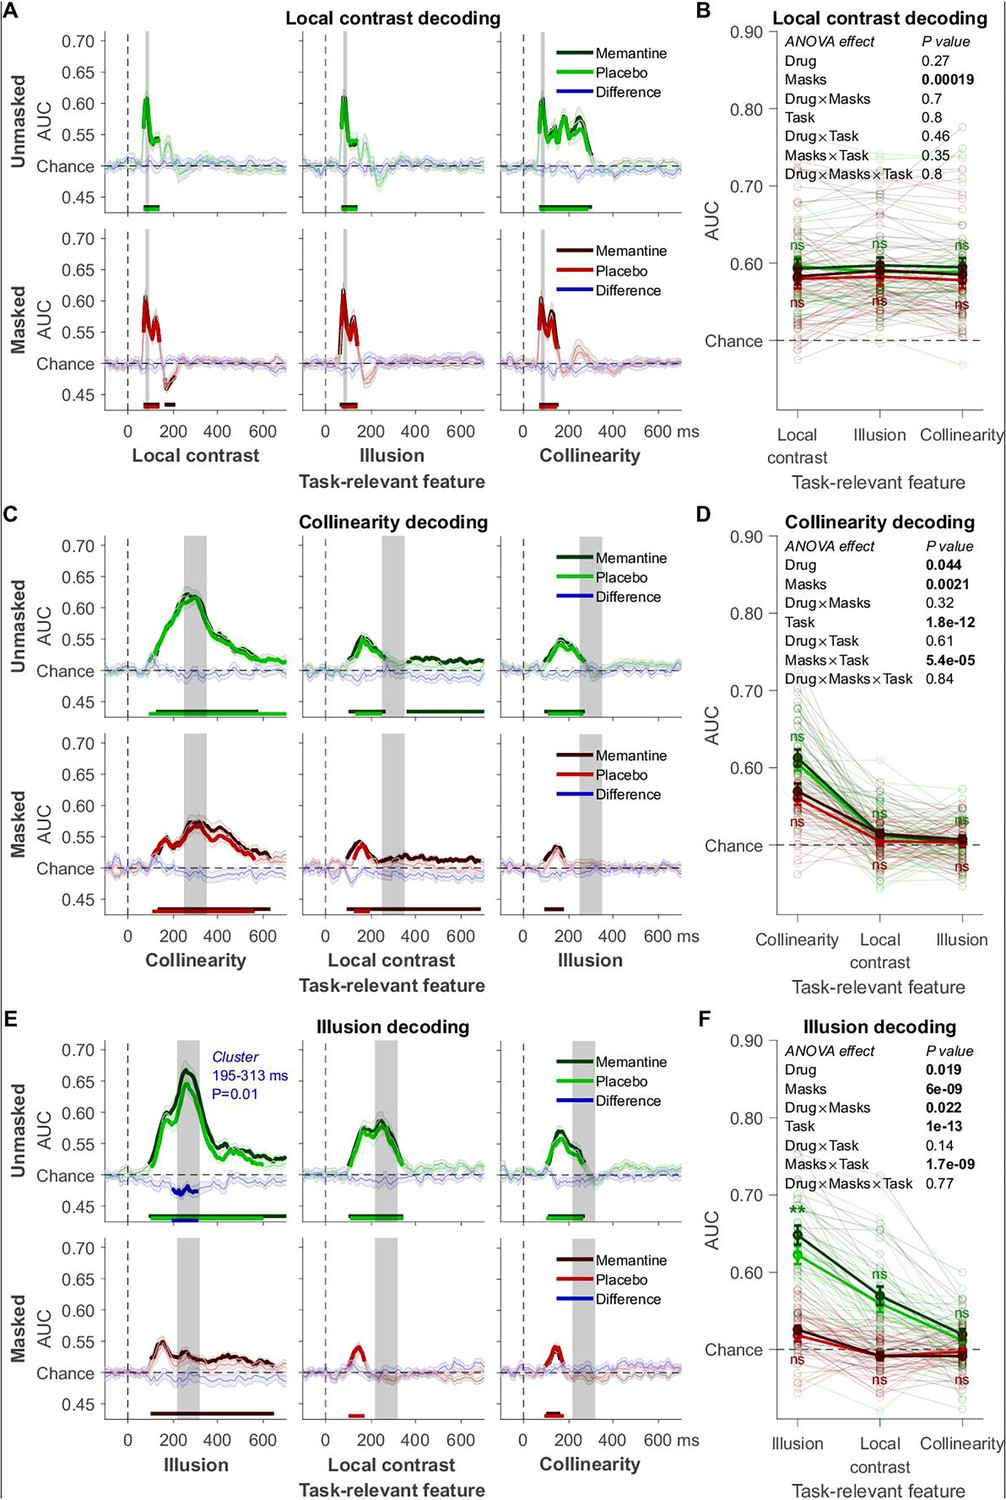
Decoding applied to the T1 data.
(A) Local contrast, collinearity, and Kanizsa illusion decoding. These three visual features’ time windows: 78–94, 192–292, and 223–323 ms, respectively. Covariance/class separability maps with arbitrary units (AU) reflecting underlying neural sources are shown. Below these maps: mean decoding performance, area under the receiver operating characteristic curve (AUC), over time ± standard error of the mean (SEM; n = 29). Thick lines differ from chance: p < 0.05, cluster-based permutation test. (B) Mean AUC for every time window. Error bars are mean ± SEM. Individual data points are plotted using low contrast. Ns is not significant (p > 0.05). ***p < 0.001.
Figure 2—figure supplement 1
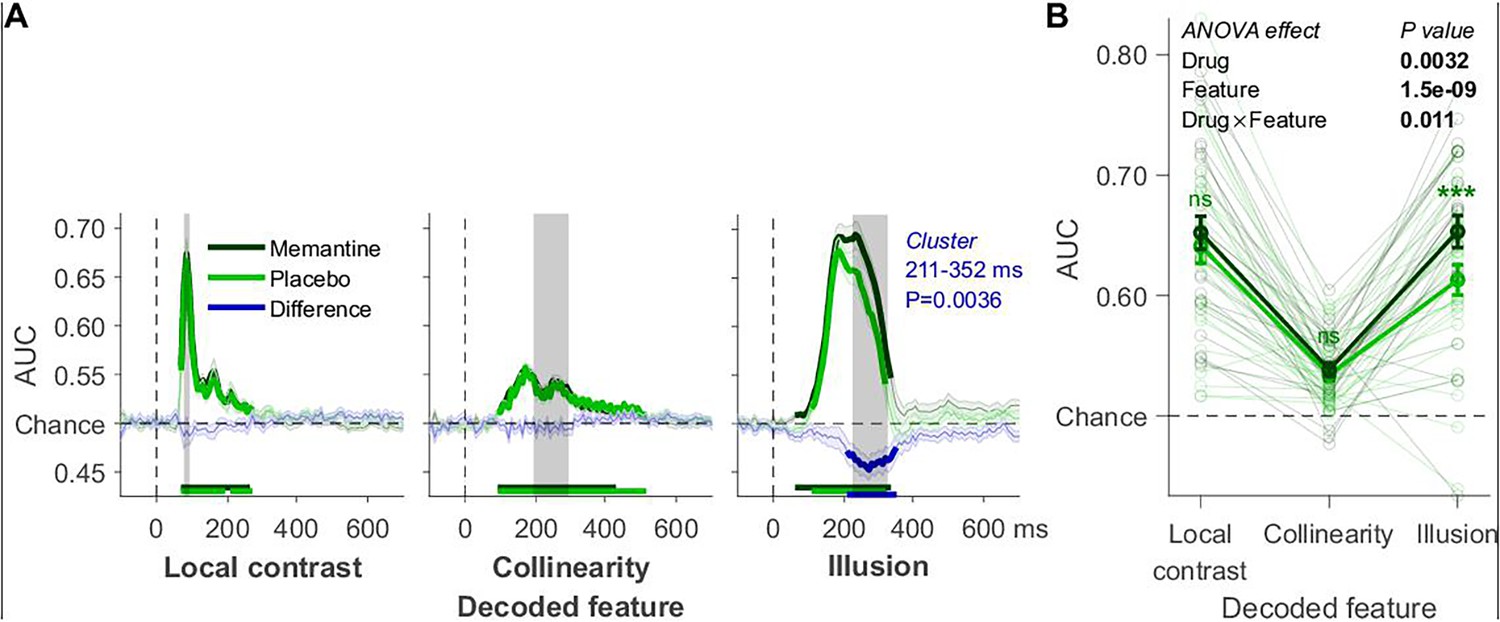
Diagonal decoding applied to the T1 data.
(A) Local contrast, collinearity, and Kanizsa illusion decoding. These three visual features’ time windows: 78–94, 192–292, and 223–323 ms, respectively. Mean decoding performance, area under the receiver operating characteristic curve (AUC), over time ± standard error of the mean (SEM; n = 29). Thick lines differ from chance: p < 0.05, cluster-based permutation test. (B) Mean AUC for every time window. Error bars are mean ± SEM. Individual data points are plotted using low contrast. Ns is not significant (p > 0.05). ***p < 0.001.
Figure 3 with 1 supplement
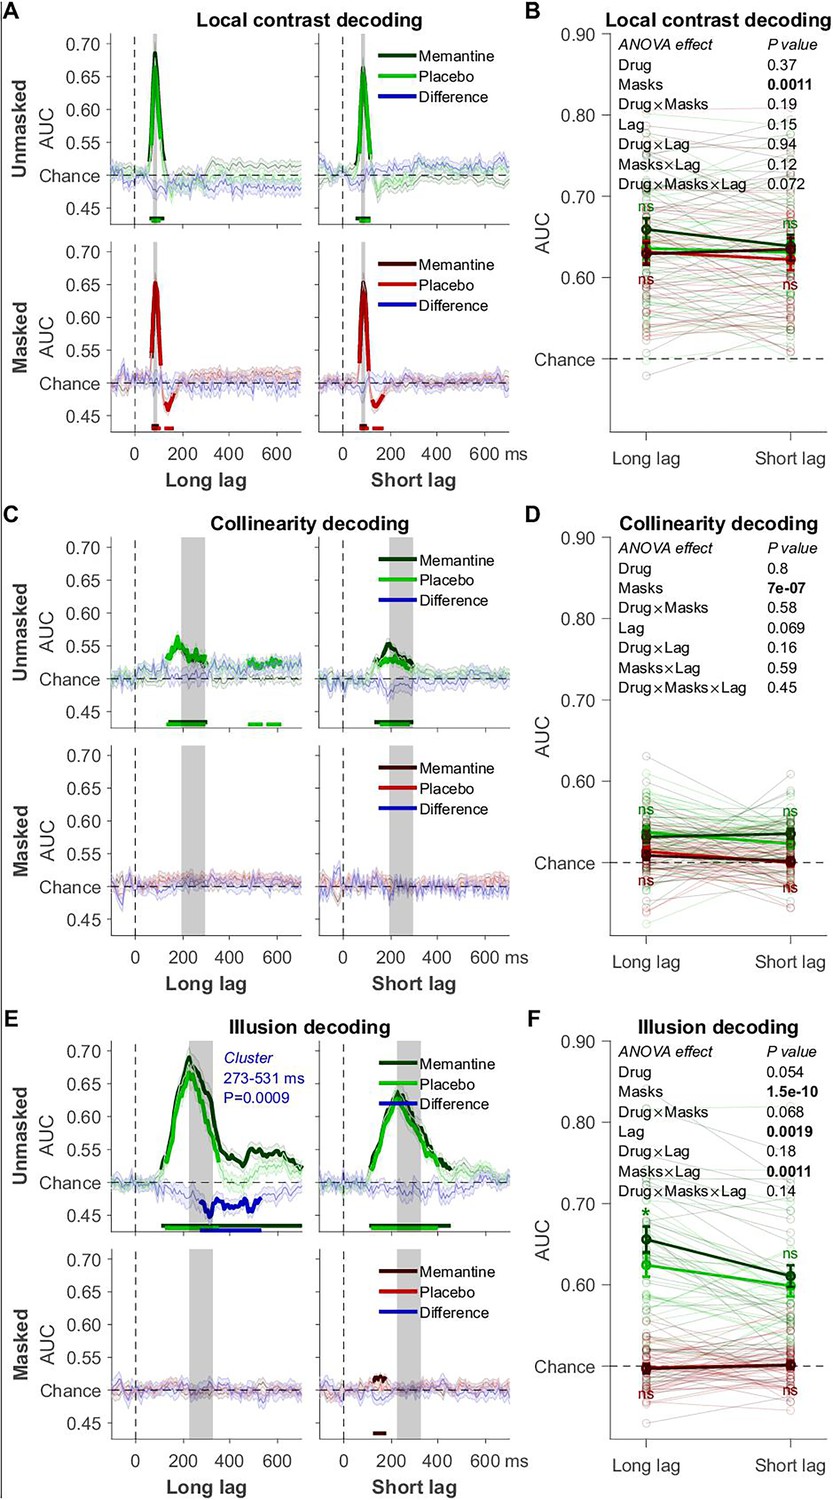
Decoding of the T2 data.
(A) Local contrast decoding: mean decoding performance, area under the receiver operating characteristic curve (AUC), over time ± standard error of the mean (SEM; n = 29). Thick lines differ from chance: p < 0.05, cluster-based permutation test. (B) Mean AUC for local contrast (rotation) decoding’s time window: 78–94 ms. Error bars are mean ± SEM. Individual data points are plotted using low contrast. Ns is not significant (p > 0.05). (C) Collinearity decoding: mean AUC over time. (D) Mean AUC for collinearity decoding’s time window: 192–292 ms. (E) Kanizsa illusion decoding: mean AUC over time. (F) Mean AUC for Kanizsa illusion’s time window: 223–323 ms. *p = 0.010.
Figure 3—figure supplement 1
Diagonal decoding of the T2 data.
(A) Local contrast decoding: mean decoding performance, area under the receiver operating characteristic curve (AUC), over time ± standard error of the mean (SEM; n = 29). Thick lines differ from chance: p < 0.05, cluster-based permutation test. (B) Mean AUC for local contrast (rotation) decoding’s time window: 78–94 ms. Error bars are mean ± SEM. Individual data points are plotted using low contrast. Ns is not significant (p > 0.05). (C) Collinearity decoding: mean AUC over time. (D) Mean AUC for collinearity decoding’s time window: 192–292 ms. (E) Kanizsa illusion decoding: mean AUC over time. (F) Mean AUC for Kanizsa illusion’s time window: 223–323 ms. *p = 0.019.
Figure 4 with 3 supplements
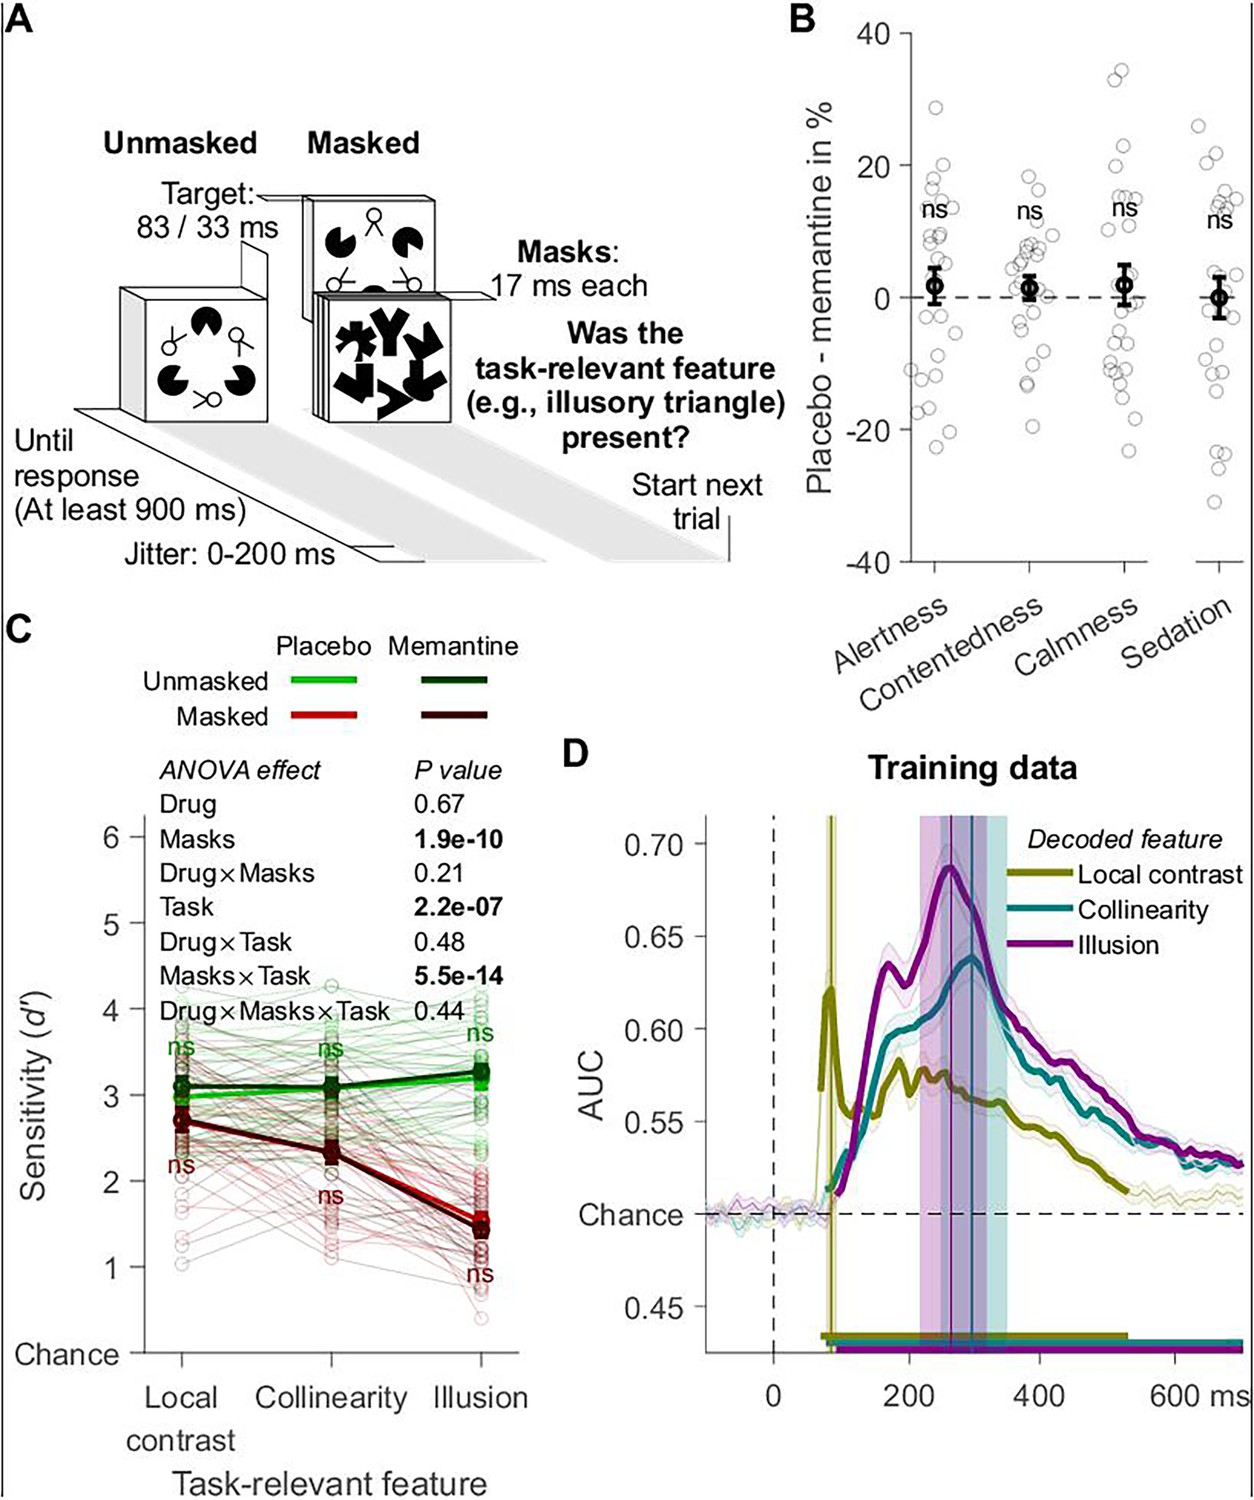
Experiment 2: design, behavior, and training data.
(A) Trial design. (B) Effects of memantine on subjective state assessed with the visual analog scale (VAS; n = 26, one fewer than in the other experiment 2 analyses due to incomplete VAS data). The categories alertness, contentedness, and calmness are based on Bond and Lader, 1974, sedation on Danion et al., 1989. For details, see Methods. (C) Participants’ ability to detect the task-relevant feature. (D) Tenfold cross-validation decoding scheme applied to an independent training dataset. Mean decoding performance, area under the receiver operating characteristic curve (AUC), over time ± standard error of the mean (SEM) is shown. Thick lines differ from chance: p < 0.05, cluster-based permutation test. Local contrast, collinearity, and illusion decoding accuracy peaked at 86, 297, and 266 ms after stimulus onset, and these peaks were encompassed by a 78–94, 247–347, and 217–317 ms time window, respectively. Error bars are mean ± SEM. Individual data points are plotted using low contrast. Ns is not significant (p > 0.05).
Figure 4—figure supplement 1
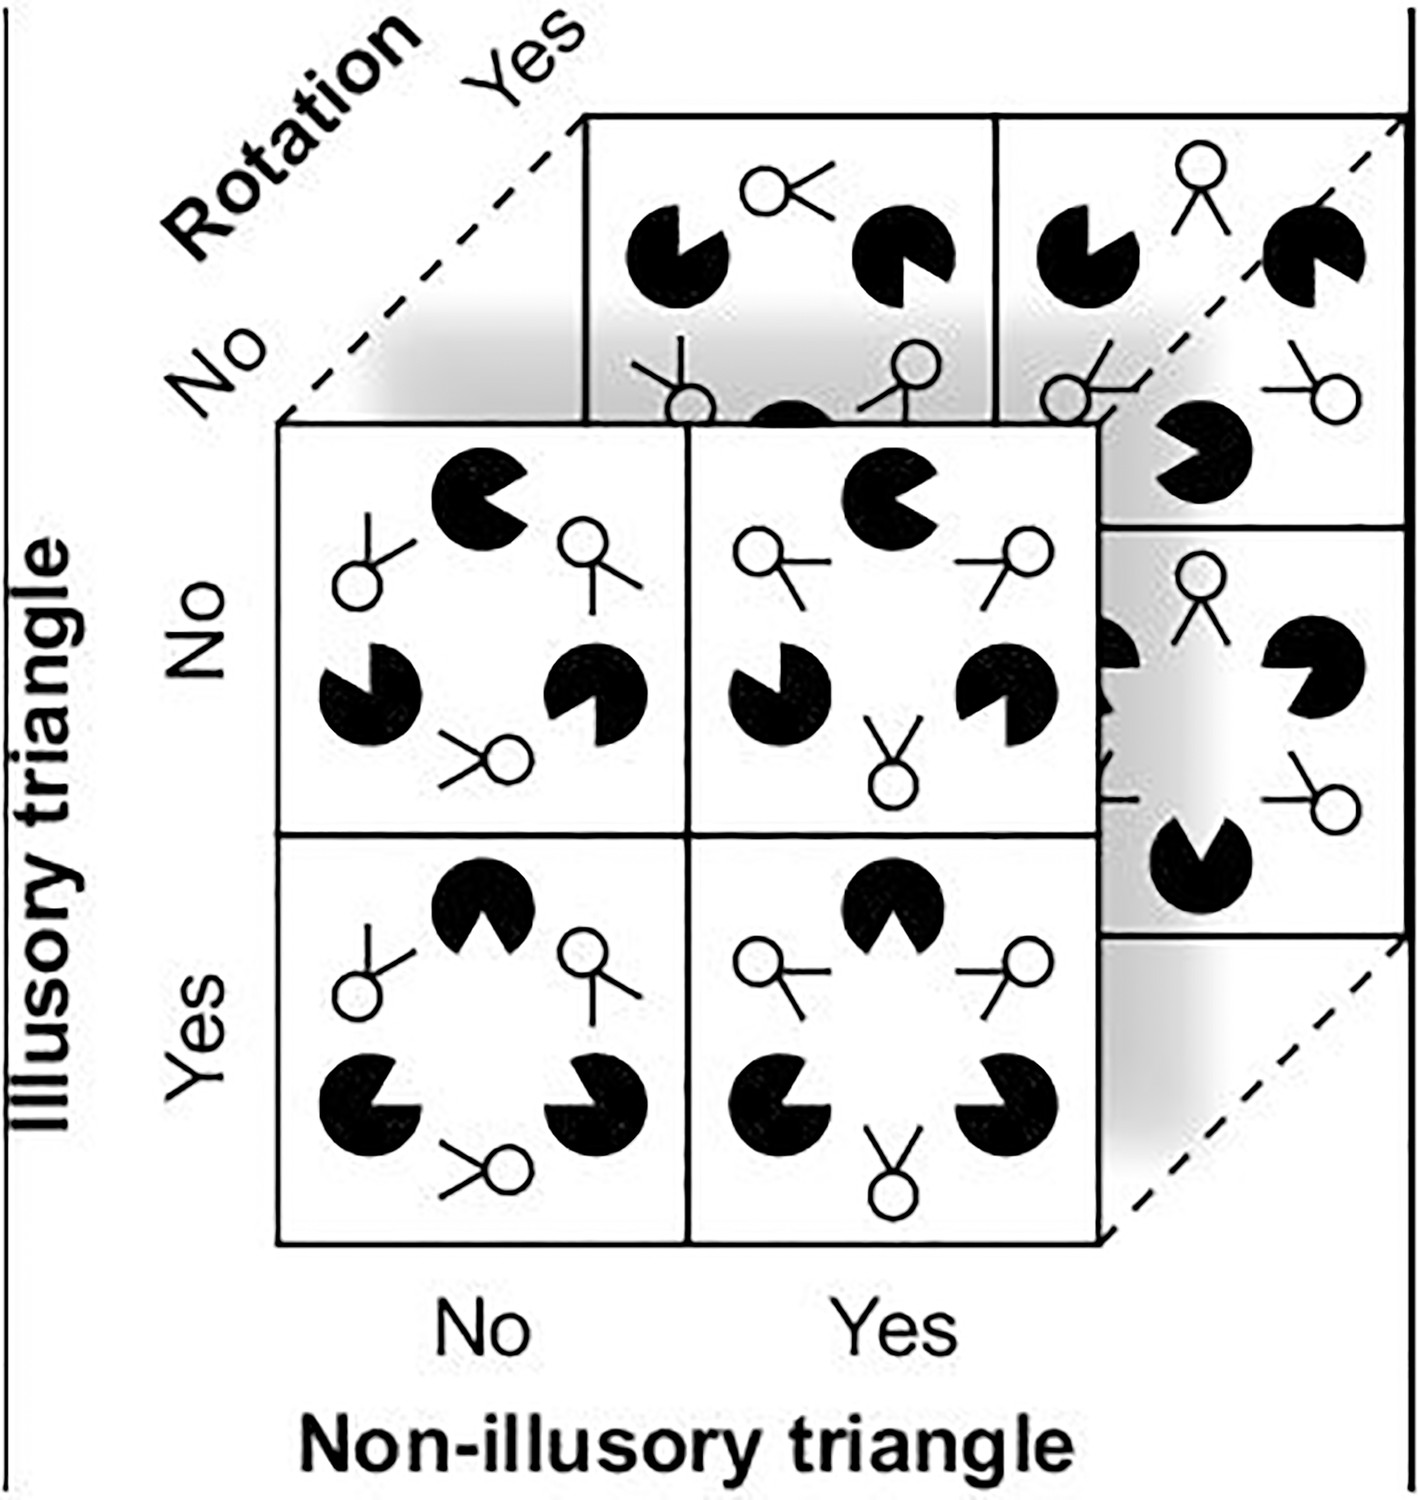
Stimulus set of experiment 2.
Figure 4—figure supplement 2
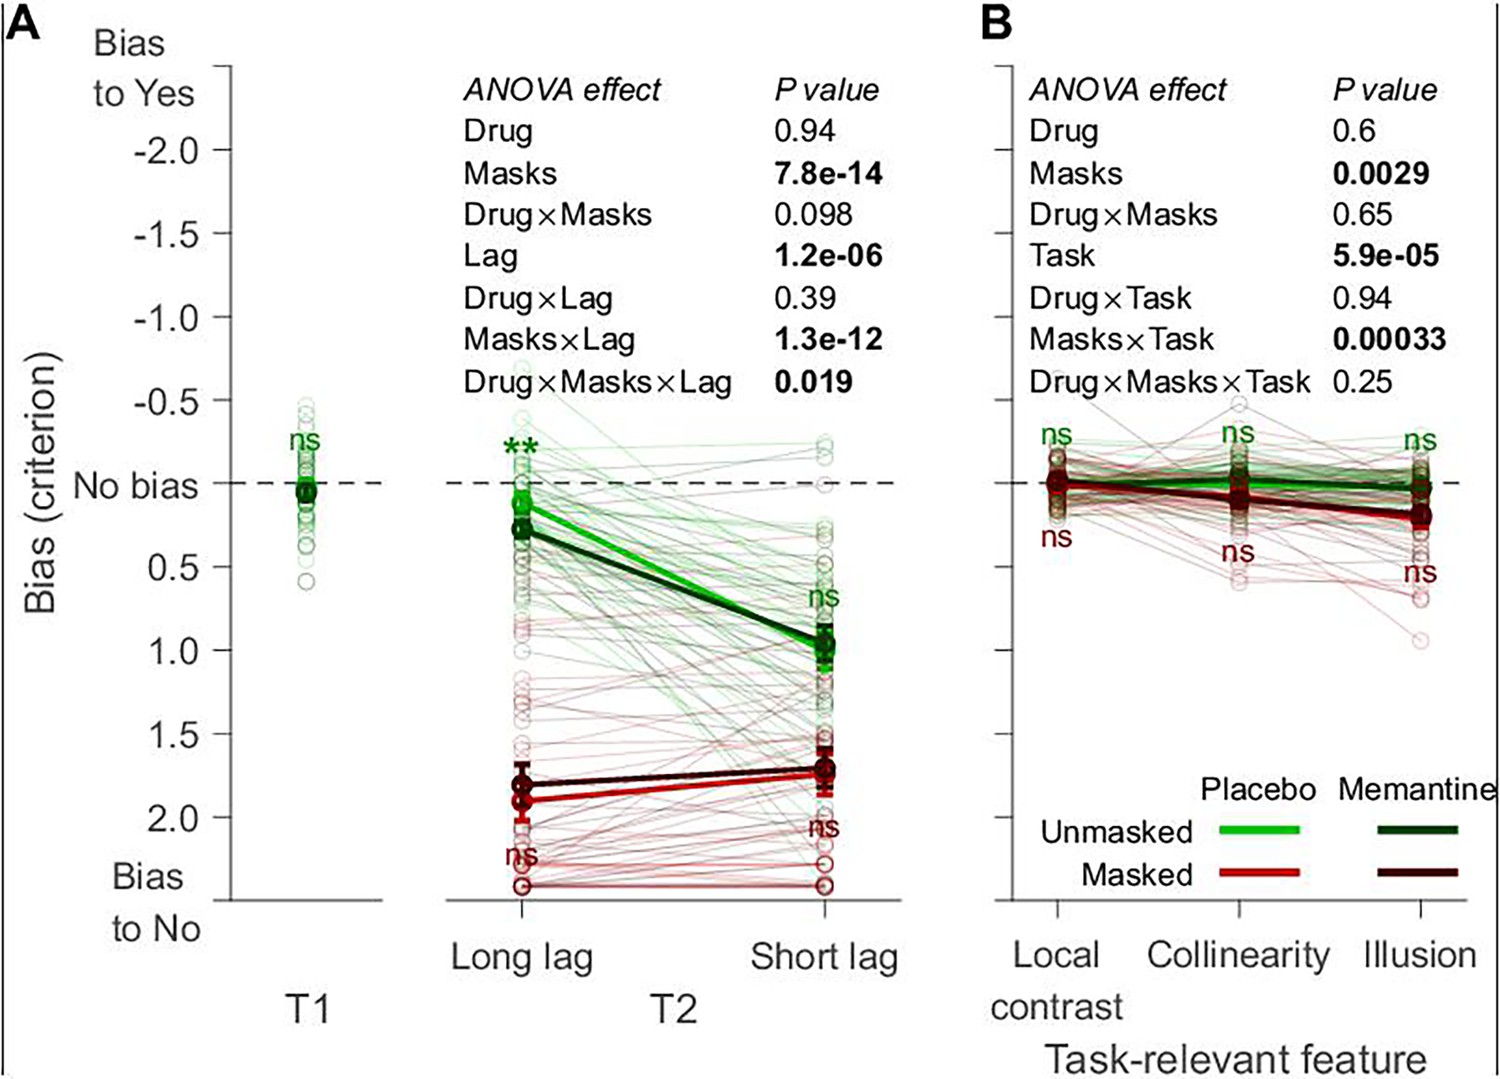
Bias.
The participants‘ propensity to indicate the presence of (A) the Kanizsa illusion in experiment 1 (n = 29) and (B) the task-relevant feature in experiment 2 (n = 27). Ns is not significant (p > 0.05). Error bars are mean ± standard error of the mean. Individual data points are plotted using low contrast. **p = 0.007.
Figure 4—figure supplement 3
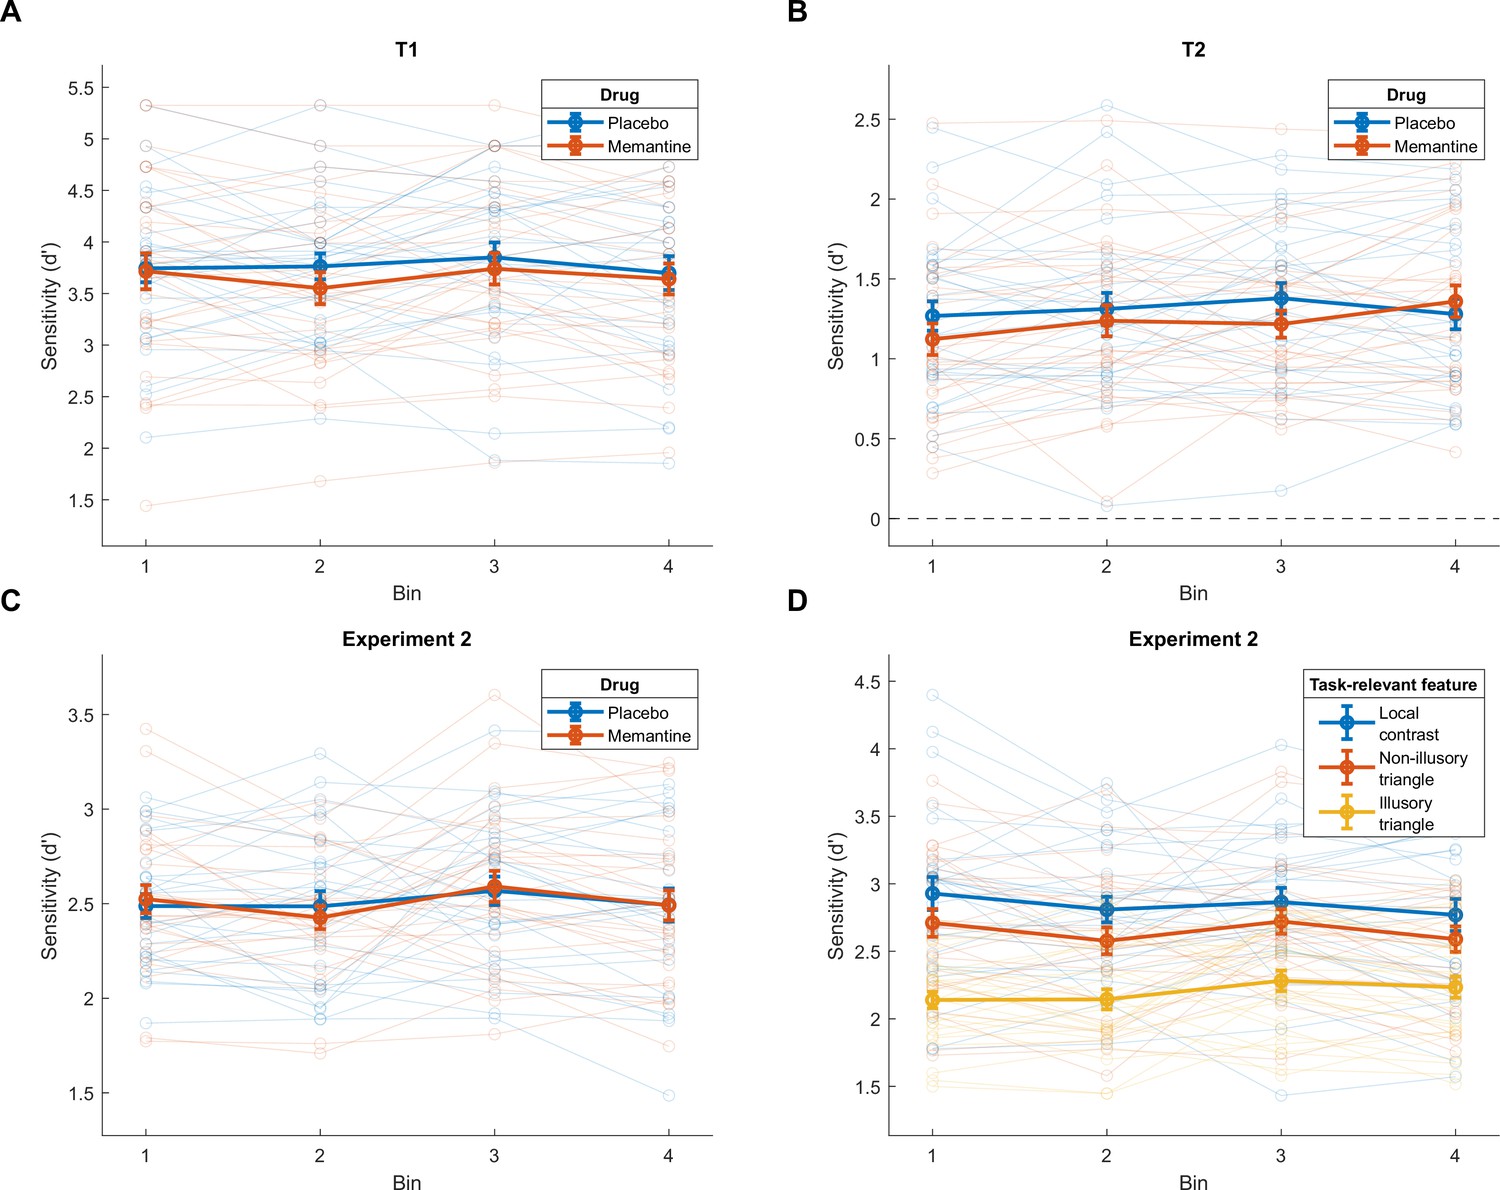
Behavior over the course of the experiments, divided into four time bins.
(A) Experiment 1 (n = 29): first target (T1). For T1 in the first experiment, there was no interaction between the factors bin and drug (memantine/placebo; F3,84 = 0.89, p = 0.437). (B) Experiment 1: second target (T2). For T2, we performed a repeated-measures ANOVA with the factors bin, drug, T1–T2 lag (short/long), and masks (present/absent). There was only a trend toward a bin by drug interaction (F3,84 = 2.57, p = 0.064), reflecting worse performance under memantine in the first three bins and slightly better performance in the fourth bin. The other interactions that include the factors bin and drug factors were not significant (all p > 0.117). (C) Experiment 2 (n = 27): bin by drug interaction and (D) experiment 2: bin by task-relevant feature interaction. For the second experiment, we performed a repeated-measures ANOVA with the factors bin, drug, masks, and task-relevant feature (local contrast/collinearity/illusion). None of the interactions that included the bin and drug factors were significant (all p > 0.219). Taken together, memantine did not appear to affect Kanizsa illusion detection performance through perceptual learning. Finally, there was no interaction between the factors bin and task-relevant feature (F6,150 = 0.76, p = 0.547), suggesting that there was no perceptual learning effect specific to Kanizsa illusion detection.
Figure 5 with 1 supplement
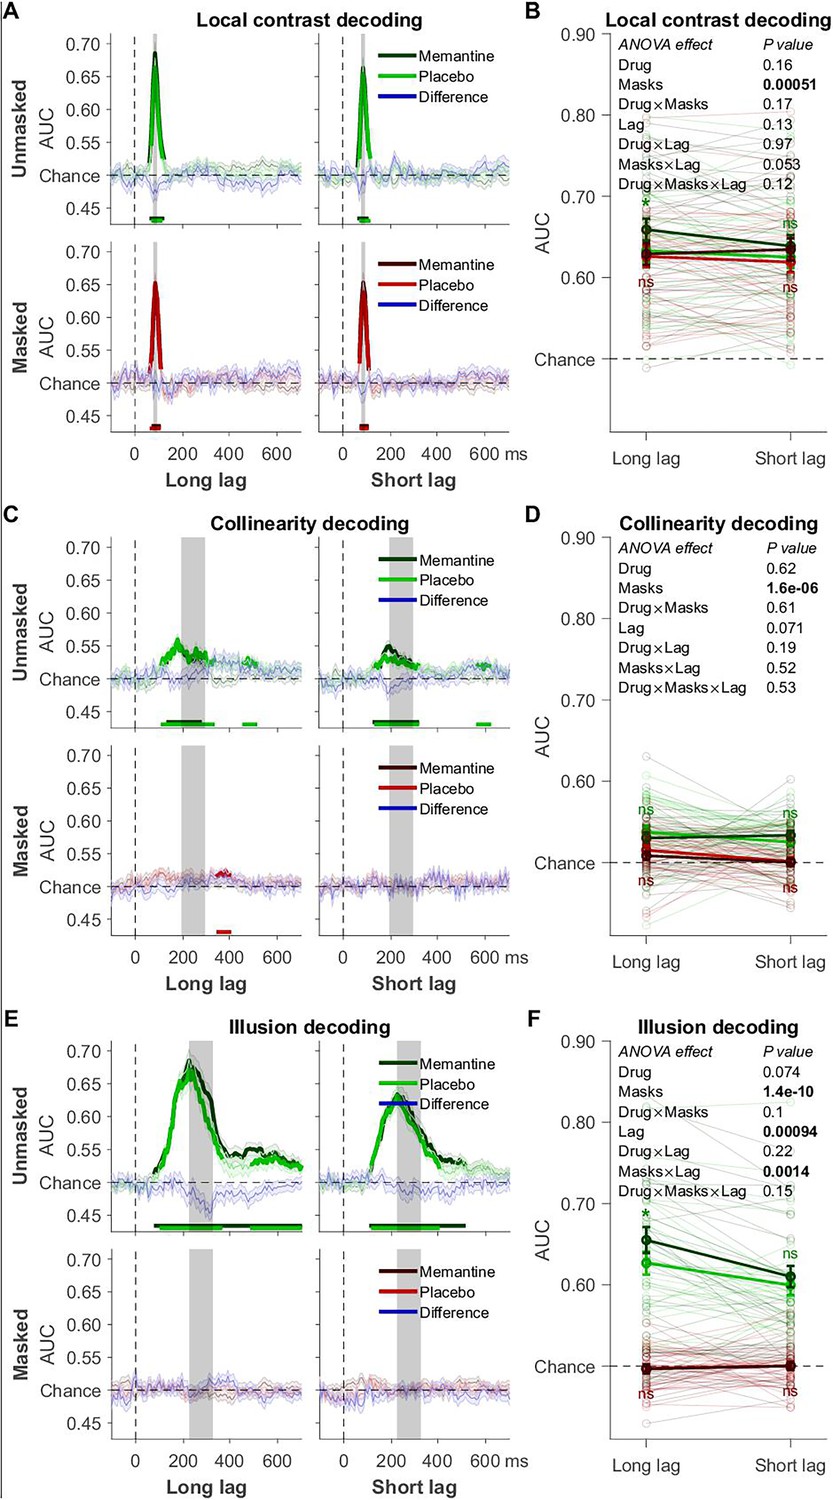
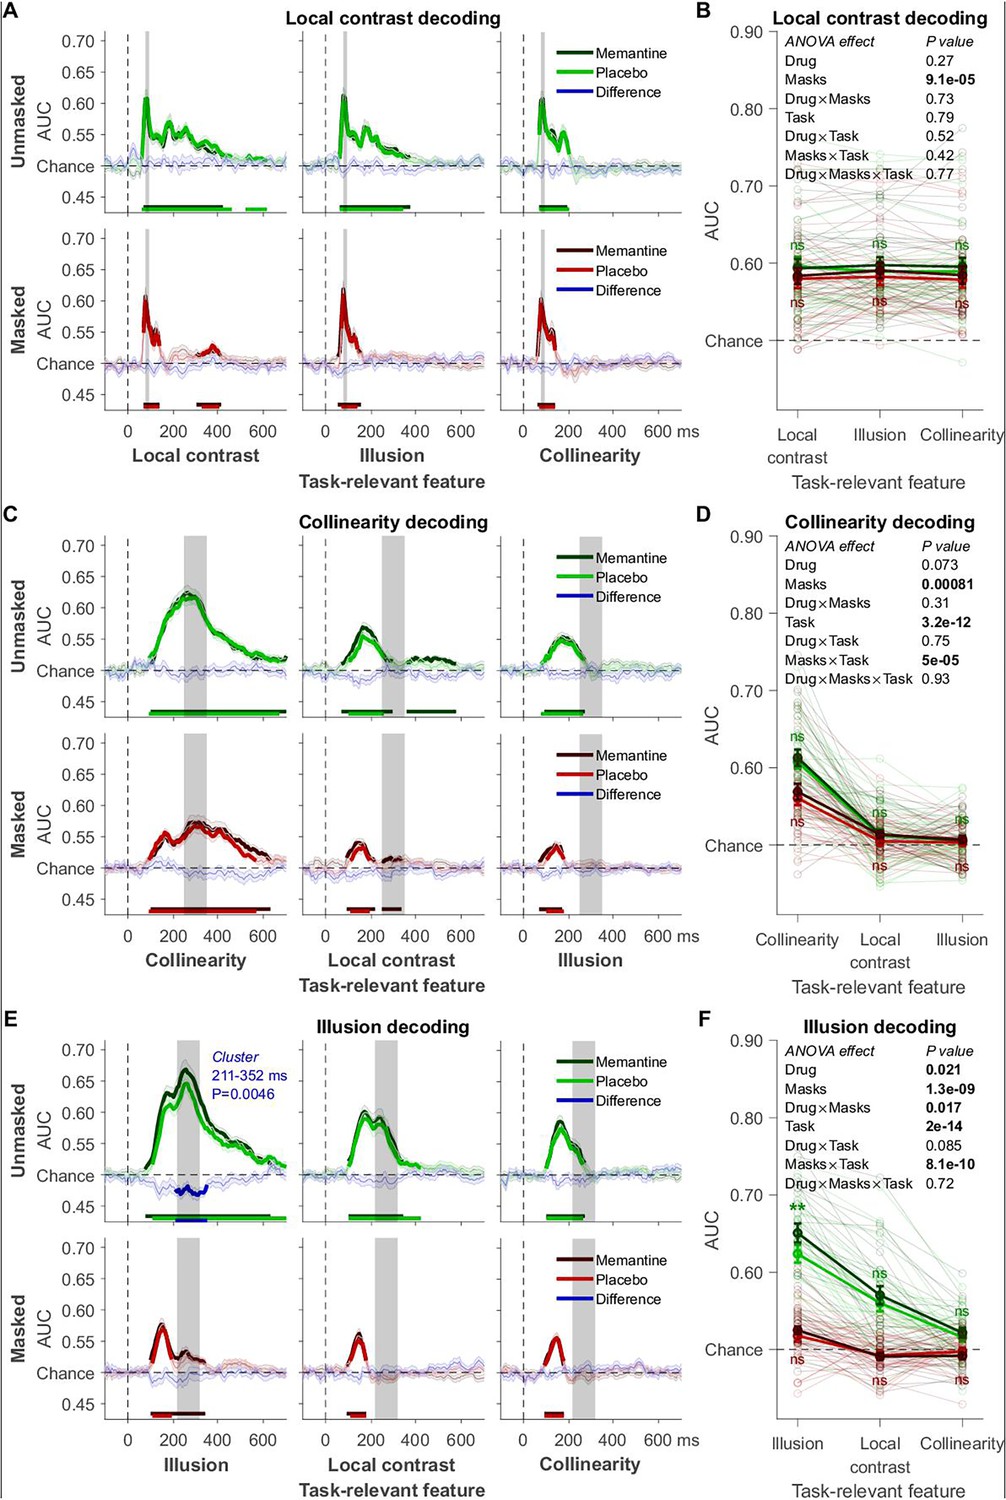
Decoding results of experiment 2.
(A) Local contrast decoding: mean decoding performance, area under the receiver operating characteristic curve (AUC), over time ± standard error of the mean (SEM; n = 27). Thick lines differ from chance: p < 0.05, cluster-based permutation test. (B) Mean AUC for local contrast decoding’s time window: 78–94 ms. Error bars are mean ± SEM. Individual data points are plotted using low contrast. Ns is not significant (p > 0.05). (C) Collinearity decoding: mean AUC over time. (D) Mean AUC for collinearity decoding’s time window: 217–317 ms. (E) Kanizsa illusion decoding: mean AUC over time. (F) Mean AUC for Kanizsa illusion’s time window: 223–323 ms. **p = 0.002.
Figure 5—figure supplement 1
Diagonal decoding results of experiment 2.
(A) Local contrast decoding: mean decoding performance, area under the receiver operating characteristic curve (AUC), over time ± standard error of the mean (SEM; n = 27). Thick lines differ from chance: p < 0.05, cluster-based permutation test. (B) Mean AUC for local contrast decoding’s time window: 78–94 ms. Error bars are mean ± SEM. Individual data points are plotted using low contrast. Ns is not significant (p > 0.05). (C) Collinearity decoding: mean AUC over time. (D) Mean AUC for collinearity decoding’s time window: 217–317 ms. (E) Kanizsa illusion decoding: mean AUC over time. (F) Mean AUC for Kanizsa illusion’s time window: 223–323 ms. **p = 0.001.
Additional files
Download links
A two-part list of links to download the article, or parts of the article, in various formats.
Downloads (link to download the article as PDF)
Open citations (links to open the citations from this article in various online reference manager services)
Cite this article (links to download the citations from this article in formats compatible with various reference manager tools)
A causal role of the NMDA receptor in recurrent processing during perceptual integration
eLife 13:RP100530.
https://doi.org/10.7554/eLife.100530.3


