The extra-islet pancreas supports autoimmunity in human type 1 diabetes
- Division of Infectious Diseases and Geographic Medicine, Department of Medicine, Stanford University School of Medicine, United States
- Department of Pathology, Stanford University School of Medicine, United States
- Department of Pathology and Neuropathology, University Hospital and Comprehensive Cancer Center, Germany
- Diabetes Center, University of California, San Francisco, United States
- Huntsman Cancer Institute, University of Utah Health Sciences Center, United States
- Department of Pathology, University of Utah School of Medicine, United States
- Sean N. Parker Autoimmune Research Laboratory and Diabetes Center, University of California, San Francisco, United States
- Institute of Physiological Chemistry and Pathobiochemistry and Cells-in-Motion Interfaculty Center, University of Muenster, Germany
- Sonoma Biotherapeutics, United States
Figures
Figure 1 with 3 supplements
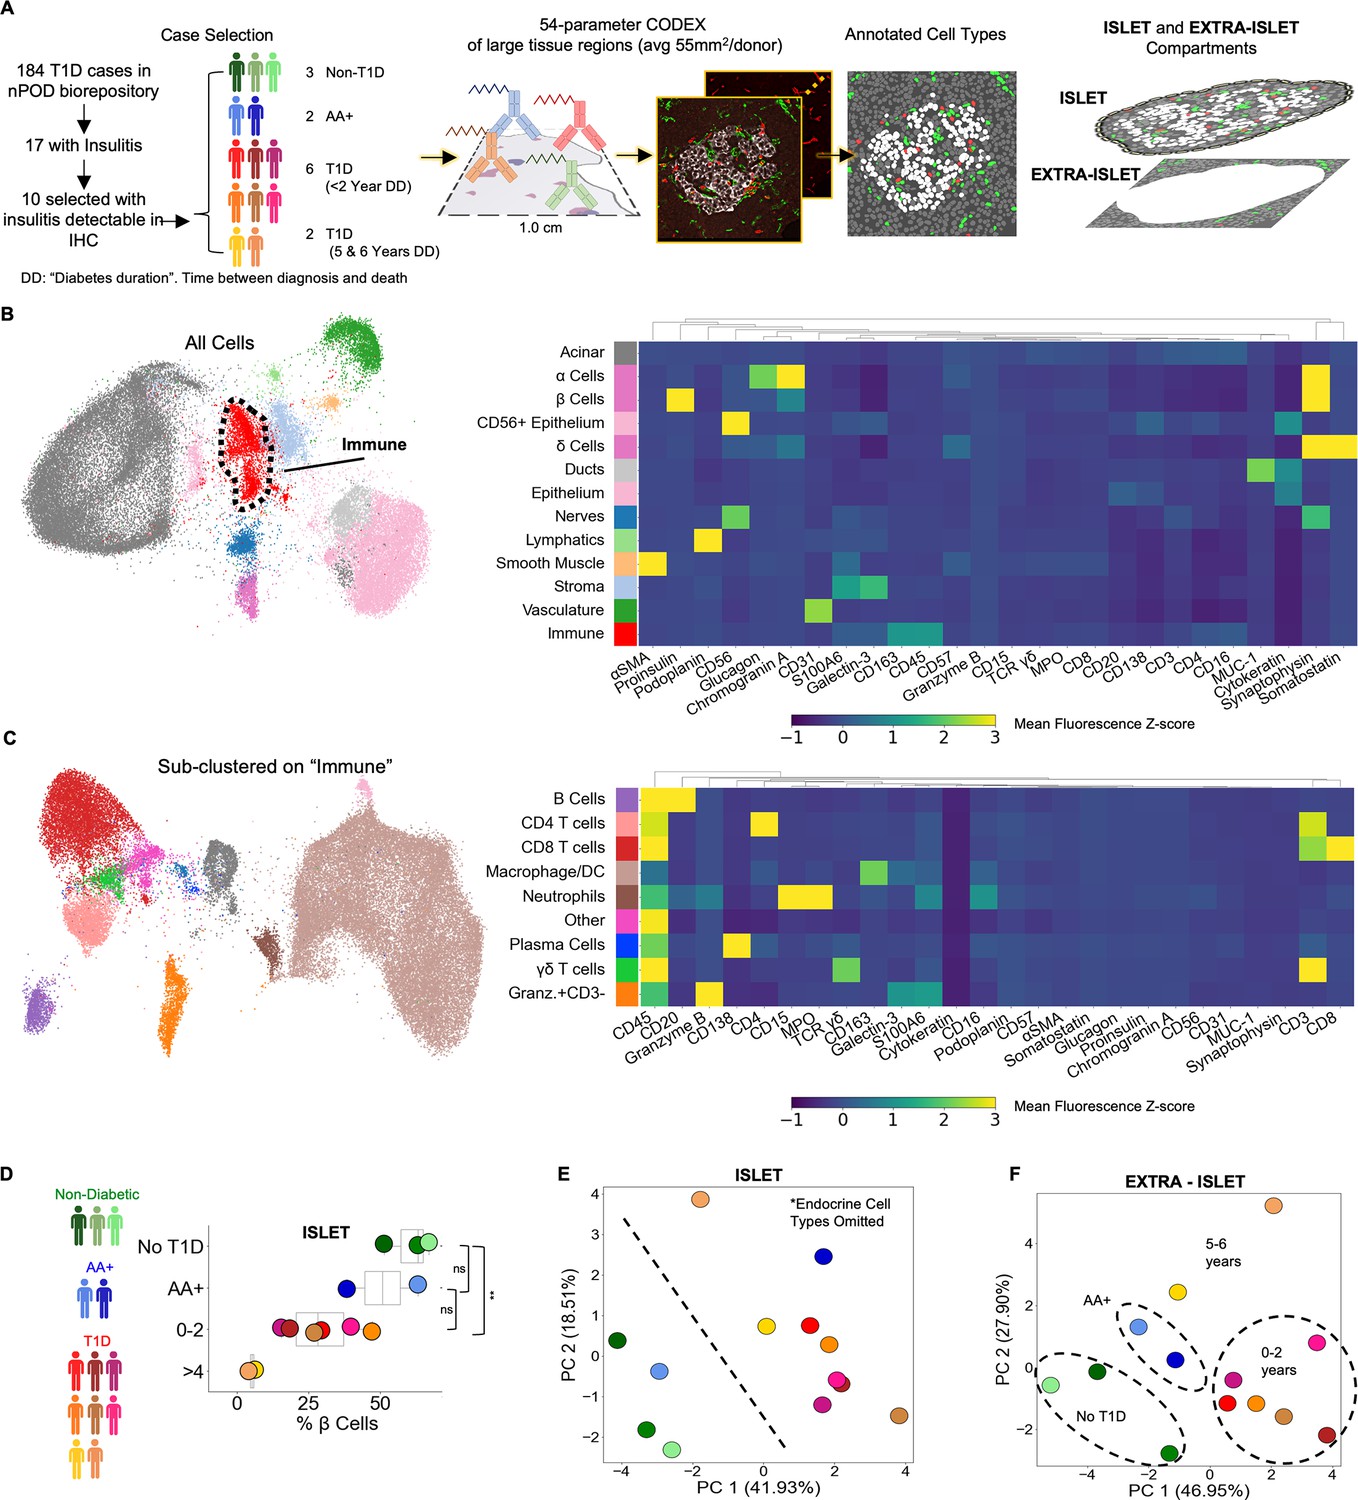
Profiling T1D pancreata with CODEX high-parameter imaging reveals alterations in the cellular composition of islet and extra-islet compartments.
Left: Schematic of the workflow for selection of nPOD cases. Blues, greens, and reds indicate non-T1D, AA+, or T1D status, respectively. Center: Schematic for acquisition and processing of CODEX highly multiplexed imaging dataset. Right: Schematic of islet and extra-islet pancreatic regions. (B) UMAP and Leiden clustering of major cell types. Colors match those in the heatmap shown to the right. Heatmap of mean z-normalized marker expression in each cell type cluster. Only a subset of the markers used for the UMAP are included in the heatmap to facilitate visualization. A full description of the markers used for the clustering stages is available in Table 2. (C) UMAP of the immune population identified in (B) further clustered using additional immune markers as described in Table 2. Colors match those in heatmap shown in the heatmap to the right. The heatmap is generated in an identical manner as the heatmap in (B). (D) Frequency of β-Cells per donor determined by dividing the number of β-cells by the total number of β-cells, α-cells, and δ-Cells. Blues, greens, and reds indicate non-T1D, AA+, or T1D status, respectively. Significance was determined using the t-test (* p<0.05, ** p<0.01, *** p<0.001). (D) Principal component analysis of the islet compartment. The number of cells of each cell type (omitting α-, β-, and δ-cells) were divided by the number of endocrine cells to adjust for different islet areas. Blues, greens, and reds indicate non-T1D, AA+, or T1D status, respectively. (E) Principal component analysis of the extra-islet compartment. The number of cells of each cell type (omitting α-, β-, and δ-cells) were divided by the number of acinar cells to adjust for different areas imaged. Blues, greens, and reds indicate non-T1D, AA+, or T1D status, respectively.
Figure 1—figure supplement 1
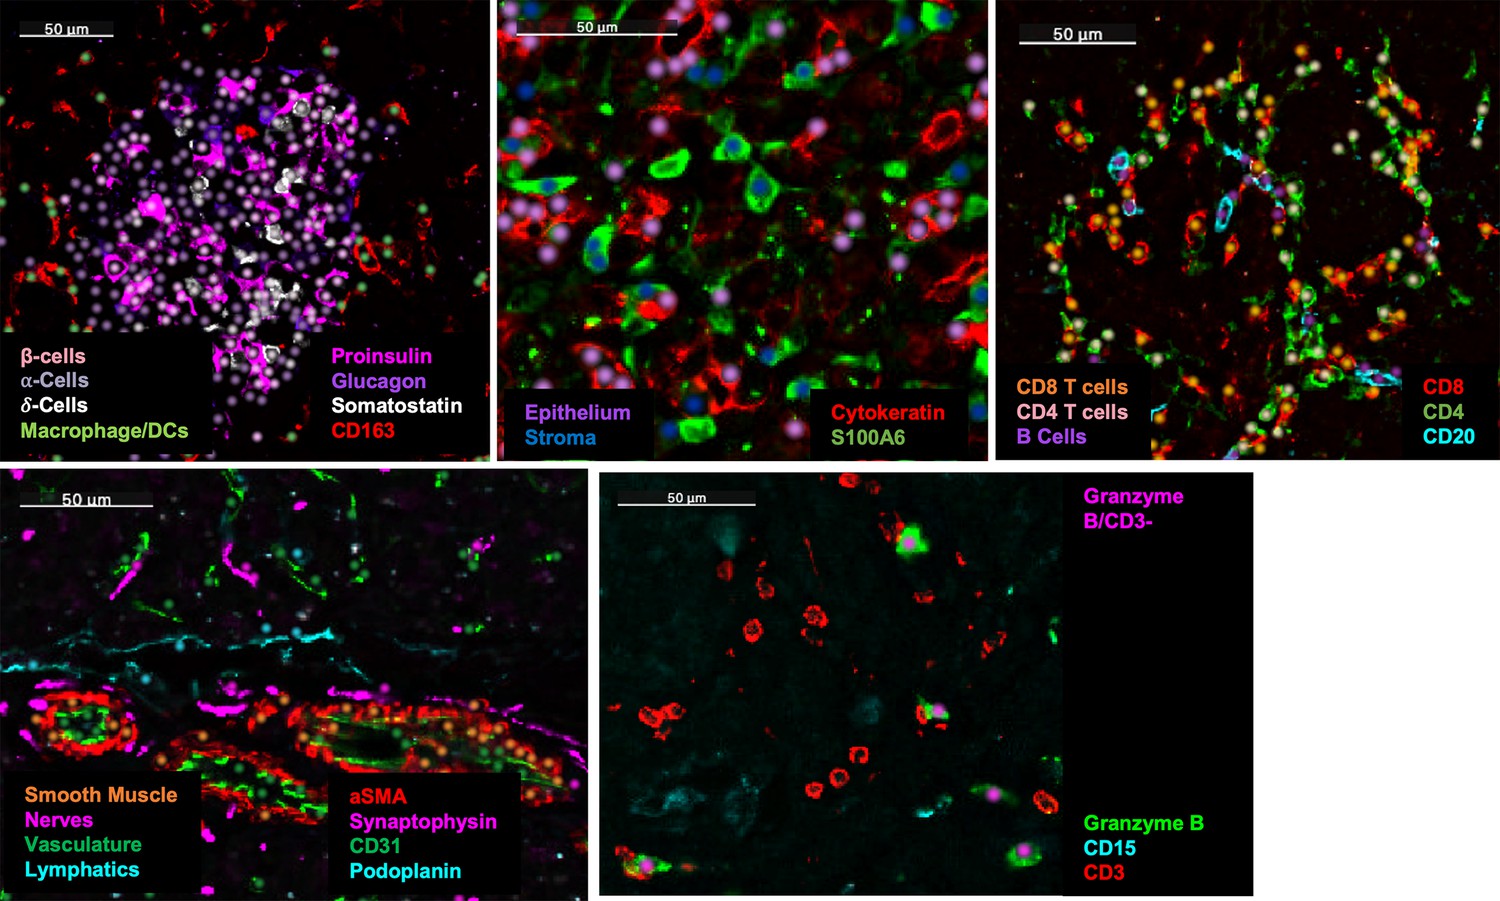
Validation of cell annotations.
Dots were overlaid on images of characteristic markers colored by cell type. In each panel, the cell types and their corresponding colors are indicated and the markers and their corresponding colors are specified.
Figure 1—figure supplement 2

The total number of endocrine cells measured in each donor.
Figure 1—figure supplement 3
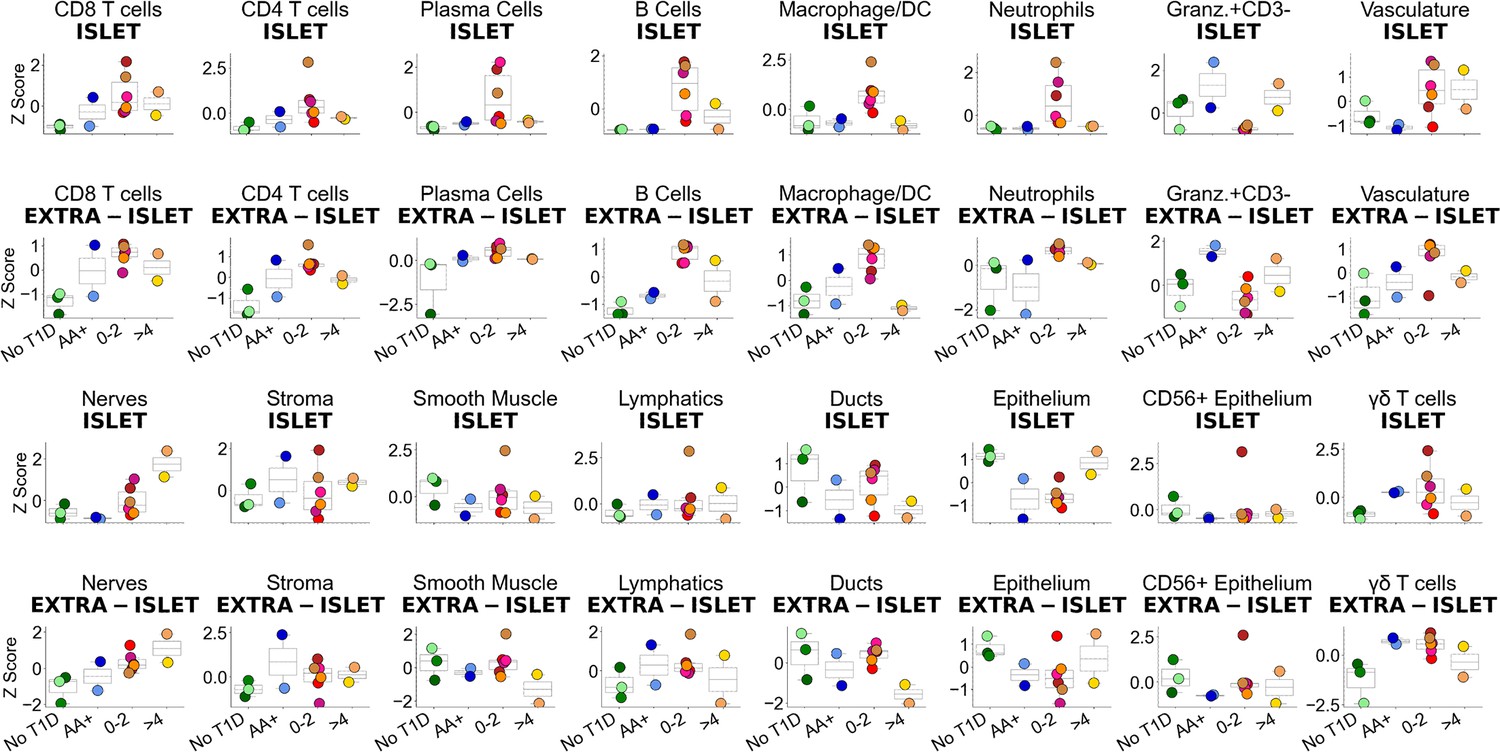
Changes in cellular abundance in Islet (top) and extra-islet (bottom) regions.
The y-axis corresponds to the number of the given cell type / number of endocrine cells in the top row and the number of a given cell type / number of acinar cells in the bottom row in each donor. These frequencies were then z-normalized across donors.
Figure 2 with 6 supplements
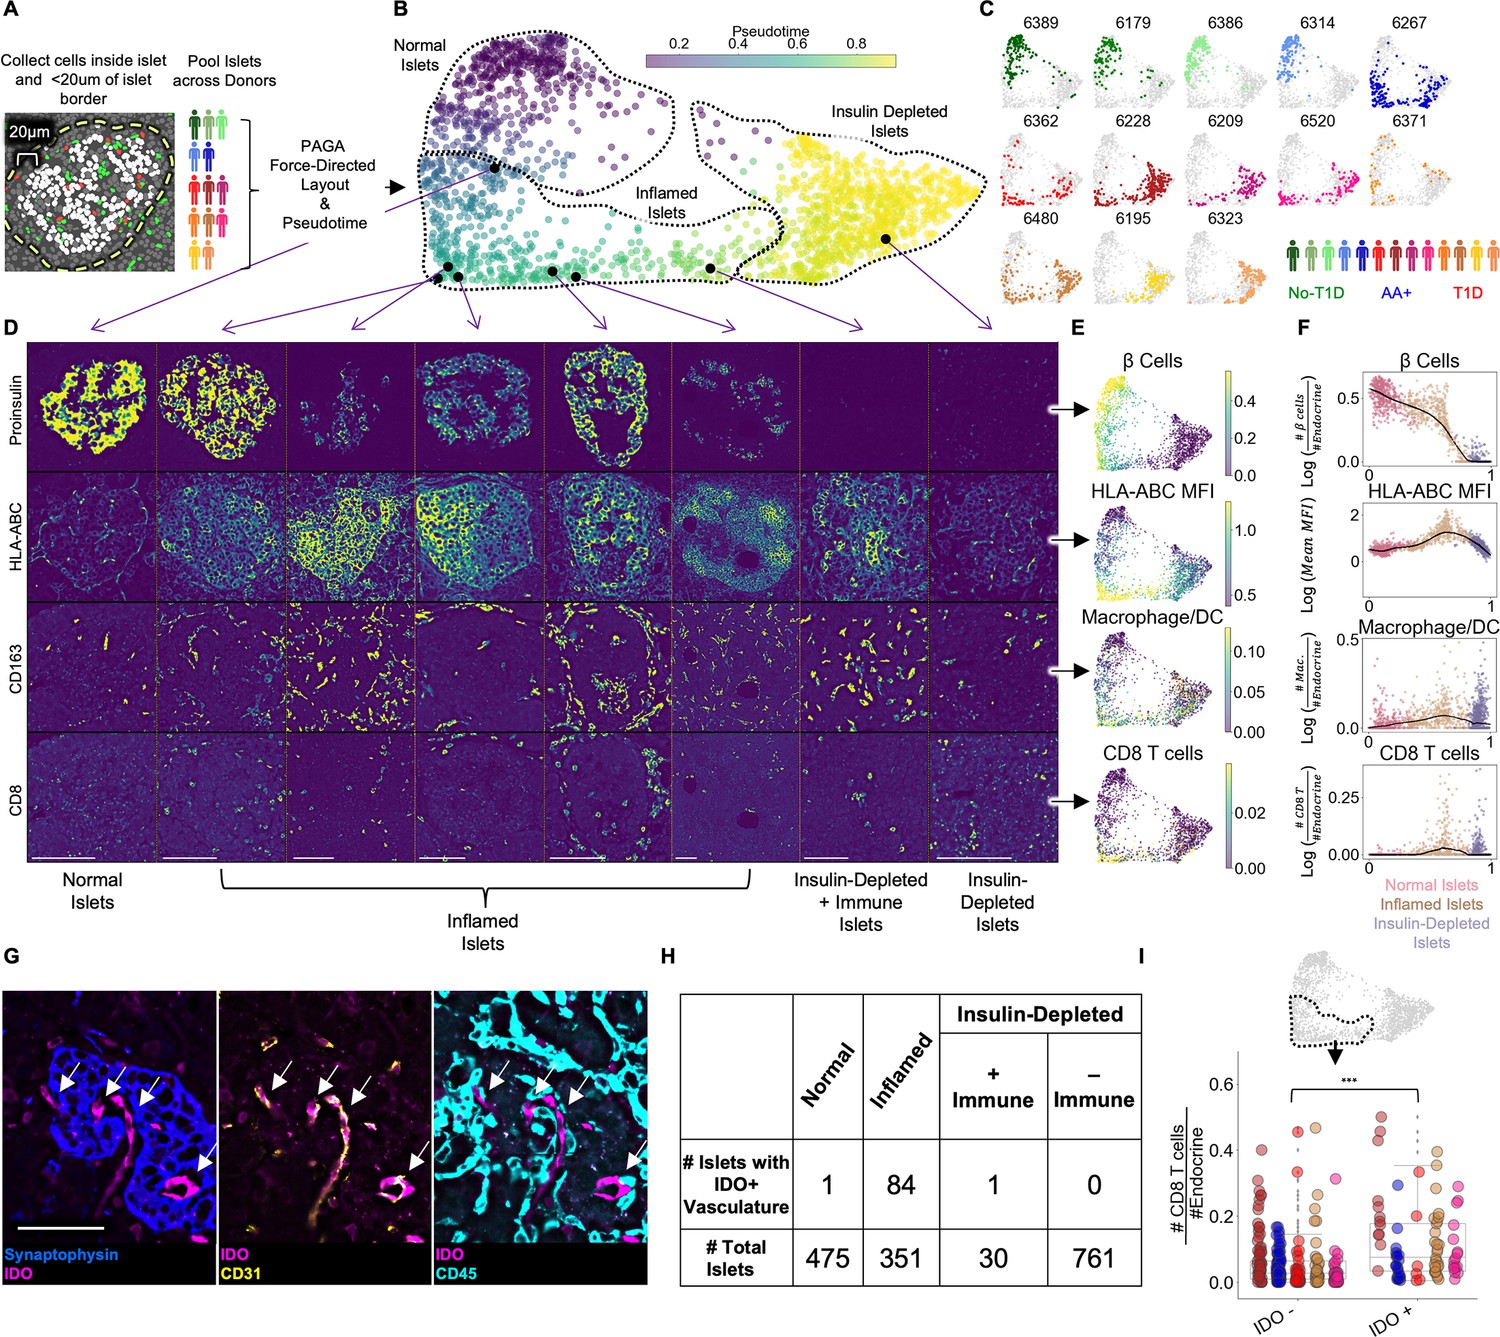
Pseudotemporal reconstruction of insulitis identifies IDO on islet vasculature.
(A) Schematic of islet segmentation and quantification of islet cellular composition. (B) PAGA-force directed layout of islets colored by pseudotime. Each point represents an islet. Each islet’s color reflects the pseudotemporal distance from the centroid of non-T1D islets. Representative islets from different stages of pseudotime are indicated with black points and their raw images are depicted in (D). Normal, Inflamed, and Insulin-Depleted groups were obtained by merging the clusters output by the PAGA algorithm (Figure 2—figure supplement 1). (C) Islet distribution across pseudotime for each donor. The titles indicate nPOD case IDs as in Table 1. The frequency of islets from each donor in each stage of islet pseudotime is reported in Figure 2—figure supplement 3. (D) Images of Proinsulin, HLA-ABC, CD163, and CD8 staining in islets representative of different points along pseudotime as indicated in B. Scale bars (lower left of each column) indicate 100 µm. (E) Quantification of selected features across pseudotime overlaid onto the PAGA force-directed layout. For β-cells, macrophage/DCs, and CD8+T cells, the values correspond to log(# cells/# endocrine cells). For HLA-ABC, the mean HLA-ABC expression for each cell in the islet was computed and log transformed. (F) Quantification of selected features across pseudotime. For β-cells, macrophage/DCs, and CD8+T cells, the values correspond to log(# cells/# endocrine cells). For HLA-ABC, the mean HLA-ABC expression for each cell in the islet was computed and log transformed. Color legend: Normal islets: pink; Inflamed islets: brown; Insulin-Depleted islets: purple. Black points demarcate LOWESS regression. (G) Representative image of an islet from the Inflamed group stained with IDO and, from left to right, Synaptophysin, CD31, and CD45. Arrows indicate IDO+/CD31+ vasculature. Right shows that IDO+ cells are negative for CD45 and therefore, are not immune cells associated with vasculature. Scale bar (bottom left image) indicates 50 µm. (H) Distribution of IDO expression on islet vasculature across pseudotime. (I) Association of IDO+ islet vasculature with islet CD8+T cell density. The y-axis corresponds to the number of CD8+T cells per endocrine cell per islet. CD8+T cell counts were normalized to adjust for islet size. The x-axis indicates whether islets contain IDO+ vasculature. Each color corresponds to a donor. All donors with detectable IDO+ islet vasculature are displayed: 6480, 6267, 6520, 6228, and 6362. Colors are same as in (H). IDO+ vasculature was manually quantified. For combined donors, significance was determined with a mixed-effect linear model, p = 1.5 x 10⁻¹² (Satterthwaites’s method lmerTest R package). The complete breakdown per donor is reported in Figure 2—figure supplement 6.
Figure 2—figure supplement 1
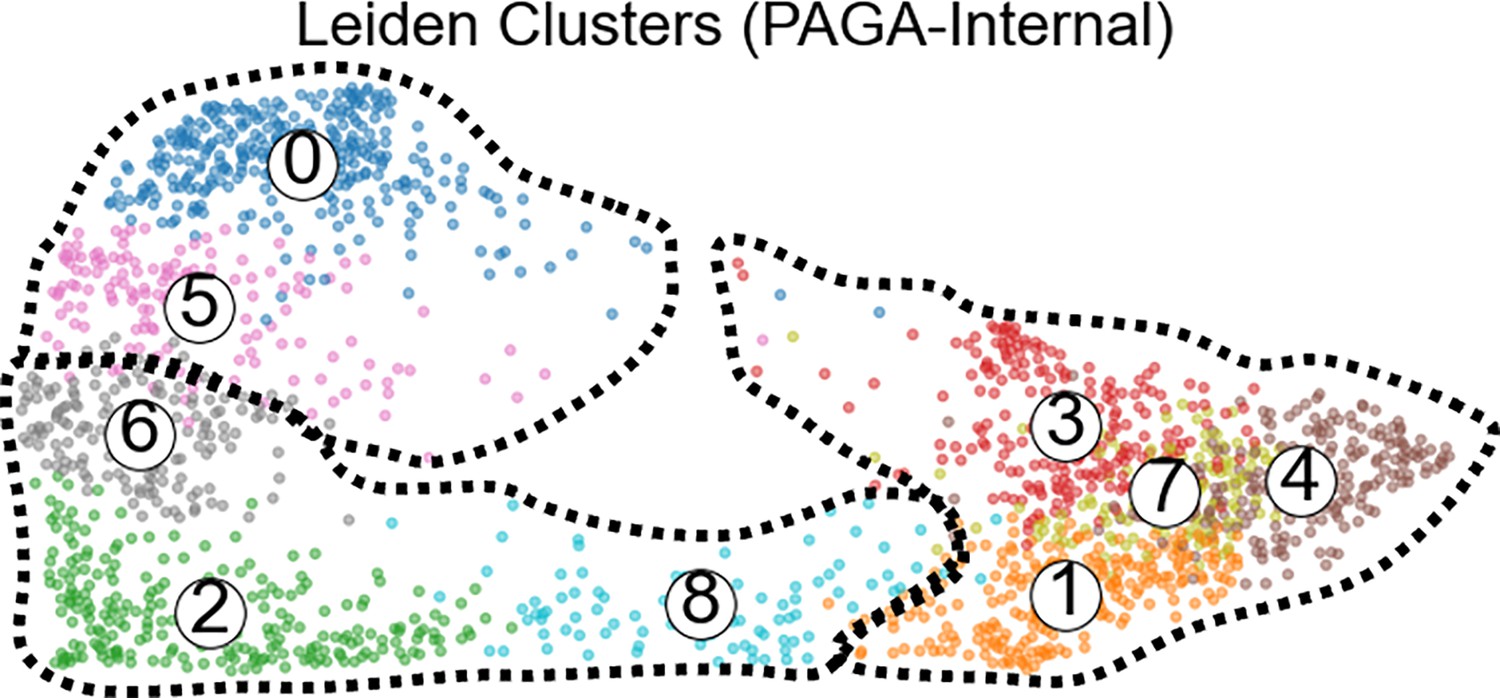
Leiden clustering computed by PAGA algorithm internally.
Clusters 0 and 5 were assigned to the ‘Healthy’ group. Clusters 6, 2, and 8 were assigned to the “Inflamed” group. Clusters 1,3,7, and 4 were assigned to the ‘Insulin-Depleted’ group.
Figure 2—figure supplement 2
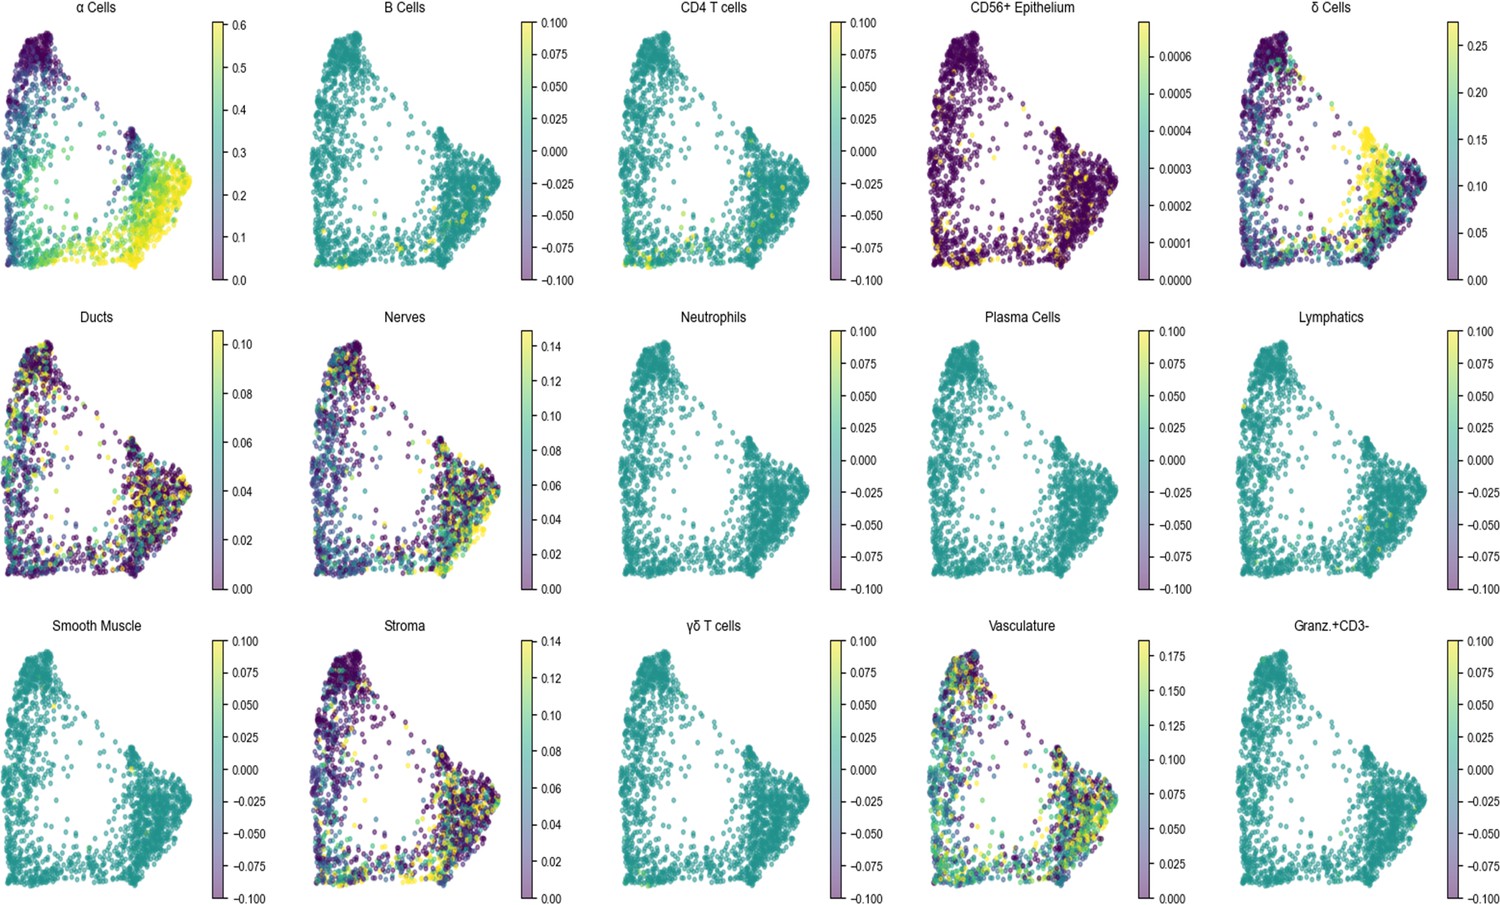
The density of each cell type per islet across pseudotime.
Same as (Figure 2E).
Figure 2—figure supplement 3
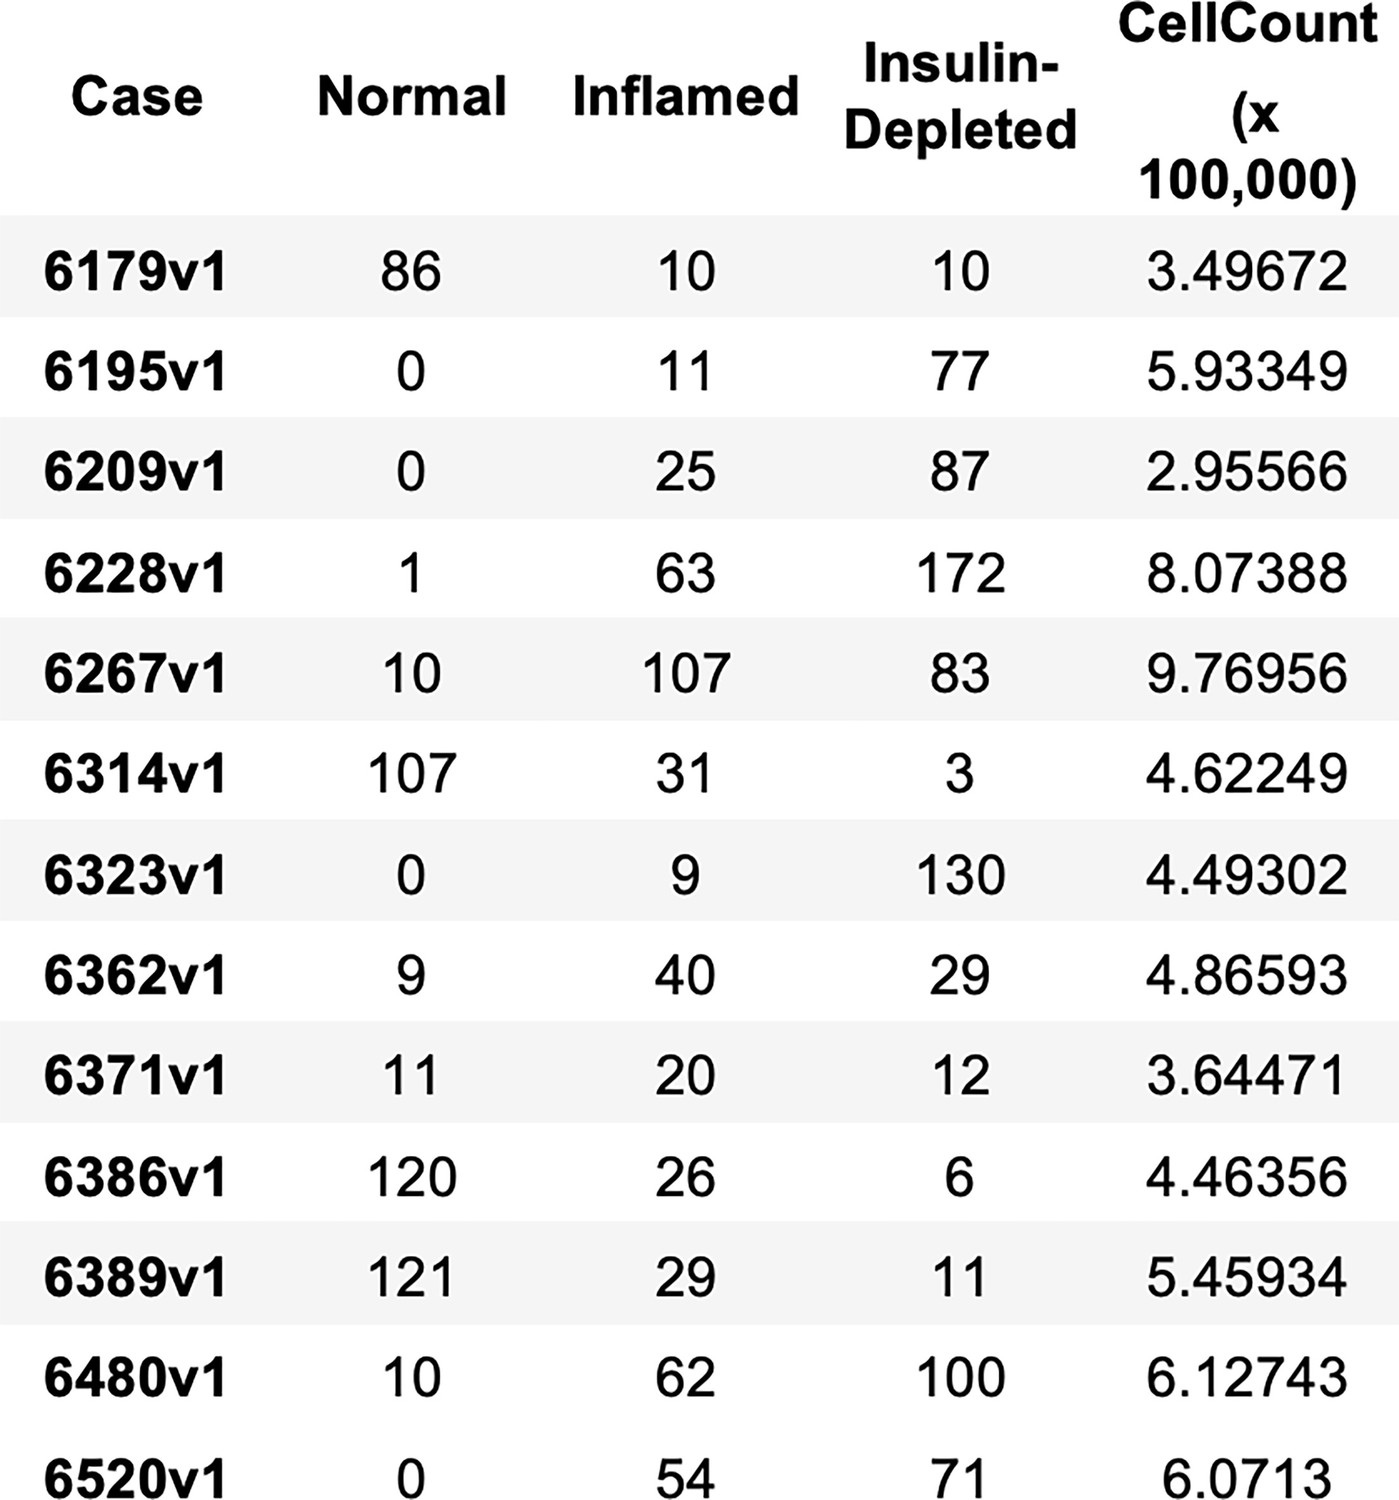
The number of islets of each stage of pseudotime and the total number of cells per case.
Figure 2—figure supplement 4
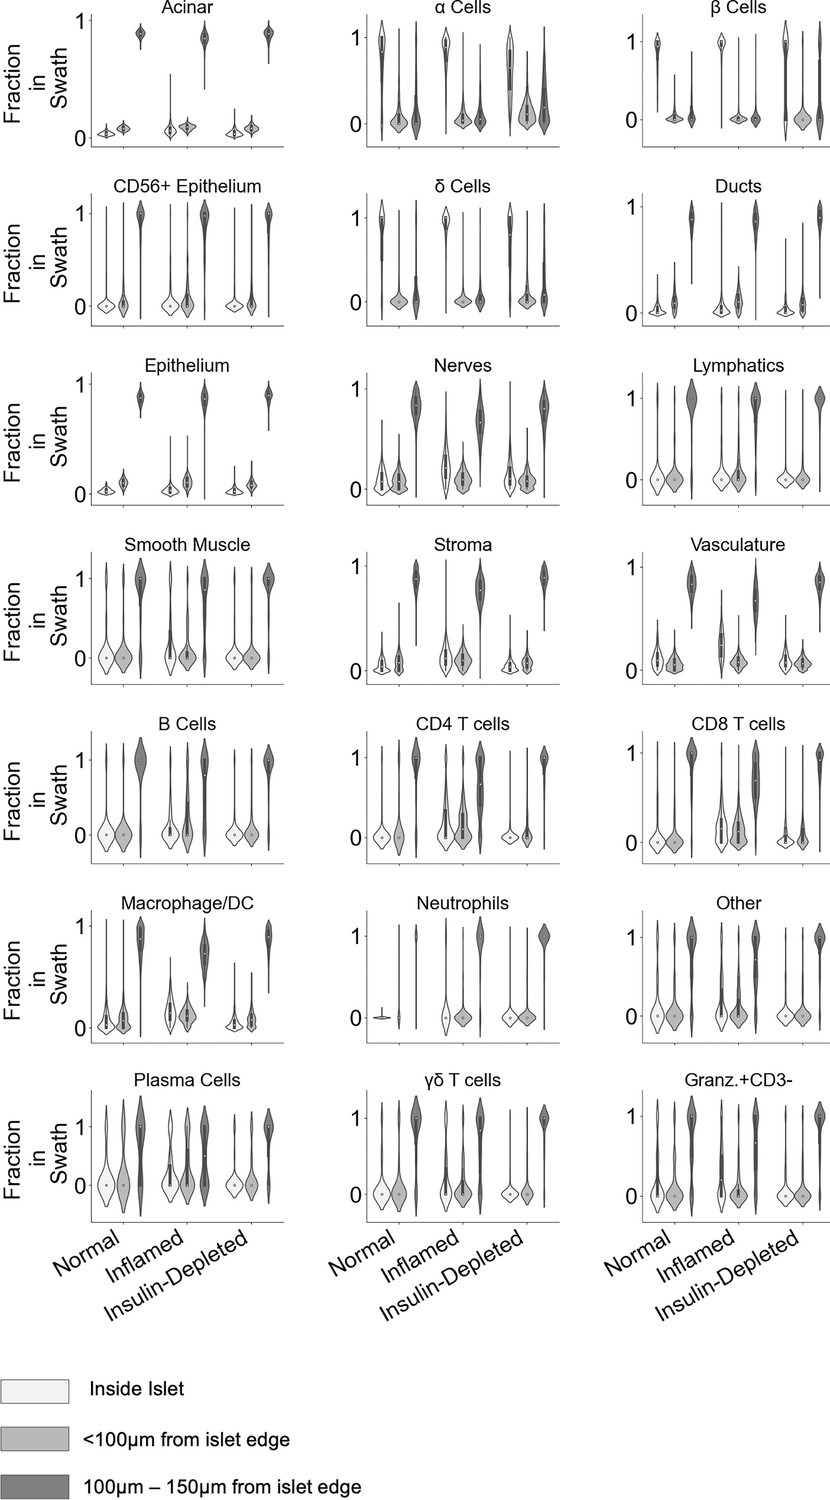
For each cell type, the frequency of that cell type inside islets, within 100 µm of the islet edge, and 100 µm–150 µm from the islet edge was quantified.
Figure 2—figure supplement 5
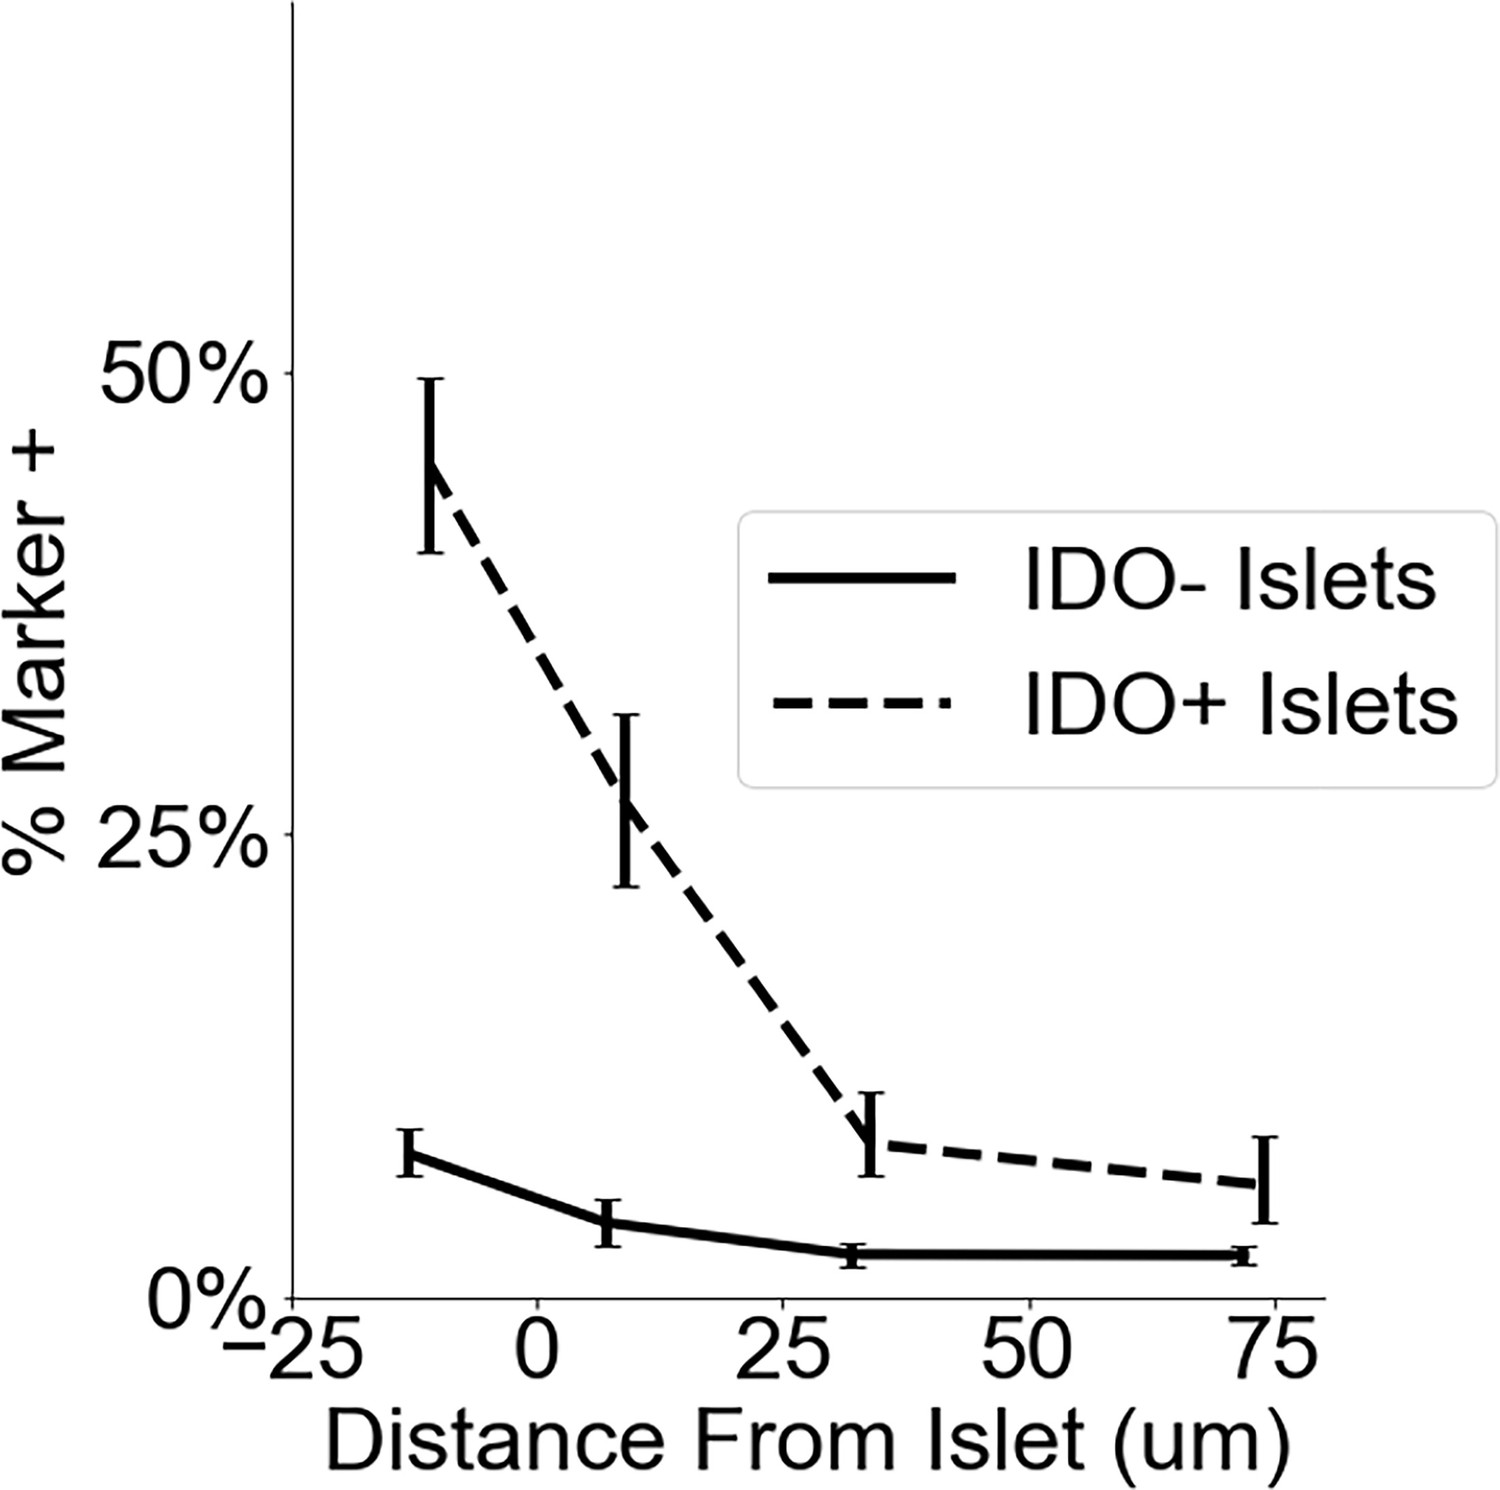
Frequency of IDO on vasculature at different distances from islets.
Dashed line indicates the frequency in and around islets where IDO+ was detected in islet vasculature (n=84) as in Figure 2H. Solid line indicates the frequency in and around Inflamed Islets in which IDO was absent in islet vasculature (n=267). Error bars indicate 95% confidence intervals obtained by iteratively calculating the marker frequency in re-sampled islets with replacement (n=200).
Figure 2—figure supplement 6
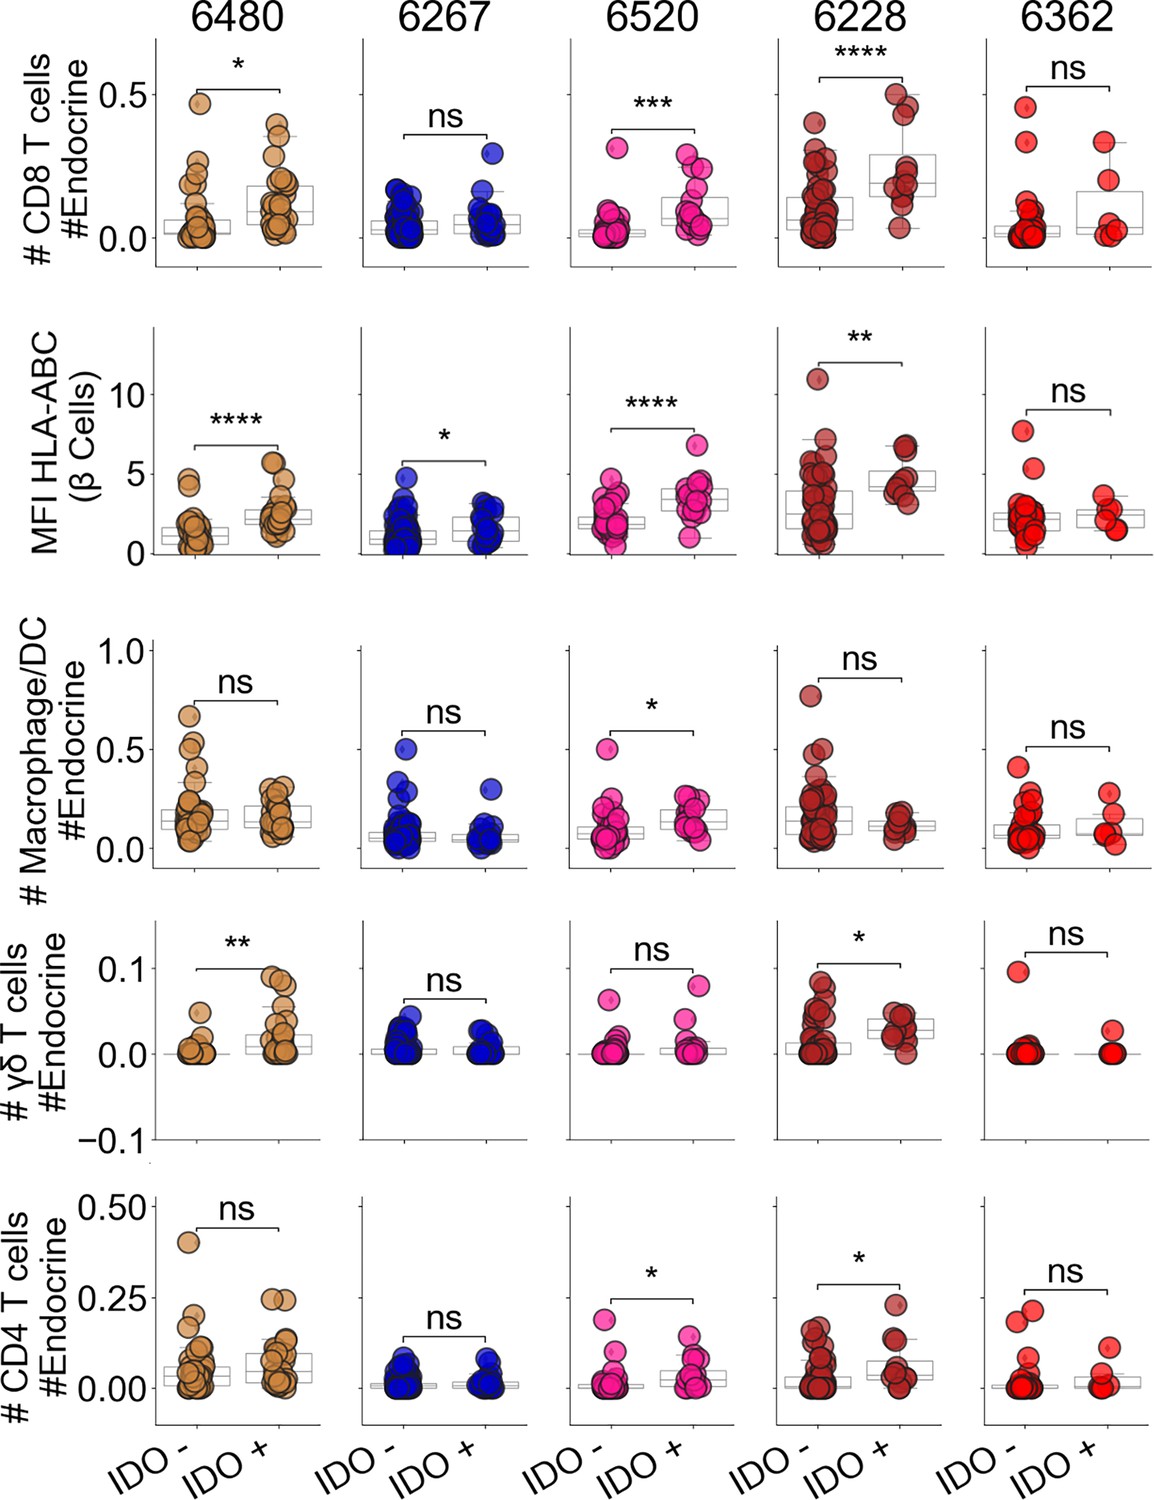
CD8+T cell, Macrophage, γ/δ T cell, and CD4+T cell abundance in IDO+ and IDO– islets.
The mean expression of HLA-ABC in β-cells in each islet. The other parameters measure the number of the given cell type relative to the total number of endocrine cells. Same as N. Asterisks in figure indicate significance within each donor (Satterthwaites’s method lmerTest R package).
Figure 3 with 4 supplements
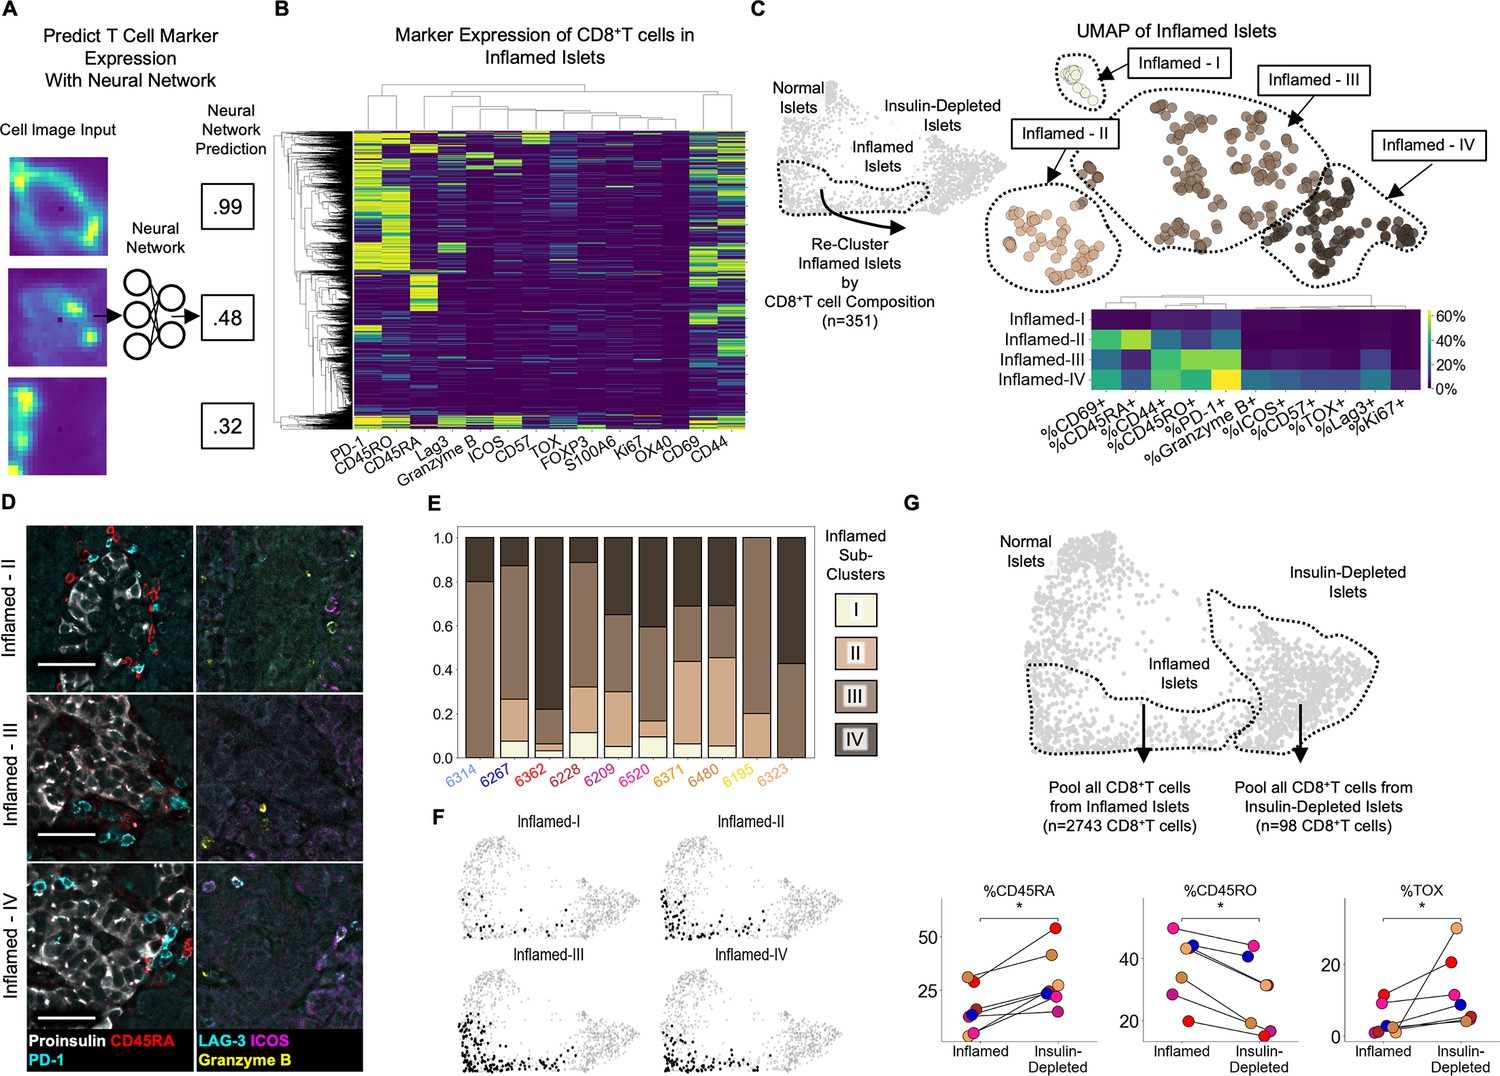
Insulitis has sub-states, characterized by CD8+T cell functionality (A) Schematic of marker-quantification with a ResNet50 neural network.
Cell images are input, and the neural network outputs a number between 0 and 1 indicative of the level of confidence that the cell expresses that marker with 1 indicating the highest confidence. (B) Heatmap of all 2855 Inflamed Islet CD8+T cells, hierarchically clustered according to marker expression predicted by the neural network. (C Top) UMAP of Inflamed Islets based on frequencies of markers on CD8+T cells in islets. (C Bottom) Mean frequencies of each marker on CD8+T cells in islets of each inflamed sub-cluster. (D) Representative images of islets from each subcluster with associated immune markers. Scale bars indicate 50 µm. (E) Frequencies of islets from each subcluster per donor in AA+ and T1D samples. Color indicates subcluster as in panel C. (F) Distribution of the islets of Inflamed-I through -IV on the PAGA force-directed layout shown in Figure 2B. (G) Differences in marker expression frequencies between CD8+T cells in islets from the Inflamed group and from the Insulin-Depleted + Immune group. T cells from all islets of the specified groups were pooled within each donor to compute the frequencies of marker expression. Significance was determined using the Wilcoxon signed-rank test (* p<0.05, ** p<0.01, *** p<0.001) and was not corrected for multiple hypothesis testing.
Figure 3—figure supplement 1
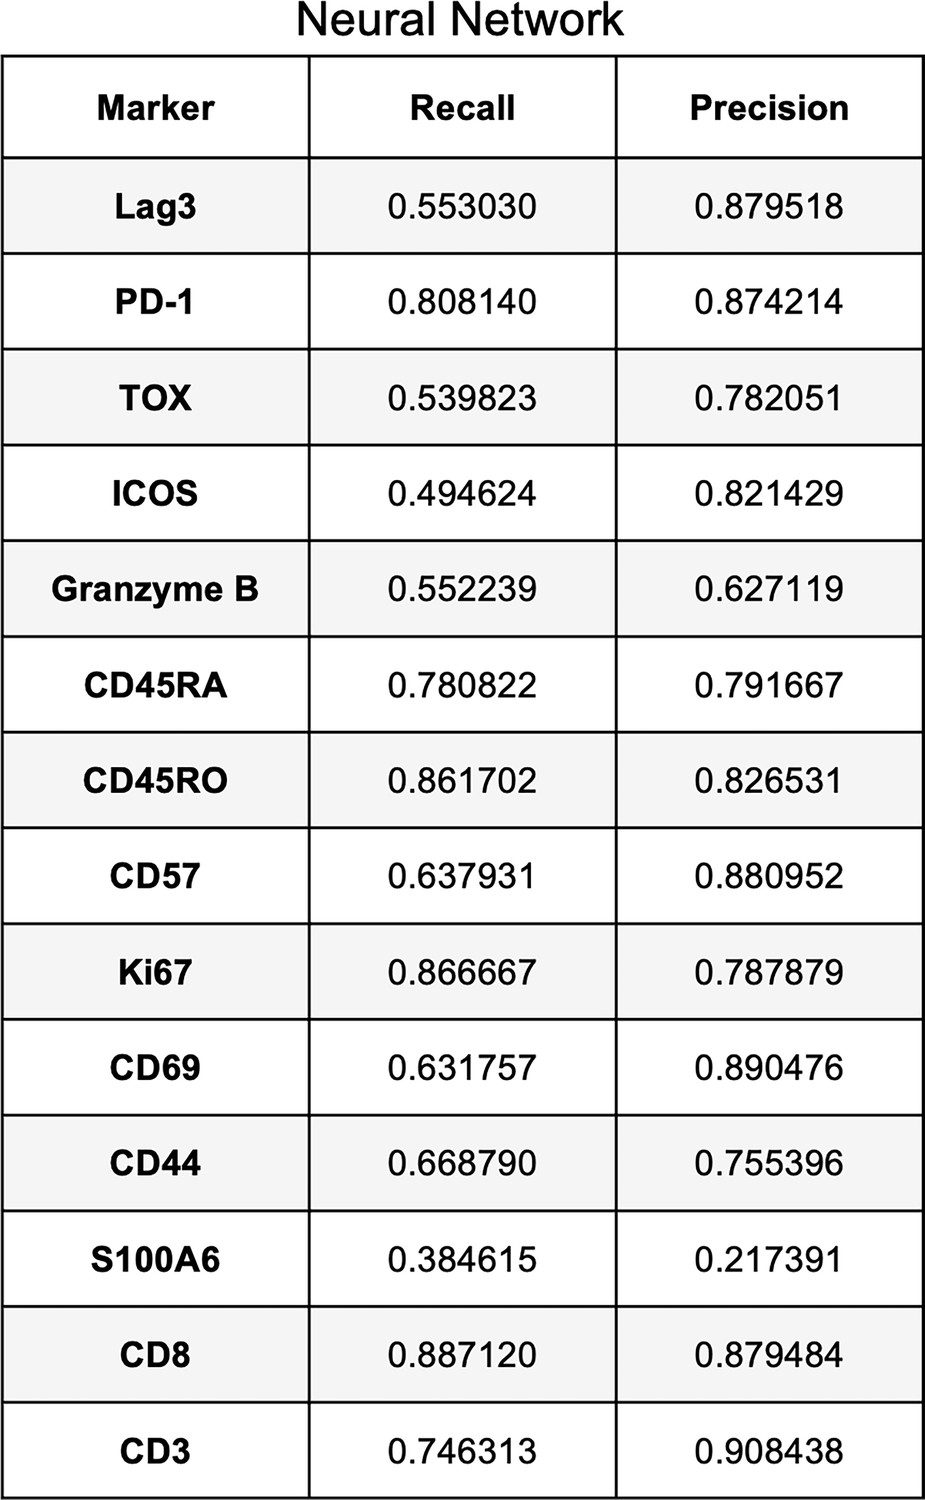
Validation of neural network for detecting expression of T cell markers.
Recall and Precision for the neural network using cells in the ‘Test’ dataset unseen by the neural network.
Figure 3—figure supplement 2
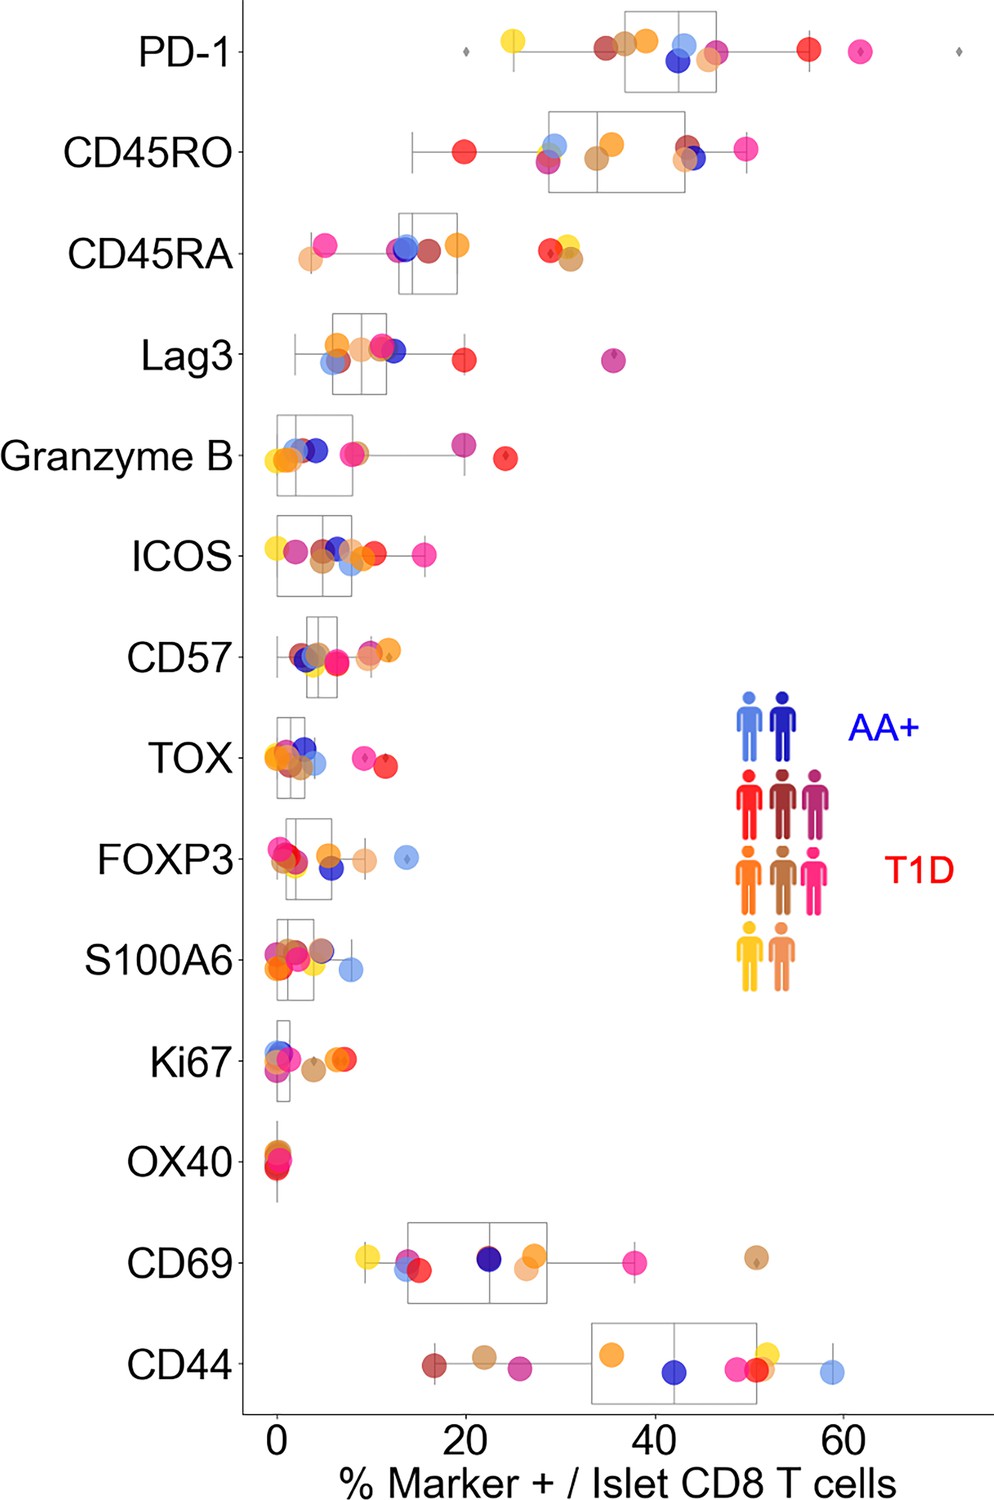
Frequency of functional markers on CD8+T cells inside islets.
Colors correspond to donor. Only AA+ and T1D donors are displayed.
Figure 3—figure supplement 3
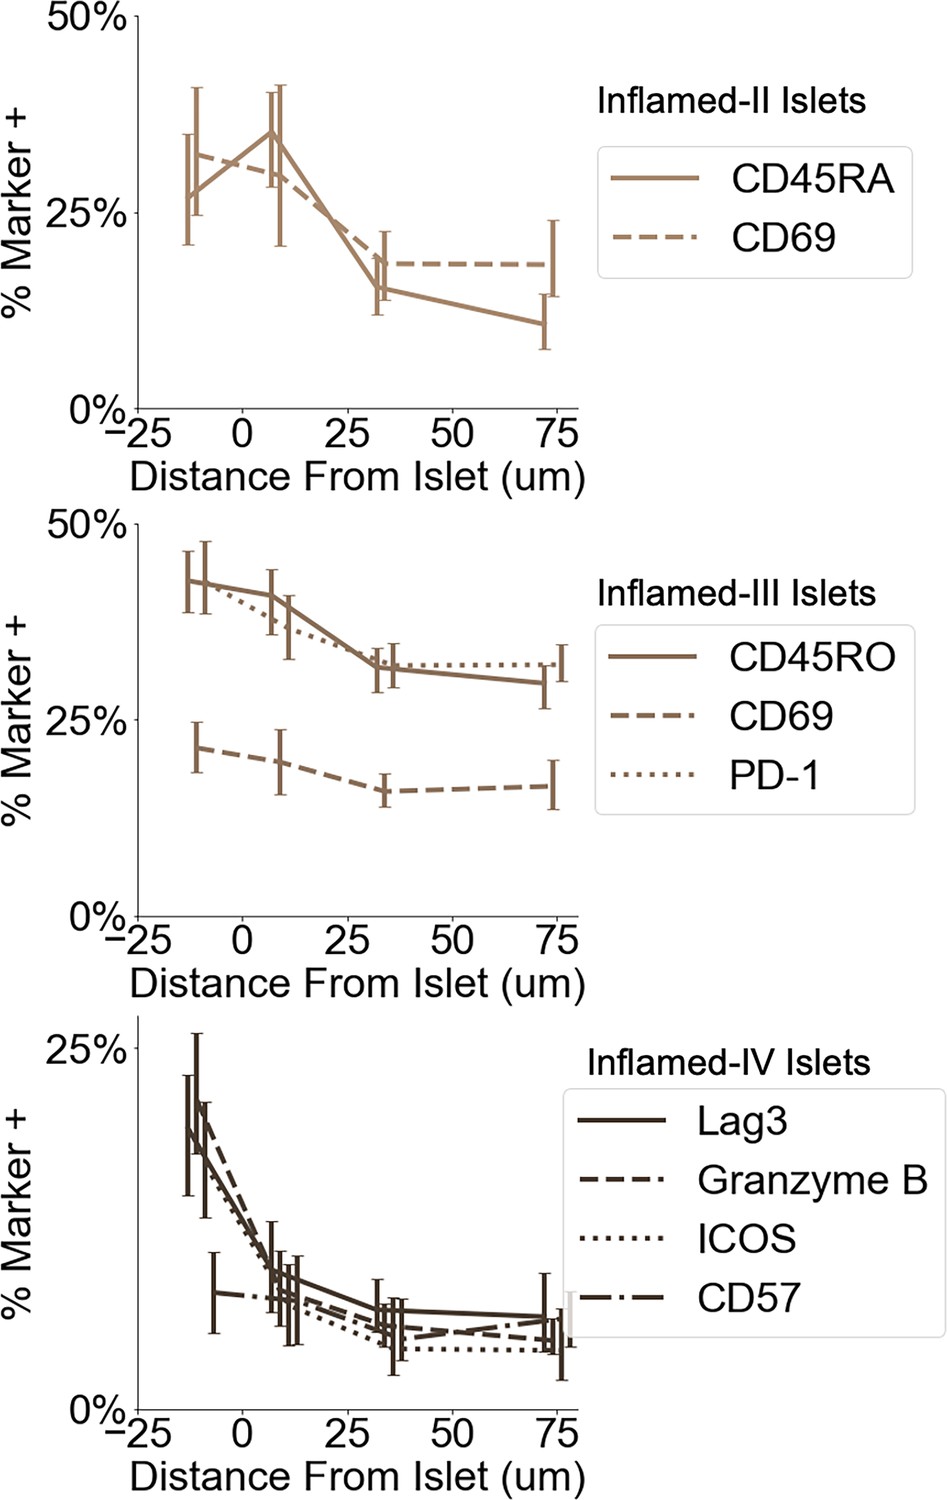
Frequency of functional markers on CD8+T cells at different distances from islets.
Error bars indicate 95% confidence intervals obtained by iteratively calculating the marker frequency in re-sampled islets with replacement (n=200).
Figure 3—figure supplement 4

Association of islet features with Inflamed-I through -IV.
For each feature (columns), a mixed-level model adjusting for donor was fit in a one-vs-all design and the p-value was determined using Satterthwaites’s method in lmerTest R package. Values in the heatmap were corrected for multiple hypotheses using the Benjamini, Hochberg method.
Figure 4 with 1 supplement
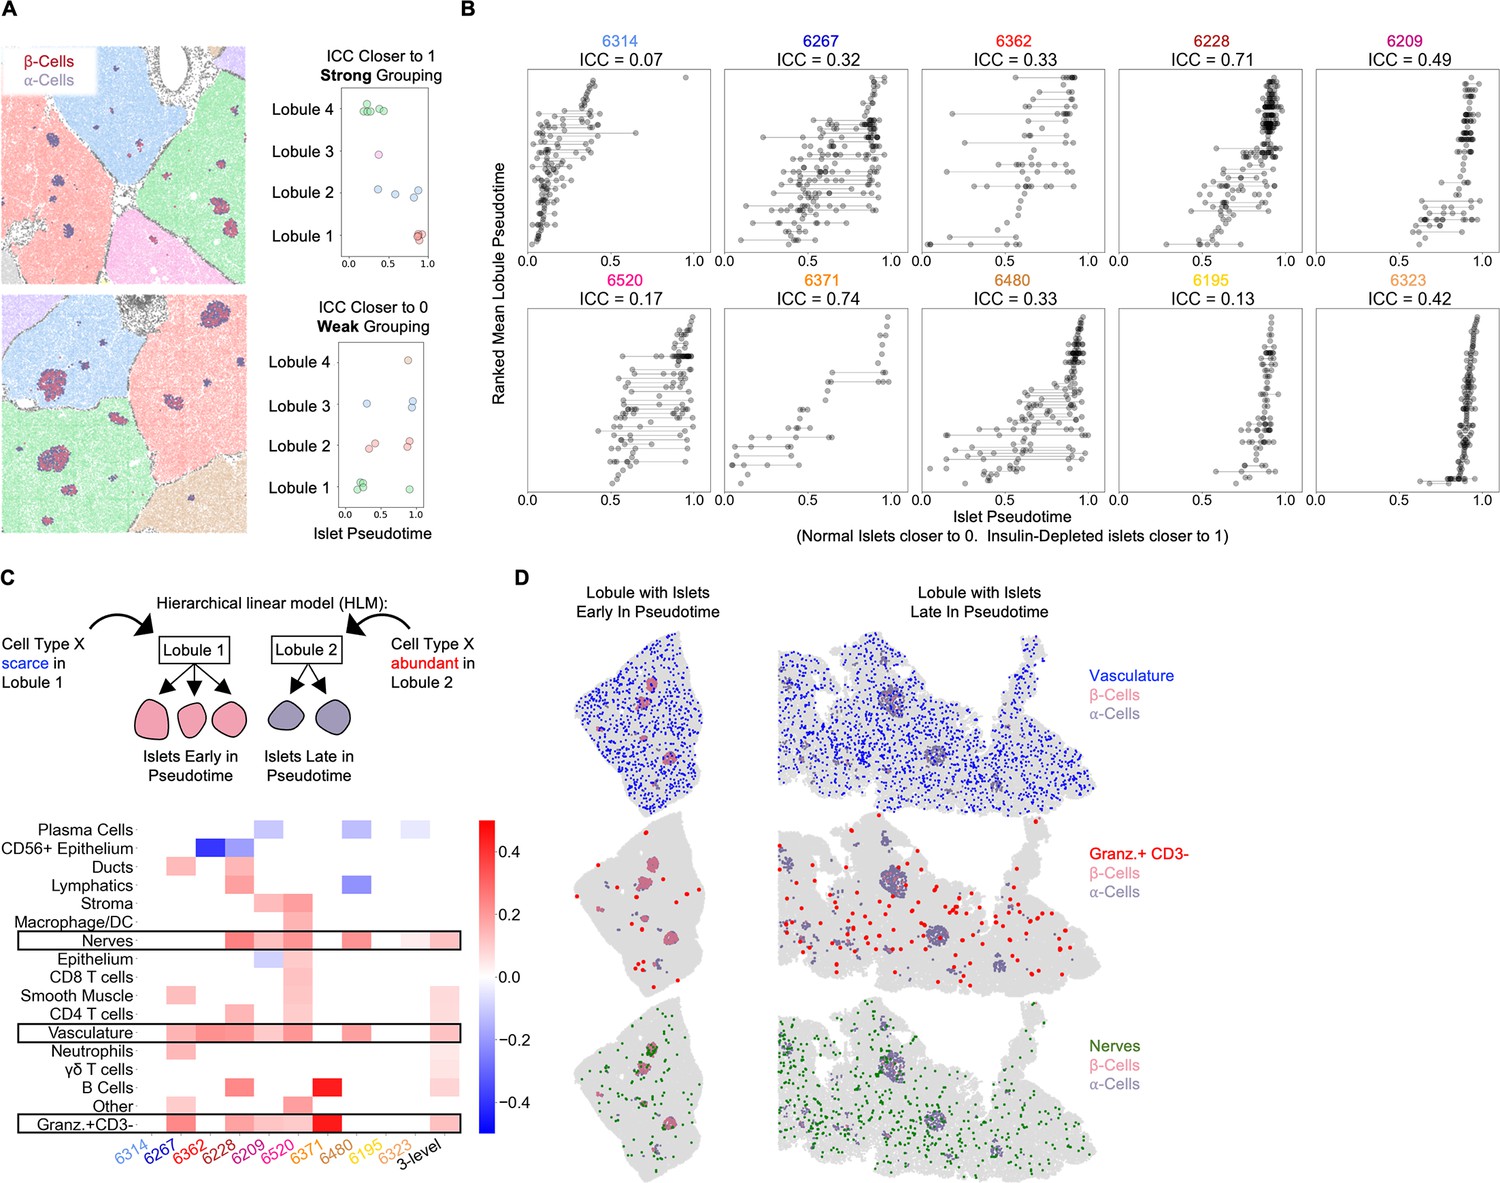
Vasculature, nerves, and Granzyme-B+/CD3- cells in the extra-islet pancreas are associated with the lobular patterning of islet pathogenesis (A) A schematic of the method for quantifying lobular patterning of insulitis.
Lobules were segmented and colored accordingly. The islets are colored according to their composition of β-cells and α-cells. Top: A region from case 6228 with a strong lobular grouping effect and an ICC closer to 1. Bottom: A region from case 6267 with a weak lobular grouping effect and an ICC closer to 0. (B) Lobular patterning of insulitis within each donor. Each point represents an islet. The x-axis represents the islet pseudotime. The y-axis is ordinal, representing the rank of each lobule according to the mean pseudotime of its islets. Violin plots per lobule are overlaid. ICC: Intraclass correlation coefficient. (C) Cell types associated with lobular patterning. Top: Schematic of the hierarchical linear model. Cells in islets were omitted when computing the lobular abundance of each cell type. Bottom: Coefficients of two-level models trained on each donor separately (columns labeled by donor) and a three-level model (right column). Color corresponds to the coefficient and features with p>0.05 are white. Significance was determined using Satterthwaites’s method in the lmerTest R package. No adjustment for multiple hypothesis testing was applied. (D) Visualization of vasculature (top), Granzyme-B/CD3- cells (middle), and nerves (bottom) in two lobules. The left lobule represents lobules with islets earlier in pseudotime and a lower abundance of the given cell type in the lobule. The right lobule represents lobules with islets late in pseudotime and a greater abundance of the given cell type in the lobule.
Figure 4—figure supplement 1
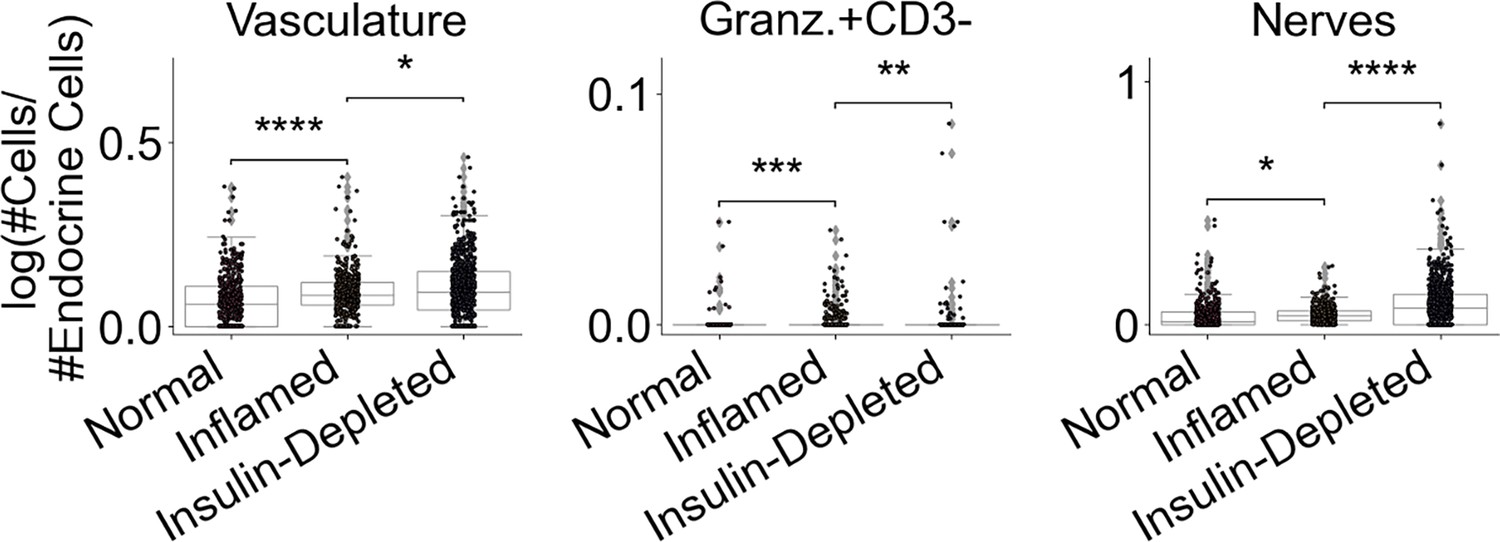
Changes in cell types identified by HLM in insulitis.
Each point represents and islet. Islets are grouped according to the pseudotime analysis from Figure 2. The y-axis corresponds to the log-transformed values for the number of the given cell type / number of endocrine cells. Significance was determined using the t-test (* p<0.05, ** p<0.01, *** p<0.001). No adjustment for multiple hypothesis testing was applied.
Figure 5 with 3 supplements
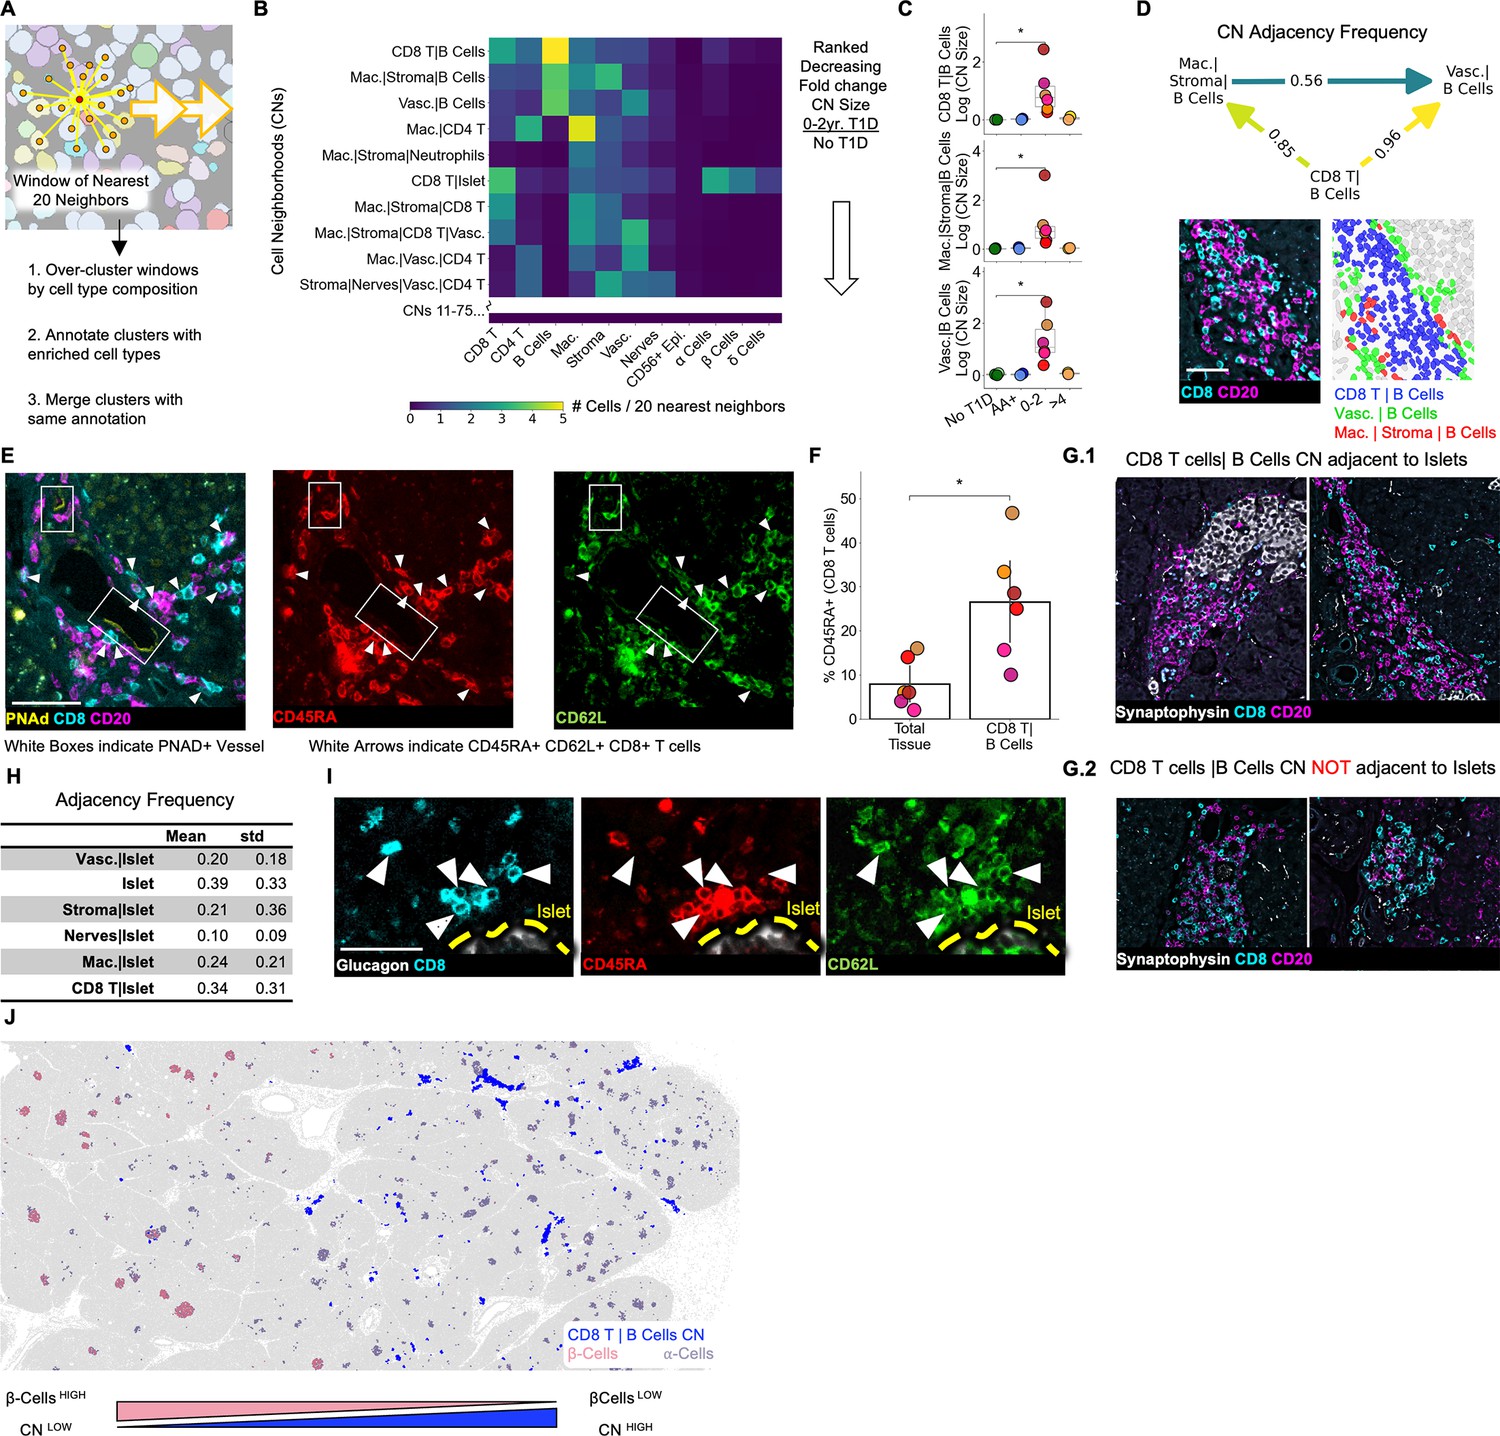
Immature tertiary lymphoid structures far from islets are potential staging areas for islet-destined CD8+T cells.
(A) Schematic of algorithm for identifying CNs. Red point indicates index cell for the CN. Orange points indicate the nearest neighbors of the index cell. Windows are collected for each cell in the dataset (indicated by orange arrows). (B) Cell-type compositions of the top CNs organized in decreasing order of the fold increase in abundance in T1D vs. non-T1D samples. Each column in the heatmap indicates the mean density of that cell type in the 20 nearest spatial neighbors of cells assigned to the CN designated for that row. CN abundance was calculated as the number of cells assigned to the given CN divided by the number of acinar cells. Abbreviations: Vasc.: vasculature; Mac.: macrophage/DCs; Lym.: lymphatics. Neu.: neutrophils; CD8 T: CD8+T cells; CD4 T: CD4+T cells. Endocrine cell types were merged during CN annotation and are labeled “Islet”. (C) Mean abundances of the CD8+T cell and B cell CNs per donor. Abundance was calculated as the number of cells assigned to the given CN divided by the number of acinar cells. Significance was determined using the Mann-Whitney U test (* p<0.05,** p<0.01, *** p<0.001). No adjustment for multiple hypothesis testing was applied. (D) Top: Adjacency frequencies of (CD8+T cells| B cell CN) with (Macrophage|Stroma|B cells) and (Vasculature| B cells) CNs. The adjacency frequency was calculated as the number of instances of the source CN adjacent to the destination CN divided by the total number of instances of the source CN. Bottom Left: Raw image of a representative assembly of the three CNs (CD8+T cells| B cell CN), (Macrophage|Stroma|B cells), and (Vasculature| B cells) displaying CD8 and CD20 staining. Bottom Right: The same assembly as to the left colored by CN. Scale bar indicates 50 µm. (E) Representative images of co-localization of PNAd+ endothelium and CD45RA+/CD62L+/CD8+T cells located in the (CD8+T cells|B cells) CN. Scale bar indicates 50 µm. (F) Frequency of CD45RA expression on CD8+T cells located in (CD8+T cell | B cell) CN relative to CD8+T cells throughout the tissue. Significance was determined with a Wilcoxon signed-rank test (* p<0.05, ** p<0.01, *** p<0.001). (G) Representative images of (CD8+T cells|B cells) instances adjacent to islets (G.1) and not adjacent to islets (G.2). Scale bars indicate 200 µm. (H) Quantification of the adjacency frequencies between the (CD8+T cells|B cells) CN and CNs rich in endocrine cells (i.e. ‘Islet CNs’). Mean, std: mean and standard deviation adjacency frequency across T1D donors. Abbreviations: Vasc.: vasculature; Mac.: macrophage. (I) Representative images of islet-adjacent CD45RA+/CD62L+/CD8+T cells. Scale bar indicates 50 µm. (J) Image showing the spatial distribution of the (CD8+T cells|B cells) CN instances relative to islets and the enrichment of (CD8+T cells|B cells) CN instances in areas of the pancreas with islets lacking β-cells.
Figure 5—figure supplement 1
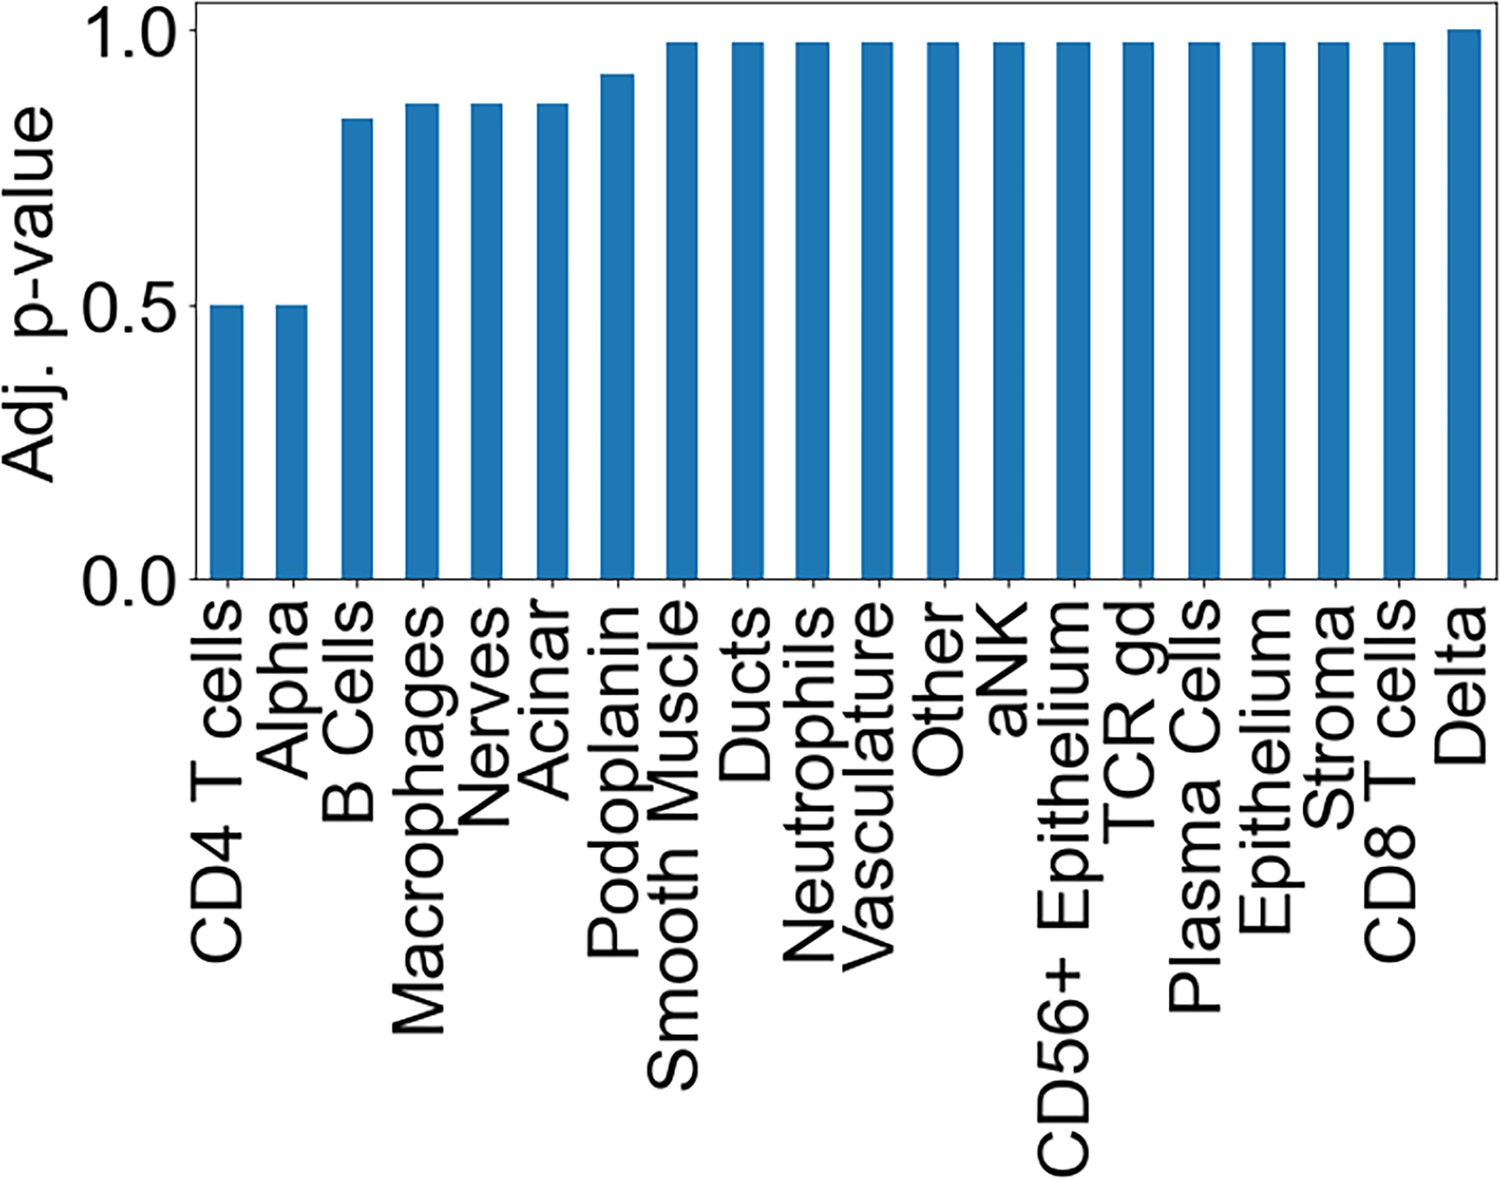
Association of the cell composition of the CD8+T cells|B cells CN with islet proximity.
For each feature (columns), a mixed-level model adjusting for donor was fit against instances that were or were not <20 µm from an islet and the p-value was determined using Satterthwaites’s method in lmerTest R package. Values in the heatmap were corrected for multiple hypotheses using the Benjamini, Hochberg method.
Figure 5—figure supplement 2
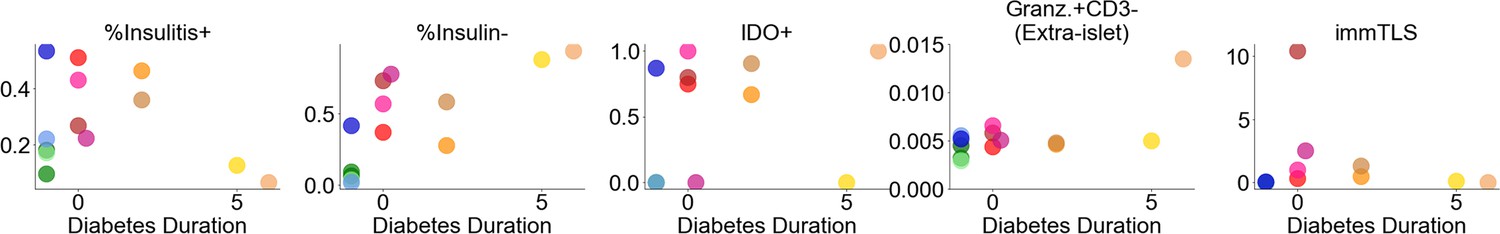
Correlation of key islet features with diabetes duration.
Figure 5—figure supplement 3
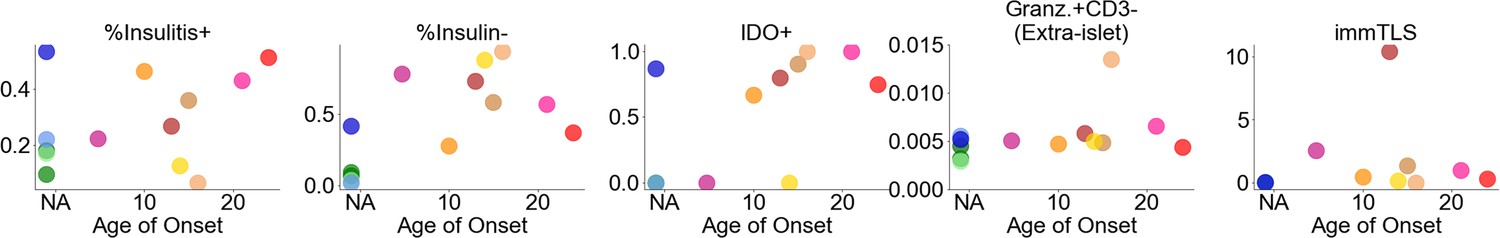
Correlation of key islet features with age of onset.
Tables
Table 1
nPOD case information.
| Case ID | Donor Type | Age (years) | Diabetes Duration (years) | Cause of Death | Gender | Ethnicity | BMI | nPOD RRID |
|---|---|---|---|---|---|---|---|---|
| 6267 | Autoab positive | 23 | NA | Anoxia | Female | Caucasian | 16.59 | SAMN15879321 |
| 6314 | Autoab positive | 21 | NA | Head Trauma | Male | Caucasian | 23.8 | SAMN15879368 |
| 6520 | T1D | 21.61 | 0 | Cerebrovascular/ | Male | Caucasian | 29.3 | SAMN18053203 |
| 6362 | T1D | 24.9 | 0 | Head Trauma | Male | Caucasian | 28.5 | SAMN15879415 |
| 6228 | T1D | 13 | 0 | Anoxia | Male | Caucasian | 17.4 | SAMN15879284 |
| 6209 | T1D | 5 | 0.25 | Cerebral edema secondary to DKA | Female | Caucasian | 15.9 | SAMN15879265 |
| 6371 | T1D | 12.5 | 2 | Cerebral edema | Female | Caucasian | 16.6 | SAMN15879424 |
| 6480 | T1D | 17.18 | 2 | DKA | Male | Caucasian | 27.1 | SAMN15879533 |
| 6195 | T1D | 19.3 | 5 | Head Trauma | Male | Caucasian | 23.7 | SAMN15879251 |
| 6323 | T1D | 22 | 6 | Anoxia | Female | Caucasian | 24.7 | SAMN15879377 |
| 6389 | No diabetes | 18.6 | NA | Head Trauma | Male | Caucasian | 20.9 | SAMN15879442 |
| 6179 | No diabetes | 20 | NA | Head Trauma | Female | Caucasian | 20.7 | SAMN15879235 |
| 6386 | No diabetes | 14 | NA | Head Trauma | Male | Caucasian | 23.9 | SAMN15879439 |
Table 2
Markers used for cell type identification.
Channels in the ‘Both’ column were used for clustering all cells and specifying immune cells. Channels in the ‘All’ column were only used for clustering all cells and UMAP in Figure 1B. Channels in ‘Immune’ columns were only used for sub-clustering immune cells and UMAP in Figure 1C. Channels in ‘Endocrine’ column were used for sub-clustering endocrine populations. Channels in ‘Unused’ column were not included in the clustering or UMAP step because they were either too weak to aid clustering or were expressed on multiple cell-populations and confounded cell type identification.
| Both | ‘All’ UMAP | ‘Immune’ UMAP | Endocrine Cells | Unused § |
|---|---|---|---|---|
| Channel 2 Blank* | alphaSMA | VISTA | Glucagon | CD44 |
| Channel 3 Blank* | Synaptophysin | TCR g/d | Insulin | CD45RA |
| Channel 4 Blank* | Podoplanin | MPO | Proinsulin | CD45RO |
| S100A6 | PD-L1 ‡ | HLA-DR | Somatostatin | CollIV |
| Hoechst† | NaKATPase | FOXP3 | HABP | |
| Granzyme B | MUC-1 | CD8 | HLA-ABC | |
| Galectin-3 | Draq 5 | CD69 | ICOS | |
| CD68 | Cytokeratin | CD4 | IDO | |
| CD57 | Chromogranin A | CD206 | Ki67 | |
| CD56 | CD31 | CD16 | Lag3 | |
| CD45 | CD11c | OX40 | ||
| CD3 | BCL-2 | PD-1 | ||
| CD20 | TOX | |||
| CD163 | ||||
| CD15 | ||||
| CD138 |
-
*
Channel 2–4 Blanks used for identifying autofluorescent cells. A cycle was run without adding fluorescent oligonucleotides.
-
†
Hoechst and Draq 5 were both used as Draq 5 gives slightly more uniform staining which improves segmentation.
-
‡
PD-L1 did not detect any positive myeloid cells or β-cells but stained nerve cells very brightly. Therefore, it was still useful to include.
-
§
‘Unused’ were used in other places in the manuscript but not for cell type annotation.
Key resources table
| Reagent type (species) or resource | Designation | Source or reference | Identifiers | Additional information |
|---|---|---|---|---|
| Antibody | CollIV | Abcam | AB_305584 | polyclonal |
| Antibody | Ki67 | BD | AB_396287 | B56 |
| Antibody | Chromogranin A | Novus | AB_3290980 | LK2H10+PHE5+CGA/414 |
| Antibody | Proinsulin | Thermo | AB_558517 | 3A1 |
| Antibody | Glucagon | Abcam | AB_297642 | K7bB10 |
| Antibody | CD8 | Santa Cruz | AB_1120718 | C8/144B |
| Antibody | CD15 | BD | AB_397181 | MMA |
| Antibody | MPO | R&D | AB_2250866 | polyclonal |
| Antibody | S100A6 | Novus | AB_10000990 | 7D11 |
| Antibody | MUC-1 | NSJ Bioreagents | AB_2864392 | 955 |
| Antibody | Cytokeratin | Biolegend | AB_439775 | C11 |
| Antibody | alphaSma | abcam | AB_2223021 | polyclonal |
| Antibody | CD57 | Biolegend | AB_2562403 | HCD57 |
| Antibody | CD44 | Biolegend | AB_312953 | IM-7 |
| Antibody | TCR g/d | Santa Cruz | AB_1130061 | H-41 |
| Antibody | NaKATPase | Abcam | AB_2890241 | EP1845Y |
| Antibody | BCL-2 | Cell Marque | AB_2864404 | 124 |
| Antibody | Galectin-3 | Thermo | AB_2136775 | A3A12 |
| Antibody | Podoplanin | Biolegend | AB_1595511 | NC-08 |
| Antibody | CD31 | Novus Bio | AB_2864381 | C31.3+C31.7+C31.10 |
| Antibody | CD45RA | Biolegend | AB_1946436 | HI100 |
| Antibody | CD69 | Novus | AB_355231 | polyclonal (AF2359) |
| Antibody | CD20 | Novus | AB_2864380 | rIGEL/773 |
| Antibody | CD16 | CST | AB_3280014 | D1N9L |
| Antibody | CD163 | Novus | AB_714951 | EDHu-1 |
| Antibody | Somatostatin | Novus | AB_2890053 | 7G5 |
| Antibody | CD206 | R&D | AB_2063019 | poly |
| Antibody | CD45 | Novus | AB_2864384 | 2B11+PD7/26 |
| Antibody | Synaptophysin | Novus | AB_10010435 | 7H12 |
| Antibody | HLA-DR | abcam | AB_2864390 | EPR3692 |
| Antibody | VISTA | CST | AB_3683060 | D1L2G |
| Antibody | IDO | CST | AB_3683091 | D5J4E |
| Antibody | biotinylated Hyaluronan Binding Protein (HABP) | Bollyky Lab Stanford University | NA | Clark et al., 2011 |
| Antibody | HLA-ABC | BD | AB_2739161 | EMR8-5 |
| Antibody | TOX | CST | AB_3675995 | E6I3Q |
| Antibody | FOXP3 | Invitrogen | AB_467555 | 236 A/E7 |
| Antibody | Insulin | Sigma | AB_260137 | K36AC10 |
| Antibody | Lag3 | CST | AB_2943248 | D2G4O |
| Antibody | PD-1 | CST | AB_3675993 | D4W2J |
| Antibody | PD-L1 | CST | AB_2922774 | E1L3N |
| Antibody | CD3 | CST | AB_2922776 | D7A6E |
| Antibody | CD4 | Abcam | AB_2864377 | EPR6855 |
| Antibody | CD11c | AbCam | AB_2864379 | EP1347Y |
| Antibody | CD56 | Cell Marque | AB_3082973 | MRQ-42 |
| Antibody | CD45RO | Santa Cruz | AB_627083 | UCH-L1 |
| Antibody | ICOS | CST | AB_3676096 | D1K2T |
| Antibody | Granzyme B | Abcam | AB_2910576 | EPR20129-217 |
| Antibody | OX40 | Biolegend | AB_10639951 | Ber-ACT35 |
| Antibody | CD138 | Invitrogen | AB_11153181 | B-A38 |
| Antibody | CD68 | CST | AB_2920587 | D4B9C |
| Antibody | PNAD | Biolegend | AB_493554 | MECA-79 |
| Antibody | CD62L | SCBT | AB_3683092 | B-8 |
| Antibody | mouse IgG | Sigma | AB_1163670 | |
| Antibody | rat IgG | Sigma | AB_1163627 | |
| Sequence-based reagent | TriLink Biotechnologies and Integrated DNA Technologies | Schürch et al., 2020 | ||
| Biological sample (Homo sapiens) | FFPE tissue block | Network of Pancreatic Organ Donors | ||
| Peptide, recombinant protein | Streptavidin-PE | Biolegend | 405203 | |
| Chemical compound, drug | CODEX Reagents | Schürch et al., 2020 | ||
| Software, algorithm | CODEX Toolkit | https://github.com/nolanlab/CODEX; Samusik et al., 2018 | ||
| Software, algorithm | ImageJ (Fiji version 2.0.0) | https://imagej.net | ||
| Software, algorithm | VGG Image annotator | https://www.robots.ox.ac.uk/~vgg/software/via/via_demo.html | Dutta and Zisserman, 2019 | |
| Software, algorithm | CellSeg | https://michaellee1.github.io/CellSegSite/ | Lee et al., 2022 |
Table 3
Standard CODEX experimental details.
| Cycle | Antibody | A488 | Exposure (ms) | Antibody | A555 | Exposure (ms) | Antibody | A647 | Exposure (ms) |
|---|---|---|---|---|---|---|---|---|---|
| 1 | CollIV | 33 | 333 | NaKATPase | 36 | 100 | HLA-ABC | 53 | 100 |
| 2 | blank | 1000 | blank | 1000 | blank | 1000 | |||
| 3 | Ki67 | 6 | 100 | BCL-2 | 46 | 500 | TOX | 28 | 150 |
| 4 | Chromogranin A | 43 | 16 | empty | 1 | FOXP3 | 61 | 1000 | |
| 5 | Proinsulin | 63 | 40 | Galectin-3 | 60 | 166 | empty | 1 | |
| 6 | Glucagon | 24 | 50 | Podoplanin | 32 | 500 | Insulin | 30 | 200 |
| 7 | CD8 | 8 | 125 | CD31 | 68 | 100 | Lag3 | 42 | 500 |
| 8 | CD15 | 14 | 40 | CD45RA | 7 | 333 | PD-1 | 23 | 500 |
| 9 | MPO | 51 | 117 | CD69 | 52 | 500 | PD-L1 | 11 | 500 |
| 10 | S100A6 | 70 | 500 | empty | 1 | CD3 | 77 | 500 | |
| 11 | MUC-1 | 21 | 33 | CD20 | 48 | 167 | CD4 | 20 | 500 |
| 12 | Cytokeratin | 67 | 100 | CD16 | 15 | 250 | CD11c | 49 | 500 |
| 13 | alphaSma | 69 | 50 | CD163 | 45 | 100 | empty | 1 | |
| 14 | CD57 | 57 | 300 | Somatostatin | 2 | 100 | CD56 | 29 | 333 |
| 15 | CD44 | 44 | 250 | CD206 | 55 | 400 | CD45RO | 3 | 500 |
| 16 | TCR g/d | 72 | 1000 | CD45 | 56 | 250 | ICOS | 41 | 500 |
| 17 | empty | 1 | Synaptophysin | 26 | 250 | Granzyme B | 81 | 100 | |
| 18 | empty | 1 | HLA-DR | 65 | 250 | OX40 | 66 | 400 | |
| 19 | empty | 1 | VISTA | 79 | 500 | CD138 | 76 | 200 | |
| 20 | empty | 1 | IDO | 59 | 2500 | CD68 | 5 | 100 | |
| 21 | empty | 1 | HABP | StrPE | 13 | Draq 5 | 115 |
Table 4
Immature TLS CODEX experimental details.
| Cycle | Antibody | A488 | Exposure (ms) | Antibody | A555 | Exposure (ms) | Antibody | A647 | Exposure (ms) |
|---|---|---|---|---|---|---|---|---|---|
| 1 | Chromogranin A | 43 | 16 | CD20 | 48 | 167 | CD3 | 77 | 500 |
| 2 | Proinsulin | 63 | 40 | CD31 | 68 | 100 | CD45RO | 3 | 500 |
| 3 | CD8 | 8 | 125 | CD45RA | 7 | 333 | CD4 | 20 | 500 |
| 4 | Ki67 | 6 | 100 | Podoplanin | 32 | 500 | CD138 | 76 | 200 |
| 5 | Glucagon | 24 | 50 | CD62L | 38 | 250 | PnAD | 71 | 333 |
| 6 | alphaSma | 69 | 50 | CollIV | 33 | 333 |
Additional files
Download links
A two-part list of links to download the article, or parts of the article, in various formats.
Downloads (link to download the article as PDF)
Open citations (links to open the citations from this article in various online reference manager services)
Cite this article (links to download the citations from this article in formats compatible with various reference manager tools)
The extra-islet pancreas supports autoimmunity in human type 1 diabetes
eLife 13:RP100535.
https://doi.org/10.7554/eLife.100535.3


