Effective population size does not explain long-term variation in genome size and transposable element content in animals
- ISEM, Université de Montpellier, CNRS, IRD, France
- Université Claude Bernard Lyon 1, LEHNA UMR 5023, CNRS, France
- Institut Universitaire de France, France
- Université Claude Bernard Lyon 1, LBBE UMR 5558, France
Figures
Figure 1
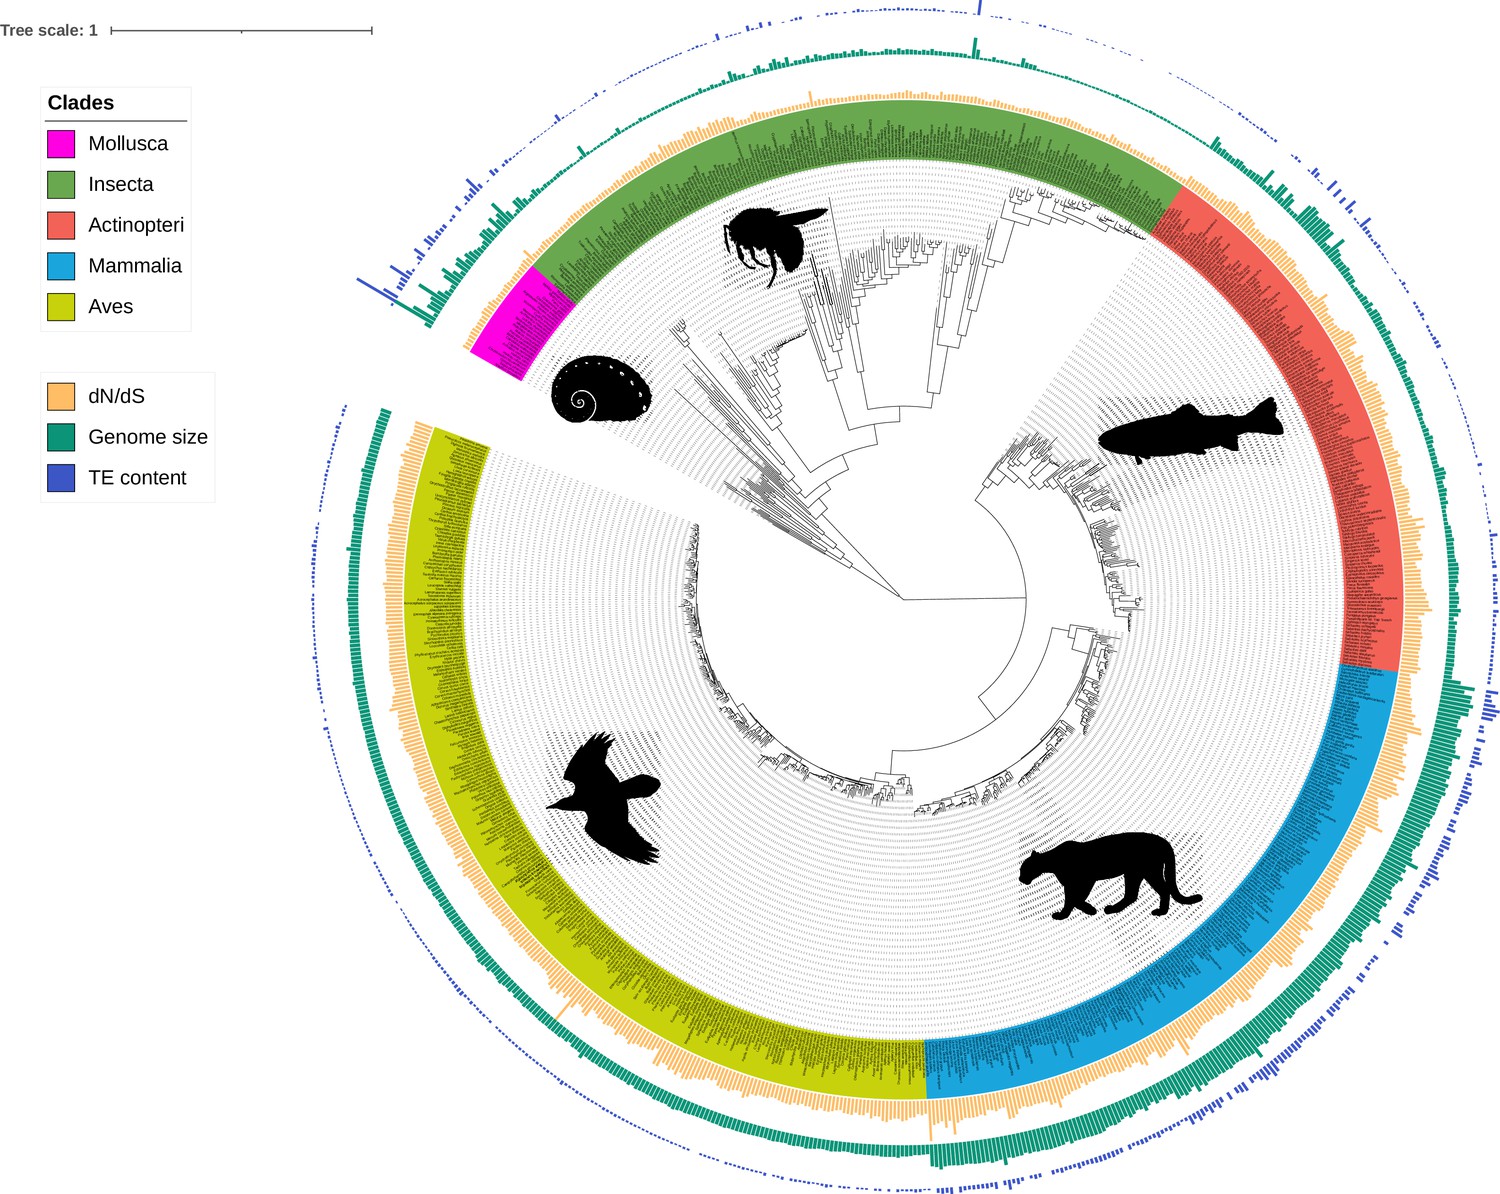
Phylogeny of the 807 species including ray-finned fishes (Actinopteri), birds (Aves), insects (Insecta), mammals (Mammalia), and molluscs (Mollusca).
Bars correspond to TE content (bp, blue), genome size (bp, green), and dN/dS estimations (values between 0 and 1, yellow). Branch lengths are amino-acid substitutions calculated on BUSCO genes. The tree was plotted with iTOL (Letunic and Bork, 2021).
-
Figure 1—source data 1
iTOL annotation file for dN/dS bars.
- https://cdn.elifesciences.org/articles/100574/elife-100574-fig1-data1-v1.txt
-
Figure 1—source data 2
iTOL annotation file for genome size bars.
- https://cdn.elifesciences.org/articles/100574/elife-100574-fig1-data2-v1.txt
-
Figure 1—source data 3
iTOL annotation file for TE content bars.
- https://cdn.elifesciences.org/articles/100574/elife-100574-fig1-data3-v1.txt
Figure 2
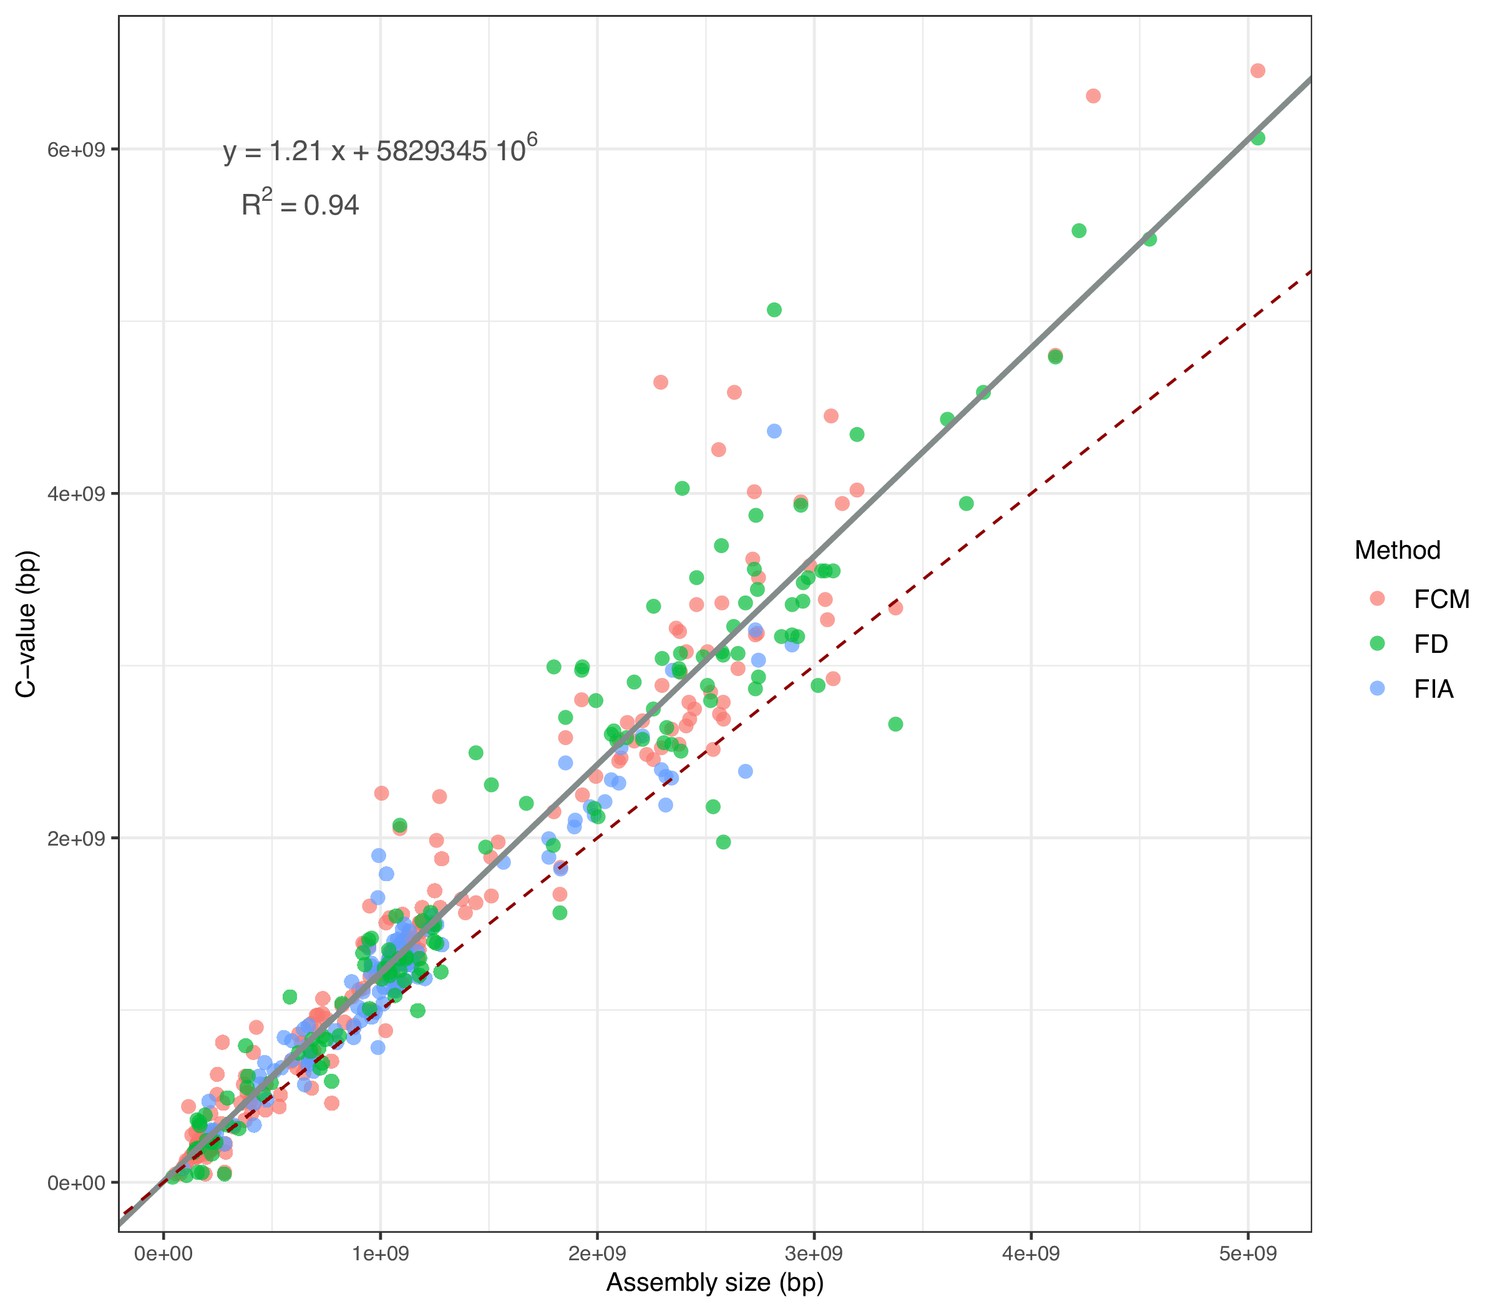
Correlation between assembly sizes and C-values for 365 species with contig N50 ≥50 kb.
The grey slope corresponds to the WLS used to predict the expected C-values (reported in the equation). The dark-red dashed slope marks the hypothetical 1:1 relationship. FCM = Flow Cytometry, FD = Feulgen Densitometry, FIA = Feulgen Image Analysis.
-
Figure 2—source data 1
C-value records and assembly sizes used to train the WLS.
Measurements made with flowcytometry (FCM), Feulgen densitometry (FD), and Feulgen image analysis (FIA) were issued from https://www.genomesize.com/ for species with contig N50 ≥ 50 kb.
- https://cdn.elifesciences.org/articles/100574/elife-100574-fig2-data1-v1.xlsx
Figure 3 with 1 supplement
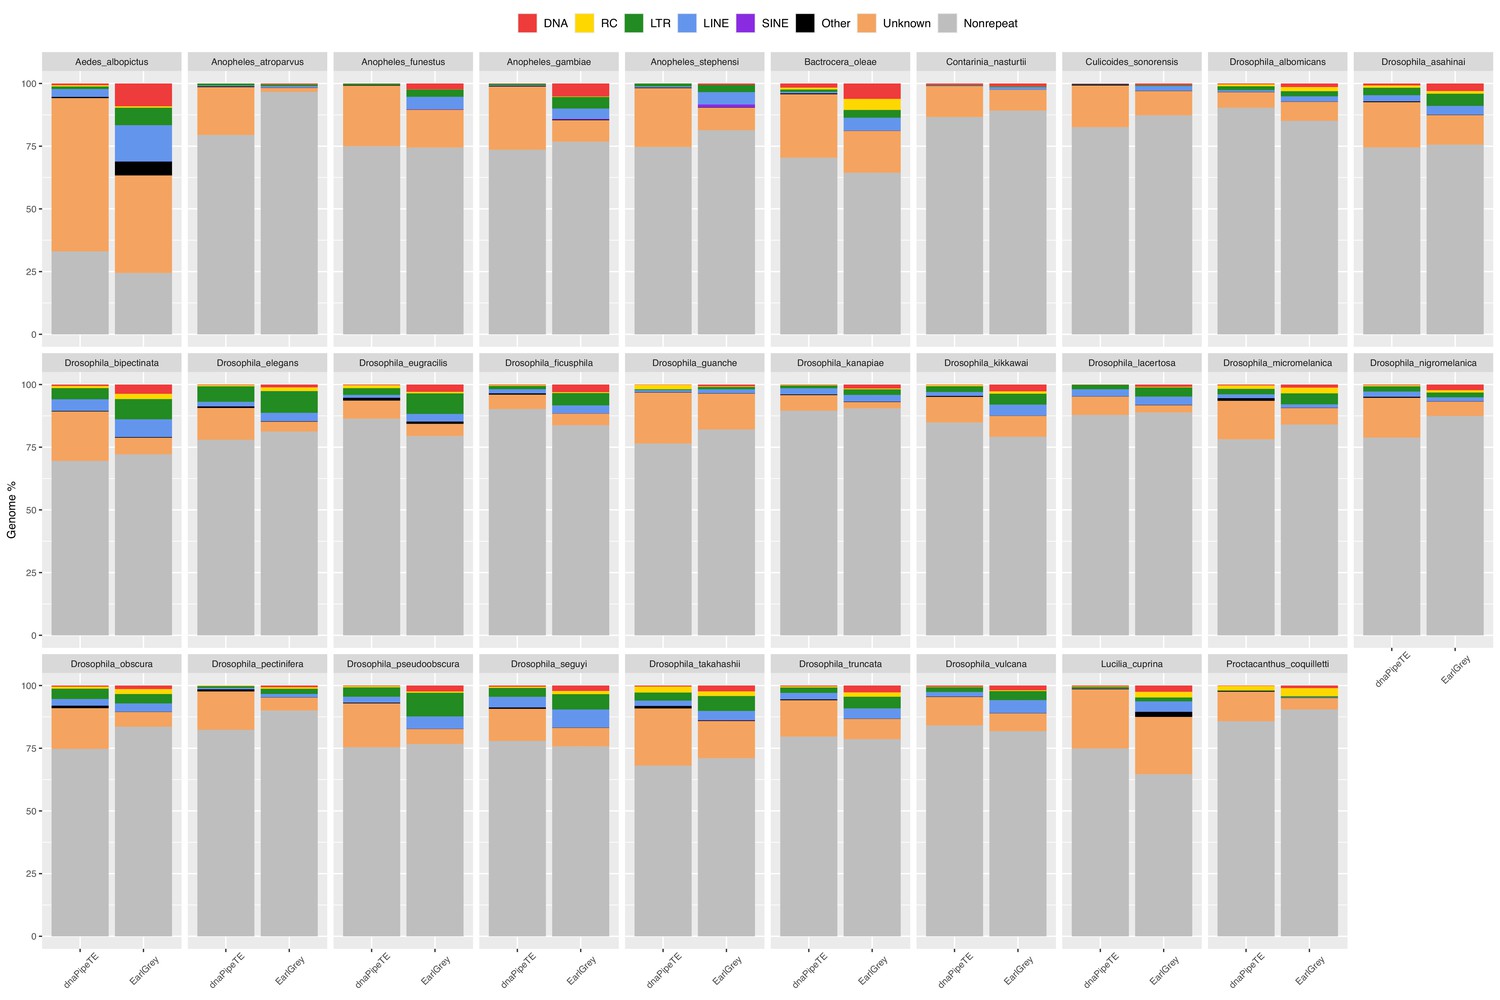
Genomic proportion occupied by repeats in 29 dipteran species as estimated by EarlGrey and by the dnaPipeTE wrapper pipelines.
The genome percentage is calculated proportionally to the assembly size in the case of EarlGrey, while it is calculated in relation to the genome size estimated in this study in the case of dnaPipeTE. DNA = DNA elements; RC = Rolling Circle; LTR = Long Terminal Repeats; LINE = Long Interspersed Nuclear Elements; SINE = Short Interspersed Nuclear Elements. ‘Other’ includes simple repeats, microsatellites, RNAs. ‘Unknown’ includes all repeats that could not be classified.
-
Figure 3—source data 1
Quantity of repeated elements for 29 dipteran genomes as estimated by EarlGrey and dnaPipeTE.
Repeat content is reported overall and by order, both in base pairs and genomic percentage. Due to the different method, percentages are based on assembly size for EarlGrey and on genome size for dnaPipeTE.
- https://cdn.elifesciences.org/articles/100574/elife-100574-fig3-data1-v1.xlsx
Figure 3—figure supplement 1
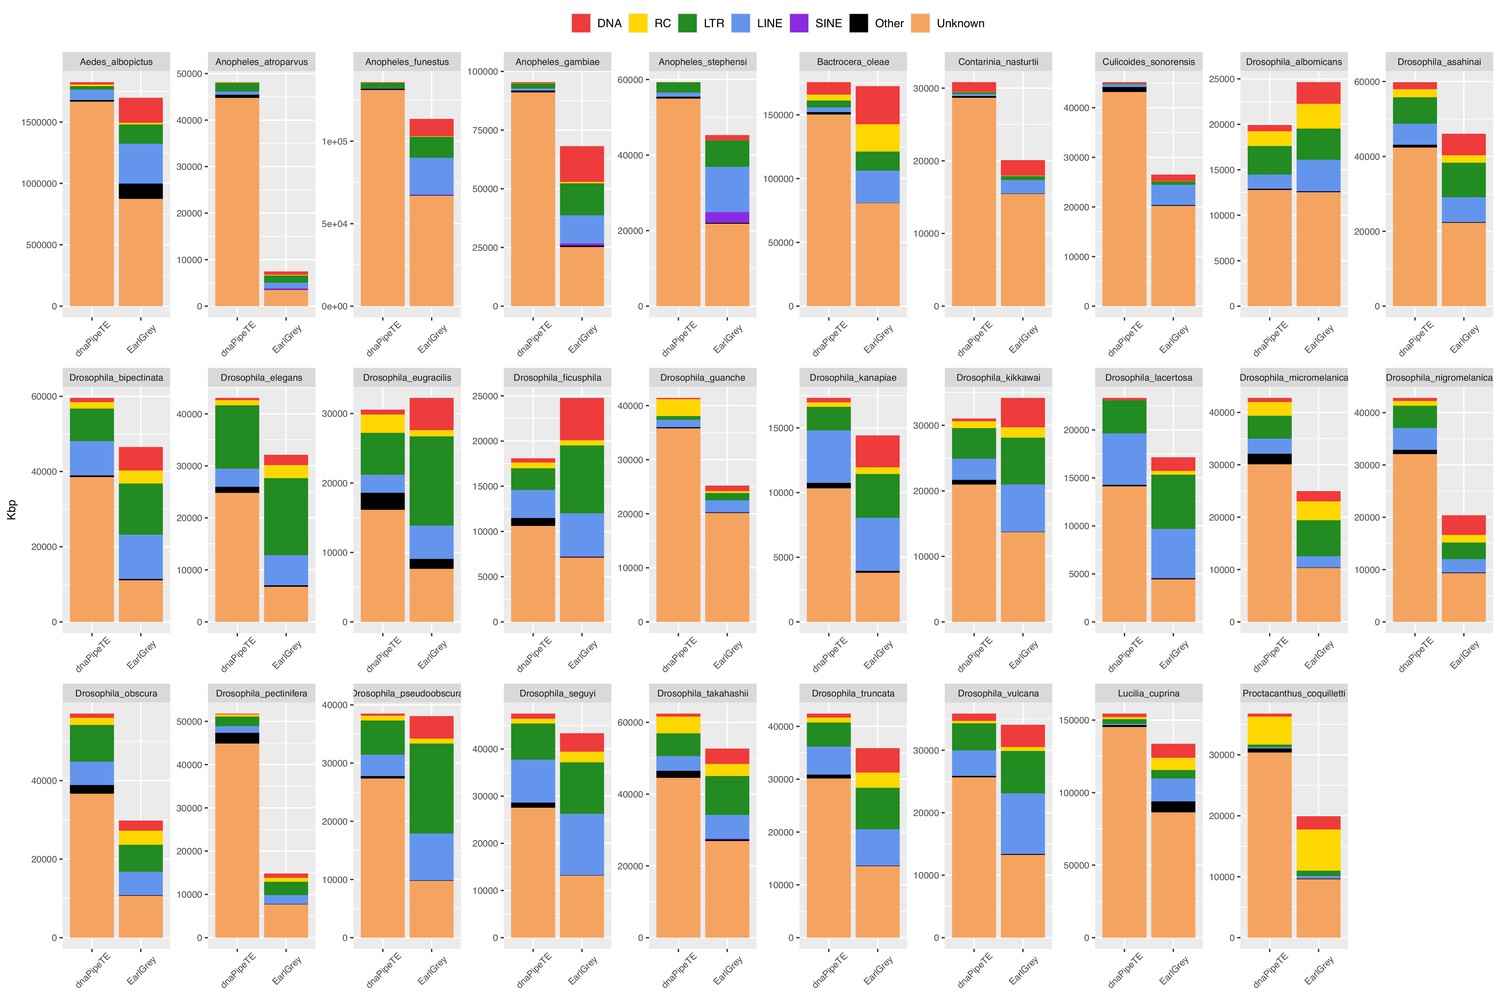
Genomic length occupied by repeats in 29 dipteran species as estimated by EarlGrey and by the dnaPipeTE wrapper pipelines.
Kbps are reported as the total base pairs annotated in the assembly in the case of EarlGrey, and as the estimated coverage from reads sampling in the case of dnaPipeTE. DNA = DNA elements; RC = Rolling Circle; LTR = Long Terminal Repeats; LINE = Long Interspersed Nuclear Elements; SINE = Short Interspersed Nuclear Elements. ‘Other’ includes simple repeats, microsatellites, RNAs. ‘Unknown’ includes all repeats that could not be classified.
Figure 4 with 3 supplements
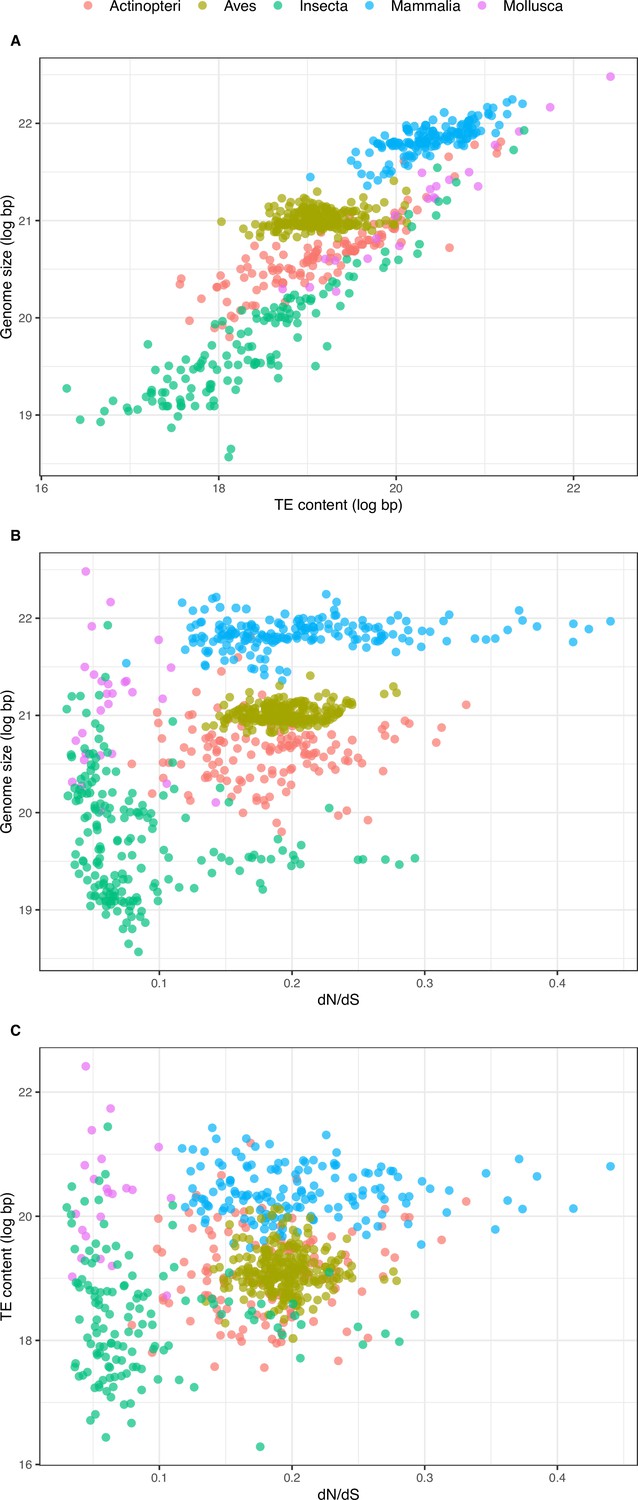
Relationship between overall TE content, genome size, and dN/dS.
(A) Relationship between overall TE content and genome size (N=672, log-transformed): slope = 0.718, adjusted-R2=0.751, p-value <0.001. (B) Relationship between genome size and dN/dS (N=785): slope = 6.100, adjusted-R2=0.275, p-value <0.001. (C) Relationship between TE content and dN/dS (N=672): slope = 4.253, adjusted-R2=0.092, p-value <0.001. Statistics refer to linear regression, see figure supplements and Tables 1 and 3 for Phylogenetic Independent Contrasts results.
Figure 4—figure supplement 1
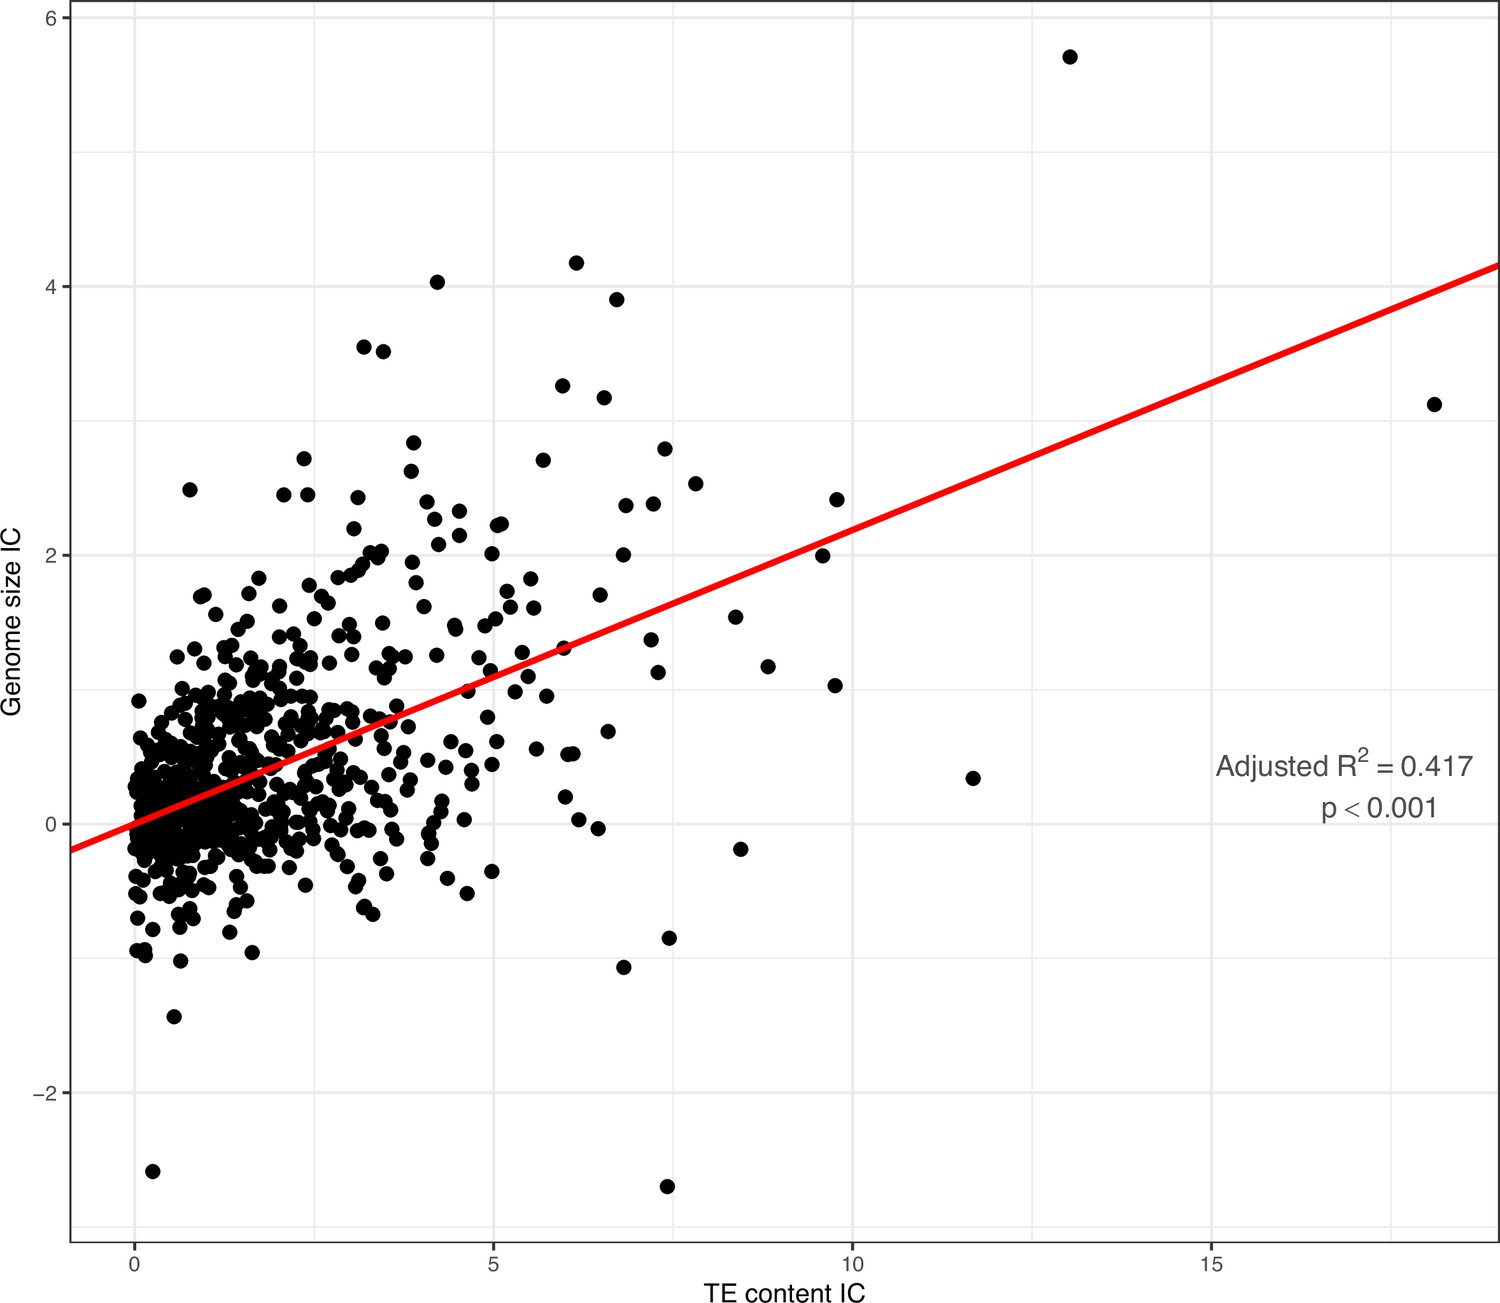
PIC regression of overall TE content as a predictor of genome size across the full dataset.
Slope = 0.219, adjusted−R2=0.417, p−value <0.001. Variables were log−transformed previous to regression.
Figure 4—figure supplement 2

PIC regressions of Coevol dN/dS estimated from the GC3-poor geneset as predictor of genome size, overall and recent TE content.
(A) Genome size: slope = –0.287, adjusted-R2=0.004, p-value = 0.039. (B) Overall TE content: slope = –0.903, adjusted-R2=0.004, p-value = 0.050. (C) Recent TE content: slope = –1.225, adjusted-R2=0.003, p-value = 0.089. Genomic traits were log-transformed previous to regression.
Figure 4—figure supplement 3
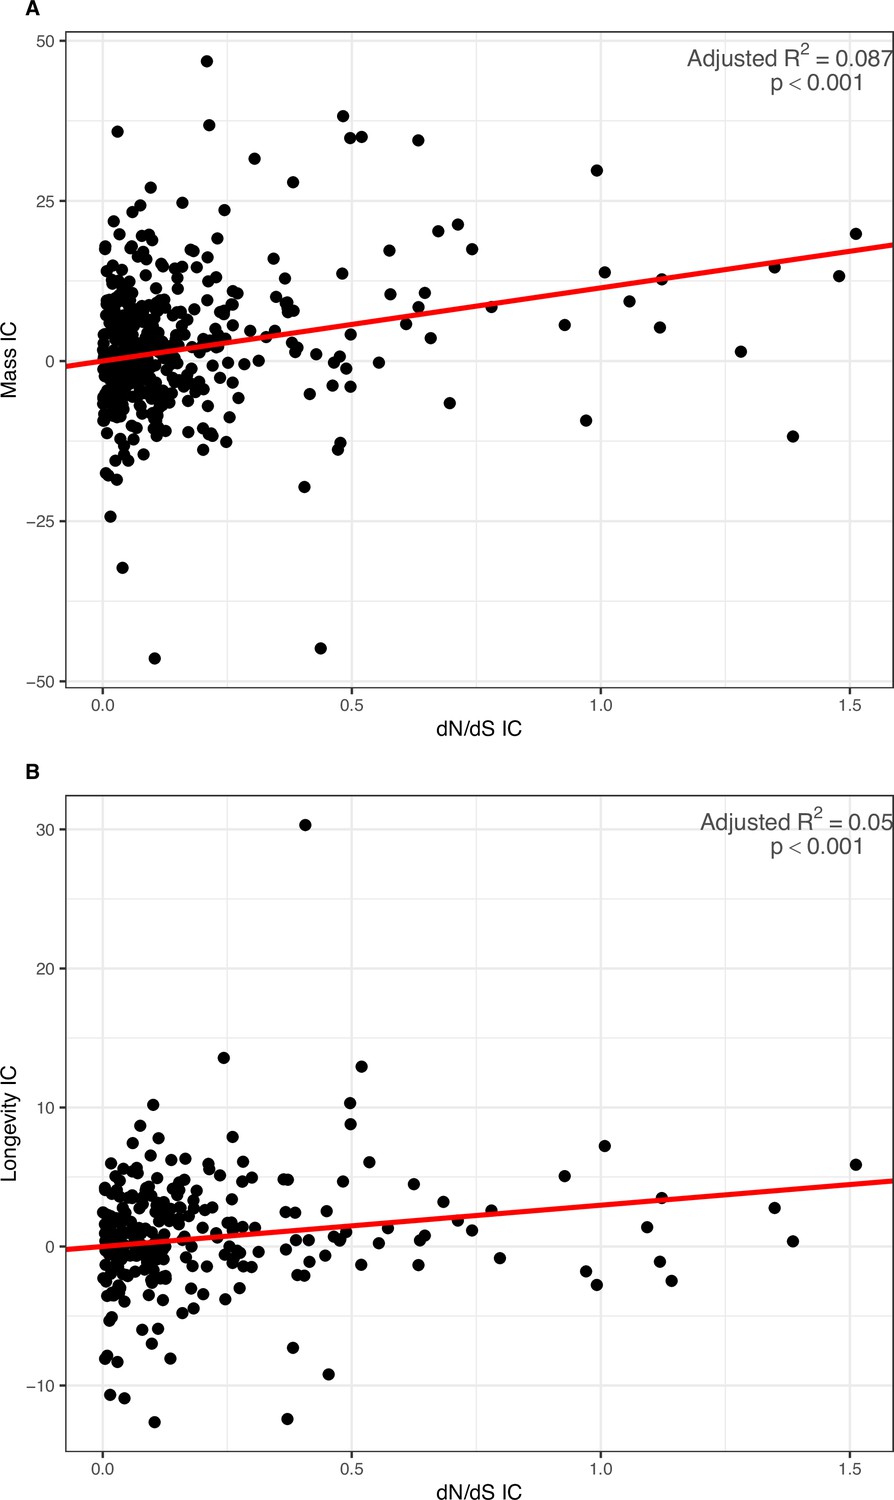
PIC regressions for Coevol dN/dS estimated from the GC3-poor geneset as predictor of body mass and longevity.
(A) Body mass: slope = 11.422, adjusted-R2=0.087, p-value <0.001. (B) Longevity: slope = 2.970, adjusted-R2=0.050, p-value <0.001. LHTs were log-transformed previous to regression.
Figure 5
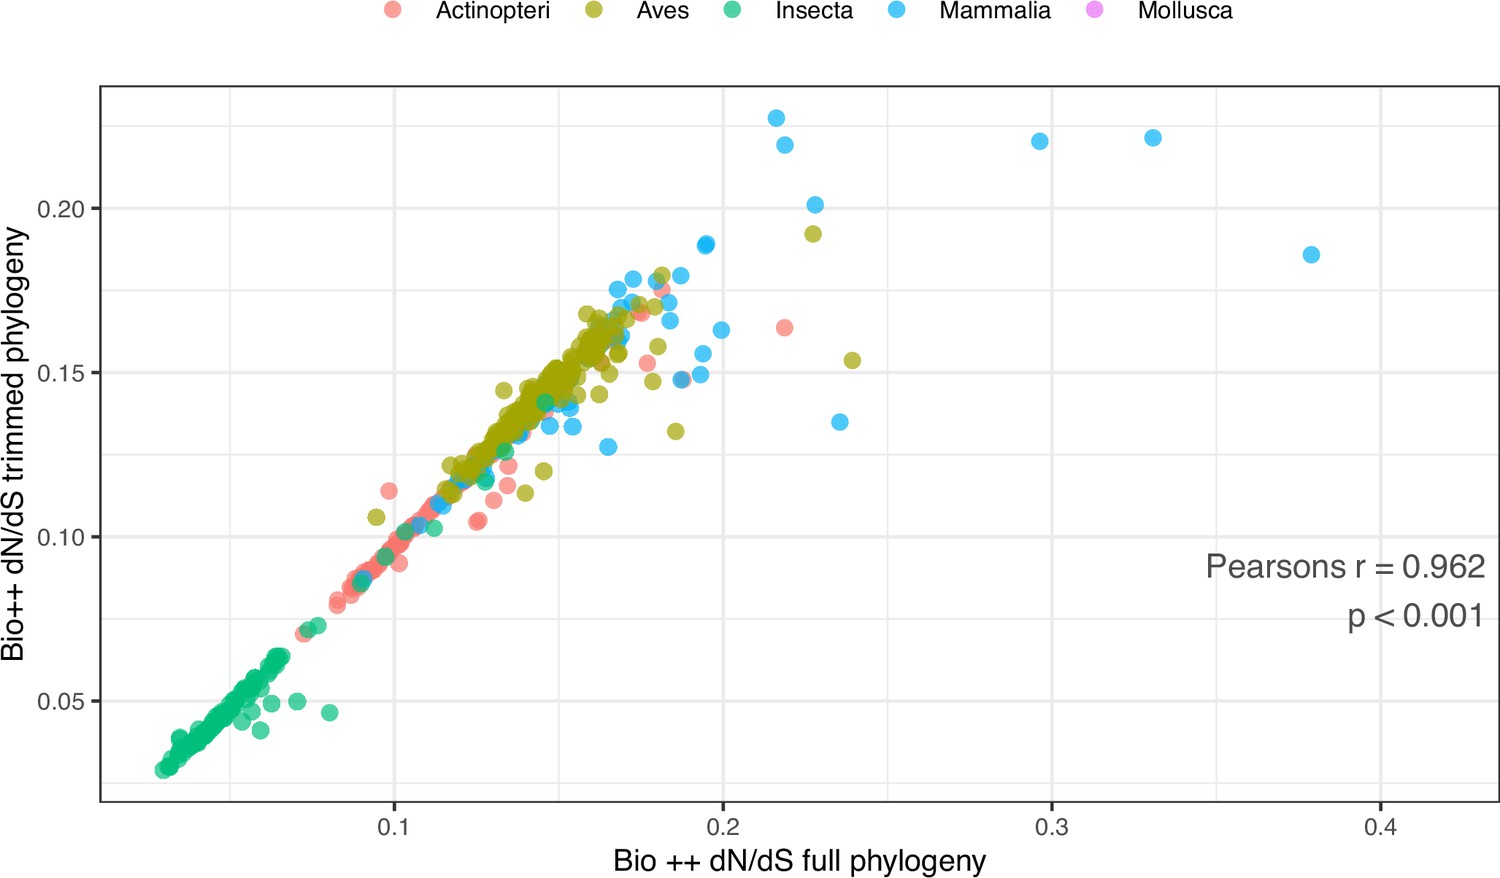
Comparison of Bio ++ dN/dS estimated from the full and pruned phylogenies.
To obtain the pruned phylogeny, branches longer than 1 and shorter than 0.01 amino-acid substitutions were removed, leaving 485 tips. Pearson’s r=0.962, p-value <0.001. The corresponding dN/dS values are included in Table 3—source data 1.
Figure 6
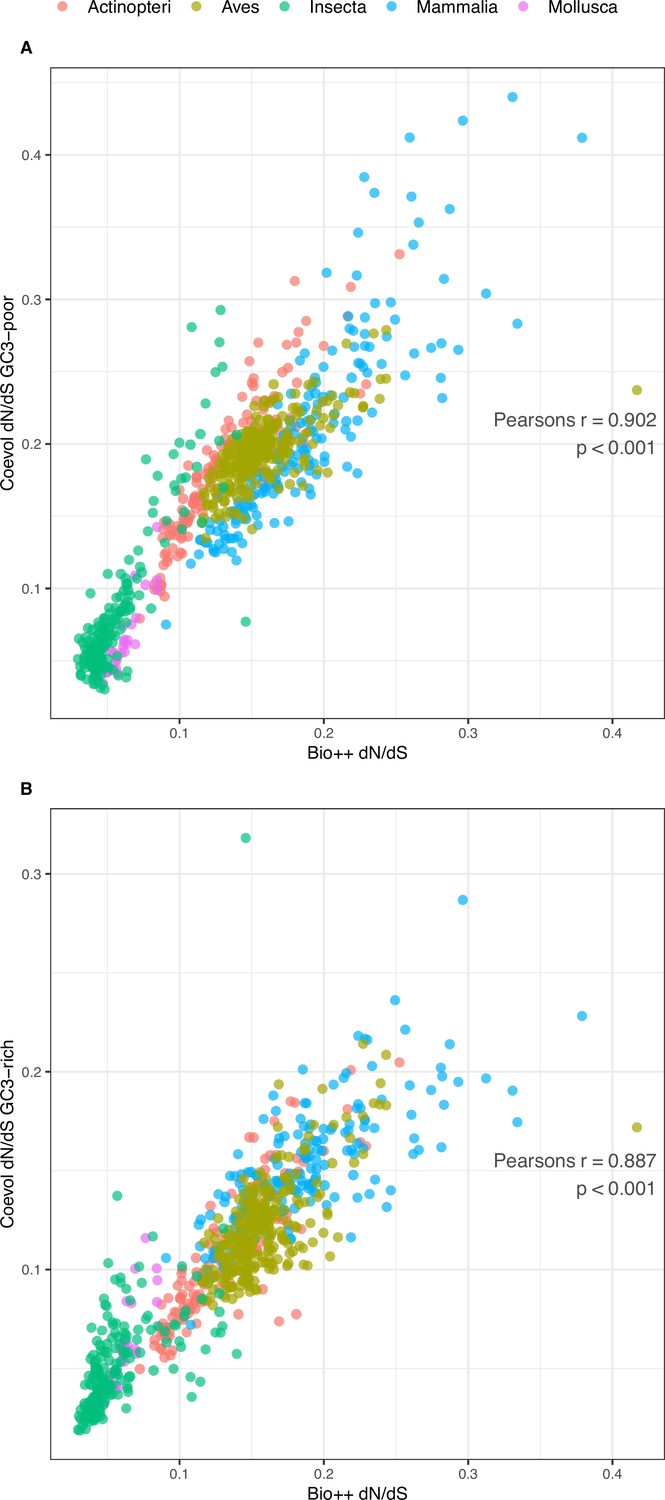
Comparison of Bio ++ and Coevol dN/dS estimations.
(A) GC3-poor geneset (N=785): Pearson’s r=0.902, p-value <0.001. (B) GC3-rich geneset (N=785): Pearson’s r=0.887, p-value <0.001. The corresponding dN/dS values are included in Table 3—source data 1.
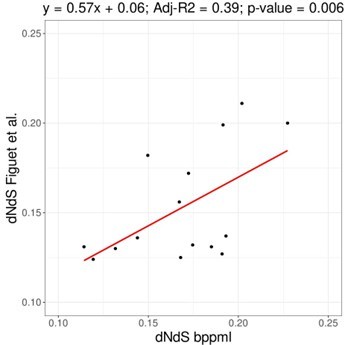
Author response image 1
Tables
Table 1
Correlation between genome size and overall TE content based on phylogenetic independent contrasts.
Statistics are shown relative to the overall dataset and to each clade. Variables were log-transformed previous to regression. Original values used to infer PIC statistics are included in Table 3—source data 1. * 0.05<p ≤ 0.01; ** 0.01<p ≤ 0.001; *** p<0.001. Significant correlations are highlighted in bold.
| Regression coefficient | Adjusted-R2 | p-value | |
|---|---|---|---|
| Overall Dataset | 0.219 *** | 0.417 *** | <0.001 |
| Actinopteri | 0.300 *** | 0.610 *** | <0.001 |
| Aves | 0.042 *** | 0.039 ** | 0.001 |
| Insecta | 0.356 *** | 0.626 *** | <0.001 |
| Mammalia | 0.200 *** | 0.526 *** | <0.001 |
| Mollusca | 0.605 *** | 0.895 *** | <0.001 |
Table 2
Coevol correlations between genomic traits – genome size, TE content, and recent TE content – and LHTs.
Different LHTs are shown according to availability for a clade. Posterior probabilities lower than 0.1 indicate significant negative correlations; posterior probabilities higher than 0.9 indicate significant positive correlations. Expected, significant correlations are marked in bold black; significant correlations opposite to the expected trend are marked in bold red.
| Coevol correlations | Actinopteri | Aves | Insecta | Mammalia | Mollusca | |||||||||||||||
|---|---|---|---|---|---|---|---|---|---|---|---|---|---|---|---|---|---|---|---|---|
| GC3-poor | GC3-rich | GC3-poor | GC3-rich | GC3-poor | GC3-rich | GC3-poor | GC3-rich | GC3-poor | GC3-rich | |||||||||||
| Genome size | CC | PP | CC | PP | CC | PP | CC | PP | CC | PP | CC | PP | CC | PP | CC | PP | CC | PP | CC | PP |
| Body length | 0.015 | 0.56 | 0.015 | 0.56 | –0.065 | 0.26 | –0.081 | 0.21 | ||||||||||||
| Basal metabolic rate (ml/O2/hour)* | 0.028 | 0.60 | 0.064 | 0.72 | ||||||||||||||||
| Age at first birth | –0.223 | 0.02 | –0.256 | 0.01 | ||||||||||||||||
| Population density | 0.203 | 0.97 | 0.200 | 0.96 | ||||||||||||||||
| Maximum longevity | 0.135 | 0.85 | 0.142 | 0.87 | 0.116 | 0.91 | 0.161 | 0.94 | –0.106 | 0.14 | –0.109 | 0.15 | ||||||||
| Mass | 0.030 | 0.61 | 0.040 | 0.65 | 0.201 | 1 | 0.185 | 0.99 | –0.077 | 0.23 | –0.097 | 0.16 | ||||||||
| Metabolic rate (W)† | –0.274 | 0.003 | –0.210 | 0.02 | 0.047 | 0.68 | 0.078 | 0.76 | ||||||||||||
| Sexual maturity | –0.011 | 0.45 | 0.013 | 0.52 | 0.039 | 0.64 | 0.048 | 0.67 | –0.176 | 0.05 | –0.180 | 0.05 | ||||||||
| Depth range | –0.013 | 0.47 | 0.000 | 0.51 | ||||||||||||||||
| Overall TE content | 0.793 | 1 | 0.779 | 1 | 0.293 | 1 | 0.335 | 1.00 | 0.842 | 1 | 0.834 | 1 | 0.679 | 1.00 | 0.678 | 1.00 | 0.909 | 1 | 0.895 | 1 |
| Recent TE content | 0.664 | 1 | 0.632 | 1 | 0.237 | 1 | 0.283 | 1.00 | 0.809 | 1 | 0.804 | 1 | 0.484 | 1.00 | 0.511 | 1.00 | 0.899 | 1 | 0.897 | 1 |
| TE content | CC | PP | CC | PP | CC | PP | CC | PP | CC | PP | CC | PP | CC | PP | CC | PP | CC | PP | CC | PP |
| Body length | –0.103 | 0.17 | –0.073 | 0.26 | –0.238 | 0.013 | –0.274 | 0.01 | ||||||||||||
| Basal metabolic rate (ml/O2/hour)* | 0.164 | 0.89 | 0.253 | 0.97 | ||||||||||||||||
| Age at first birth | –0.427 | 0 | –0.473 | 0.00 | ||||||||||||||||
| Population density | 0.274 | 0.98 | 0.271 | 0.98 | ||||||||||||||||
| Maximum longevity | 0.137 | 0.85 | 0.155 | 0.87 | 0.077 | 0.79 | 0.03 | 0.62 | –0.231 | 0.013 | –0.277 | 0.02 | ||||||||
| Mass | –0.091 | 0.22 | –0.051 | 0.32 | –0.022 | 0.38 | –0.012 | 0.43 | –0.233 | 0.017 | –0.278 | 0.01 | ||||||||
| Metabolic rate (W)† | 0.164 | 0.94 | 0.168 | 0.92 | 0.197 | 0.94 | 0.269 | 0.98 | ||||||||||||
| Sexual maturity | –0.031 | 0.43 | 0.011 | 0.53 | –0.100 | 0.2 | –0.13 | 0.11 | –0.329 | 0 | –0.343 | 0.00 | ||||||||
| Depth range | –0.026 | 0.43 | 0.004 | 0.52 | ||||||||||||||||
| Recent TE content | CC | PP | CC | PP | CC | PP | CC | PP | CC | PP | CC | PP | CC | PP | CC | PP | CC | PP | CC | PP |
| Body length | –0.133 | 0.12 | –0.085 | 0.22 | –0.297 | 0.00 | –0.305 | 0.01 | ||||||||||||
| Basal metabolic rate (ml/O2/hour)* | 0.229 | 0.94 | 0.308 | 0.99 | ||||||||||||||||
| Age at first birth | –0.486 | 0.00 | –0.506 | 0.00 | ||||||||||||||||
| Population density | 0.238 | 0.94 | 0.227 | 0.95 | ||||||||||||||||
| Maximum longevity | 0.138 | 0.85 | 0.176 | 0.9 | 0.063 | 0.73 | 0.020 | 0.57 | –0.334 | 0.00 | –0.347 | 0.01 | ||||||||
| Mass | –0.153 | 0.10 | –0.096 | 0.21 | –0.026 | 0.36 | –0.007 | 0.47 | –0.286 | 0.00 | –0.308 | 0.01 | ||||||||
| Metabolic rate (W)† | 0.142 | 0.9 | 0.144 | 0.88 | 0.265 | 0.97 | 0.313 | 0.99 | ||||||||||||
| Sexual maturity | –0.011 | 0.47 | 0.051 | 0.62 | –0.126 | 0.15 | –0.151 | 0.1 | –0.329 | 0.00 | –0.326 | 0.01 | ||||||||
| Depth range | –0.036 | 0.39 | 0.040 | 0.61 | ||||||||||||||||
-
*
PanTHERIA.
-
†
AnAge.
-
Table 2—source data 1
Genome sizes, all LHTs records, overall, and recent TE contents for the selected 807 species.
These correspond to the original values provided to the input matrix of characters to run Coevol.
- https://cdn.elifesciences.org/articles/100574/elife-100574-table2-data1-v1.xlsx
Table 3
PIC results for the correlations of LHTs, genome size, and TE content against dN/dS.
Results for Bio ++ dN/dS are shown for the full dataset and for the phylogeny deprived of the longest (>1 amino-acid substitutions) and shortest (<0.01 amino-acid substitutions) terminal branches. Results for Coevol dN/dS are relative to the GC3-poor geneset. Only body mass and longevity are reported as LHTs (for an overview of all traits, see Table 2). For genomic traits, statistics are reported relative to the overall dataset and to each clade. Expected significant correlations of dN/dS with LHTs and genomic traits are marked in bold black; significant correlations opposite to the expected trend are marked in bold red. * 0.05 < p ≤ 0.01; ** 0.01 < p ≤ 0.001; *** p < 0.001.
| PIC correlations | Bio++ (full phylogeny) | Bio++ (trimmed phylogeny) | Coevol | |||||||
|---|---|---|---|---|---|---|---|---|---|---|
| Regression coefficient | Adjusted-R² | p-value | Regression coefficient | Adjusted-R² | p-value | Regression coefficient | Adjusted-R² | p-value | ||
| Body mass (log gr)~dN/dS | Overall Dataset | 6.865 *** | 0.036 *** | <0.001 | 23.905 *** | 0.044 *** | <0.001 | 11.422 *** | 0.087 *** | <0.001 |
| Longevity (log years)~dN/dS | Overall Dataset | 2.147 ** | 0.025 ** | 0.004 | 11.349 *** | 0.097 *** | <0.001 | 2.970 *** | 0.050 *** | <0.001 |
| Genome size (log bp)~dN/dS | Overall Dataset | 0.199 | 0.001 | 0.175 | 0.114 | –0.002 | 0.858 | –0.287 * | 0.004 * | 0.039 |
| Actinopteri | 0.915 | 0.016 | 0.066 | 0.687 | –0.009 | 0.701 | 0.282 | –0.005 | 0.583 | |
| Aves | 0.109 | 0.001 | 0.270 | 0.709 | 0.013 | 0.073 | 0.238 | –0.001 | 0.407 | |
| Insecta | 1.085 | –0.002 | 0.411 | –3.703 | 0.005 | 0.204 | –1.241 * | 0.026 * | 0.018 | |
| Mammalia | 0.071 | –0.005 | 0.701 | 0.220 | –0.011 | 0.777 | –0.165 | 0.003 | 0.227 | |
| Mollusca | 3.504 | –0.032 | 0.698 | 3.504 | –0.032 | 0.698 | –1.488 | –0.032 | 0.699 | |
| TE content (log bp)~dN/dS | Overall Dataset | 0.798 | 0.004 | 0.062 | –0.216 | –0.002 | 0.899 | –0.903 * | 0.004 * | 0.050 |
| Actinopteri | 2.139 | 0.015 | 0.098 | 1.393 | –0.012 | 0.751 | 3.407 * | 0.046 * | 0.013 | |
| Aves | 0.340 | –0.002 | 0.513 | –1.492 | –0.004 | 0.551 | 2.285 | 0.006 | 0.129 | |
| Insecta | 1.744 | –0.004 | 0.528 | –3.096 | –0.007 | 0.602 | 0.063 | –0.007 | 0.960 | |
| Mammalia | 1.001 | 0.0027 | 0.238 | 1.023 | –0.012 | 0.691 | –2.113 ** | 0.063 ** | 0.001 | |
| Mollusca | 22.930 | 0.026 | 0.225 | 22.930 | 0.026 | 0.225 | 0.881 | –0.050 | 0.936 | |
| Recent TE content (log bp)~dN/dS | Overall Dataset | 1.963 ** | 0.012 ** | 0.003 | 0.691 | –0.002 | 0.727 | –1.225 | 0.0029 | 0.089 |
| Actinopteri | 2.271 | 0.013 | 0.113 | 1.241 | –0.012 | 0.793 | 4.365 ** | 0.061 ** | 0.005 | |
| Aves | 0.545 | –0.001 | 0.384 | –0.385 | –0.006 | 0.890 | 4.982 ** | 0.028 ** | 0.006 | |
| Insecta | 1.725 | –0.004 | 0.530 | –4.792 | –0.004 | 0.428 | 0.536 | –0.006 | 0.668 | |
| Mammalia | 4.115 * | 0.024 * | 0.031 | 3.192 | –0.006 | 0.460 | –3.151 * | 0.024 * | 0.032 | |
| Mollusca | 14.730 | –0.024 | 0.481 | 14.730 | –0.024 | 0.481 | 2.986 | –0.047 | 0.8026 | |
-
Table 3—source data 1
BUSCO Duplicated scores, genome sizes, body mass and longevity records, dN/dS estimations from Bio ++ and Coevol, overall and recent TE contents for the selected 807 species.
These are the original values used to infer PIC correlations.
- https://cdn.elifesciences.org/articles/100574/elife-100574-table3-data1-v1.xlsx
Table 4
Correlation coefficients (CC) and posterior probabilities (PP) estimated by Coevol with the GC3-poor and GC3-rich genesets for the coevolution of dN/dS with life history and genomic traits.
Different LHTs are shown according to availability for a clade. Posterior probabilities lower than 0.1 indicate significant negative correlations; posterior probabilities higher than 0.9 indicate significant positive correlations. Expected significant correlations of dN/dS with LHTs and genomic traits are marked in bold black; significant correlations opposite to the expected trend are marked in bold red. The original LHTs values used as input for Coevol are the same as those reported in Table 2—source data 1.
| Coevol correlations | Actinopteri dN/dS | Aves dN/dS | Insecta dN/dS | Mammalia dN/dS | Mollusca dN/dS | |||||||||||||||
|---|---|---|---|---|---|---|---|---|---|---|---|---|---|---|---|---|---|---|---|---|
| GC3-poor | GC3-rich | GC3-poor | GC3-rich | GC3-poor | GC3-rich | GC3-poor | GC3-rich | GC3-poor | GC3-rich | |||||||||||
| CC | PP | CC | PP | CC | PP | CC | PP | CC | PP | CC | PP | CC | PP | CC | PP | CC | PP | CC | PP | |
| Body length (cm) | 0.246 | 0.92 | 0.289 | 0.97 | 0.371 | 1 | 0.271 | 0.99 | ||||||||||||
| Basal metabolic rate (ml/O₂/hour)* | -0.258 | 0.02 | -0.337 | 0.01 | ||||||||||||||||
| Age at first birth (days) | 0.428 | 1 | 0.384 | 1 | ||||||||||||||||
| Population density (individuals/km²) | -0.361 | 0.001 | -0.188 | 0.09 | ||||||||||||||||
| Maximum longevity (years) | 0.435 | 0.97 | 0.330 | 0.95 | 0.303 | 0.92 | 0.109 | 0.75 | 0.0984 | 0.62 | 0.157 | 0.67 | 0.295 | 0.99 | 0.376 | 1 | ||||
| Mass (g) | 0.223 | 0.89 | 0.308 | 0.97 | 0.096 | 0.84 | 0.155 | 0.95 | 0.0243 | 0.52 | 0.221 | 0.76 | 0.412 | 1 | 0.316 | 1 | ||||
| Metabolic rate (Watt)† | 0.030 | 0.57 | -0.244 | 0.07 | 0.201 | 0.78 | -0.038 | 0.45 | -0.283 | 0.02 | -0.377 | 0.003 | ||||||||
| Sexual maturity (days) | 0.320 | 0.91 | 0.286 | 0.88 | 0.032 | 0.58 | 0.284 | 0.99 | -0.244 | 0.19 | 0.072 | 0.58 | 0.468 | 1 | 0.329 | 1 | ||||
| Depth range | 0.388 | 0.93 | 0.584 | 1 | ||||||||||||||||
| Genome size (bp) | 0.034 | 0.59 | -0.027 | 0.42 | 0.054 | 0.69 | 0.072 | 0.77 | -0.330 | 0.03 | -0.110 | 0.24 | -0.041 | 0.35 | -0.140 | 0.12 | 0.142 | 0.65 | 0.306 | 0.82 |
| Overall TE content (bp) | 0.192 | 0.88 | 0.167 | 0.84 | 0.065 | 0.73 | -0.195 | 0.03 | -0.203 | 0.16 | -0.017 | 0.45 | -0.220 | 0.08 | -0.249 | 0.06 | -0.119 | 0.39 | -0.021 | 0.47 |
| Recent TE content (bp) | 0.205 | 0.89 | 0.258 | 0.95 | 0.109 | 0.83 | -0.240 | 0.01 | -0.136 | 0.25 | 0.049 | 0.63 | -0.119 | 0.23 | -0.296 | 0.06 | -0.172 | 0.34 | -0.004 | 0.50 |
-
*
PanTHERIA.
-
†
AnAge.
Additional files
-
Supplementary file 1
Metadata, assembly metrics, BUSCO scores and genome sizes for the initial 3214 species.
C-values and expected C-values are reported only for species with Quast_ContigN50≥50 kb. Method and Notes_cvalue_method report the method used for genome size measurement (FCM = Flow Cytometry, FD = Feulgen Densitometry, FIA = Feulgen Image Analysis) and how C-value was chosen from https://www.genomesize.com/, respectively. Expected C-values are the C-values predicted from the WLS trained on the dataset in Figure 2—source data 1. C-values are employed as genome size for the species with a record in the Genome Size database, while the expected C-values are used for the species without a record.
- https://cdn.elifesciences.org/articles/100574/elife-100574-supp1-v1.xlsx
-
Supplementary file 2
BUSCO genes used to calculate the clade phylogenies and the branch lengths of the whole tree.
- https://cdn.elifesciences.org/articles/100574/elife-100574-supp2-v1.xlsx
-
MDAR checklist
- https://cdn.elifesciences.org/articles/100574/elife-100574-mdarchecklist1-v1.docx
Download links
A two-part list of links to download the article, or parts of the article, in various formats.
Downloads (link to download the article as PDF)
Open citations (links to open the citations from this article in various online reference manager services)
Cite this article (links to download the citations from this article in formats compatible with various reference manager tools)
Effective population size does not explain long-term variation in genome size and transposable element content in animals
eLife 13:RP100574.
https://doi.org/10.7554/eLife.100574.3


