Single-cell RNA sequencing of the holothurian regenerating intestine reveals the pluripotency of the coelomic epithelium
- Department of Biology, University of Puerto Rico, Puerto Rico
Figures
Figure 1 with 3 supplements
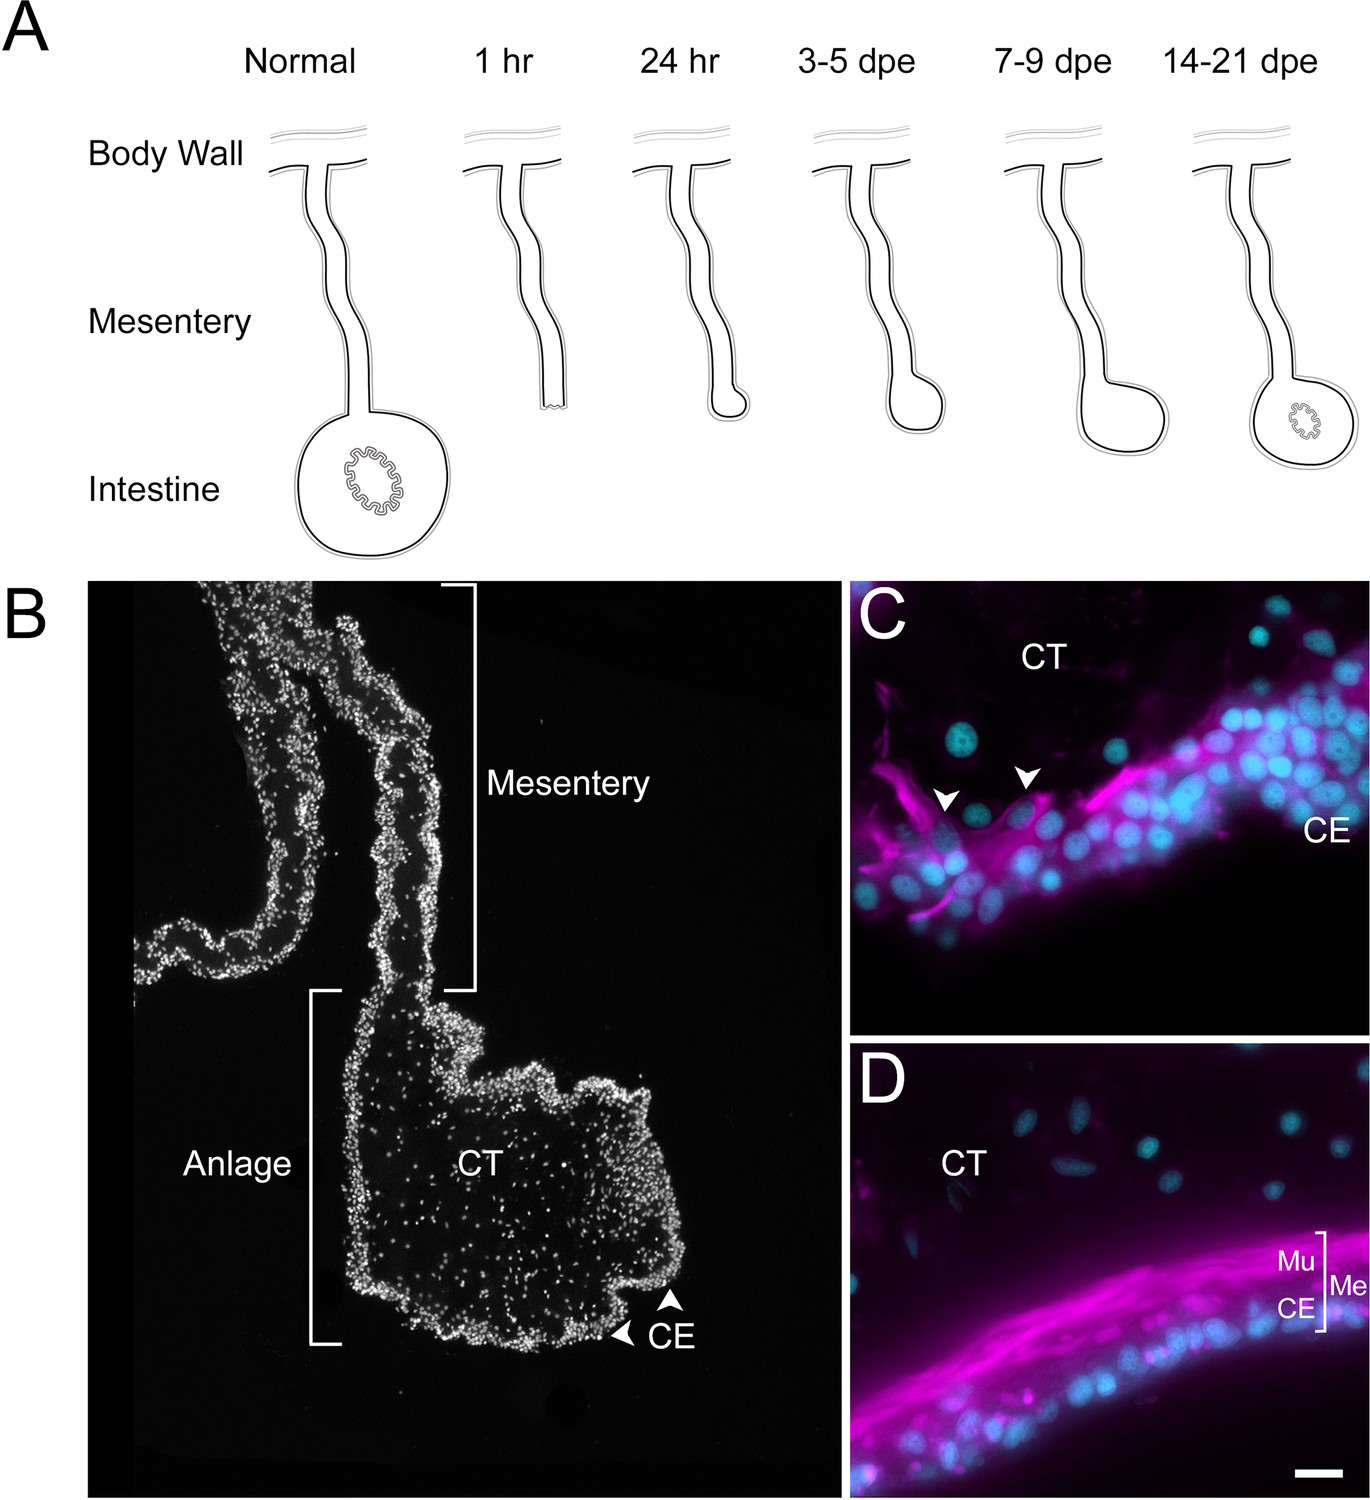
Intestinal regeneration in H. glaberrima.
(A) Schematic view of normal and regenerating tissues as viewed in cross sections of normal and regenerating intestines. After evisceration (1 hr), the tip of the mesentery is torn but eventually is covered by CE (24 hr). A thickening of the mesentery tip forms the intestinal anlage, which grows in size for the next 2 weeks, initially (3–5 dpe) by cellular dedifferentiation and later by cellular proliferation (7–9 dpe). Eventually, the luminal epithelium is formed from migrating cells of the esophagus and cloacal ends of the digestive tract. (B) DAPI-stained section of 9-dpe anlage and mesentery showing the CE and CT layers. (C, D) Sections with fluorescently labeled phalloidin show the muscle (Mu) labeled in the (C) 9-dpe anlage and in the (D) normal intestine. The normal intestine is made of three distinct layers: mesothelium (Me) (that includes the CE and Mu), CT, and luminal epithelium (not shown). Me and CT are continuous throughout the mesentery and body wall. CE, coelomic epithelium; CT, connective tissue; Me, mesothelium; Mu, muscle; dpe, days post evisceration. Bar = 10 µm.
-
Figure 1—source data 1
Antibody/markers used for immune- and cytochemical labeling of dissociated cell suspension.
- https://cdn.elifesciences.org/articles/100796/elife-100796-fig1-data1-v1.xlsx
Figure 1—figure supplement 1
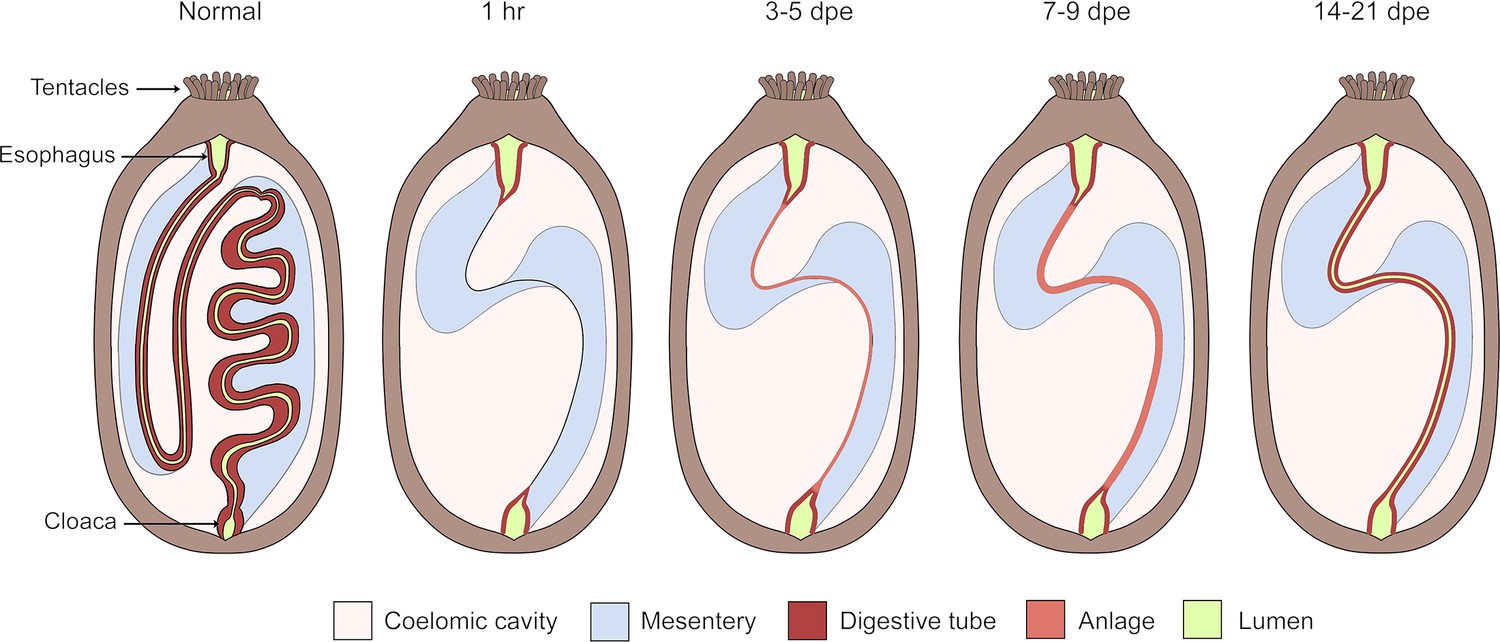
Overview of the intestinal regeneration process in the sea cucumber H. glaberrima.
The non-eviscerated (normal) digestive tract is shown as a continuous tube beginning at the mouth, followed by an esophagus, which is continuous with the intestine ending in the cloaca. This digestive tract is attached to a mesentery (light blue), which attaches the digestive tract to the body wall. Following evisceration, the tip of the mesentery begins to heal by 24 hr. After 3 days post evisceration (dpe), the anlage (salmon) begins to form at the free tip of the mesentery and continues growing in the following days. Once the anlage is formed, the lumen develops at around 14-dpe. By 21 dpe, the full formed gut lumen (green) can be traced from the esophagus to the cloaca.
Figure 1—figure supplement 2
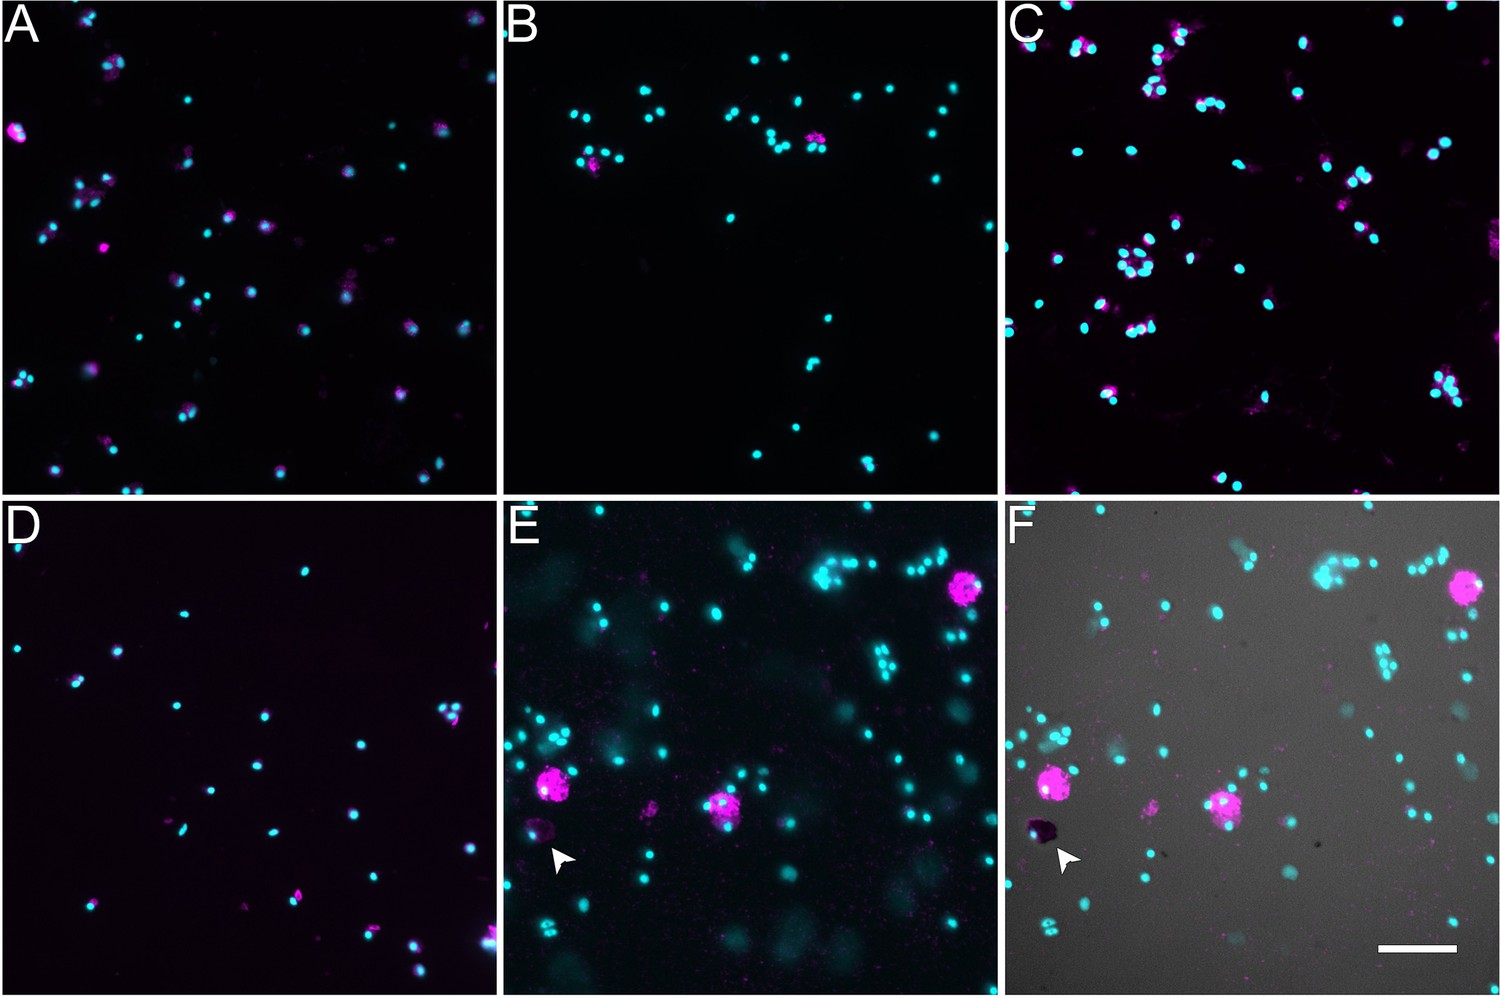
Labeling of dissociated cell phenotypes with cell markers.
Immunocytochemistry, fluorescently labeled phalloidin, and toluidine blue were used to identify various cell populations among the cells dissociated from the mesentery and anlage sample. These include (A) a mesenchymal marker (KL4), (B) a neuronal marker (RN1), (C) a mesothelial marker (Meso1), (D) a muscle marker (Phalloidin), and (E, F) two coelomocyte markers (the antibody SphAA12 and toluidine blue). (E) Immunocytochemistry using the SphAA12 antibody. (F) Overlay of (E) (UV light) with classical histochemical stain toluidine blue (visible light) identifies a different coelomocyte population (see dark cell on lower left, labeled with arrowhead). Cyan, DAPI; magenta, antibody or phalloidin marker. Bar = 20 um.
Figure 1—figure supplement 3
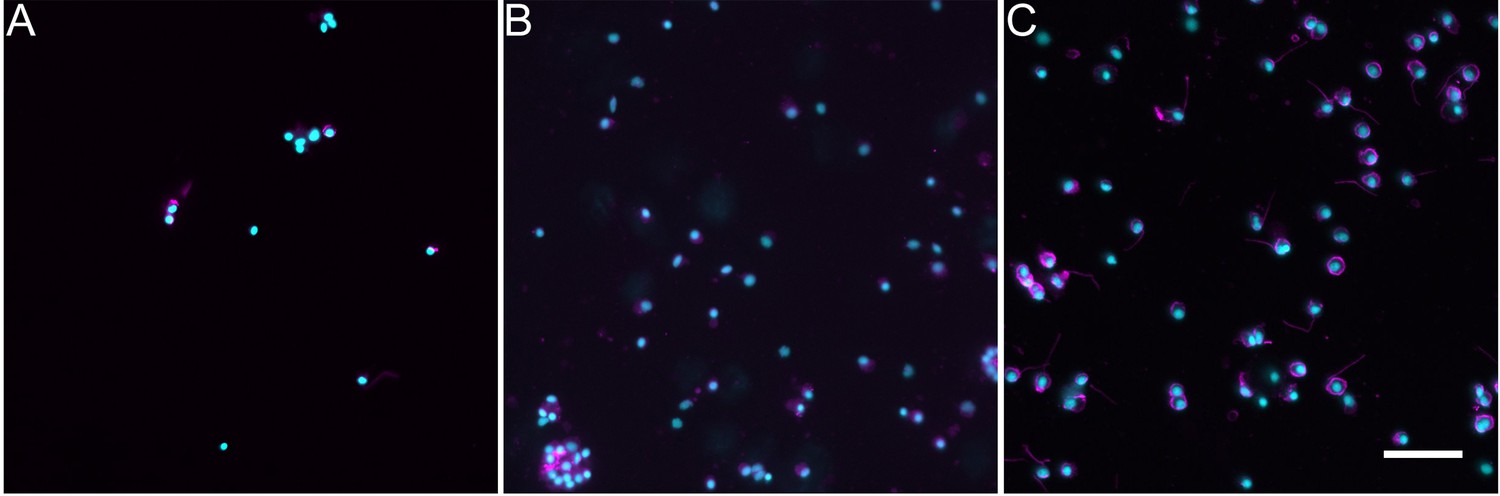
Immunocytochemical labeling of dissociated cell phenotypes using three different antibodies against tubulin.
(A) Anti-acetylated tubulin labels around 7% of the cells. (B) Anti-beta-tubulin labels around 70% of the cells. (C) Anti-alpha tubulin labels around 80% of the cells. Cyan, DAPI; magenta, antibody or phalloidin marker. Bar = 20 um.
Figure 2 with 3 supplements
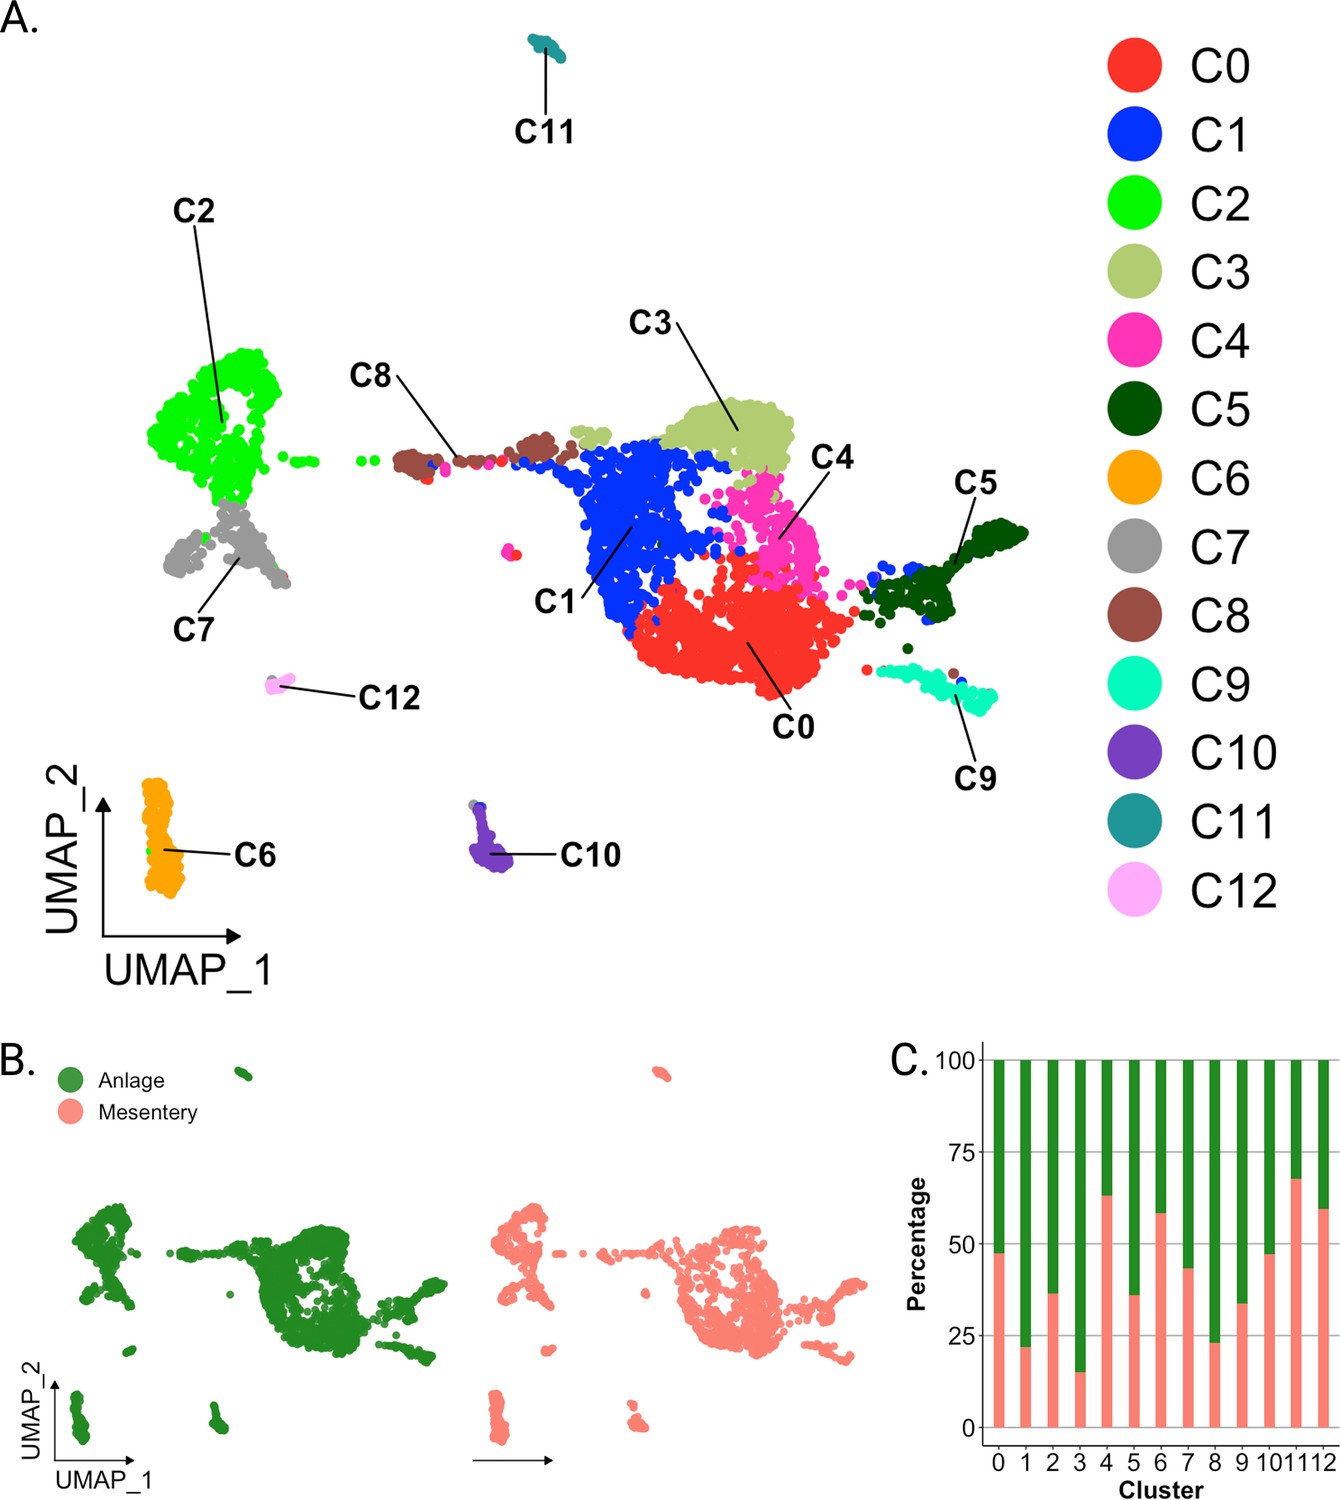
Overview of single-cell RNA sequencing of regenerating intestinal tissue of H. glaberrima.
(A) UMAP plot of population identities determined through unsupervised clustering of 9-day regenerating mesentery and anlage tissues. (B) UMAP projections of cluster cells separated by tissue of origin. (C) Percentage of cells per cluster based on their tissue of origin.
-
Figure 2—source data 1
General statistics of scRNA-seq data after mapping with Cell Ranger.
- https://cdn.elifesciences.org/articles/100796/elife-100796-fig2-data1-v1.xlsx
Figure 2—figure supplement 1
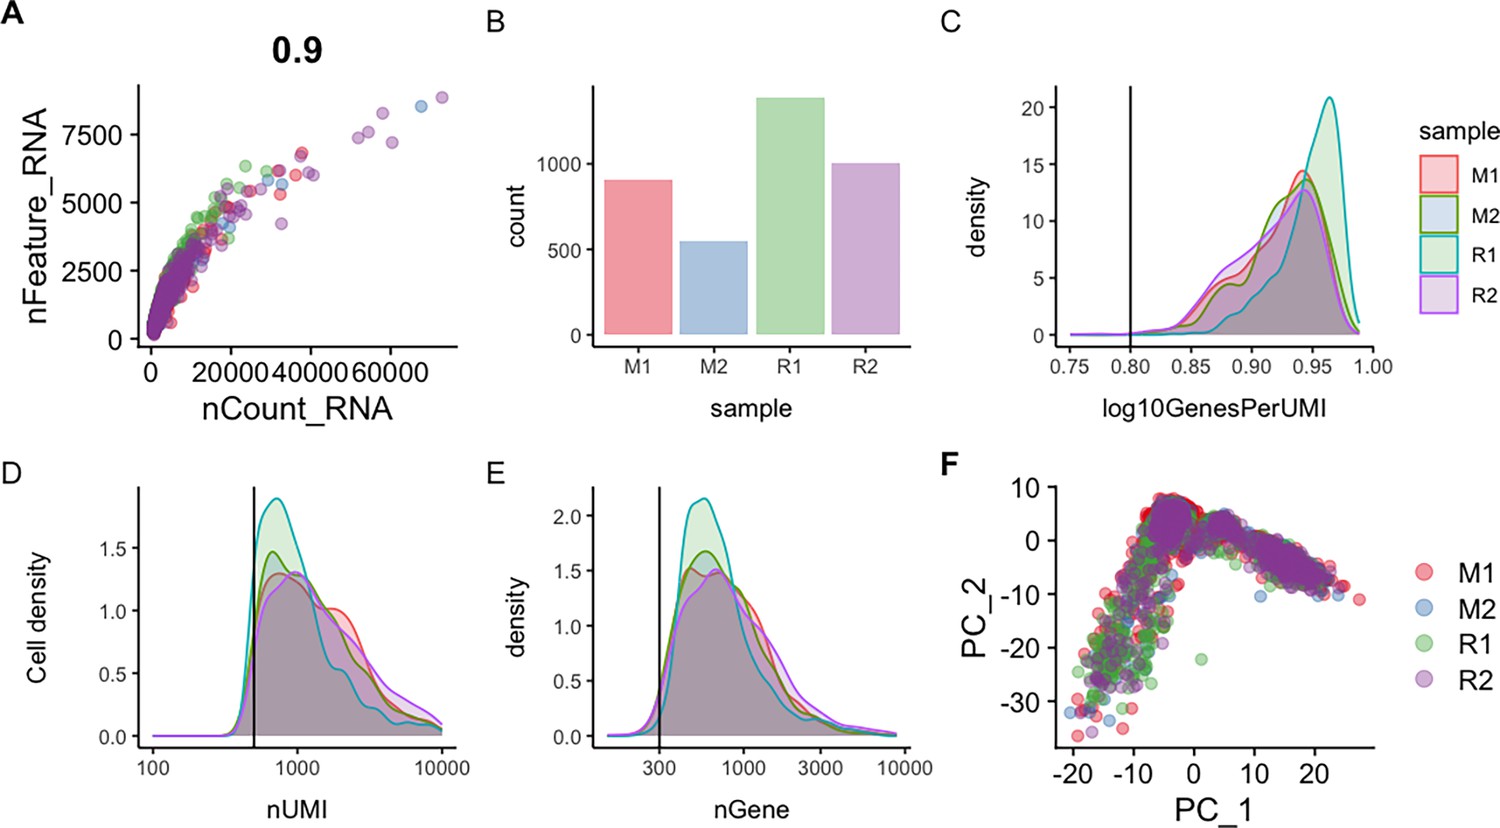
Quality control assessment of H. glaberrima scRNA-seq data.
(A) Scatter plot of the correlation of unique genes detected per cell (nFeature_RNA) versus the total number of transcripts (nCount_RNA). Each point in the plot represents a single cell. (B) Bar plot displaying the total number of cells per sample. (C) Density plot of log-transformed genes per UMI (log10GenesPerUMI) showing the sequencing complexity across sample. (D) Density plot of the total number of UMIs (nUMI) per cell showing the distribution of UMI across the four samples. (E) Density plot of the total number of detected genes (nGenes) per cell. Vertical lines in plot (C–E) represents the minimum threshold cut-off of expected values for each component. (F) Principal component analysis (PCA) plot of the scRNA-seq data after data filtering and integration. M1 and M2 represent mesentery replicates in red and blue, respectively. R1 and R2 represent rudiment/anlage replicates in green and purple, respectively.
Figure 2—figure supplement 2
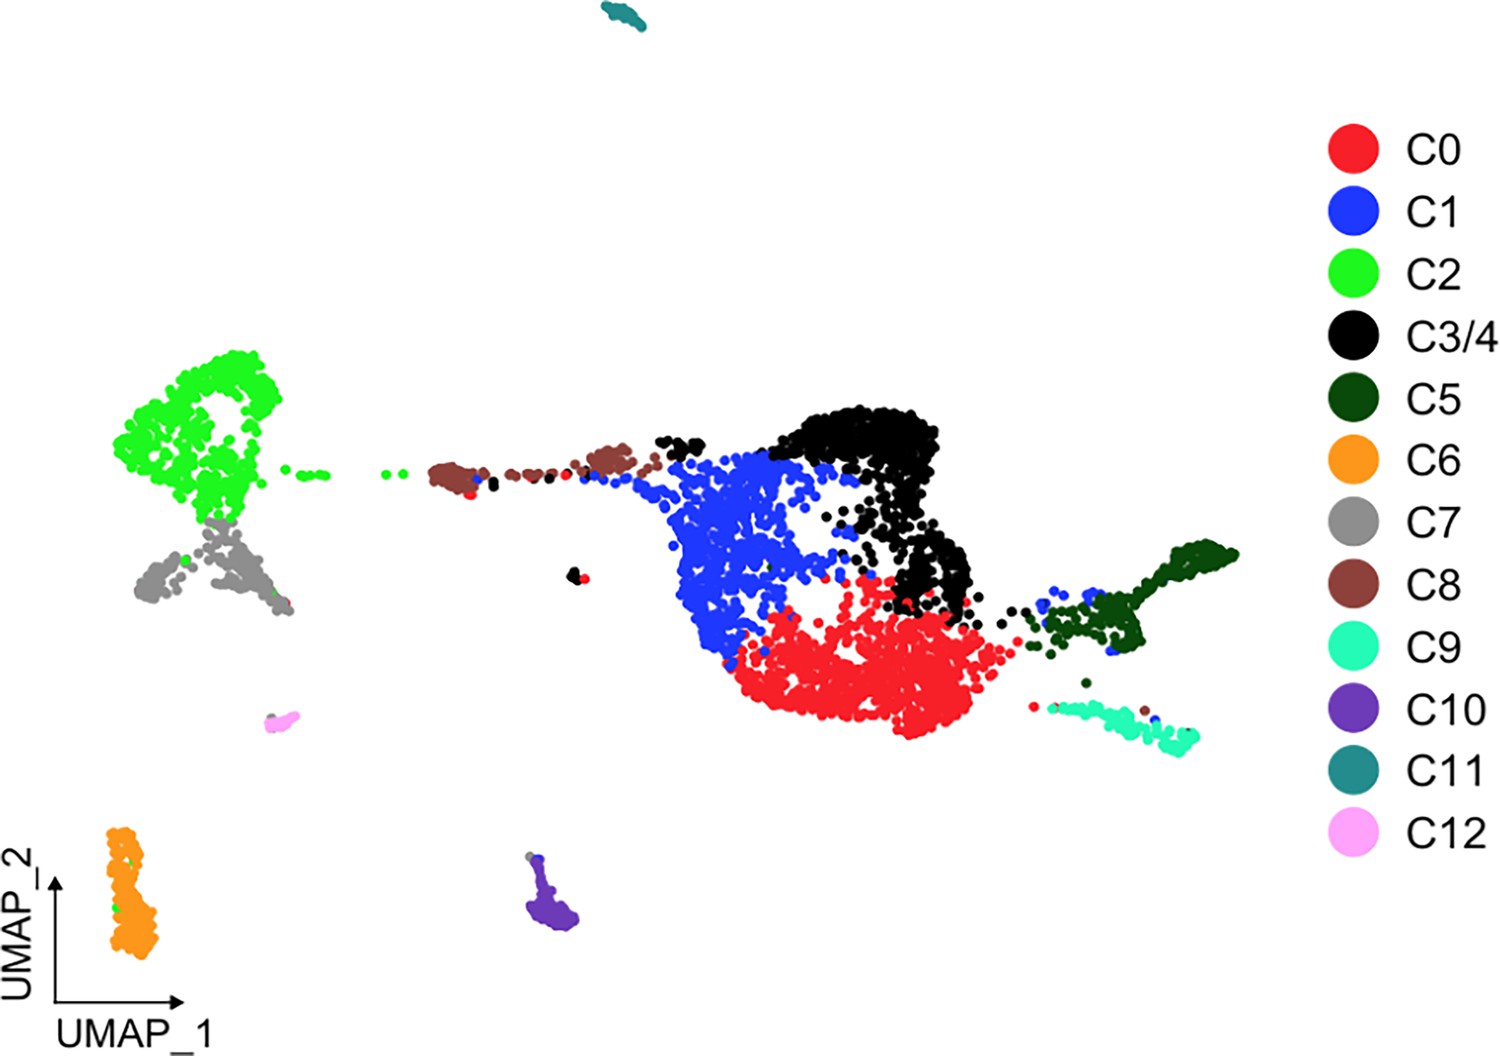
UMAP of clusters after statistical assessment with scSHC.
Results reflect that each of the identified clusters are unique, except for C3 and C4, which it suggests they correspond to a single cluster. All clusters, except for C3/4 (black), are colored as in Figure 1B.
Figure 2—figure supplement 3
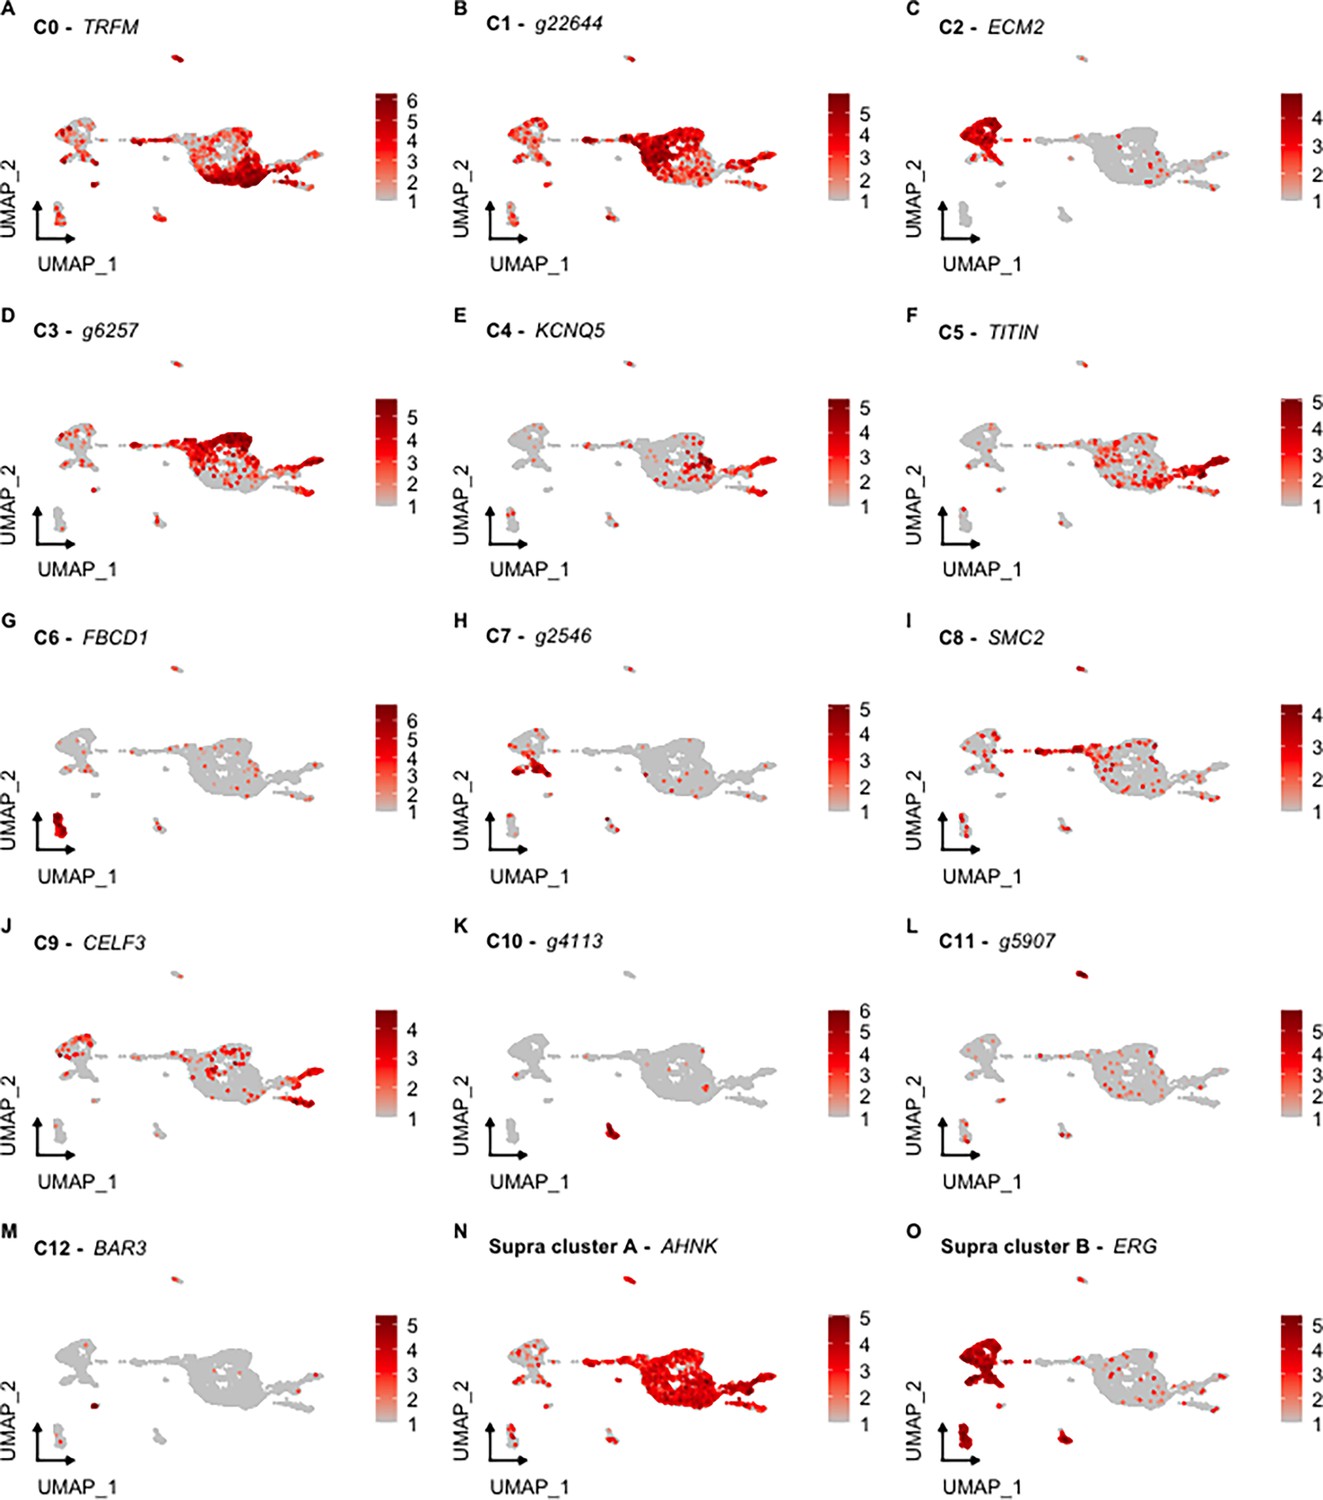
UMAP visualization of clusters highlighting the expression of their top genes.
UMAPs A-M represent the 13 cell populations described in the text, while N and O describe the epithelial and mesenchymal supraclusters, respectively. Each gene corresponds to the top gene of each independent cluster based on the percentage of representation of other clusters. Gene identifiers starting with ‘g’ correspond to uncharacterized gene models of H. glaberrima.
Figure 3 with 3 supplements
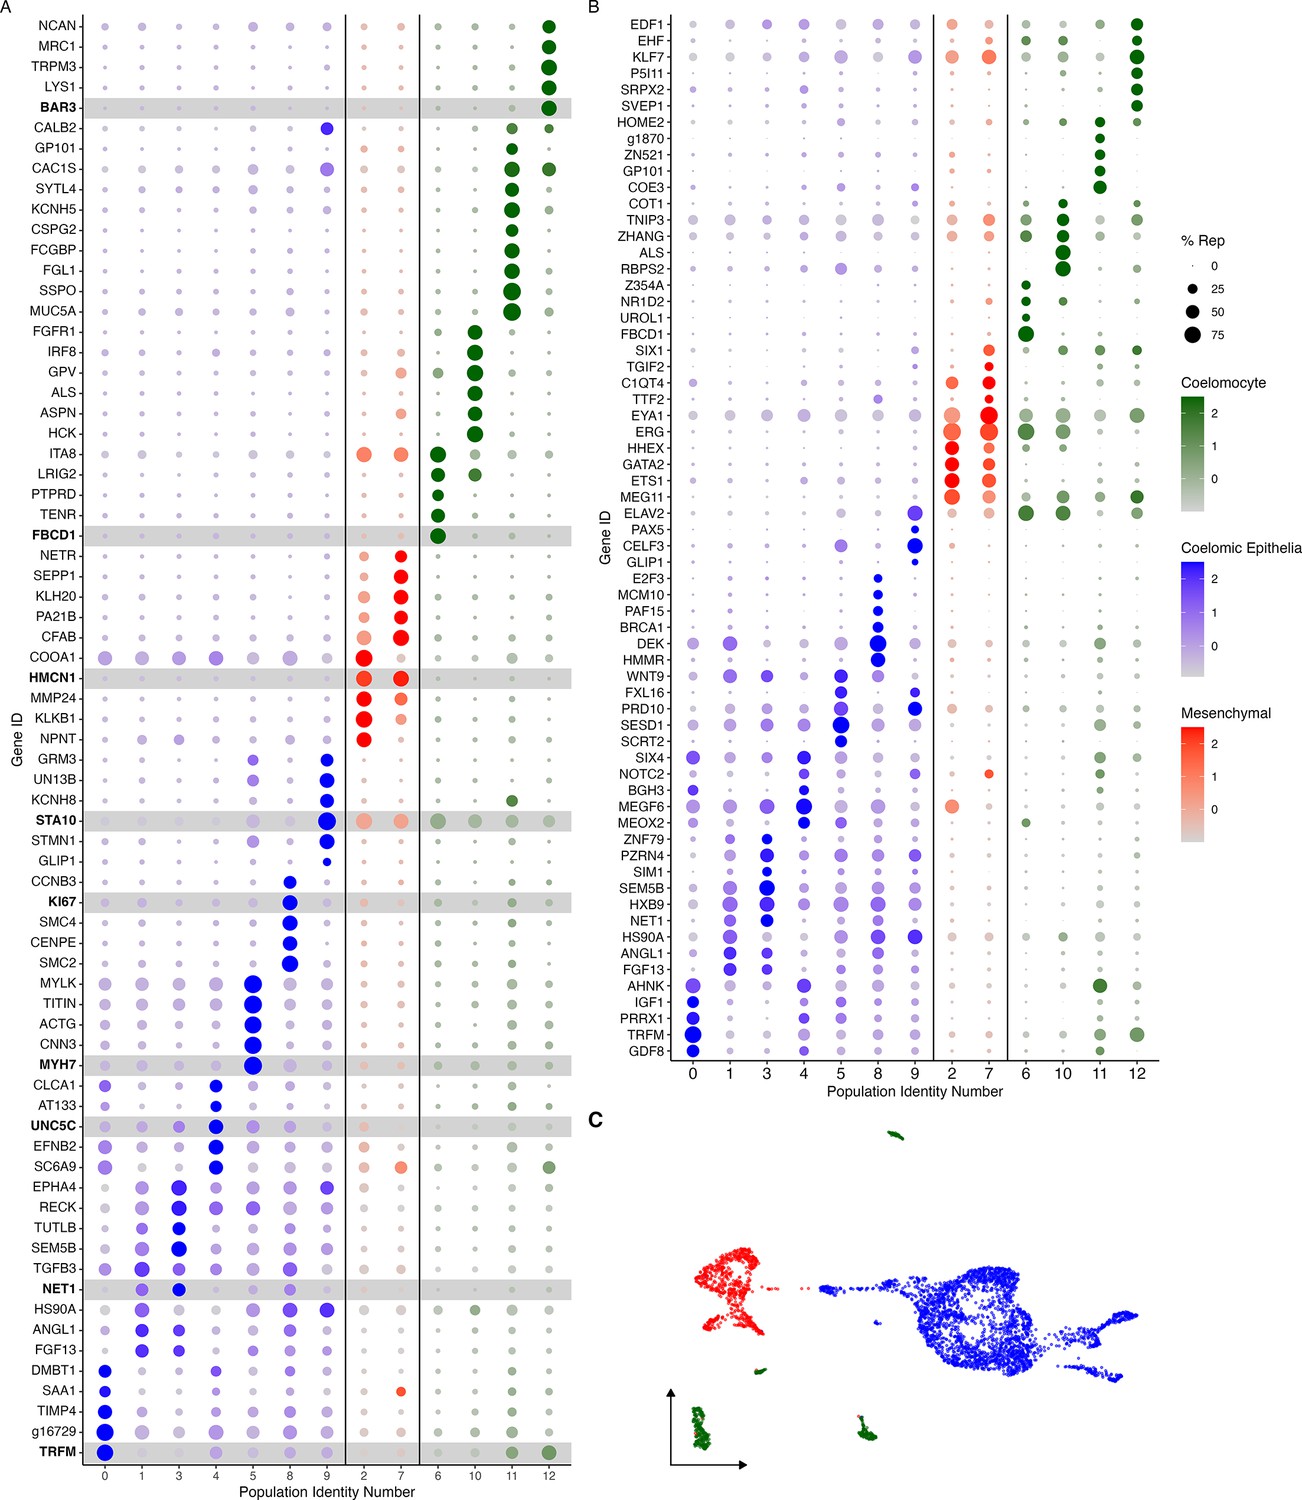
Cluster characterization by gene expression.
(A) Top-expressed genes or (B) genes corresponding to transcription factors and intercellular signaling molecules are identified in the 13 cell clusters. Clusters are classified by their corresponding cell type, where blue corresponds to cells of the coelomic epithelium, red to those in the mesenchyme and green to coelomocytes. Color intensity shows the expression level of each gene in log2fold-change (log2FC) values. Dot size corresponds to percentage of representation of the gene in the respective cluster compared to all others. Gene identifiers starting with ‘g’ correspond to uncharacterized gene models of H. glaberrima. (C) UMAP plot of clusters colored by cell type.
Figure 3—figure supplement 1
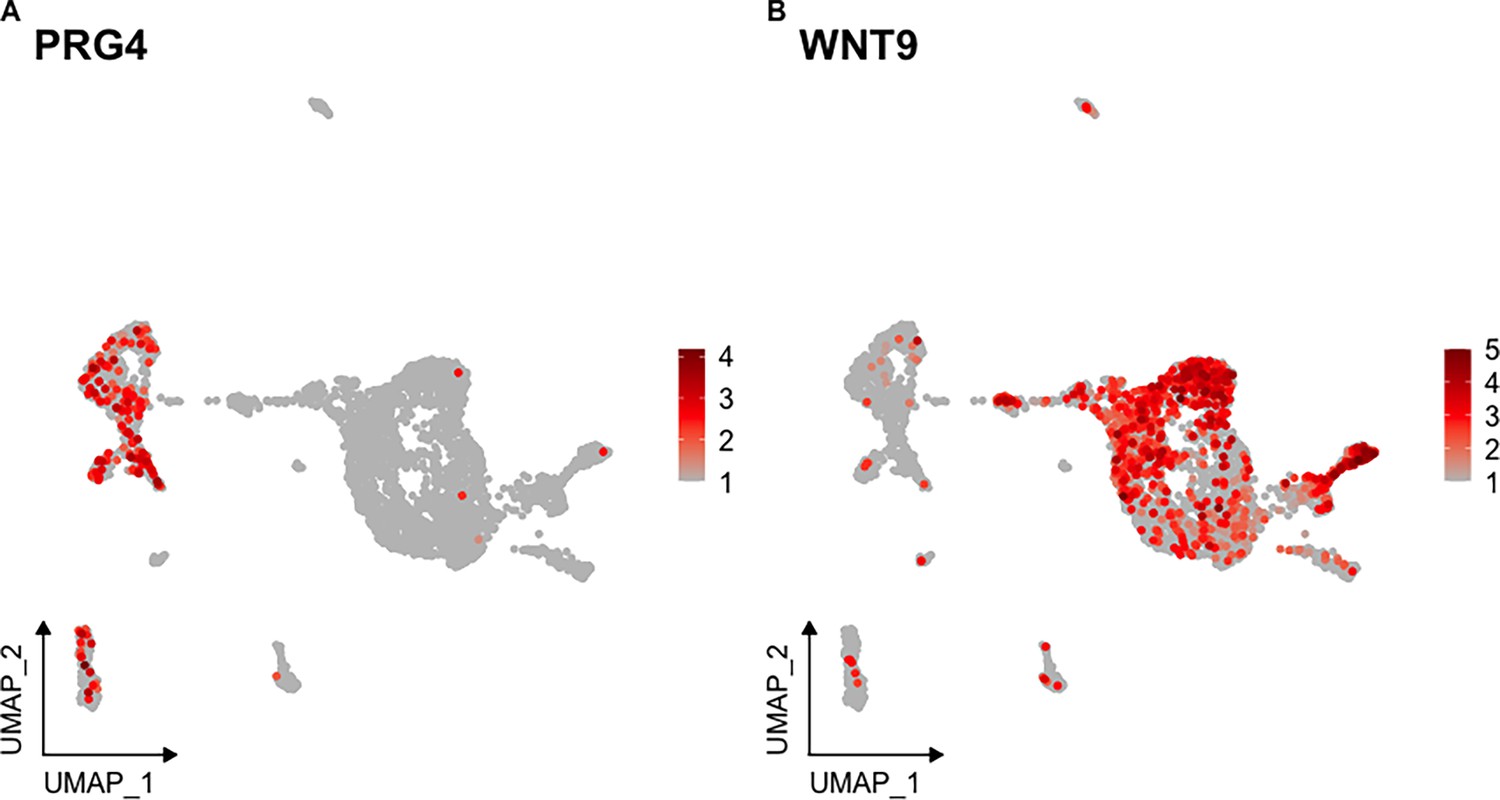
Expression of marker genes previously documented in the sea cucumber.
(A–B) UMAP highlighting the cells expressing (A) Proteoglycan-4 and (B) Wnt9.
Figure 3—figure supplement 2
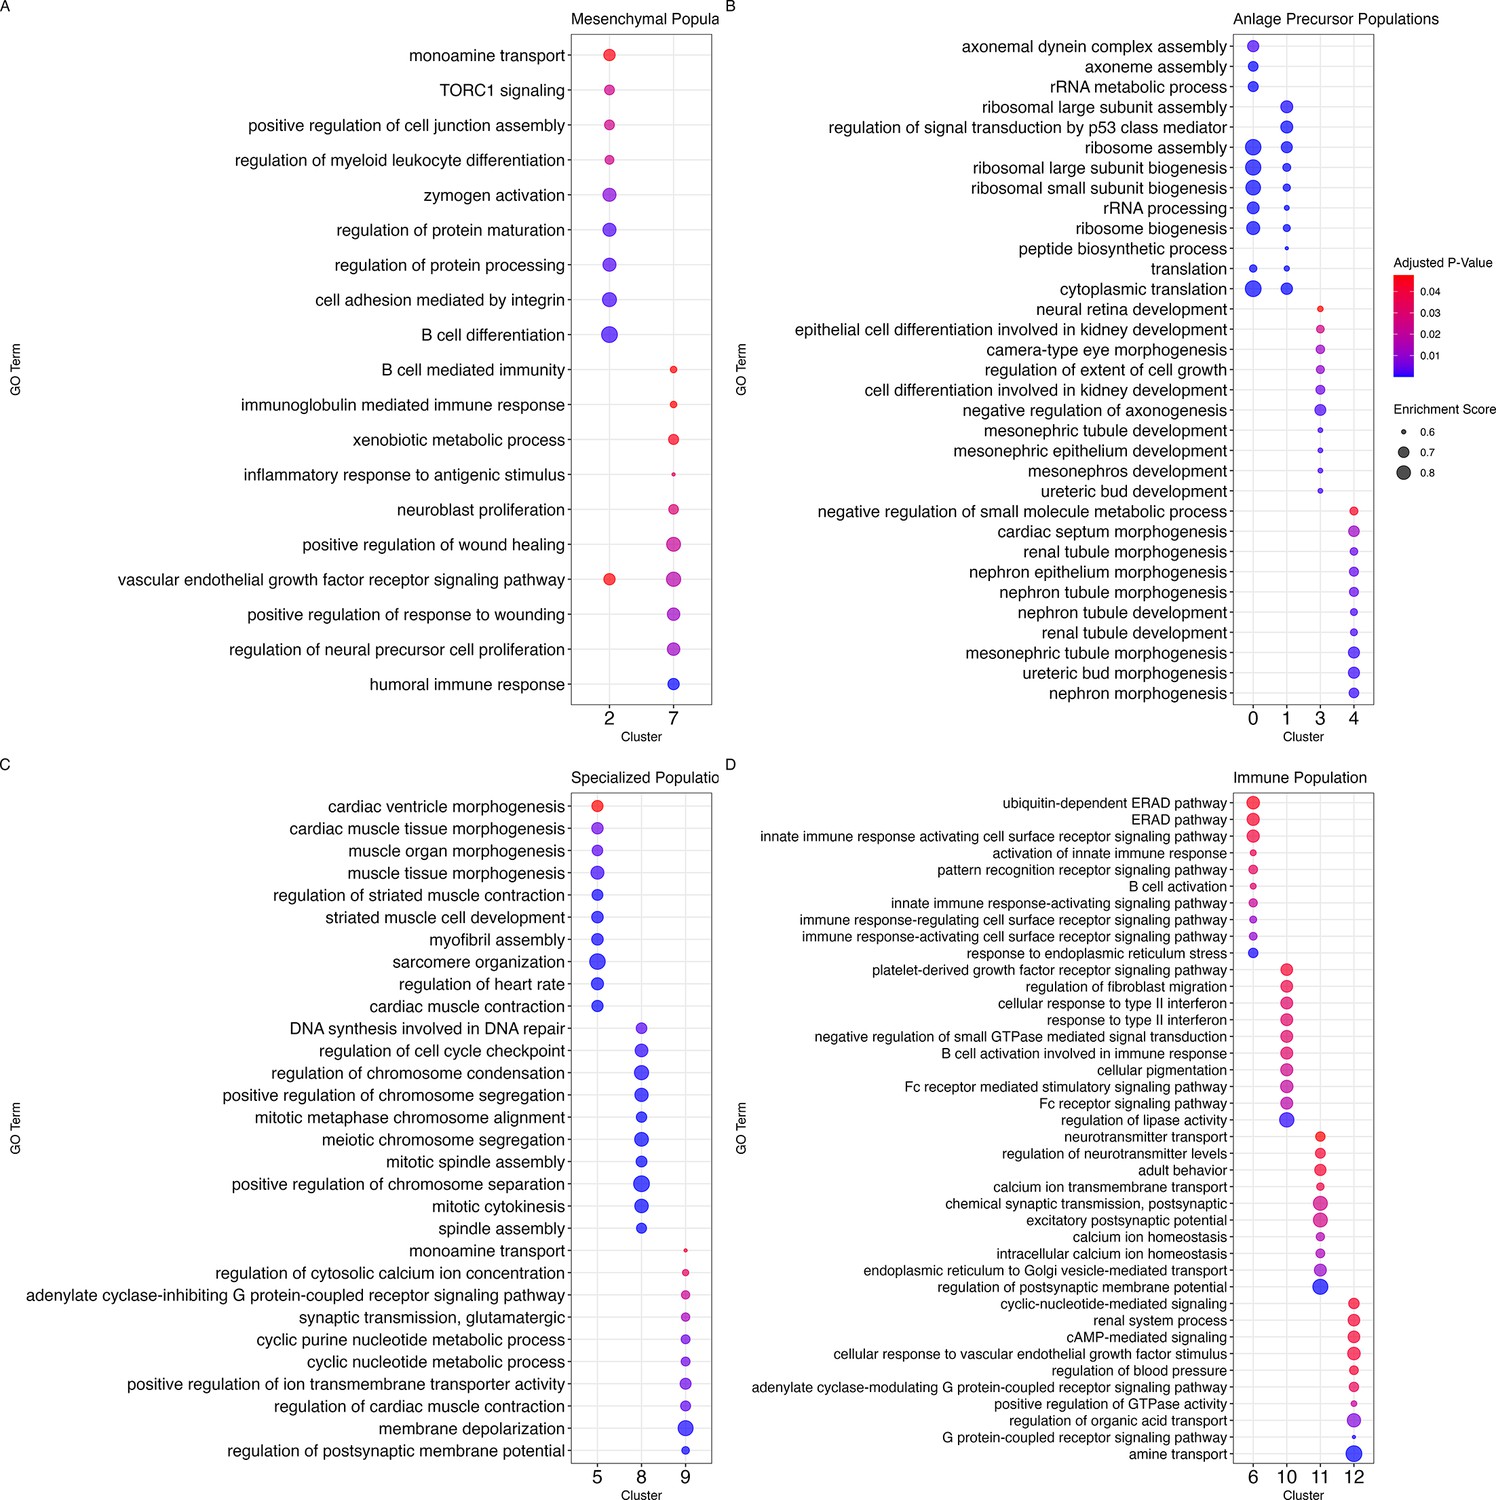
Enrichment of GO terms across cellular populations of the regenerative intestine of H. glaberrima.
Top GO enriched terms of biological processes for (A) mesenchymal populations C2 and C7; (B) anlage precursor populations C0, C1, C3, and C4; (C) specialized cell populations C5, C8, C9; and (D) immune populations C6, C10, C11, C12. Dot size corresponds to the enrichment score while the color reflects the adjusted p-value.
Figure 3—figure supplement 3
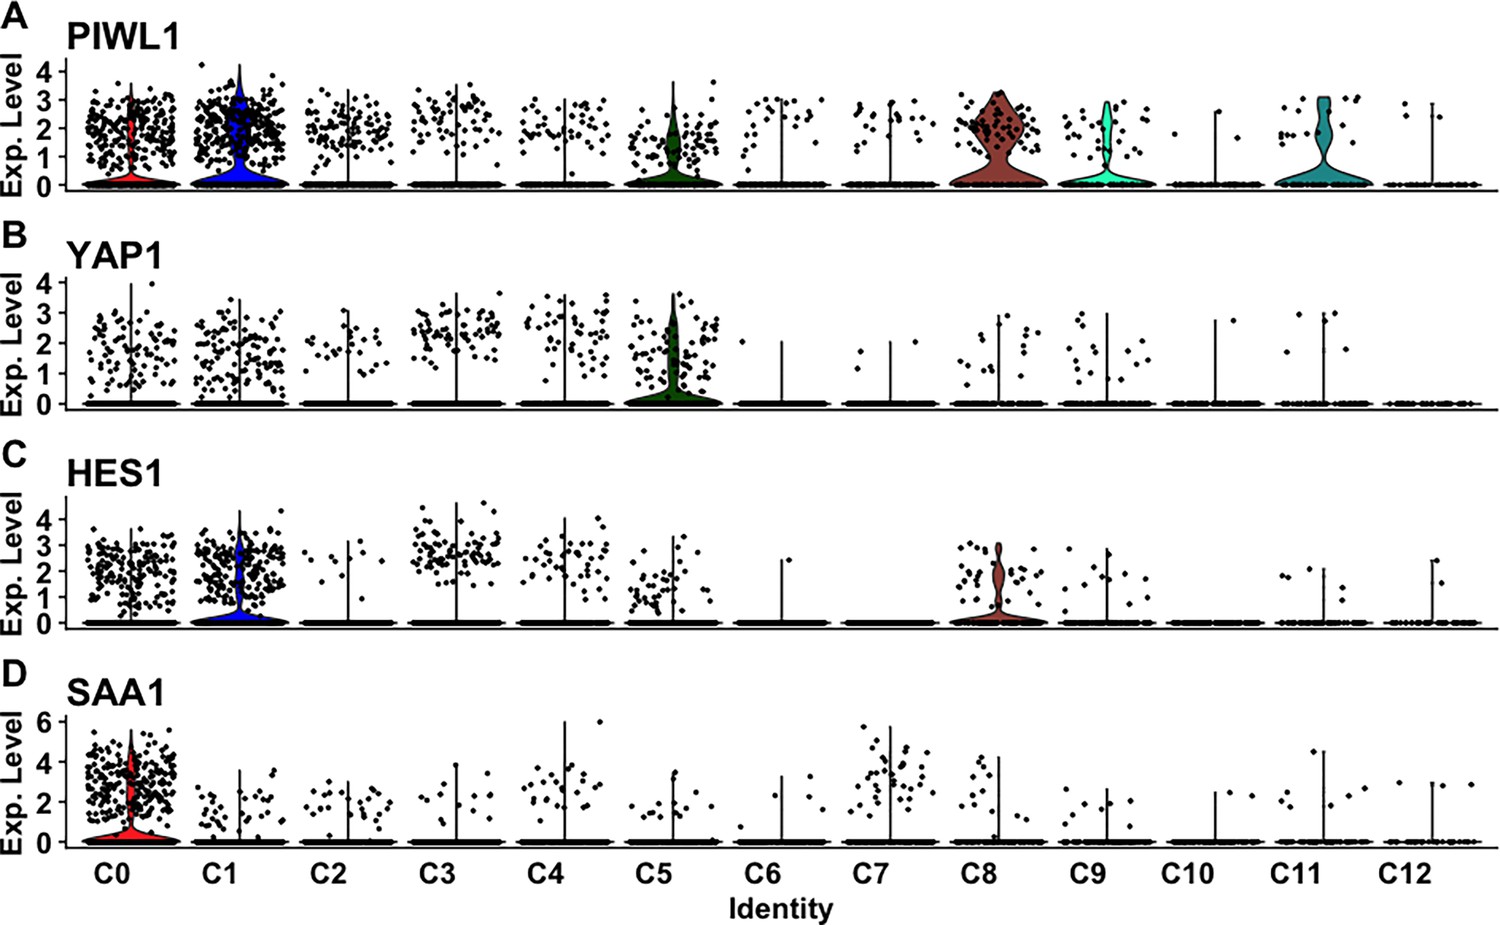
Expression of marker genes associated with cell types or state.
(A–D) Violin plot highlighting the level of expression of (A) PIWL1, (B) YAP1, (C) HES1, and (D) SAA1 across clusters.
Figure 4 with 2 supplements
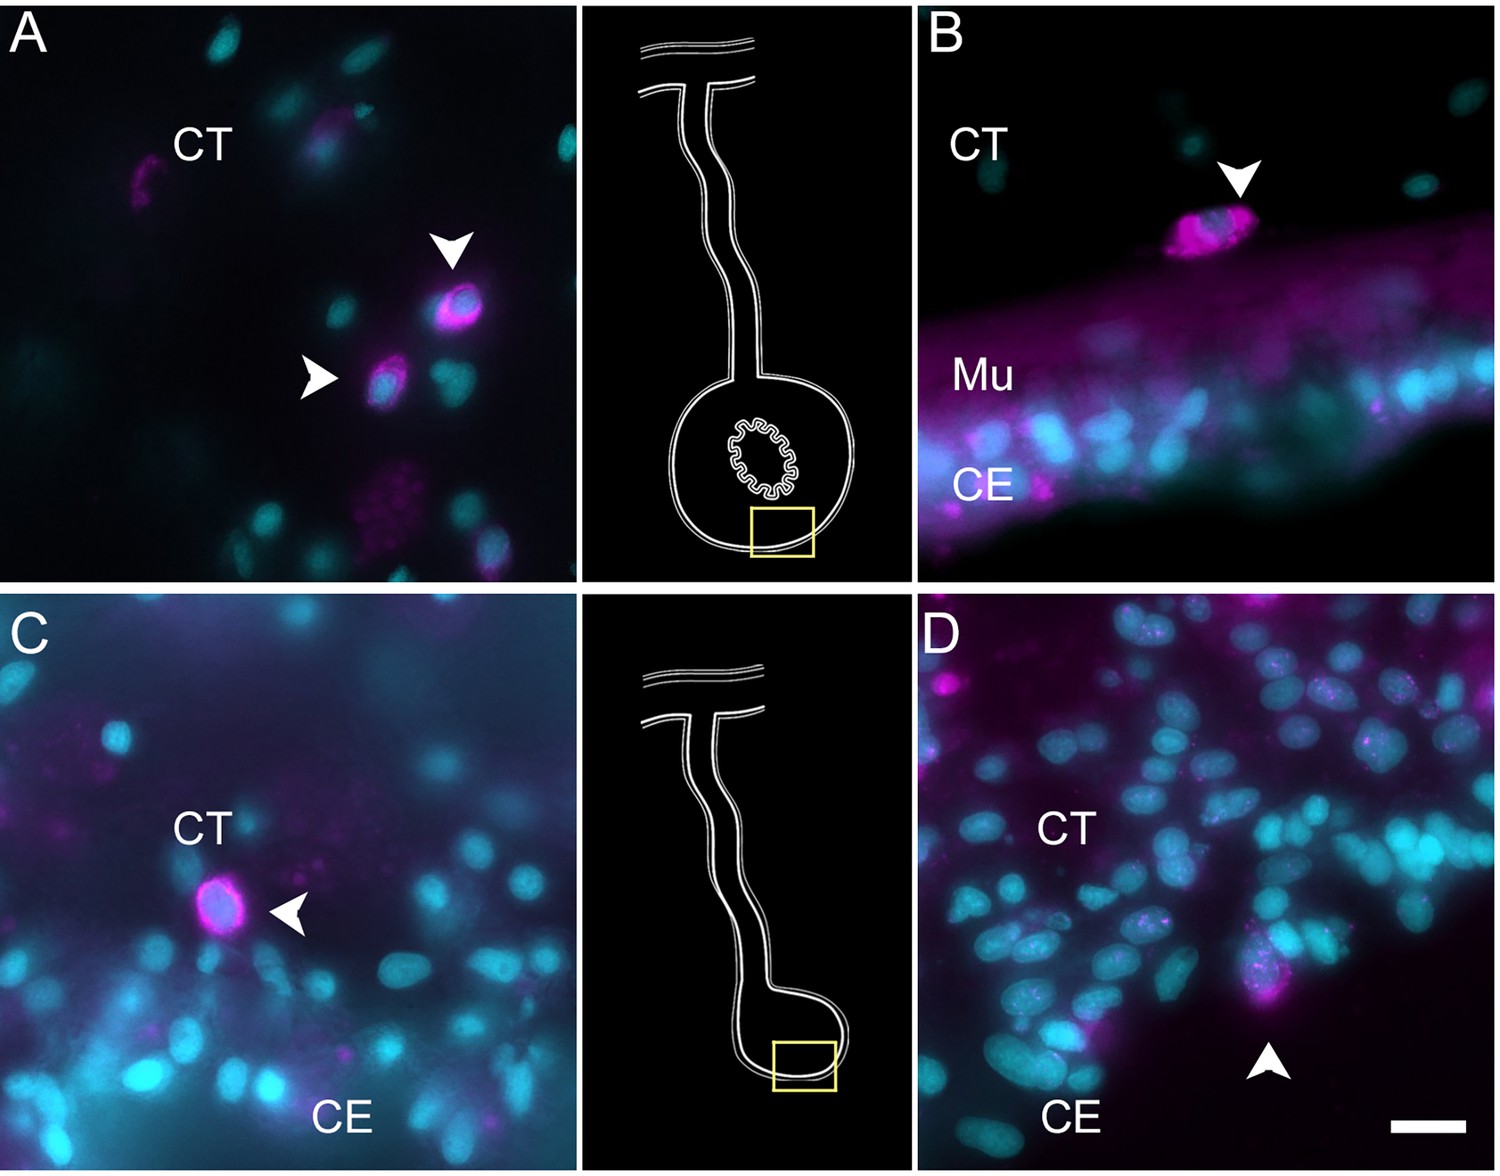
Expression profile of coelomocyte cell types.
Hybridization chain reaction fluorescent in situ hybridization (HCR-FISH) for (A, C) FBCD1 or (B, D) BAR3 in holothurian (A, B) normal or (C, D) regenerating tissues. Cells (arrowheads) expressing FBCD1 mRNA in the CT layer of (A) normal intestine and (C) anlage. Cells (arrowheads) expressing BAR3 mRNA in the CT of (B) normal (non-eviscerated) animal and (D) the CE (CE) of the anlage. Insets provide the approximate localization in the CT of the normal intestine (top) and the anlage (bottom). Cyan, DAPI; magenta, HCR-FISH; CE, coelomic epithelium; CT, connective tissue; Mu, muscle. Bar = 10 µm.
Figure 4—figure supplement 1
Hybridization chain reaction fluorescent in situ hybridization (HCR-FISH) for Poly-A mRNA as a positive control.
Labeling of Poly A-mRNA in the (A) normal intestine, (B) regenerating mesentery, and (C) anlage provides evidence for distinct labeling of cells in the CE and CT. Note that some cells express higher intensities of the marker, while others express scarce or no labeling. A particular example is observed in (C) the cells undergoing epithelial-mesenchymal transition in the anlage where little mRNA expression is observed. Insets provide the approximate localization of the cells in the adjacent photos. Cyan, DAPI; magenta, HCR-FISH; CE, coelomic epithelium; CT, connective tissue. Bar = 10 µm.
Figure 4—figure supplement 2
Hybridization chain reaction fluorescent in situ hybridization (HCR-FISH) negative control.
Treatment of tissue sections with only the fluorescent hairpins used for HCR-FISH shows little or no labeling in (A) normal intestine, (B) regenerating mesentery, and (C) anlage. Non-specific labeling is observed in some coelomocytes (arrowheads) found mainly in the CT and some associated with the CE. Insets provide the approximate localization of the cells in the adjacent photos. Cyan, DAPI; magenta, HCR-FISH; CE, coelomic epithelium; CT, connective tissue. Bar = 10 µm.
Figure 5
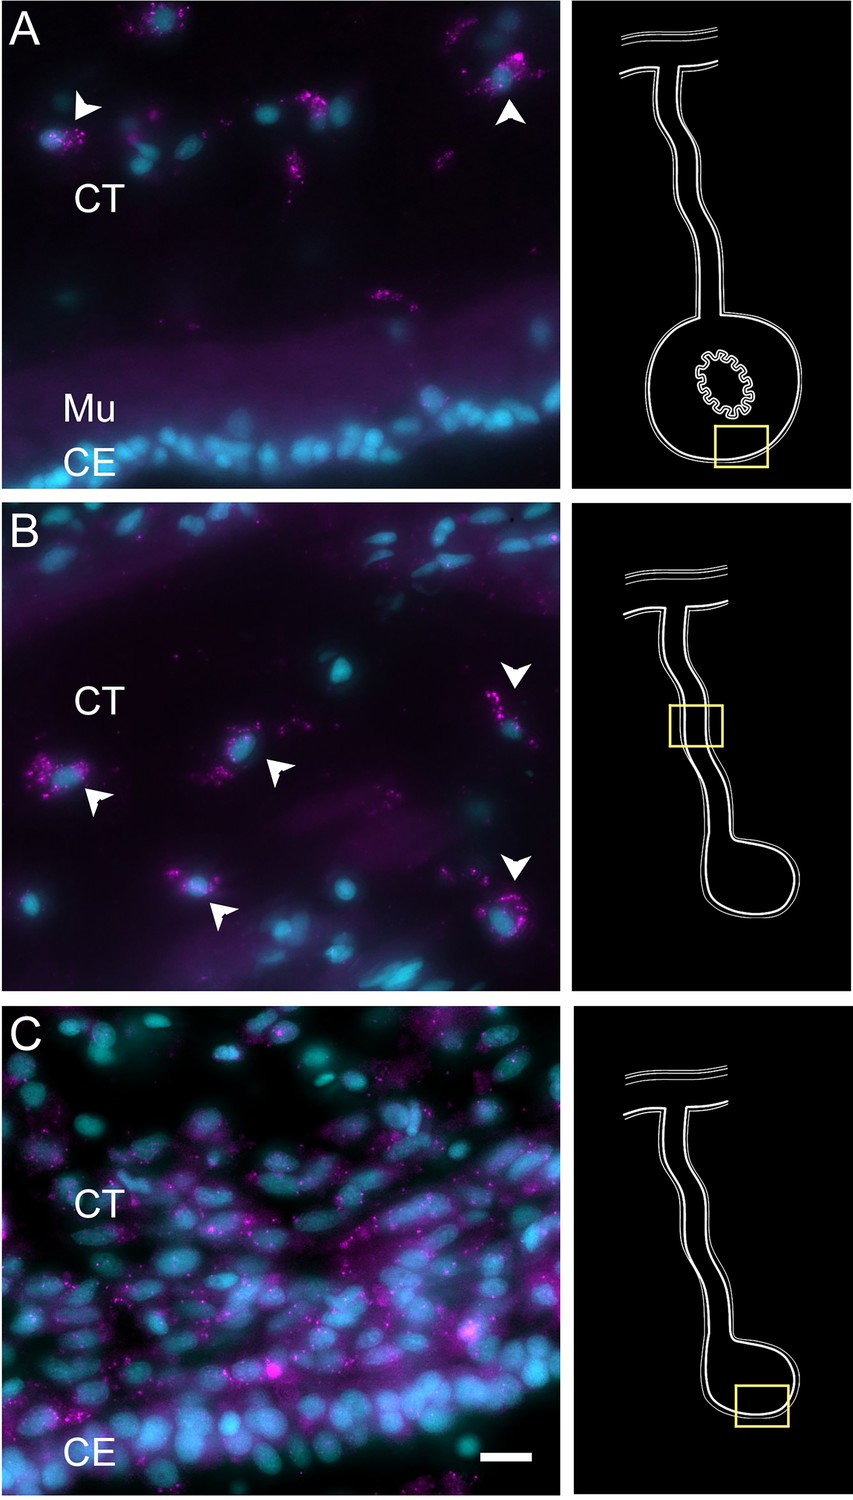
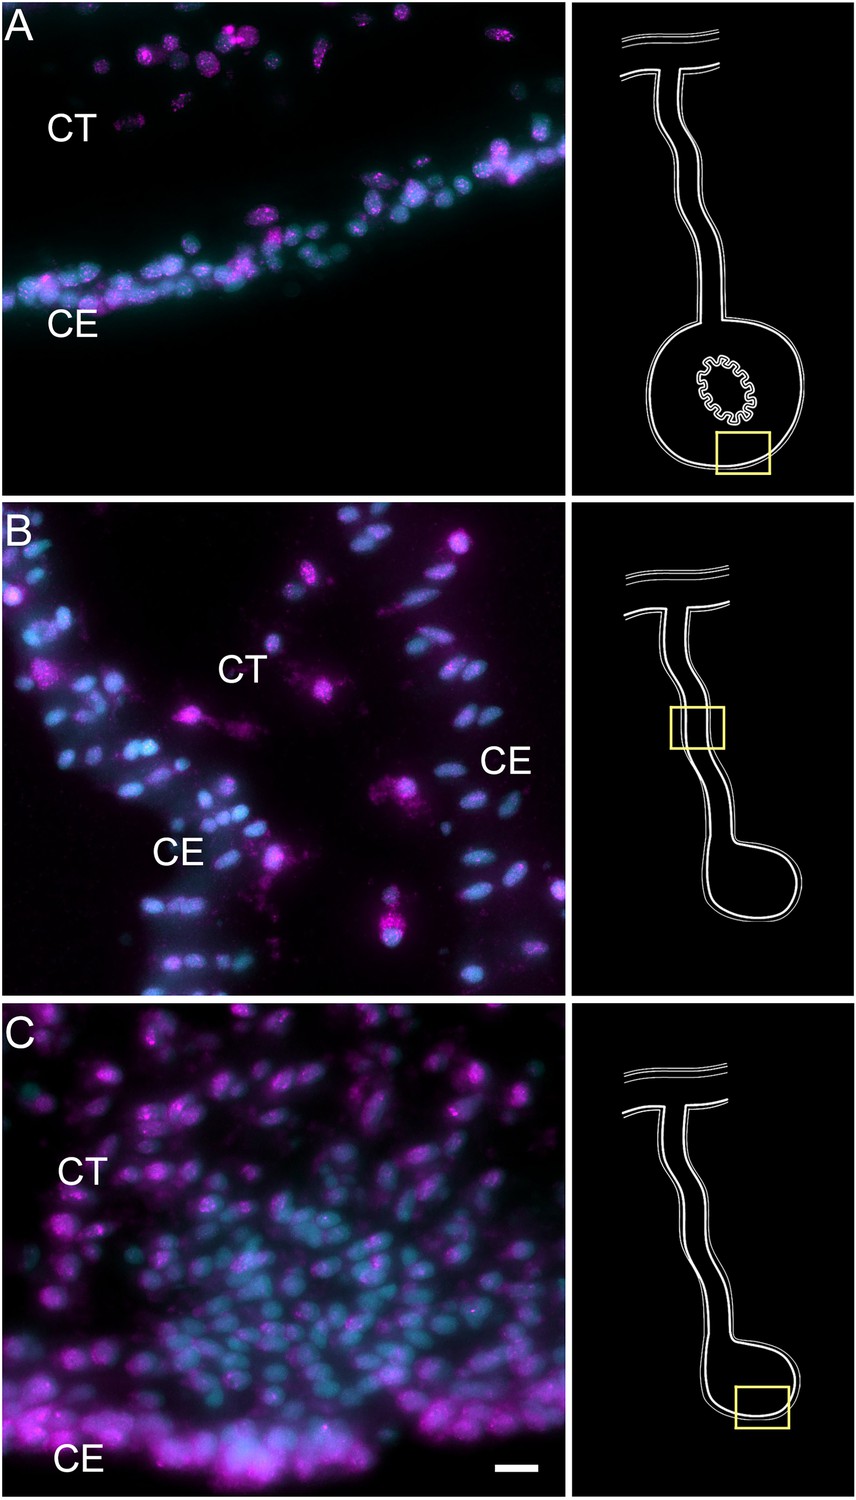
Expression profile of mesenchymal cell types.
Cells (arrowheads) expressing HMCNT1 mRNA in the CT layer of (A) normal intestine, (B) regenerating mesentery, and (C) intestinal anlage of H. glaberrima. In all tissues, the cells are found within the CT layer. Notice in (C) that no expression is found in the cells of the CE. Insets provide the approximate localization of the cells in the adjacent photos. Cyan, DAPI; magenta, HCR-FISH; CE, coelomic epithelium; CT, connective tissue; Mu, muscle. Bar = 10 µm.
Figure 6
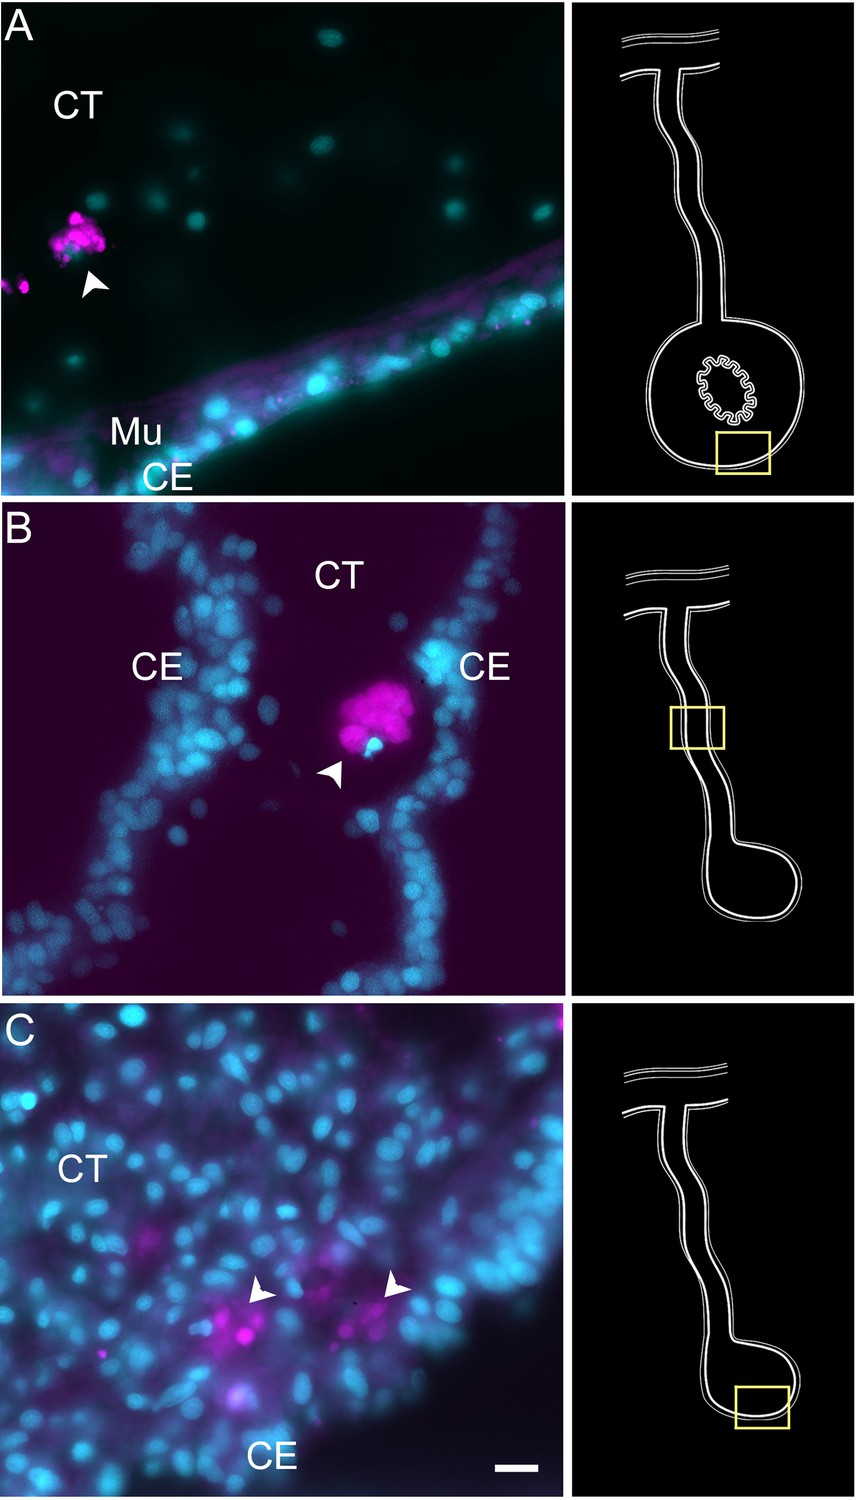
Expression profile of proliferating cells.
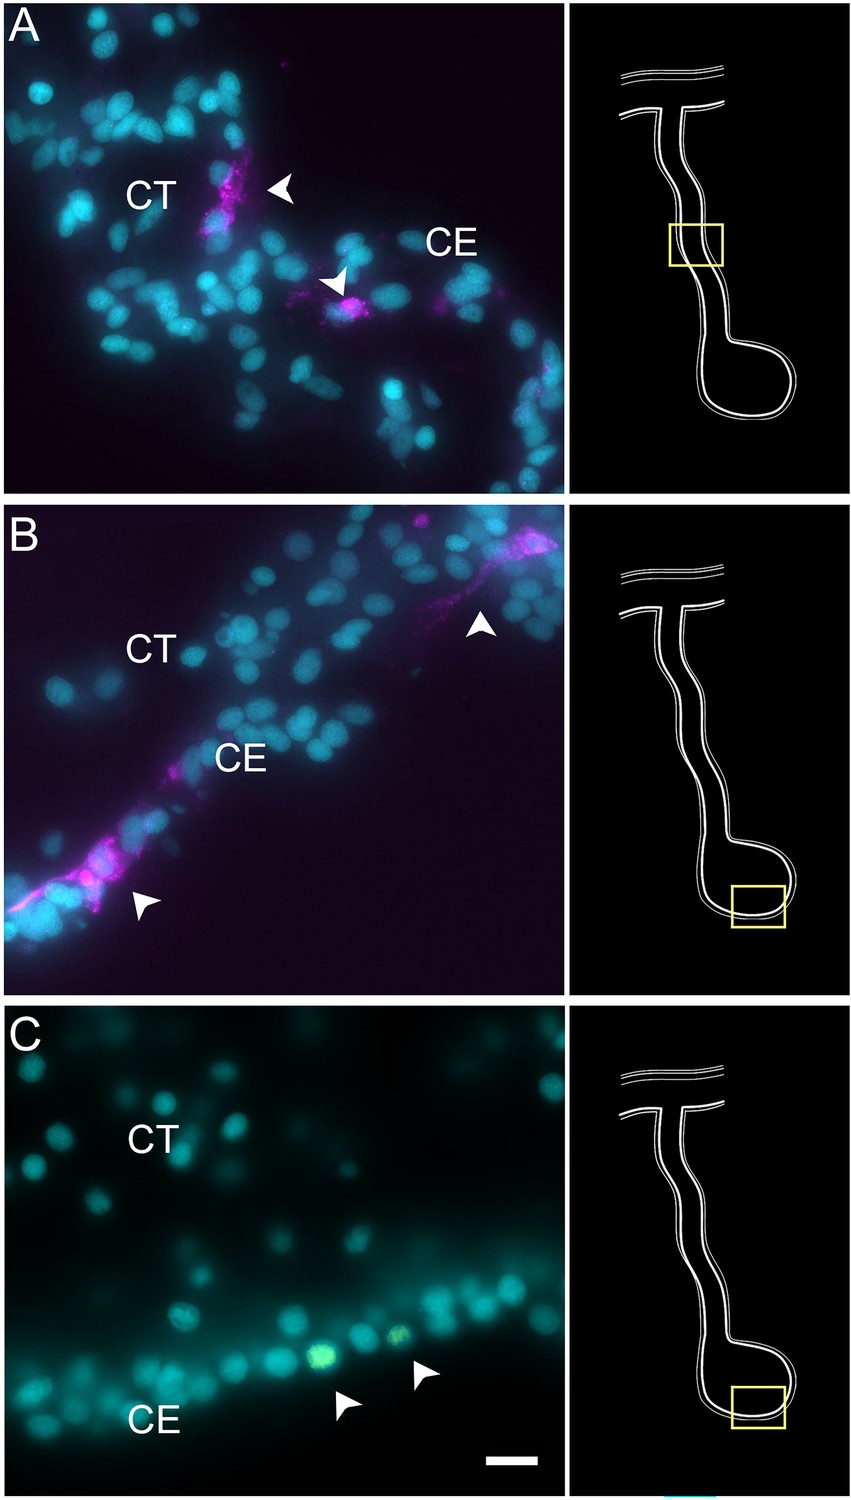
Cells (arrowheads) expressing Ki67 mRNA in the CE layer of regenerating (A) mesentery and (B) anlage of H. glaberrima. Most of the labeled cells are within the CE tissue layer. (C) BrdU-labeled cells (arrowheads) are also mainly found in the CE layer. Insets provide the approximate localization of the cells in the adjacent photos. Cyan, DAPI; magenta, HCR-FISH; CE, coelomic epithelium; CT, connective tissue. Bar = 10 µm.
Figure 7 with 1 supplement
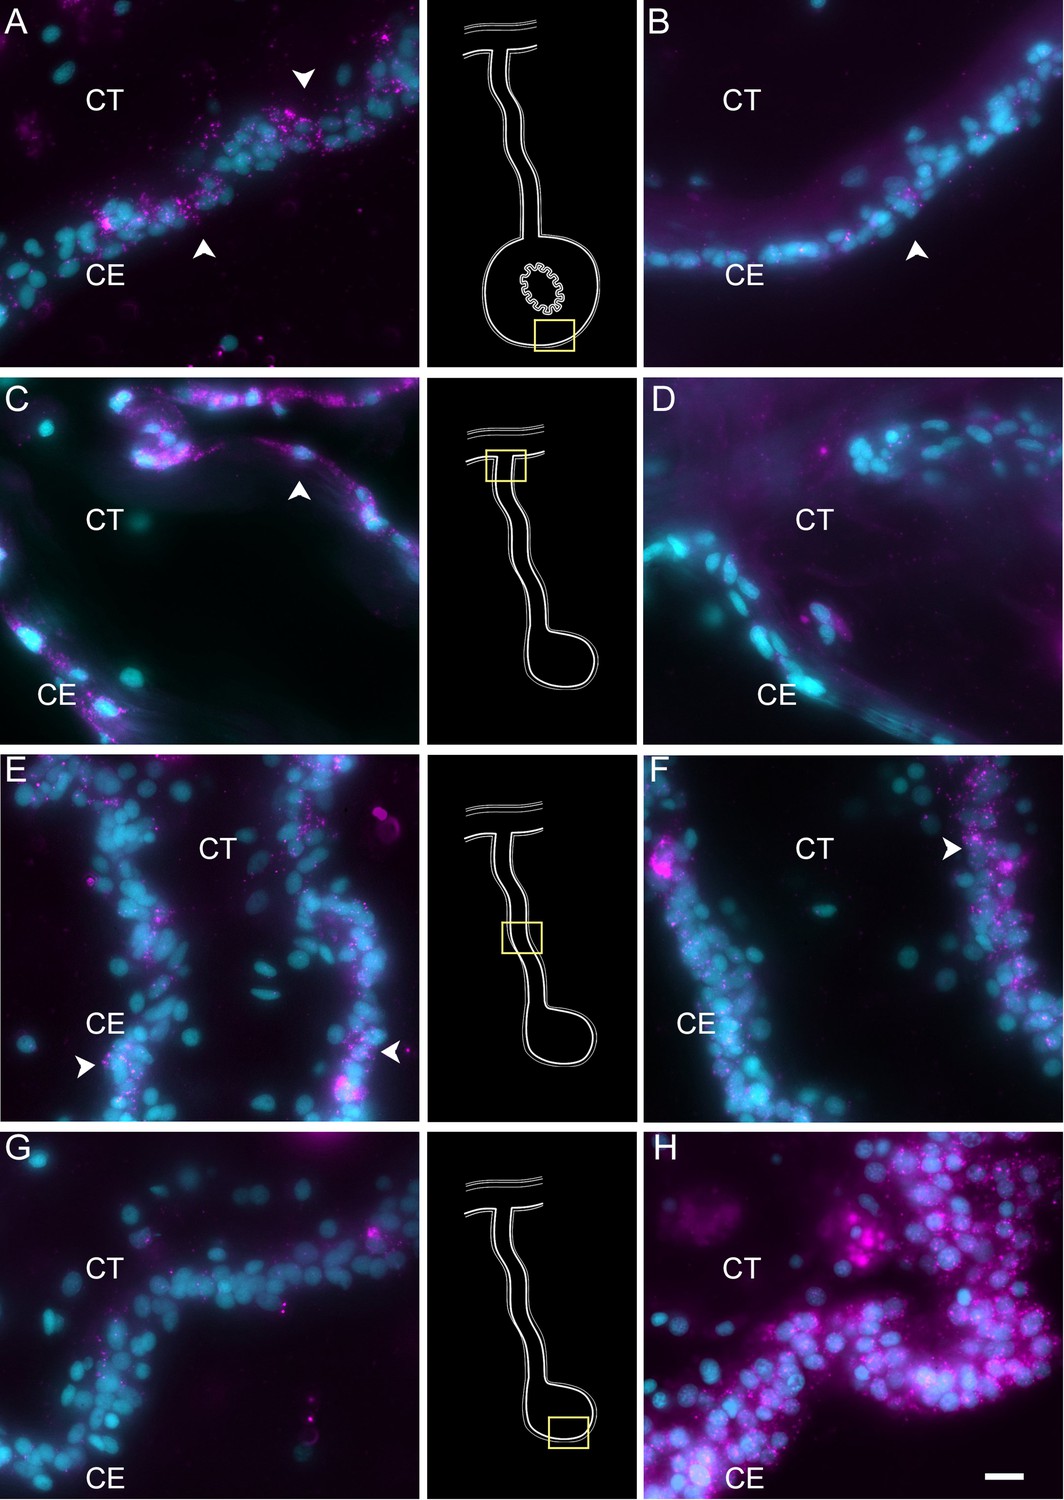
Myosin mRNA expression in regenerating and mature muscle cells.
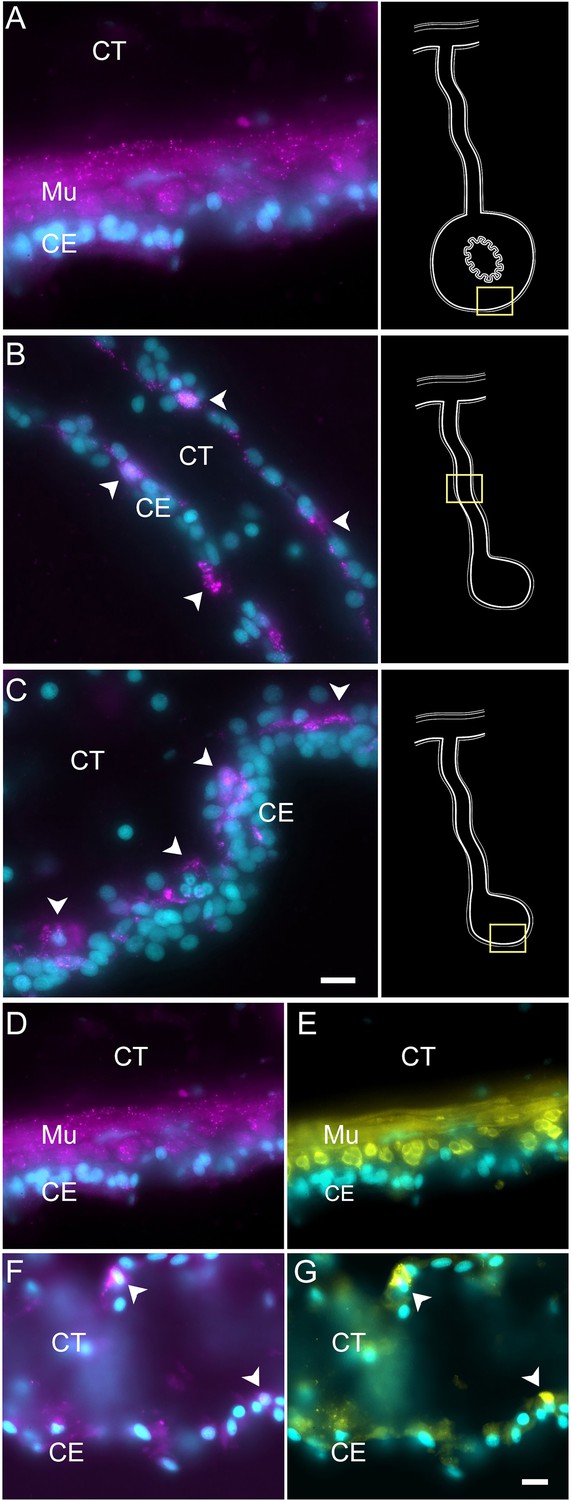
(A–C) Cells expressing MYH7 mRNA (arrowheads) in the (A) normal intestine, (B) regenerating mesentery, and (C) basal area of the anlage CE. Arrowheads point to expression in cells of regenerating tissues. Insets provide the approximate localization of the cells in the adjacent photo. (D–G) Double labeling of (D, F) MYH7 and (E, G) muscle-specific antibody (HgM2), in (D, E) normal intestine, and (F, G) regenerating mesentery, showing the co-expression of both markers in the same cells. Note the two cells (arrowheads in F–G) that express both the MYH7 marker and the muscle-specific antibody (HgM2), representing cells initiating their differentiation toward enteric muscle cells. Cyan, DAPI; magenta, HCR-FISH; yellow, muscle antibody (HgM2); CE, coelomic epithelium; CT, connective tissue; Mu, muscle. Bars = 10 μm.
Figure 7—figure supplement 1
Double labeling for muscle markers in intestinal muscle cells.
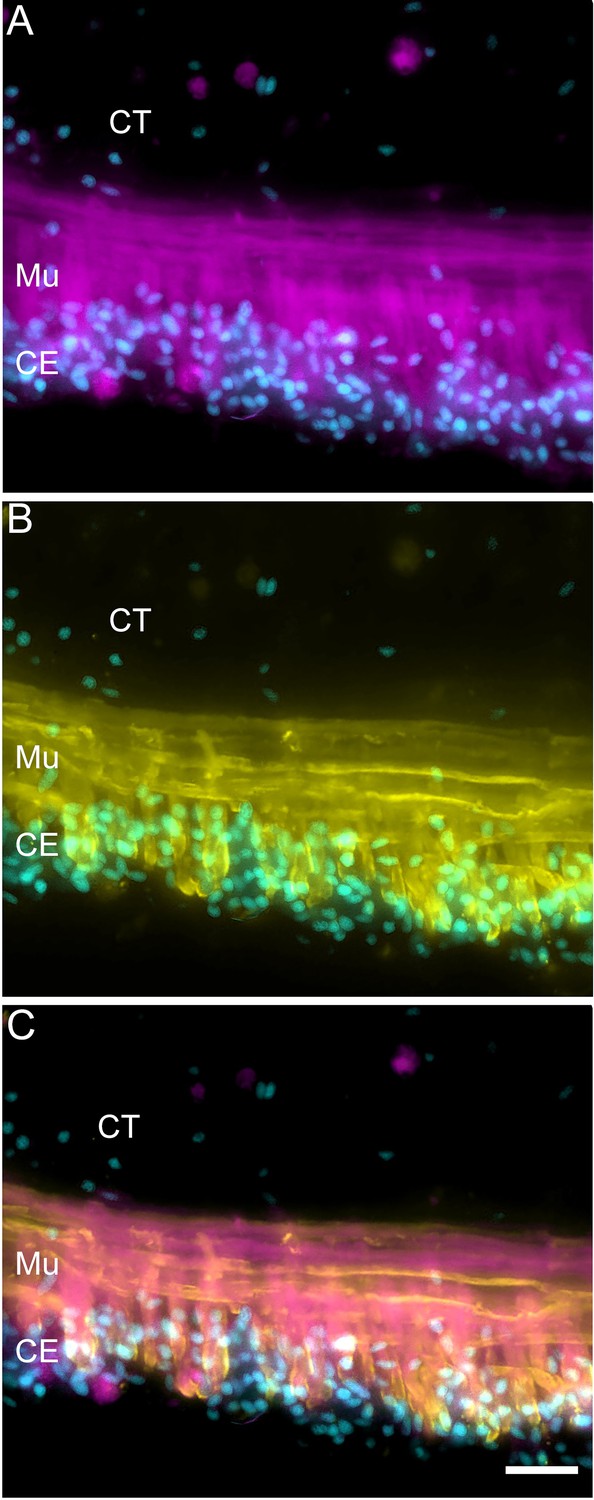
Muscle cells in the normal intestine are labeled using (A) fluorescent phalloidin and (B) muscle-specific antibody (HgM2). (C) The overlay shows that while there is co-expression of both markers in the muscle cells, the markers recognize different structures; phalloidin is known to bind to polymerized actin, while the epitope recognized by the muscle antibody (HgM2), which remains unknown, appears to be associated with the membrane component. Cyan, DAPI; magenta, fluorescent phalloidin; yellow, muscle-specific antibody (HgM2); CE, coelomic epithelium; CT, connective tissue; Mu, muscle. Bar = 20 μm.
Figure 8
STARD-10 expression in differentiating neuroepithelial cells of the coelomic epithelium.
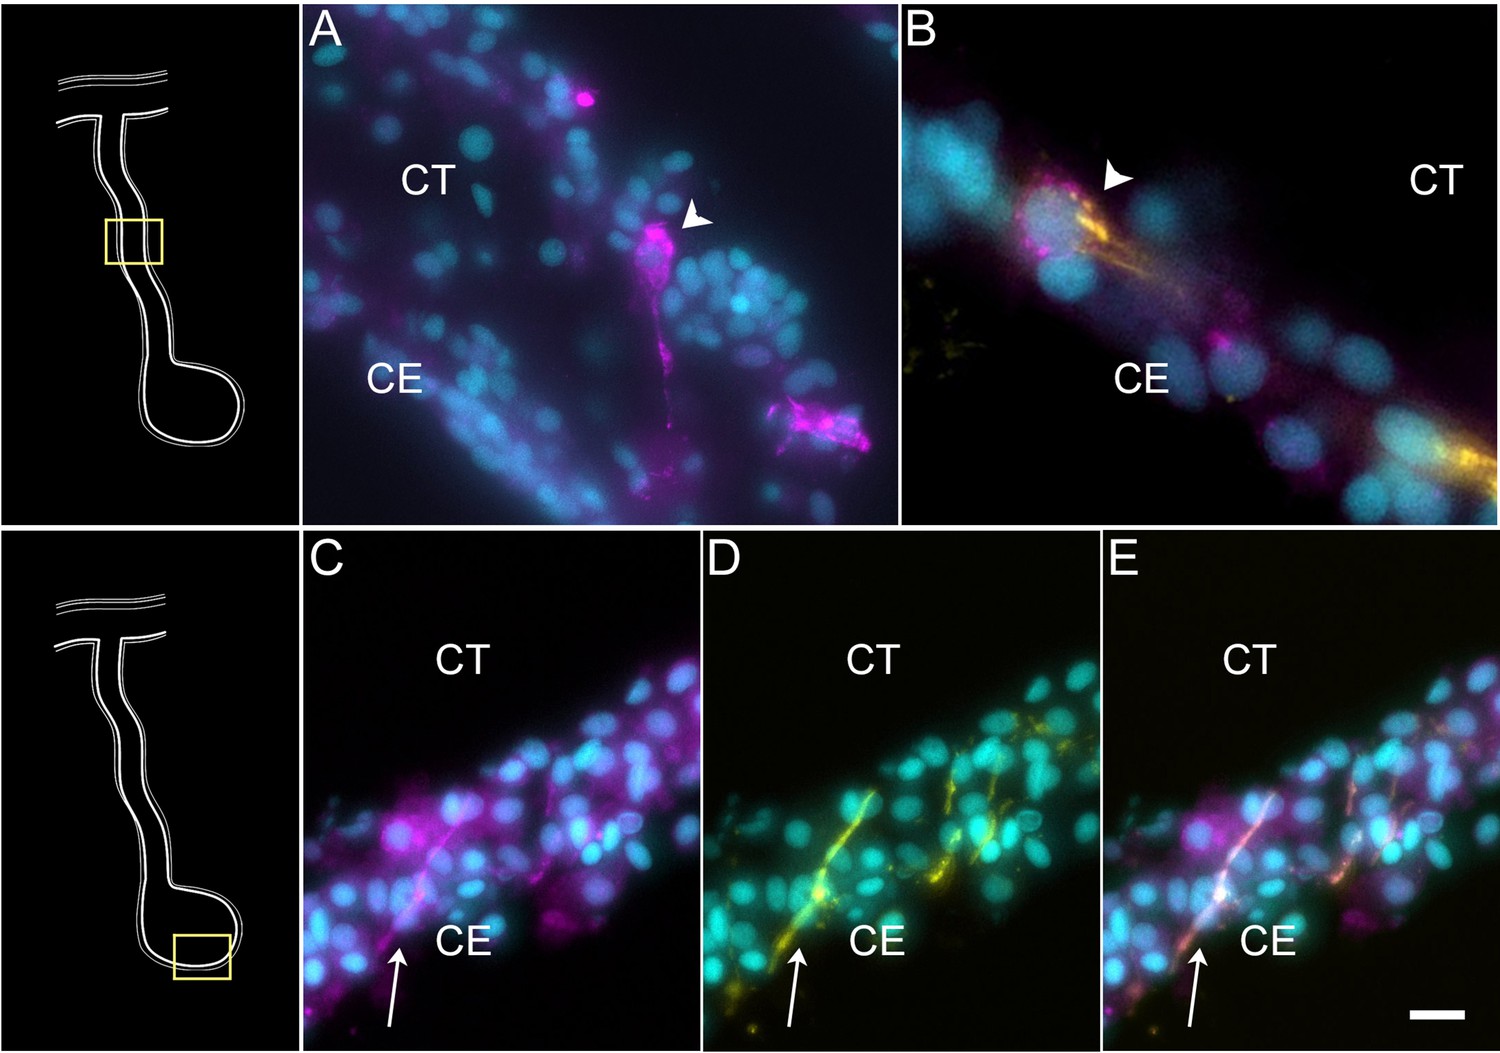
(A) Cells (arrowhead) expressing STA10 mRNA in the CE of the regenerating mesentery. (B) Double labeling with STA10 hybridization chain reaction fluorescent in situ hybridization (HCR-FISH) and STARD-10 antibody (RN1) shows the presence of a cell (arrowhead) in the CE of the regenerating mesentery. (C–E) Fibers (arrow) in the anlage, also express both the (C) STA10 mRNA and (D) the protein, as shown in (E) the corresponding overlay. Insets provide the approximate localization of the cells or fibers in the adjacent photos. Cyan, DAPI; magenta, HCR-FISH; yellow, STARD-10 antibody (RN1); CE, coelomic epithelium; CT, connective tissue. Bar: (B) = 10 μm; (A, C–E) = 5 μm.
Figure 9
Expression profile of coelomic cell populations in the regenerating intestine anlage and mesentery.
(A) Hybridization chain reaction fluorescent in situ hybridization (HCR-FISH) for UNC5C mRNA labeled most if not all cells in the CE of the normal intestine. Strong labeling is also observed in various regions of (B, C) the CE of the regenerating mesentery, while a few cells (arrowhead) are found in (D) the CE of the anlage (arrowhead). Insets provide the approximate localization of the cells in the adjacent photos. Cyan, DAPI; magenta, HCR-FISH; CE, coelomic epithelium; CT, connective tissue. Bar = 10 µm.
Figure 10
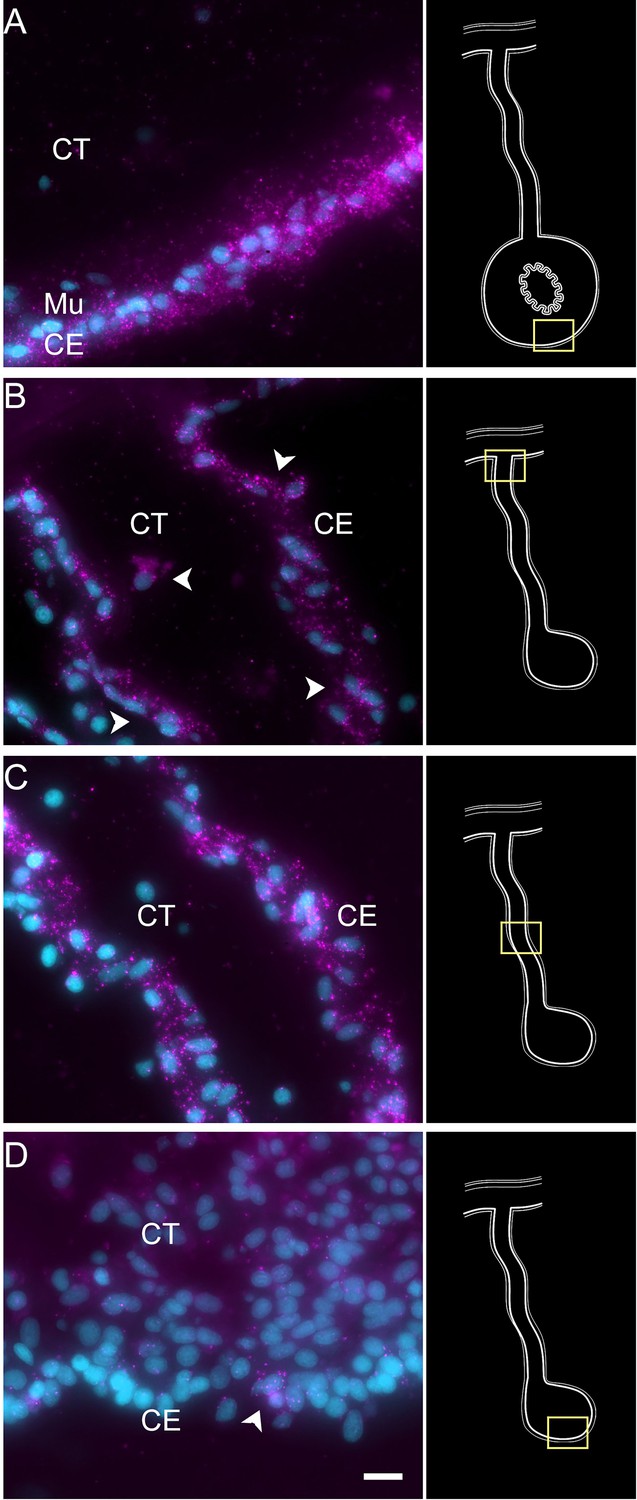
Hybridization chain reaction fluorescent in situ hybridization (HCR-FISH) for TRFM and NET1 shows the differential gene expression of the anlage versus mesentery CE.
TRFM mRNA (left column) is expressed by (A) cells (arrowheads) of the CE in the normal intestine. In regenerating tissues, there is a high expression in (C) CE cells (arrowheads) close to the body wall. This expression decreases toward the anlage, with some expression in (E) CE cells of the mid part of the mesentery and very little if any in (G) the CE of the anlage. In contrast, NET1 (right column) is expressed in fewer CE cells (arrowheads) of the (B) normal intestine, and (D, F) mesentery, but its expression is extremely high in most of (H) the CE cells of the anlage. Insets provide the approximate localization of the cells in the adjacent photos. Cyan, DAPI; magenta, HCR-FISH; CE, coelomic epithelium; CT, connective tissue. Bar = 10 µm.
Figure 11 with 1 supplement
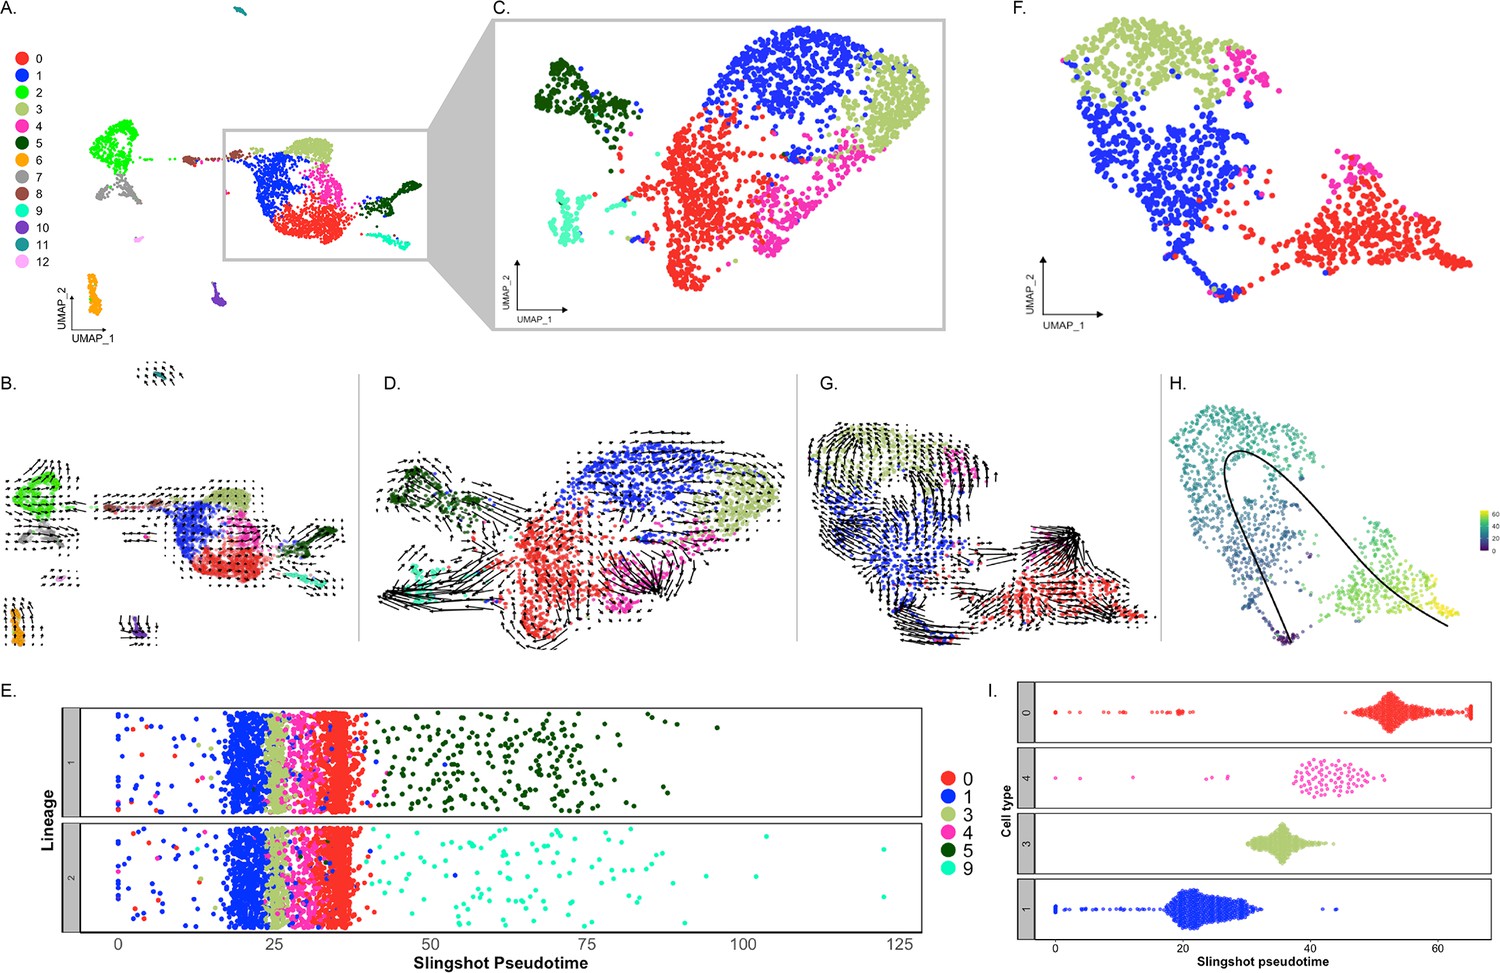
Trajectory analysis of cell populations from the regenerating intestinal tissue.
(A) UMAP plot of all identified clusters. (B) RNA velocity embedded in UMAP of all main clusters. (C) UMAP of reclustering of cells from C0, C1, C3, C4, C5, and C9. (D) RNA velocity analysis results from the subset from panel (C). (E) Jitter plot of Slingshot pseudotime of cells from C0, C1, C3, C4, C5, and C9. Pseudotime resulted in two lineages, one containing C5 and the other C9. (F) UMAP of reclustered anlage cells corresponding to C0, C1, C3, and C4. (G) RNA velocity results from the cluster results from panel (F). (H) UMAP of (F) plot overlayed with pseudotime results of Slingshot. Color represent pseudotime values from 0 (blue) to 60 (yellow). (I) Jitter plot showing the Slingshot pseudotime of cells from each cell cluster.
Figure 11—figure supplement 1
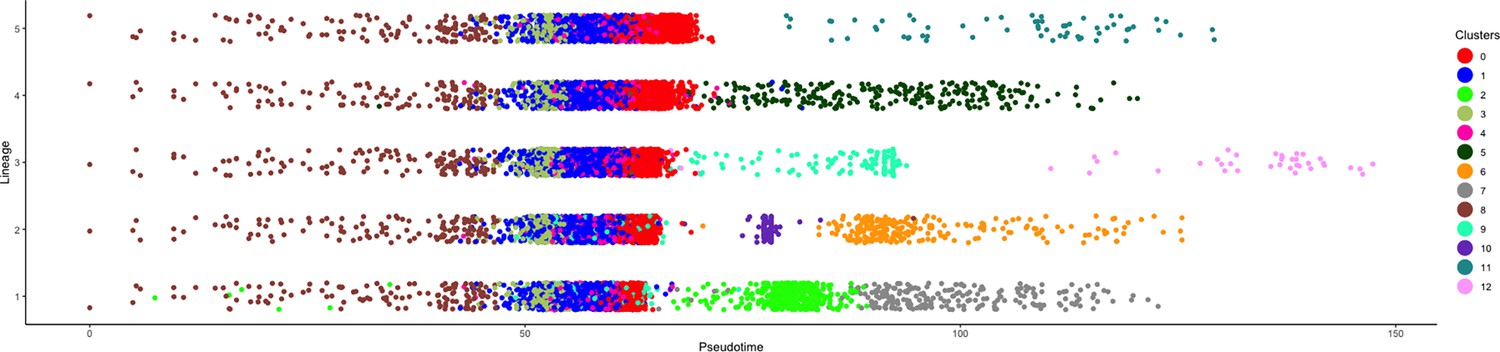
Pseudotime analysis of all clusters within the 9-dpe intestinal regeneration dataset.
Each color reflects the corresponding cluster from C0 to C12. The x-axis represents slingshot pseudotime and y-axis the corresponding lineage.
Figure 12
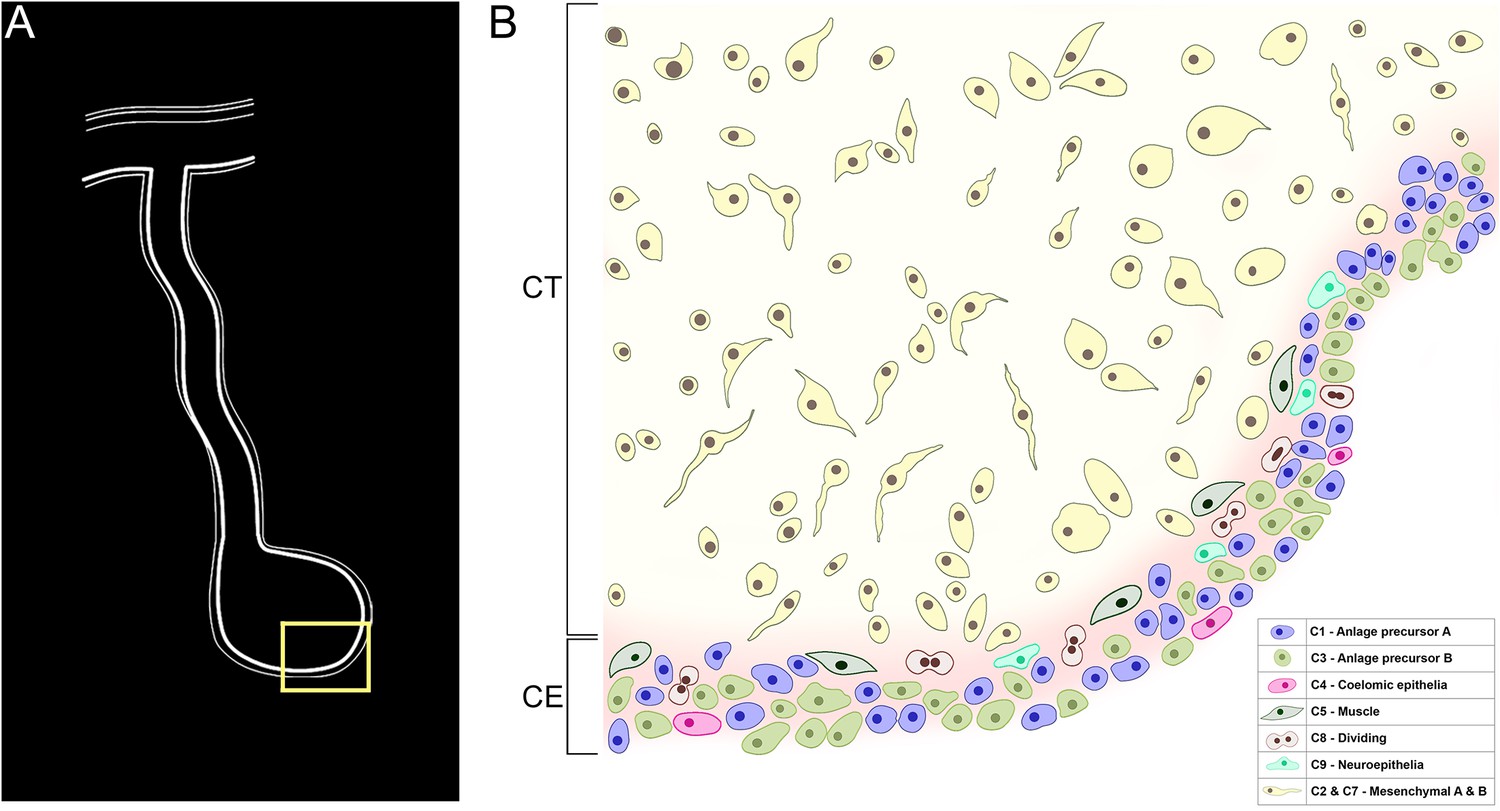
Model of cellular organization of the intestinal anlage.
Various cell populations can be identified in the connective tissue (CT) and coelomic epithelium (CE) in the anlage of the sea cucumber H. glaberrima at 9 dpe. (A) A diagram showing the intestinal anlage and a portion encompassing coelomic epithelia and connective tissue that would be represented by the cell populations shown in (B). These populations correspond to those identified by the scRNA-seq that are described in the text. Most of the cell populations are found within the CE, some of them showing particular localizations; differentiating muscle cells are found in the basal part of the CE while differentiating coelomic epithelia are found in the apical region. The two mesenchymal populations are shown together. The colors of cells and cluster numbers (C#s) correlate with those used on the UMAP shown in Figure 2.
Additional files
Download links
A two-part list of links to download the article, or parts of the article, in various formats.
Downloads (link to download the article as PDF)
Open citations (links to open the citations from this article in various online reference manager services)
Cite this article (links to download the citations from this article in formats compatible with various reference manager tools)
Single-cell RNA sequencing of the holothurian regenerating intestine reveals the pluripotency of the coelomic epithelium
eLife 13:RP100796.
https://doi.org/10.7554/eLife.100796.3


