Discovering root causal genes with high-throughput perturbations
- University of Pittsburgh, United States
- Vanderbilt University Medical Center, United States
Figures
Figure 1
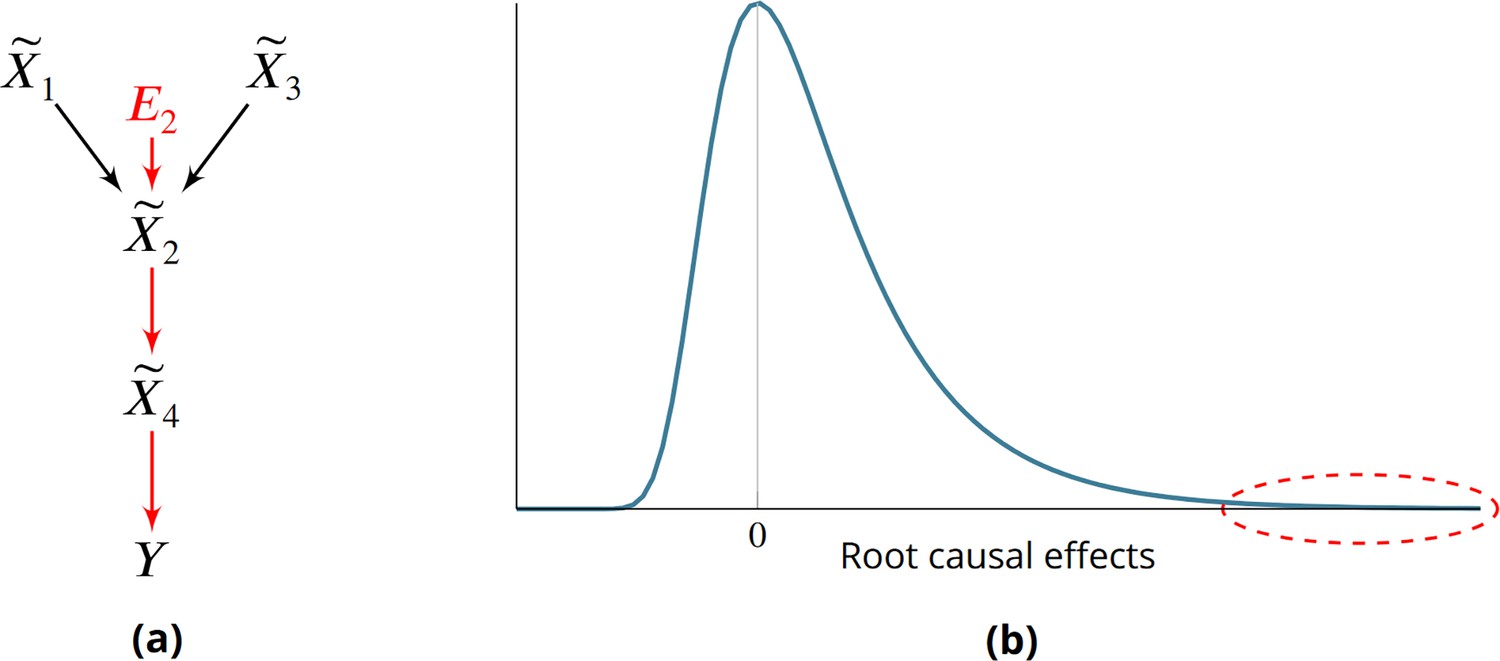
Root causes, root causal genes and root causal effects.
(a) Toy example where a variable simultaneously models genetic and non-genetic root causes that jointly have a large causal effect on a diagnosis through gene expression . first affects the gene expression level , or the root causal gene. The root causal gene then affects other downstream levels during pathogenesis, including the core (or direct causal) gene , to ultimately induce . (b) We hypothesize that the causal effects of most root causes are small, but a few exert large causal effects (red ellipse), in each patient with disease. As a result, the distribution of these root causal effects tends to be right skewed in disease.
Figure 2
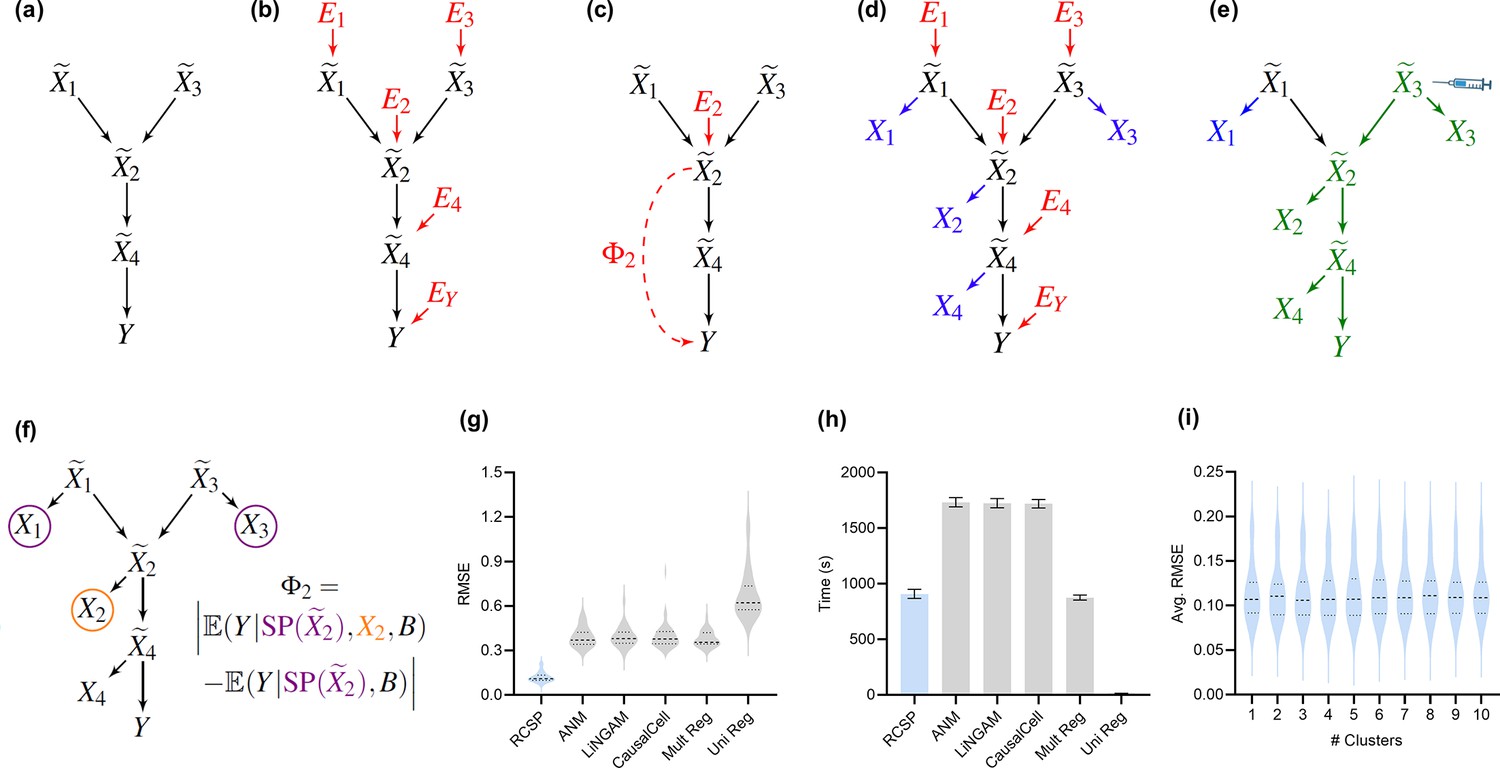
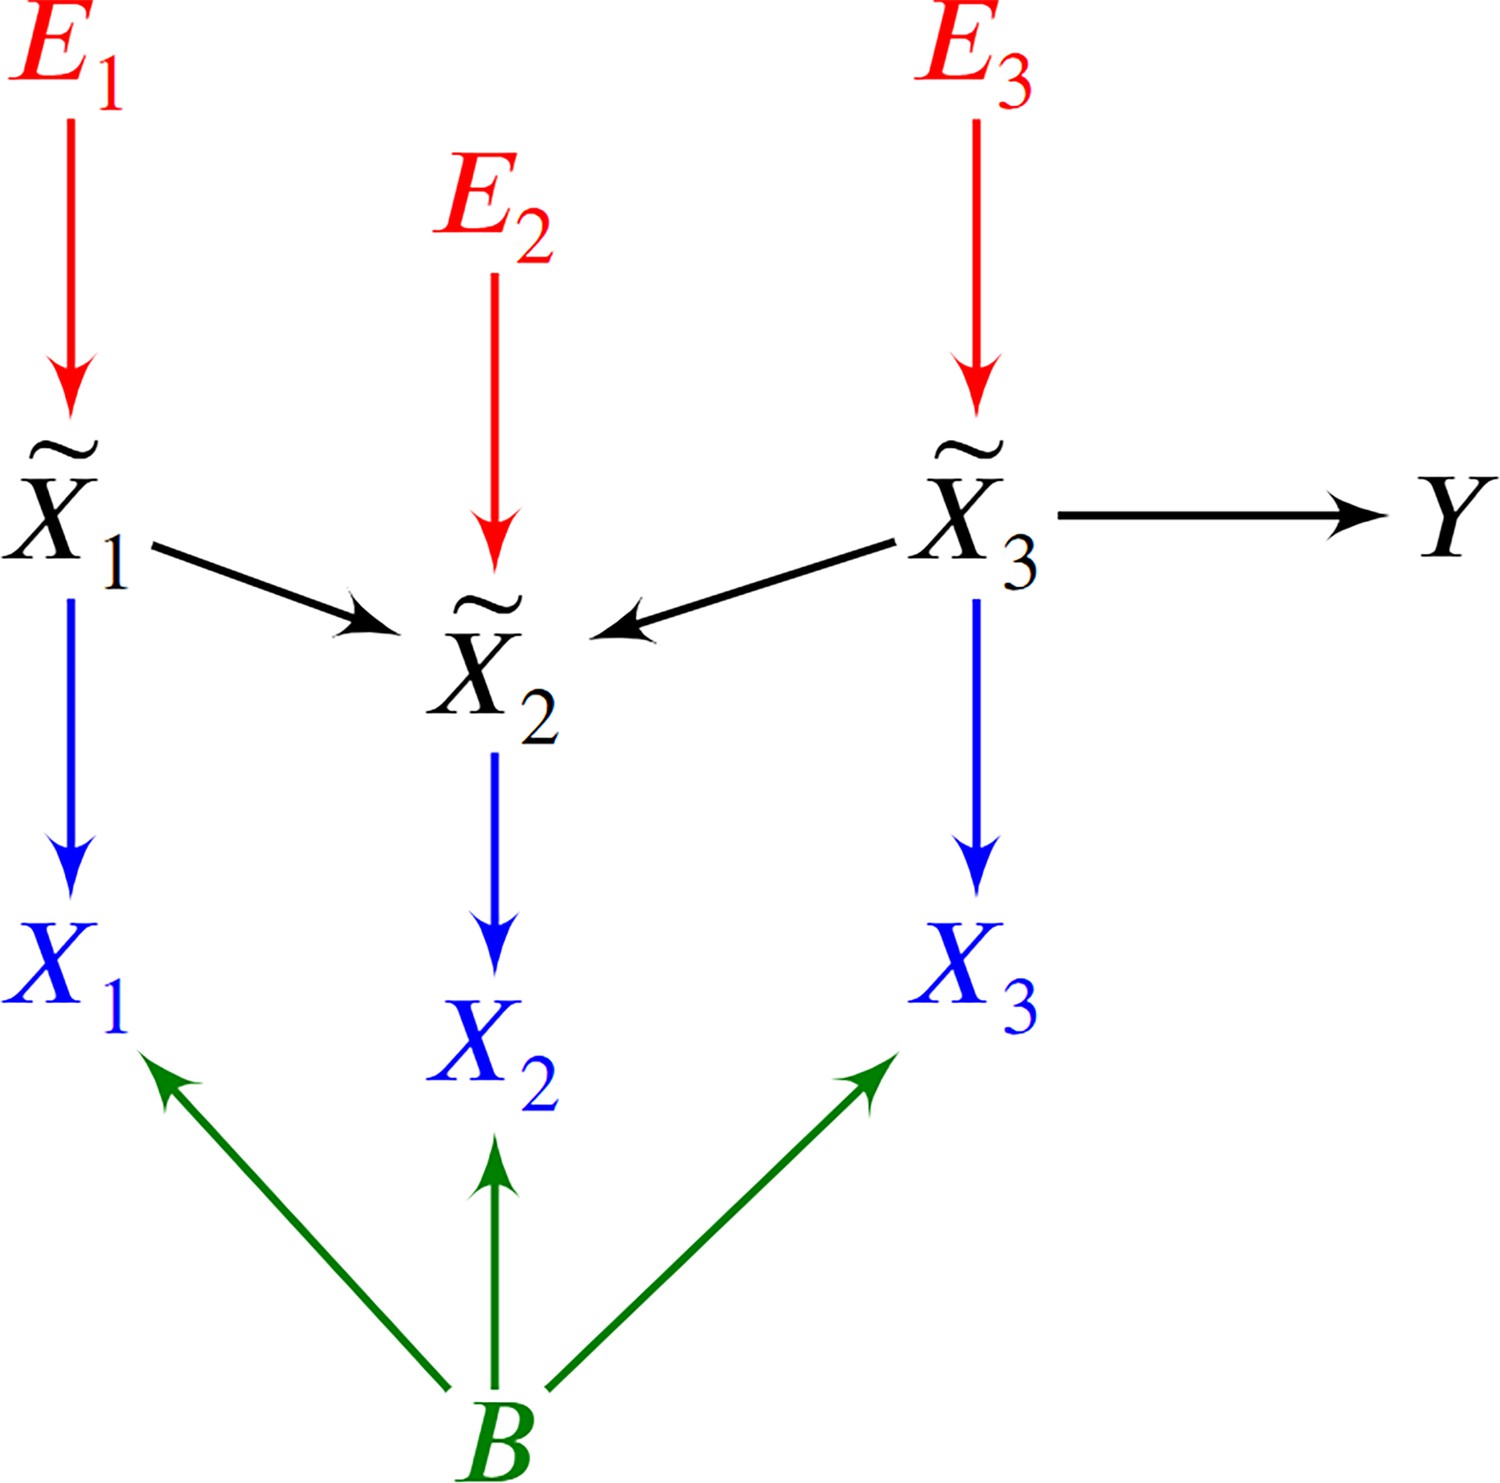
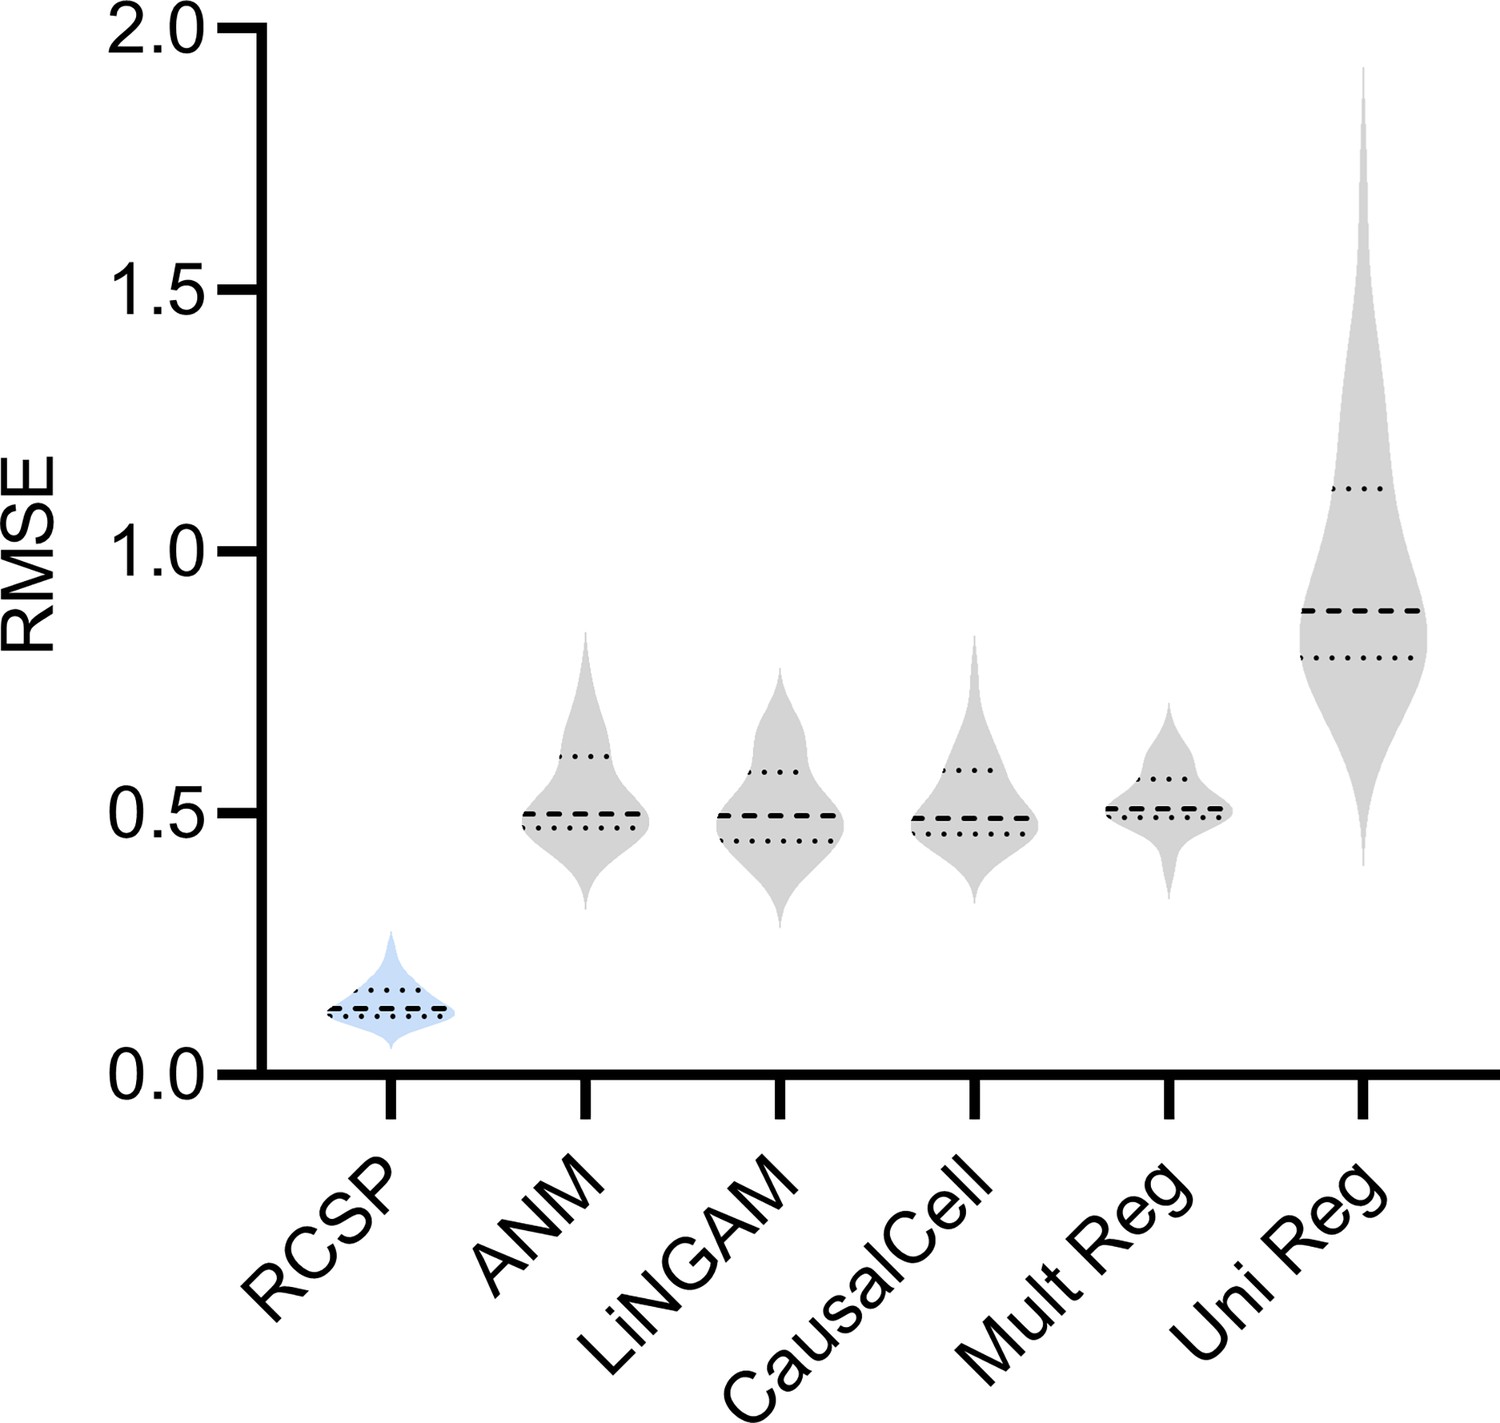
Method overview and synthetic data results.
(a) We consider a latent causal graph over the true counts . (b) We augment the graph with error terms such that each in red has an edge directed towards . (c) The RCS of , denoted by , quantifies the magnitude of the conditional root causal effect, or the strength of the causal effect from to conditional on . (d) We cannot observe in practice but instead observe the noisy surrogates in blue corrupted by Poisson measurement error. (e) Perturbing a variable such as changes the marginal distributions of downstream variables shown in green under mild conditions. (f) RCSP thus uses the perturbation data to identify (an appropriate superset of) the surrogate parents for each variable in order to compute . (g) Violin plots show that RCSP achieved the smallest RMSE to the ground truth RCS values in the synthetic data. (h) RCSP also took about the same amount of time to complete as multivariate regression. Univariate regression only took 11 s on average, so its bar is not visible. Error bars denote 95% confidence intervals of the mean over 30 synthetic datasets. (i) Finally, RCSP maintained low RMSE values regardless of the number of clusters considered.
Figure 3
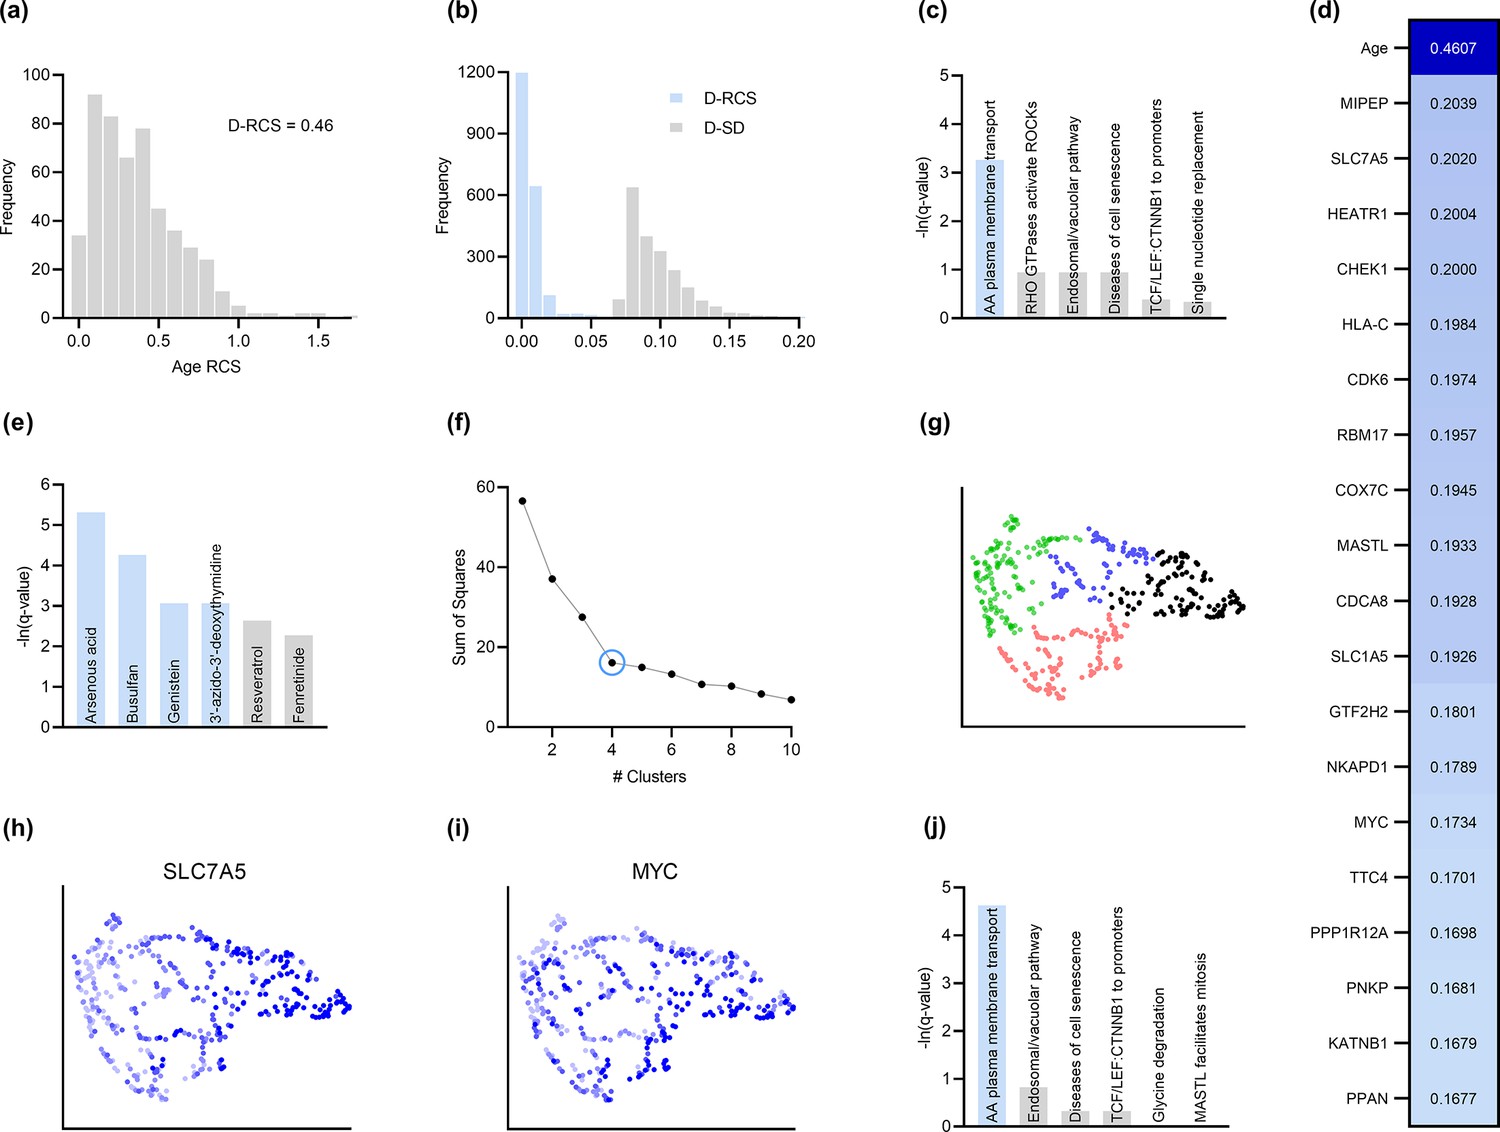
Analysis of AMD.
(a) The distribution of the RCS scores of age deviated away from zero and had a composite D-RCS of 0.46. (b) However, the majority of gene D-RCS scores concentrated around zero, whereas the majority of gene D-SD scores concentrated around the relatively larger value of 0.10. Furthermore, the D-RCS scores of the genes in (d) mapped onto the ‘amino acid transport across the plasma membrane’ pathway known to be involved in the pathogenesis of AMD in (c). Blue bars survived 5% FDR correction. (e) Drug enrichment analysis revealed four significant drugs, the later three of which have therapeutic potential. (f) Hierarchical clustering revealed four clear clusters according to the elbow method, which we plot by UMAP dimensionality reduction in (g). The RCS scores of the top genes in (d) increased only from the left to right on the first UMAP dimension (x-axis); we provide an example of SLC7A5 in (h) and one of three detected exceptions in (i). We therefore performed pathway enrichment analysis on the black cluster in (g) containing the largest RCS scores. (j) The amino acid transport pathway had a larger degree of enrichment in the black cluster as compared to the global analysis in (c).
Figure 4
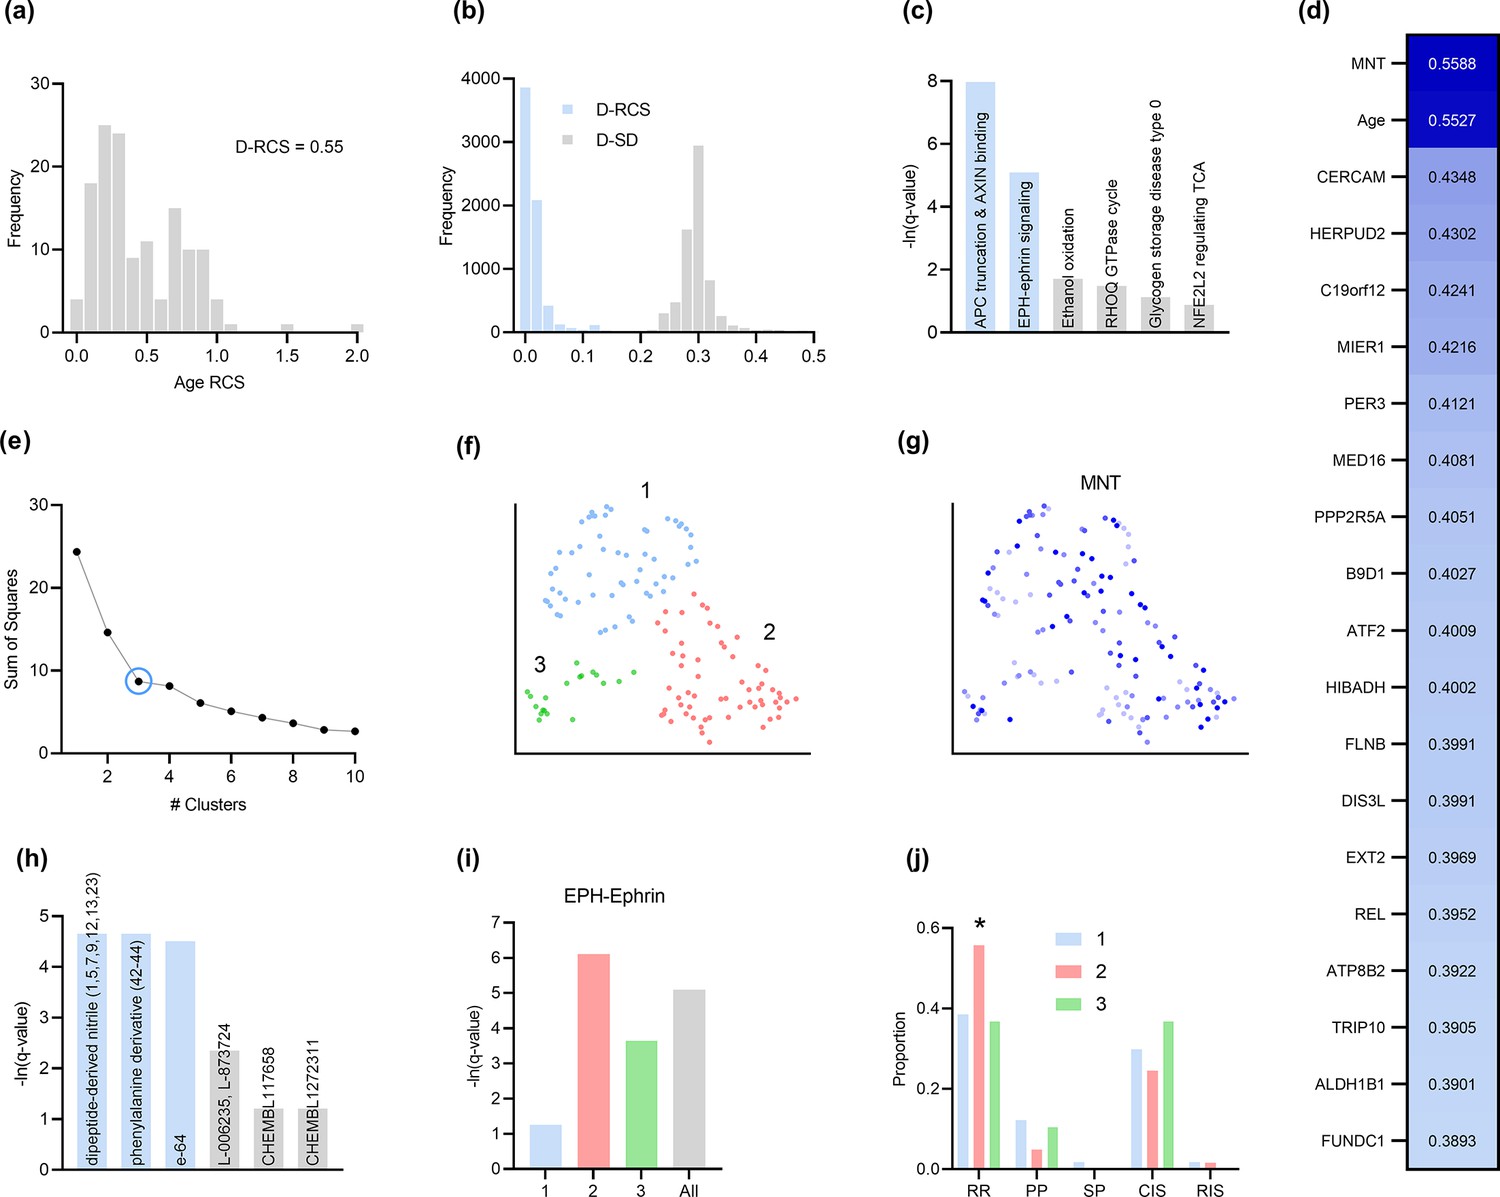
Analysis of MS.
(a) The distribution of the RCS scores of age deviated away from zero with a composite D-RCS of 0.55. (b) The distribution of D-RCS concentrated around zero, whereas the distribution of D-SD concentrated around 0.3. (d) RCSP identified many genes with large D-RCS scores that in turn mapped onto known pathogenic pathways in MS in (c). Hierarchical clustering revealed three clusters in (e), which we plot in two dimensions with UMAP in (f). Top genes did not correlate with either dimension of the UMAP embedding; we provide an example of the MNT gene in (g). (h) Drug enrichment analysis in the green cluster implicated multiple cathepsin inhibitors. Finally, EPH-ephrin signaling survived FDR correction in (c) and was enriched in the pink cluster in (i) which contained more MS patients with the relapsing-remitting subtype in (j); subtypes include relapsing-remitting (RR), primary progressive (PP), secondary progressive (SP), clinically isolated syndrome (CIS), and radiologically isolated syndrome (RIS).
Figure 5
In this example, two root causal genes and affect many downstream genes and ultimately cause .
Thus all genes correlate with , but only and have large root causal effects on . The omnigenic root causal model posits that only a few root causal genes affect many downstream genes, so that nearly all genes are correlated with . Causal genetic variants can directly cause or cause any gene expression level that causes – including those with small root causal effects – but only and have large root causal effects on due to genetic and non-genetic root causes modeled by and . In contrast, the core gene model assumes only a few direct causal genes . These core genes do not account for the deleterious causal effects of and on and .
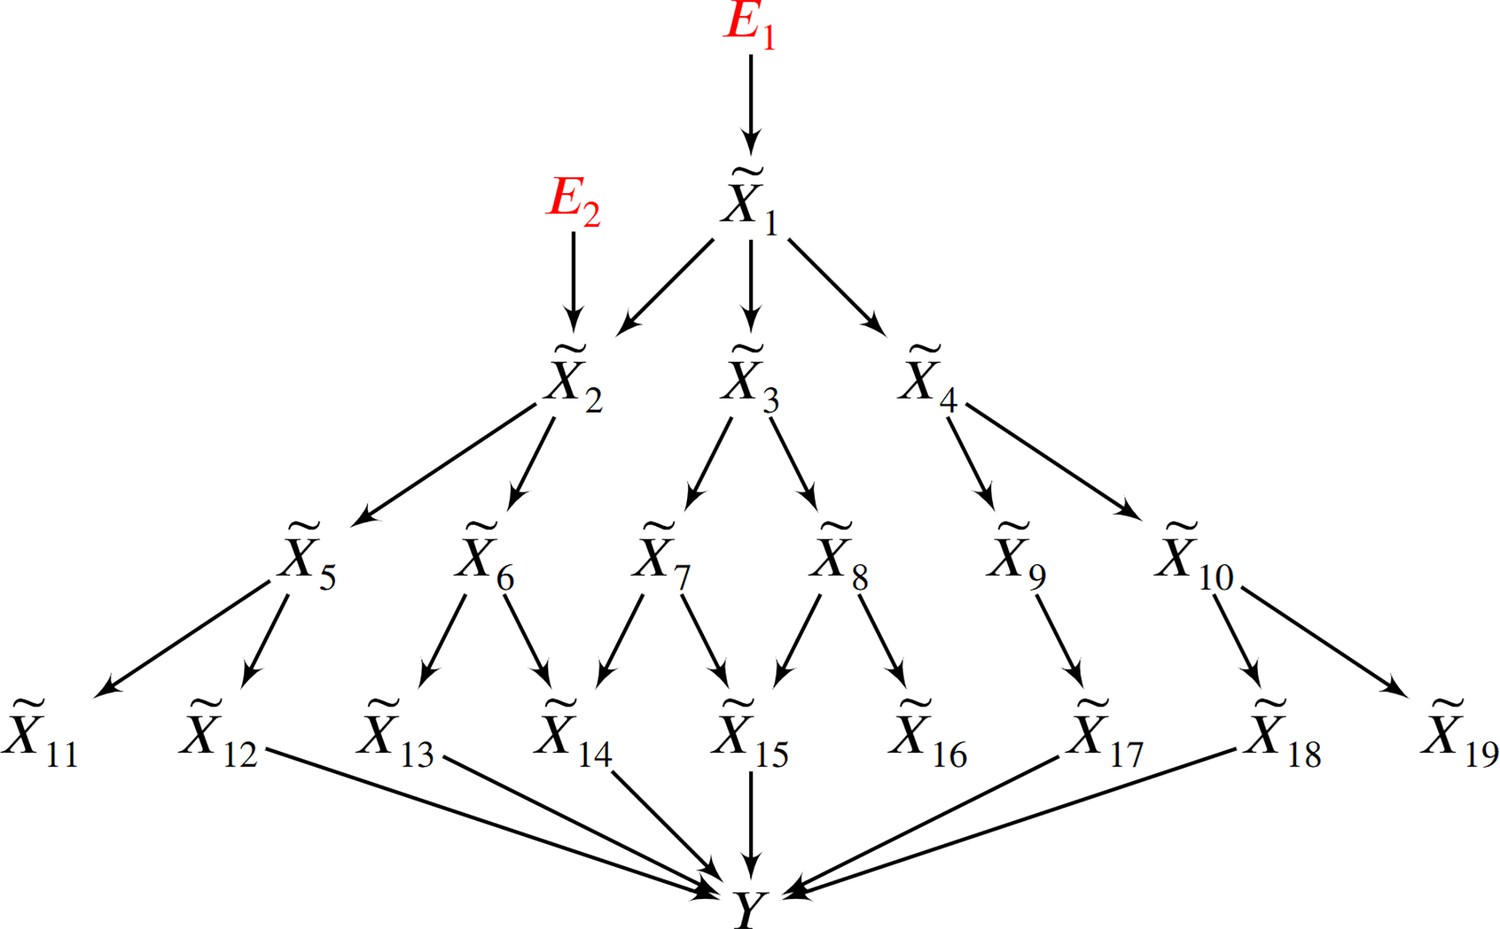
Figure 6
An example of a DAG over augmented with the error terms .
The observed vertices denote counts corrupted by batch effects and Poisson measurement error.
Appendix 1—figure 1
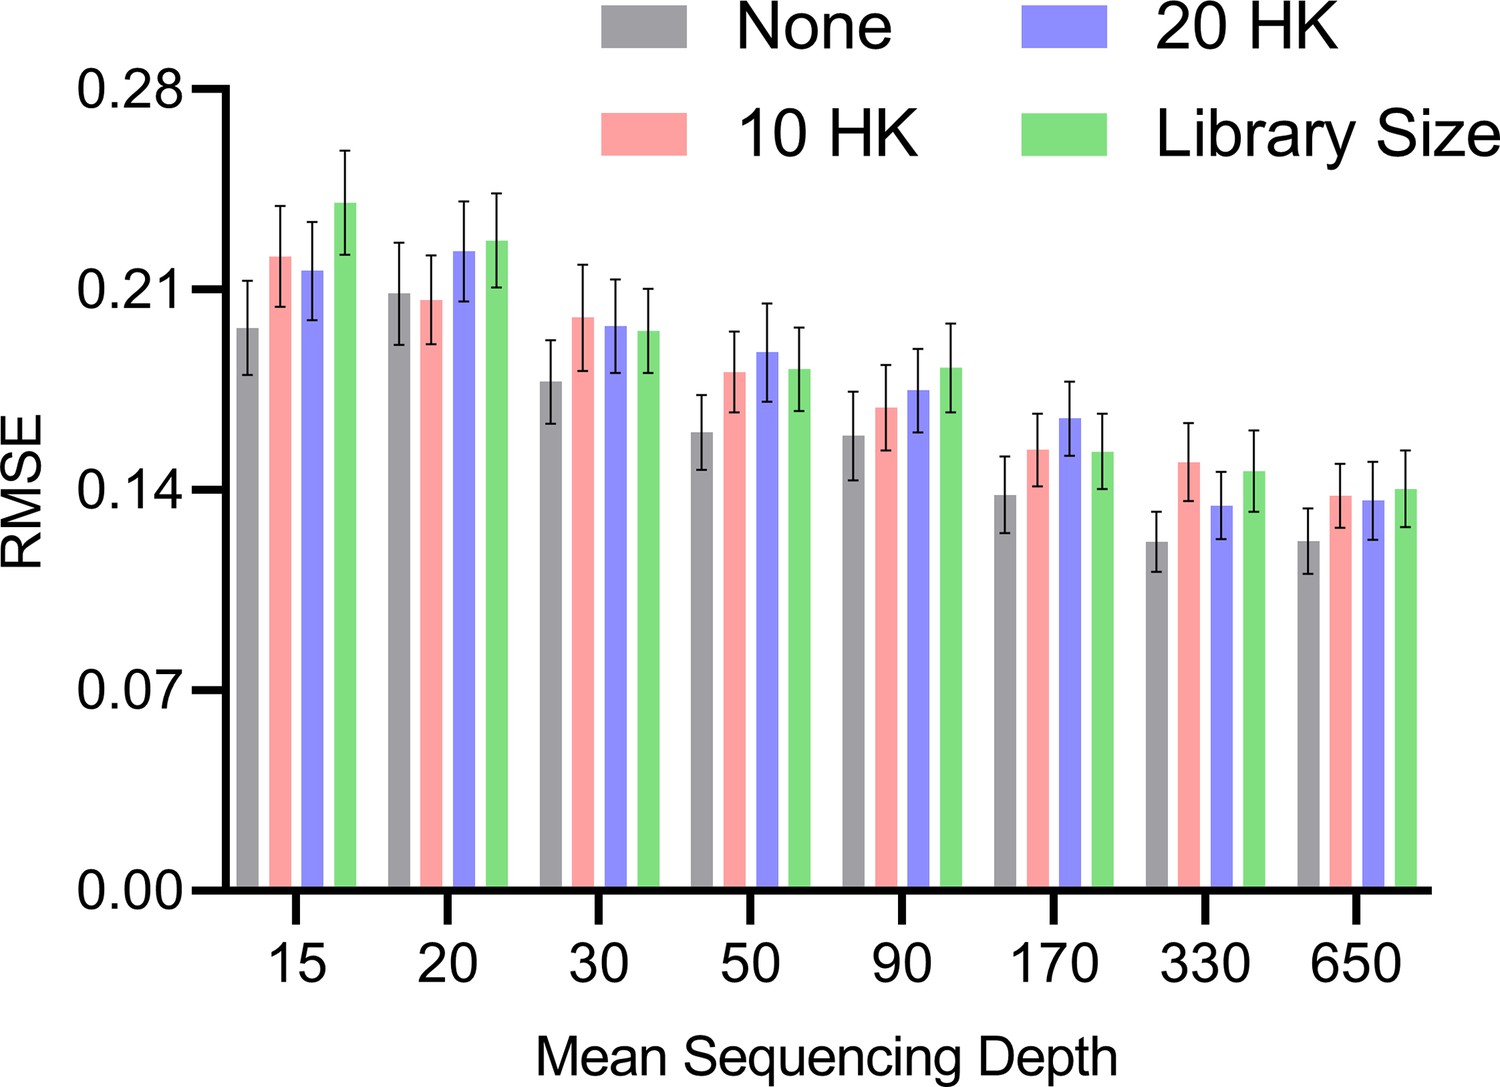
Mean RMSE to the ground truth RCS values across different mean sequencing depths and normalization strategies.
The no normalization strategy achieved low RMSEs at lower mean sequencing depths, but the performances of all methods converged as the mean sequencing depths increased. Error bars denote 95% confidence intervals of the mean over 100 datasets.
Appendix 1—figure 2
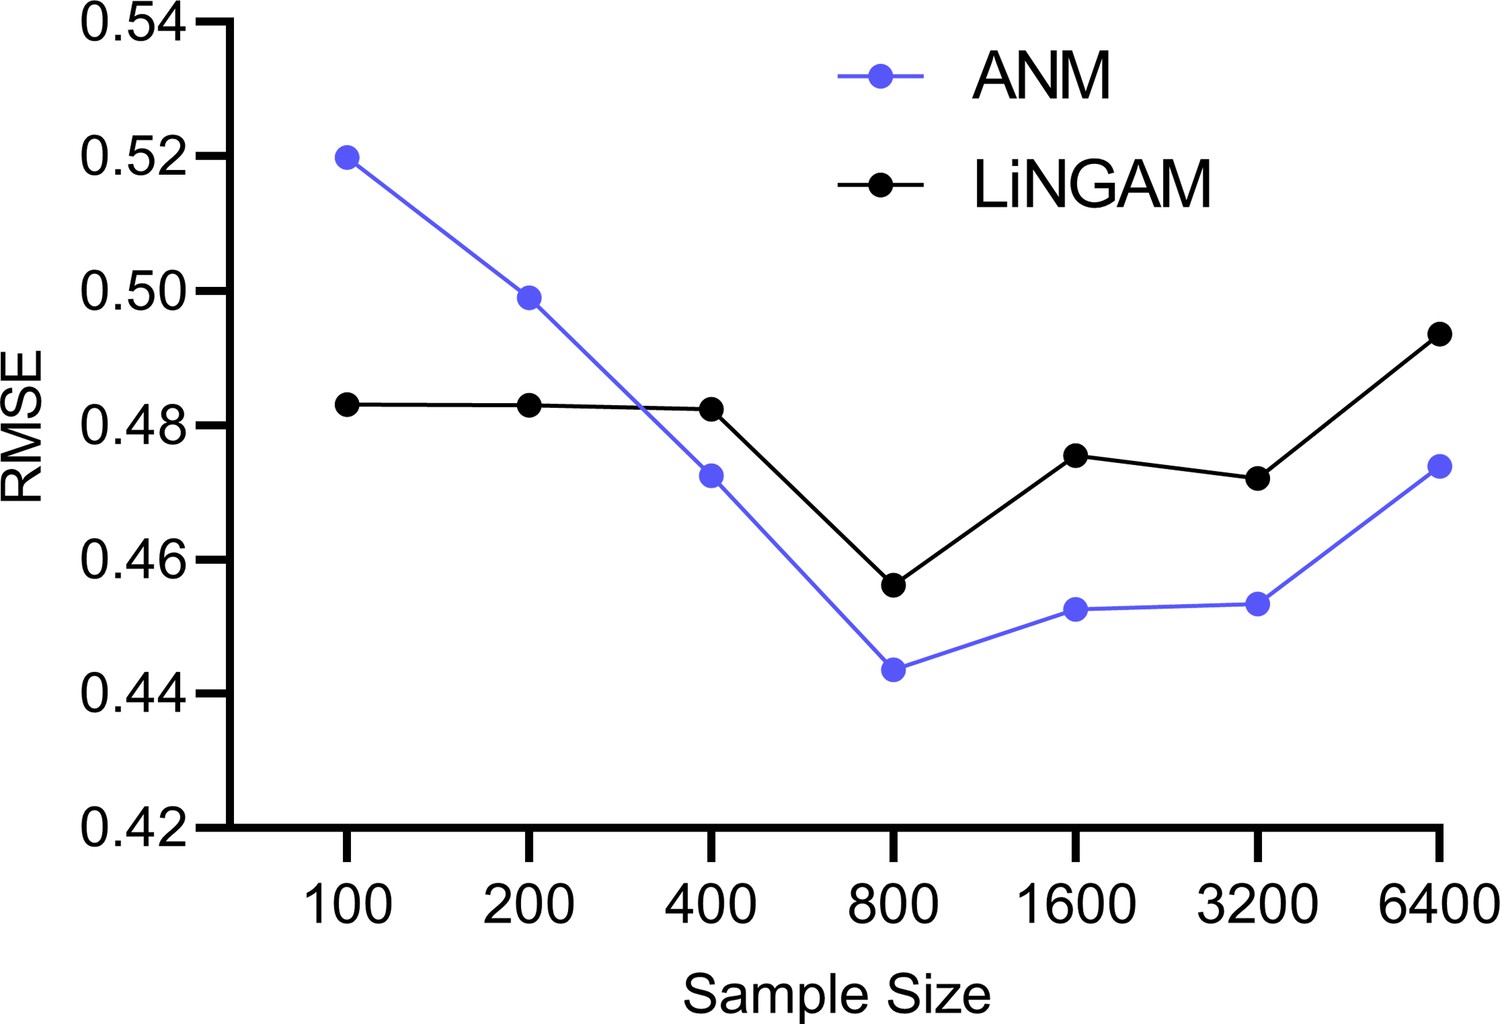
Mean RMSE values to the ground truth error term values across different sample sizes.
The accuracies of ANM and LiNGAM do not improve with increasing sample sizes.
Appendix 1—figure 3
RCSP achieved the lowest RMSE in cyclic graphs as well.
However, error terms can influence ancestors in the cyclic case, so the interpretation of the RCS remains unclear when cycles exist.
Appendix 1—figure 4
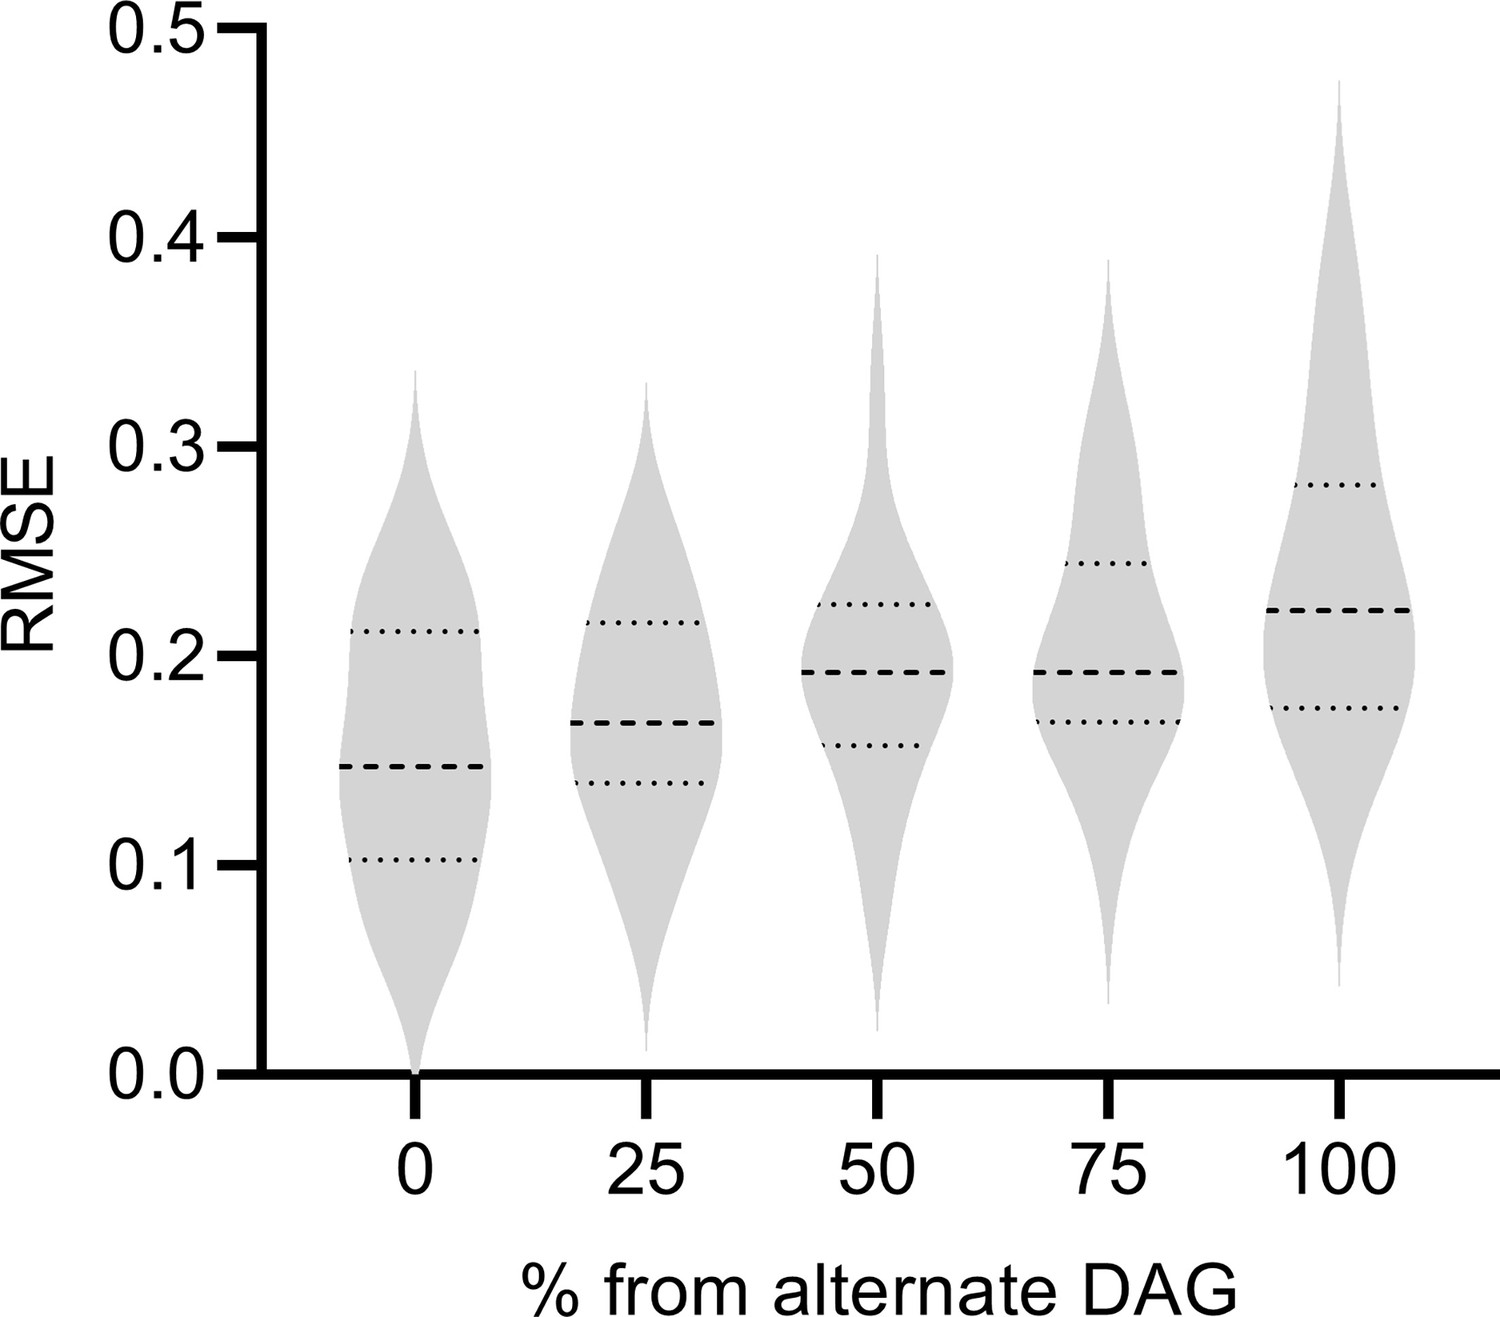
The performance of RCSP degrades gracefully as the percent of samples from the alternate DAG increases.
Appendix 1—figure 5
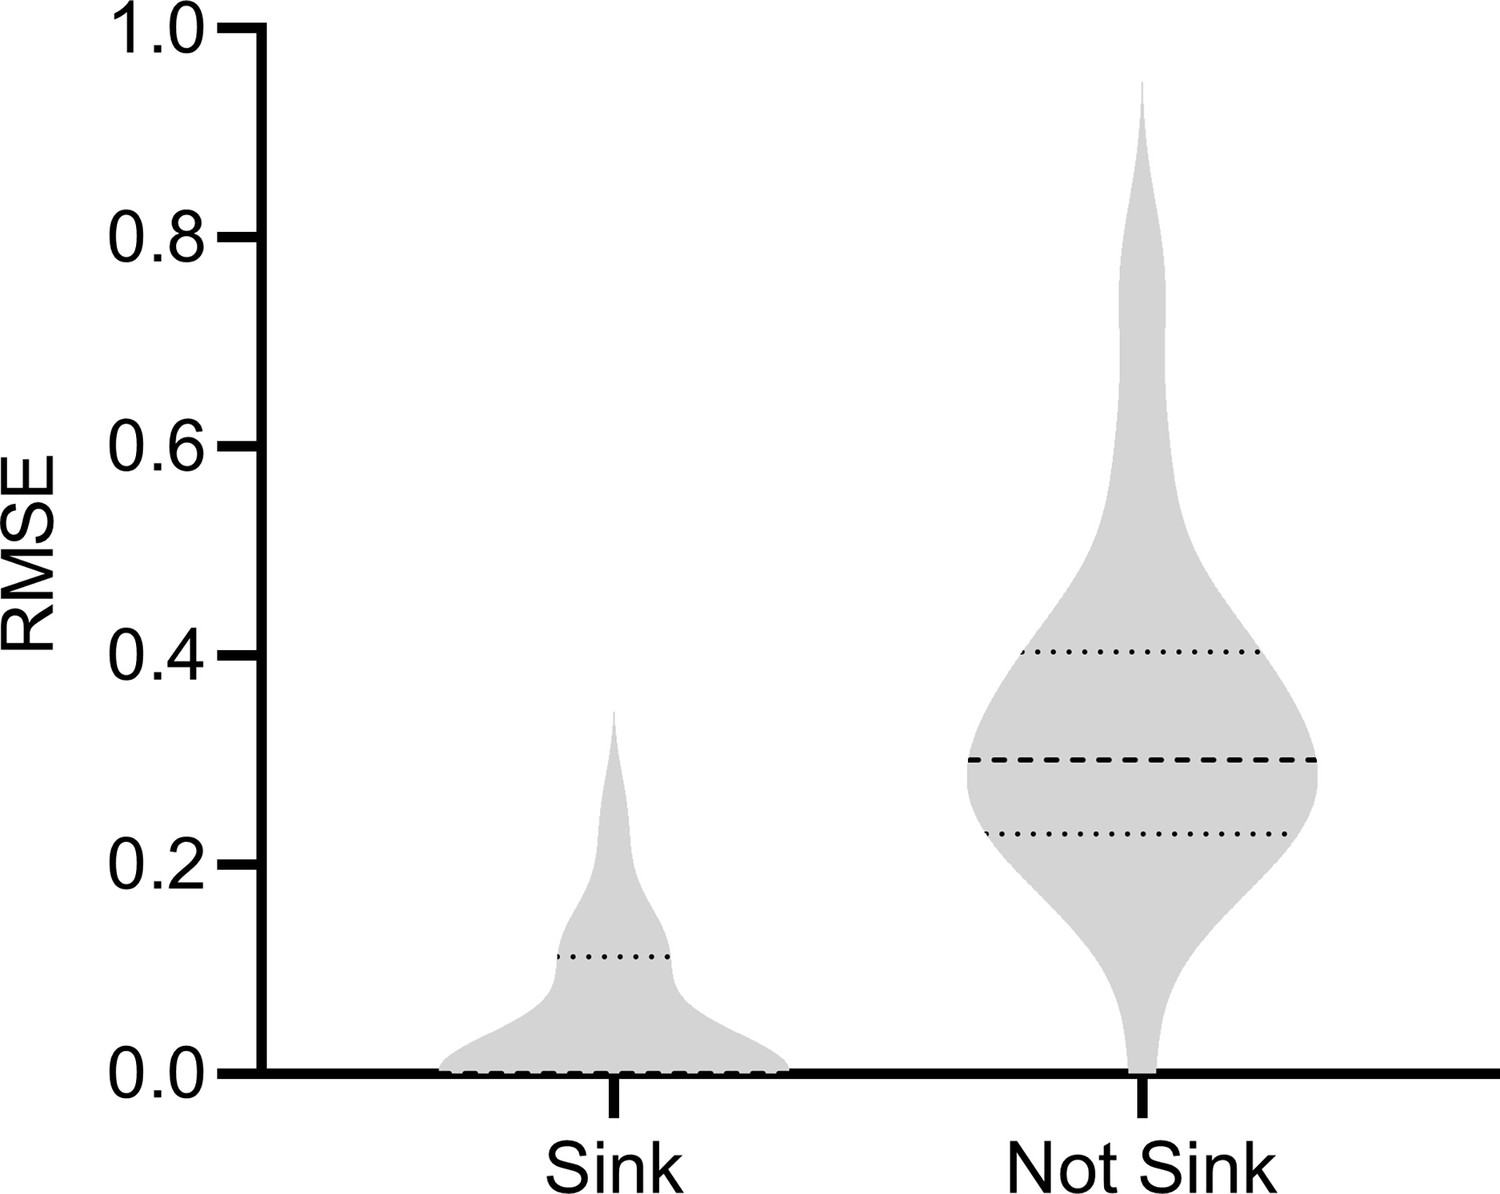
Results with a sink or non-sink target .
RCSP estimated the RCS scores less accurately with a non-sink target indicating that the algorithm is sensitive to violations of the sink target assumption.
Appendix 1—figure 6
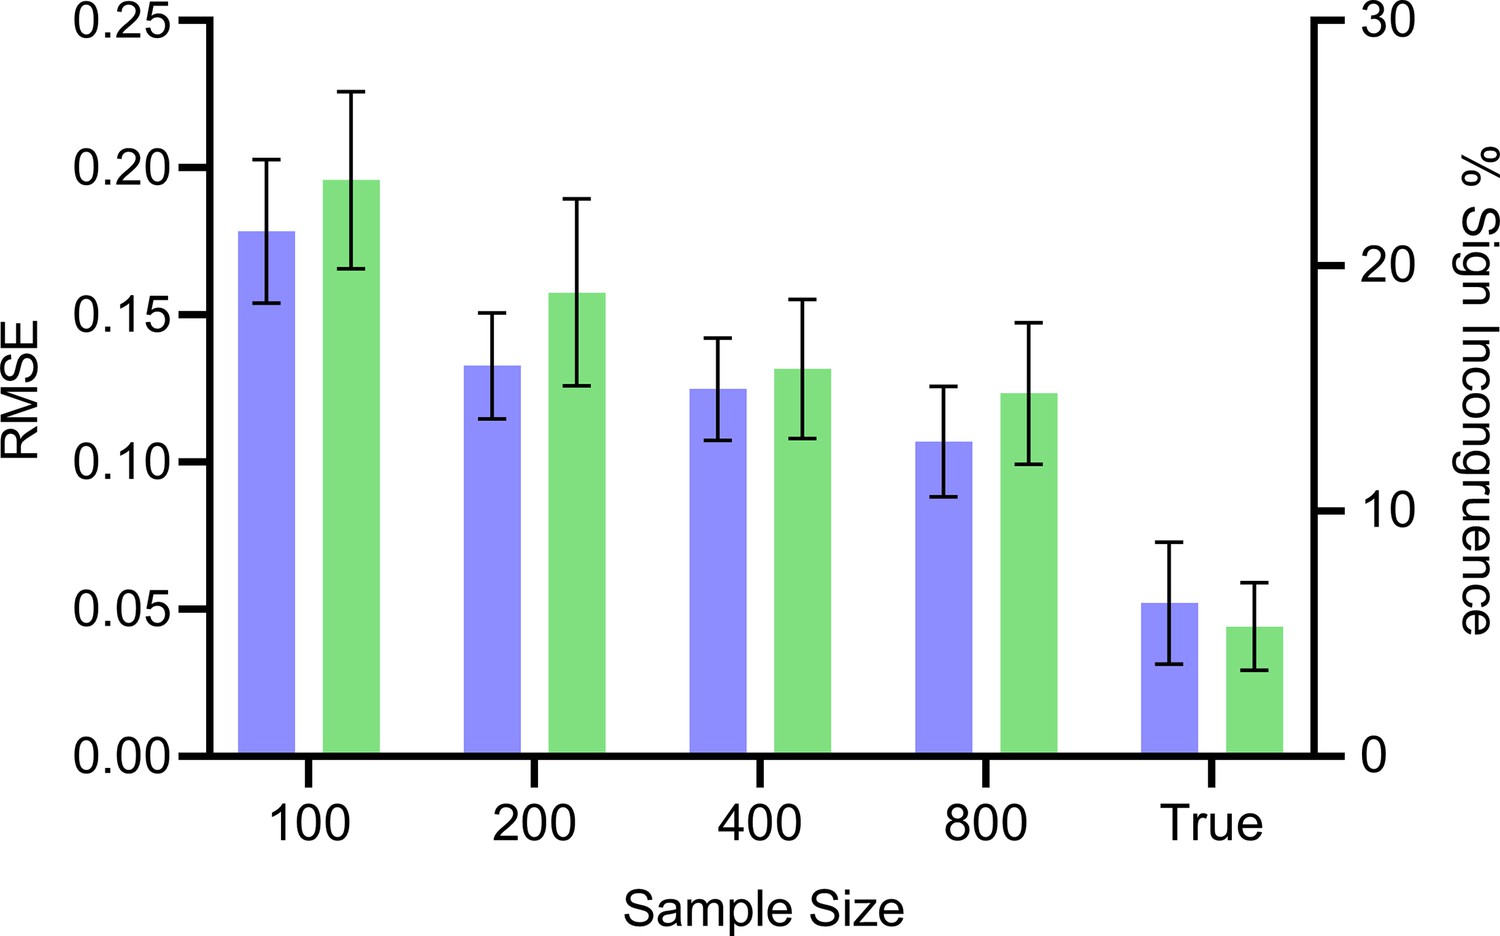
Mean RMSE (blue, left) and percent sign incongruence (green, right) of the expected root causal effects and signed RCS values, respectively.
The RMSE continues to decrease with increasing sample size but reaches a floor of around 0.05. Similarly, the percent sign incongruence decreases but reaches a floor of around 5%. Error bars denote 95% confidence intervals of the mean over 100 datasets.
Appendix 1—figure 7
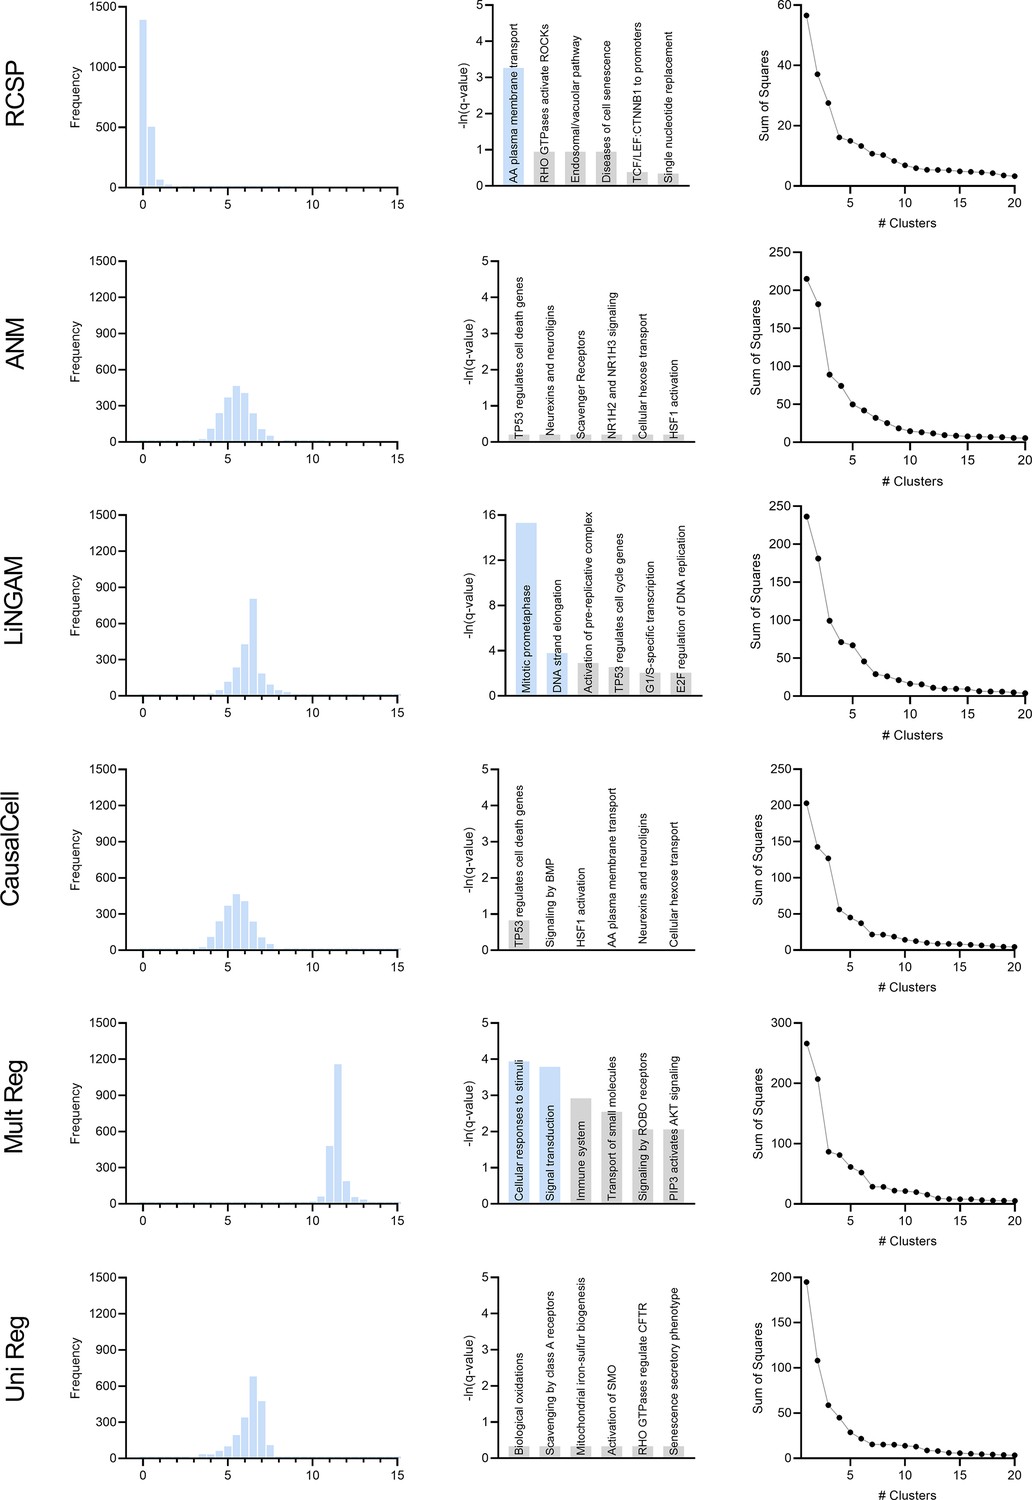
Comparison of the algorithms in age-related macular degeneration.
Appendix 1—figure 8
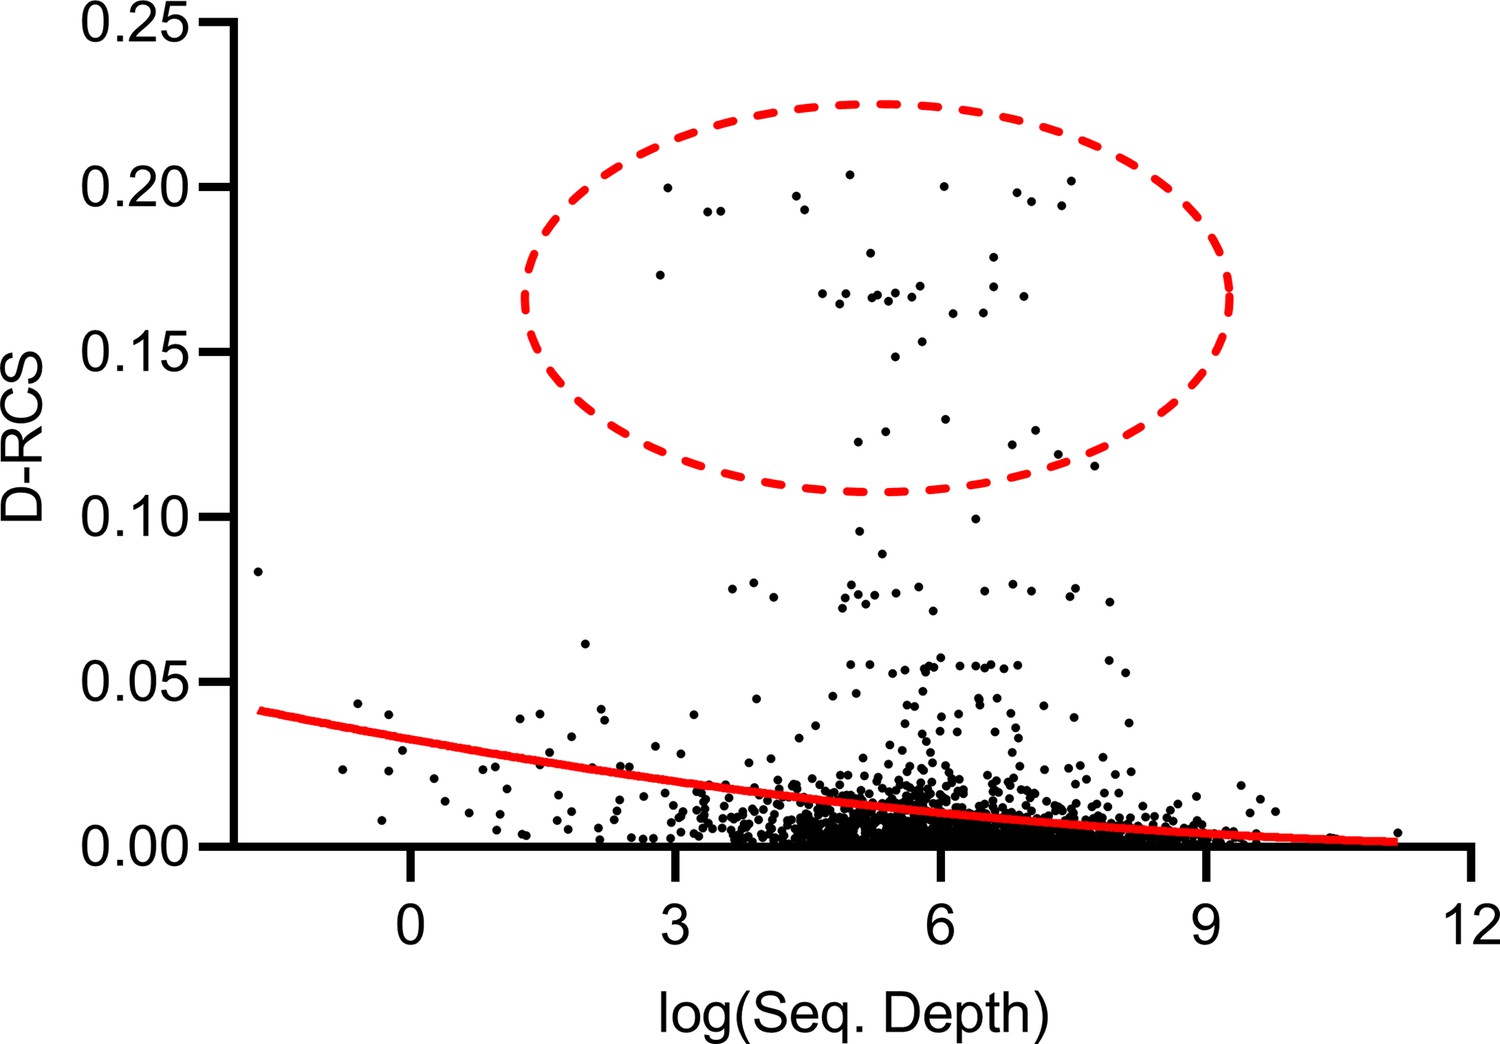
Mean sequencing depth of each gene plotted against their D-RCS scores in AMD.
Genes with the largest D-RCS scores (red ellipse) had a variety of sequencing depths.
Appendix 1—figure 9
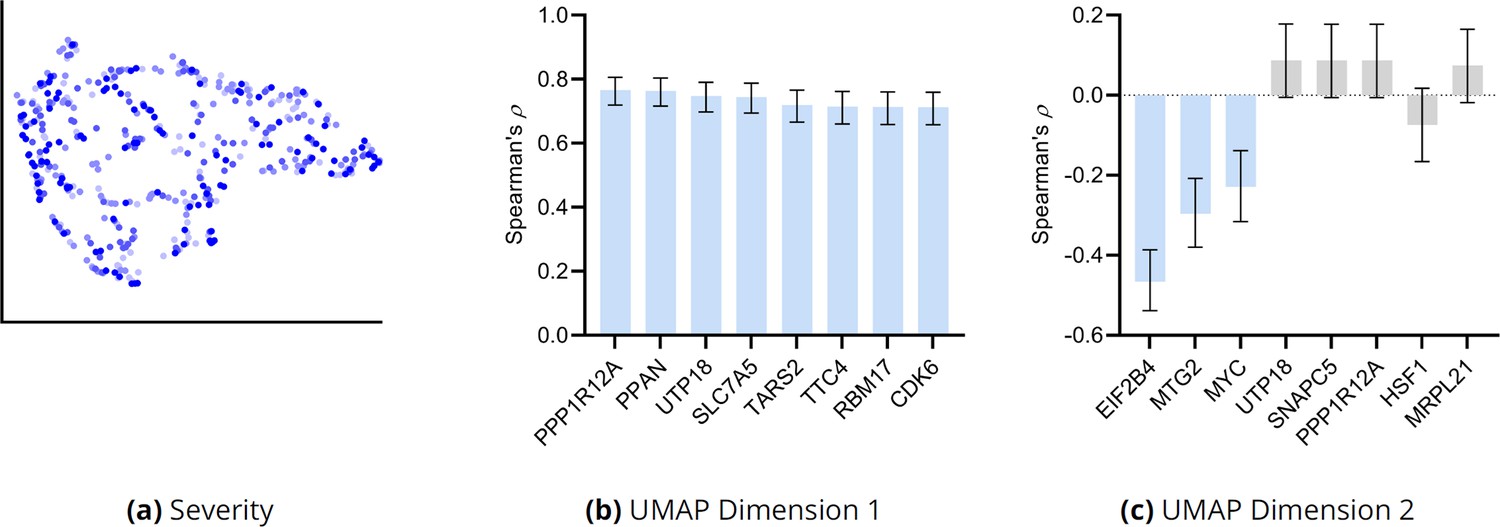
Additional UMAP embedding results for AMD.
(a) The UMAP dimensions did not correlate with AMD severity as assessed by the MGS score. Many genes correlated with the first UMAP dimension in (b), but only three genes correlated with the second UMAP dimension in (c). Blue bars passed an FDR threshold of 5%, error bars denote 95% confidence intervals, and the sample size corresponded to 513 individuals.
Appendix 1—figure 10
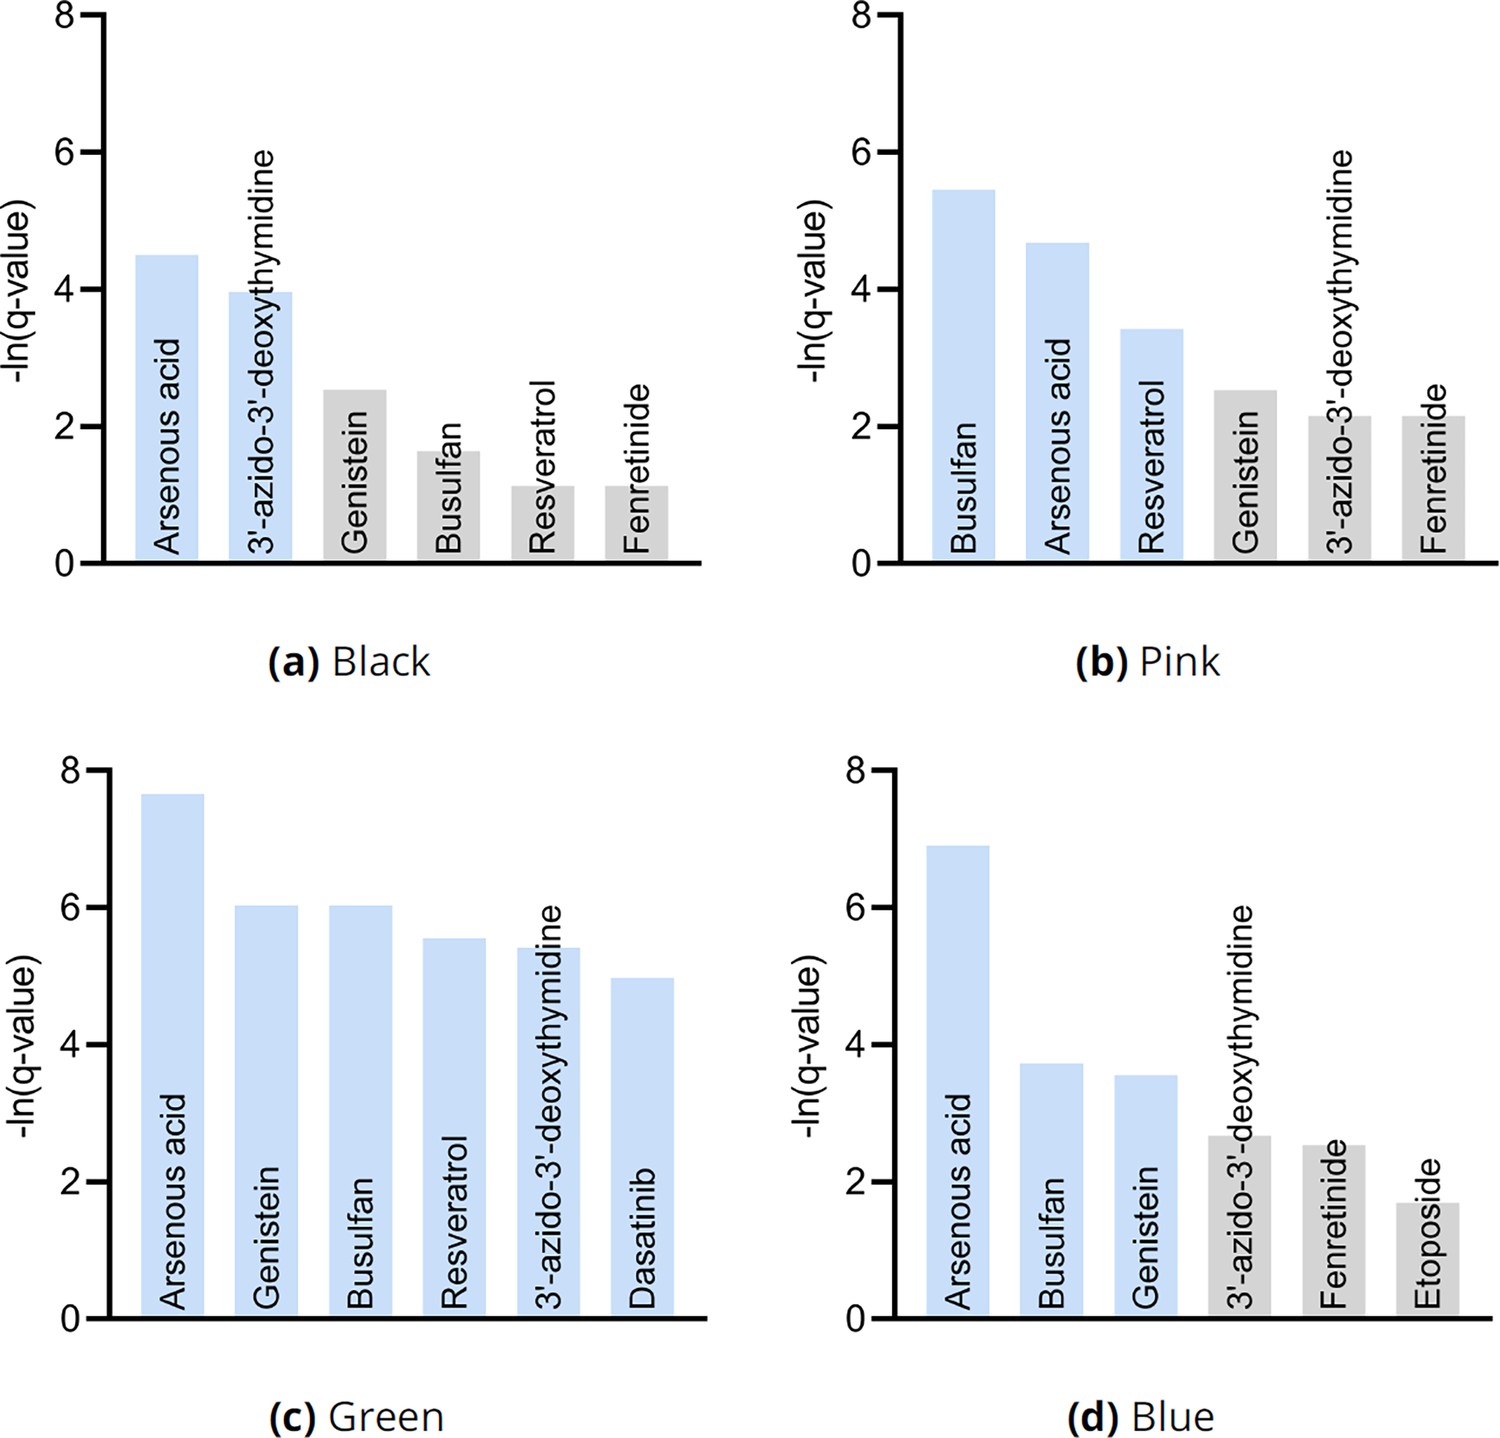
Drug enrichment analysis results by cluster in Figure 3g.
The analyses recovered similar drugs across clusters, but the results for the green cluster in (c) were supra-significant.
Appendix 1—figure 11
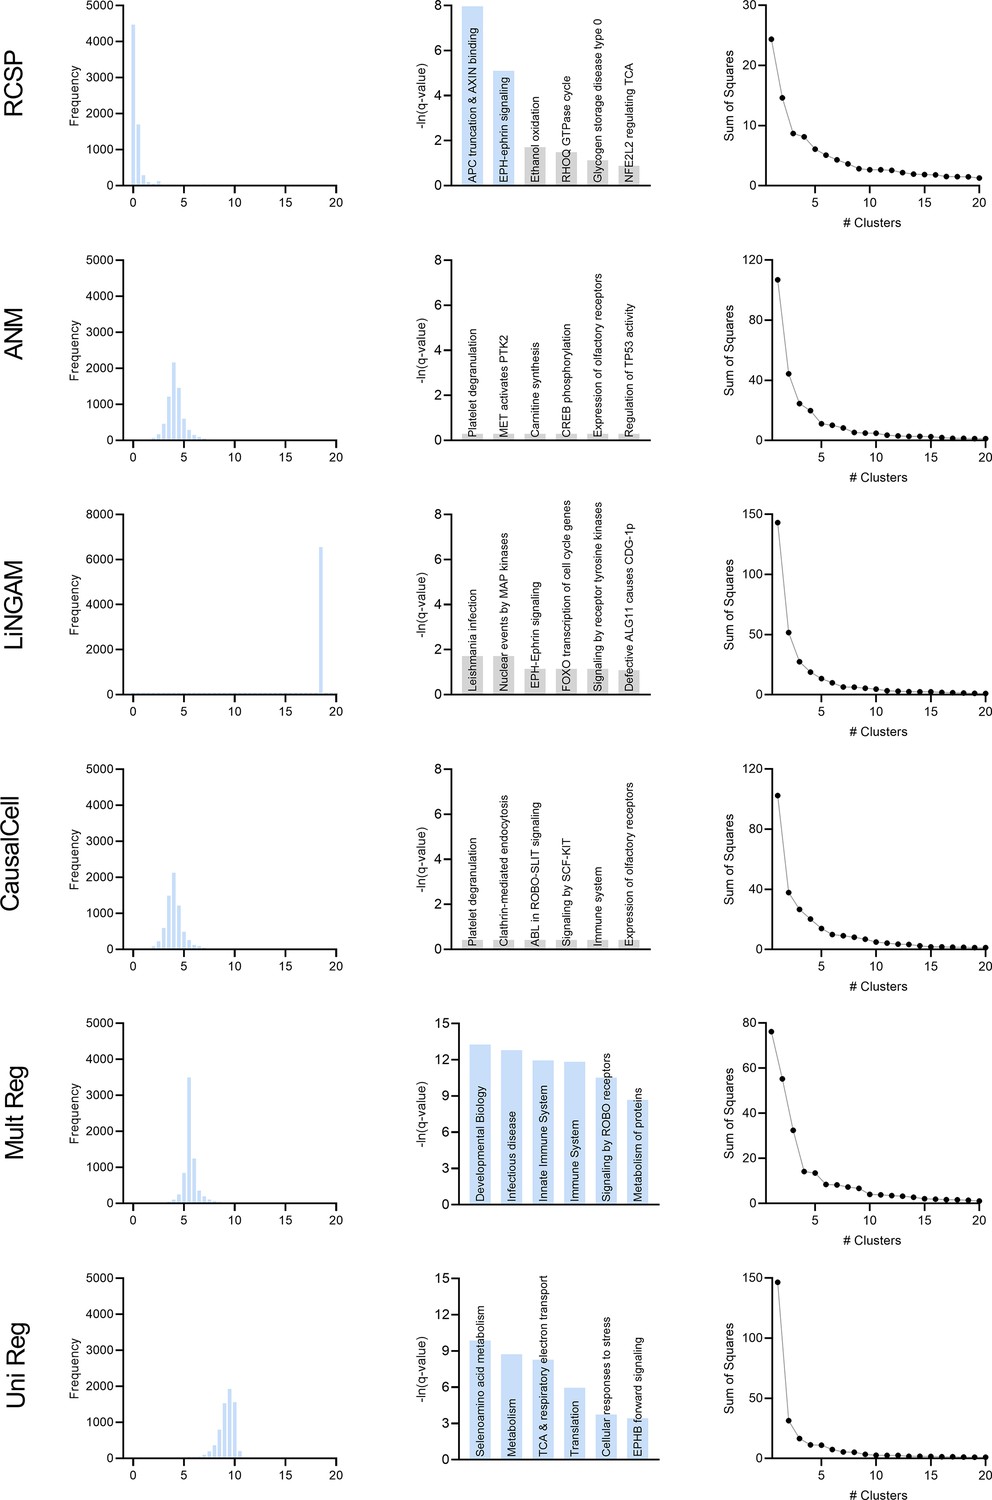
Comparison of the algorithms in multiple sclerosis.
Appendix 1—figure 12
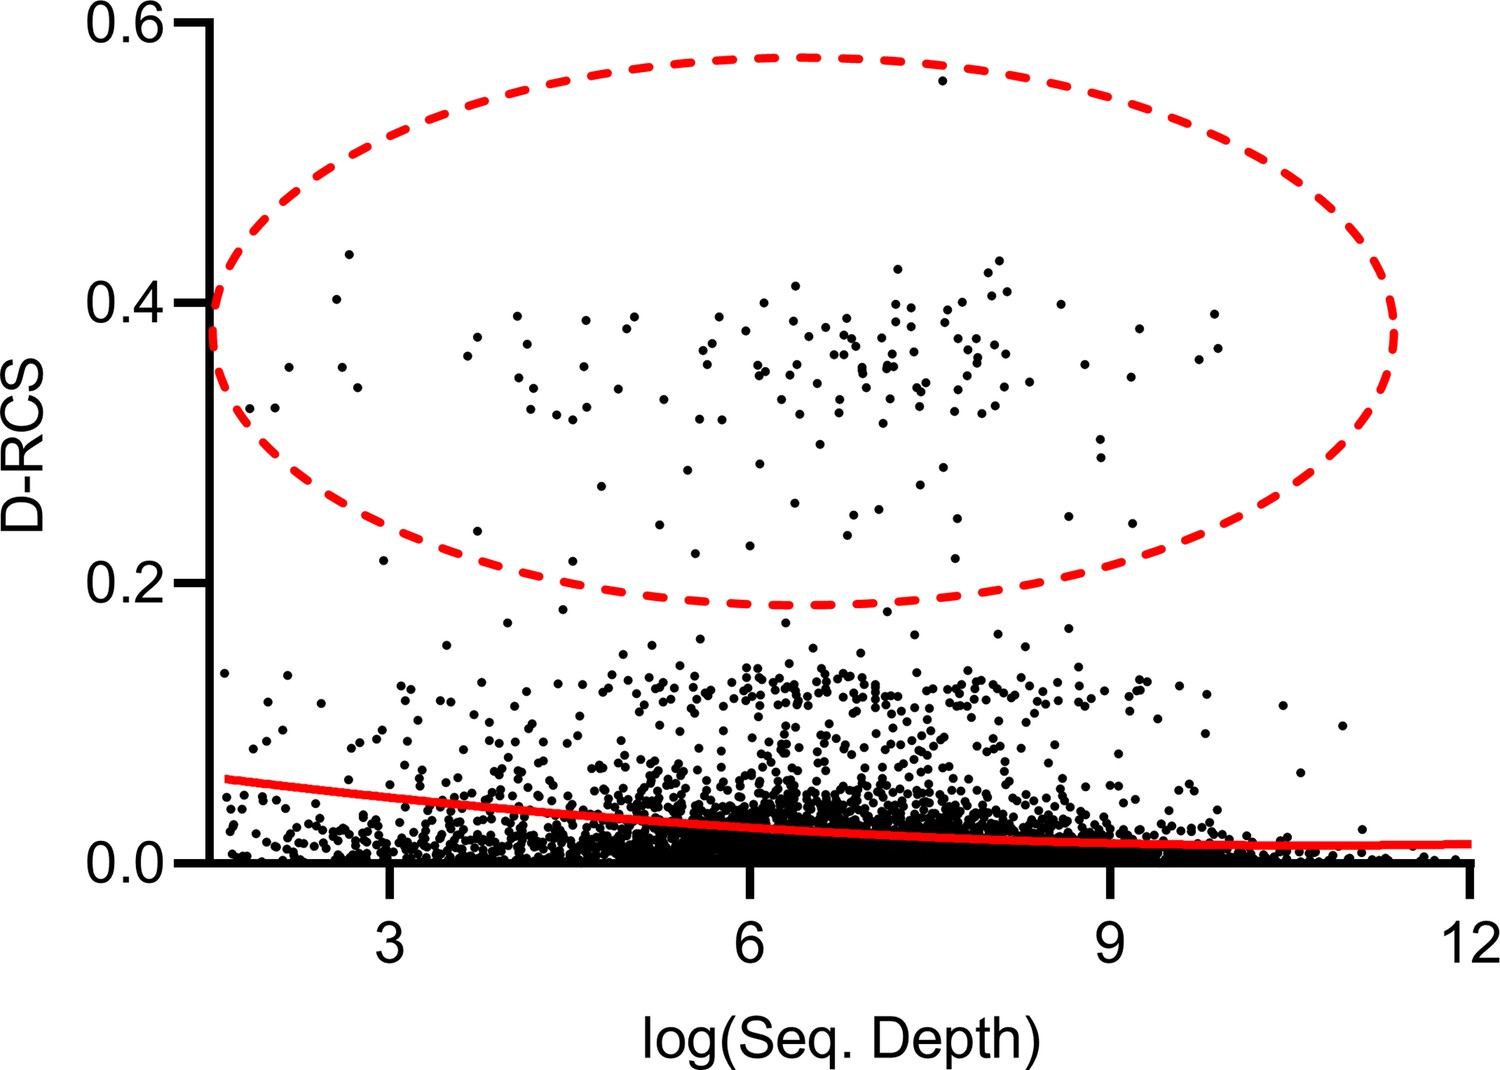
Mean sequencing depth of each gene plotted against their D-RCS scores in MS.
Genes with the largest D-RCS scores (red ellipse) again had a variety of sequencing depths.
Appendix 1—figure 13
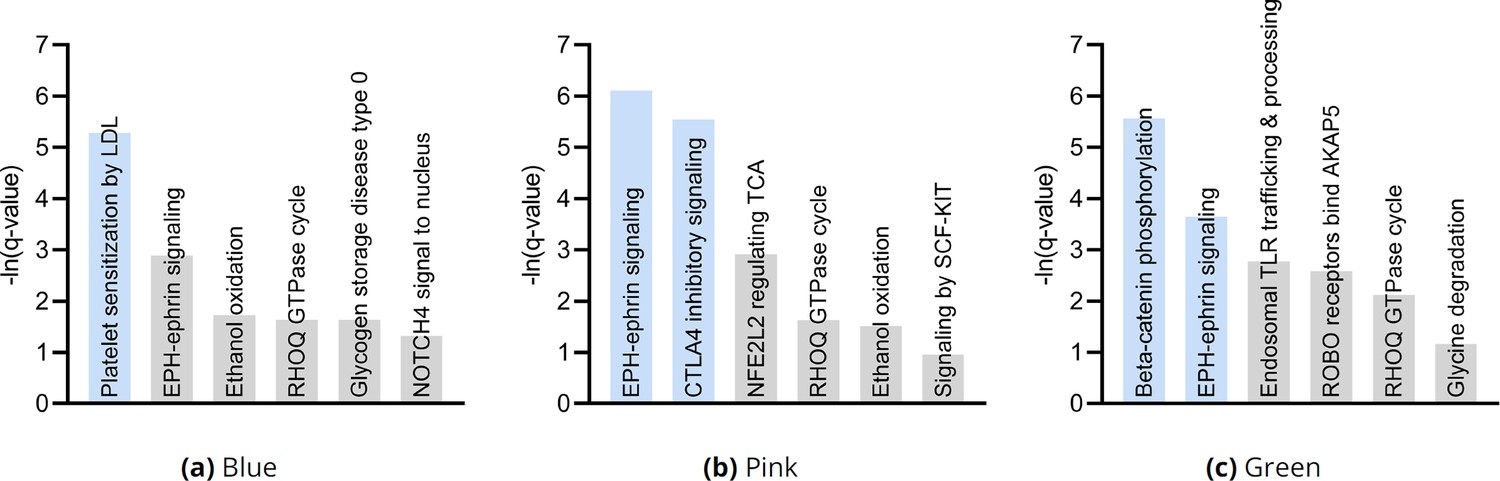
Pathway enrichment analysis results by cluster consistently revealed EPH-ephrin signaling as well as an additional pathway implicating T cell pathology.
Appendix 1—figure 14
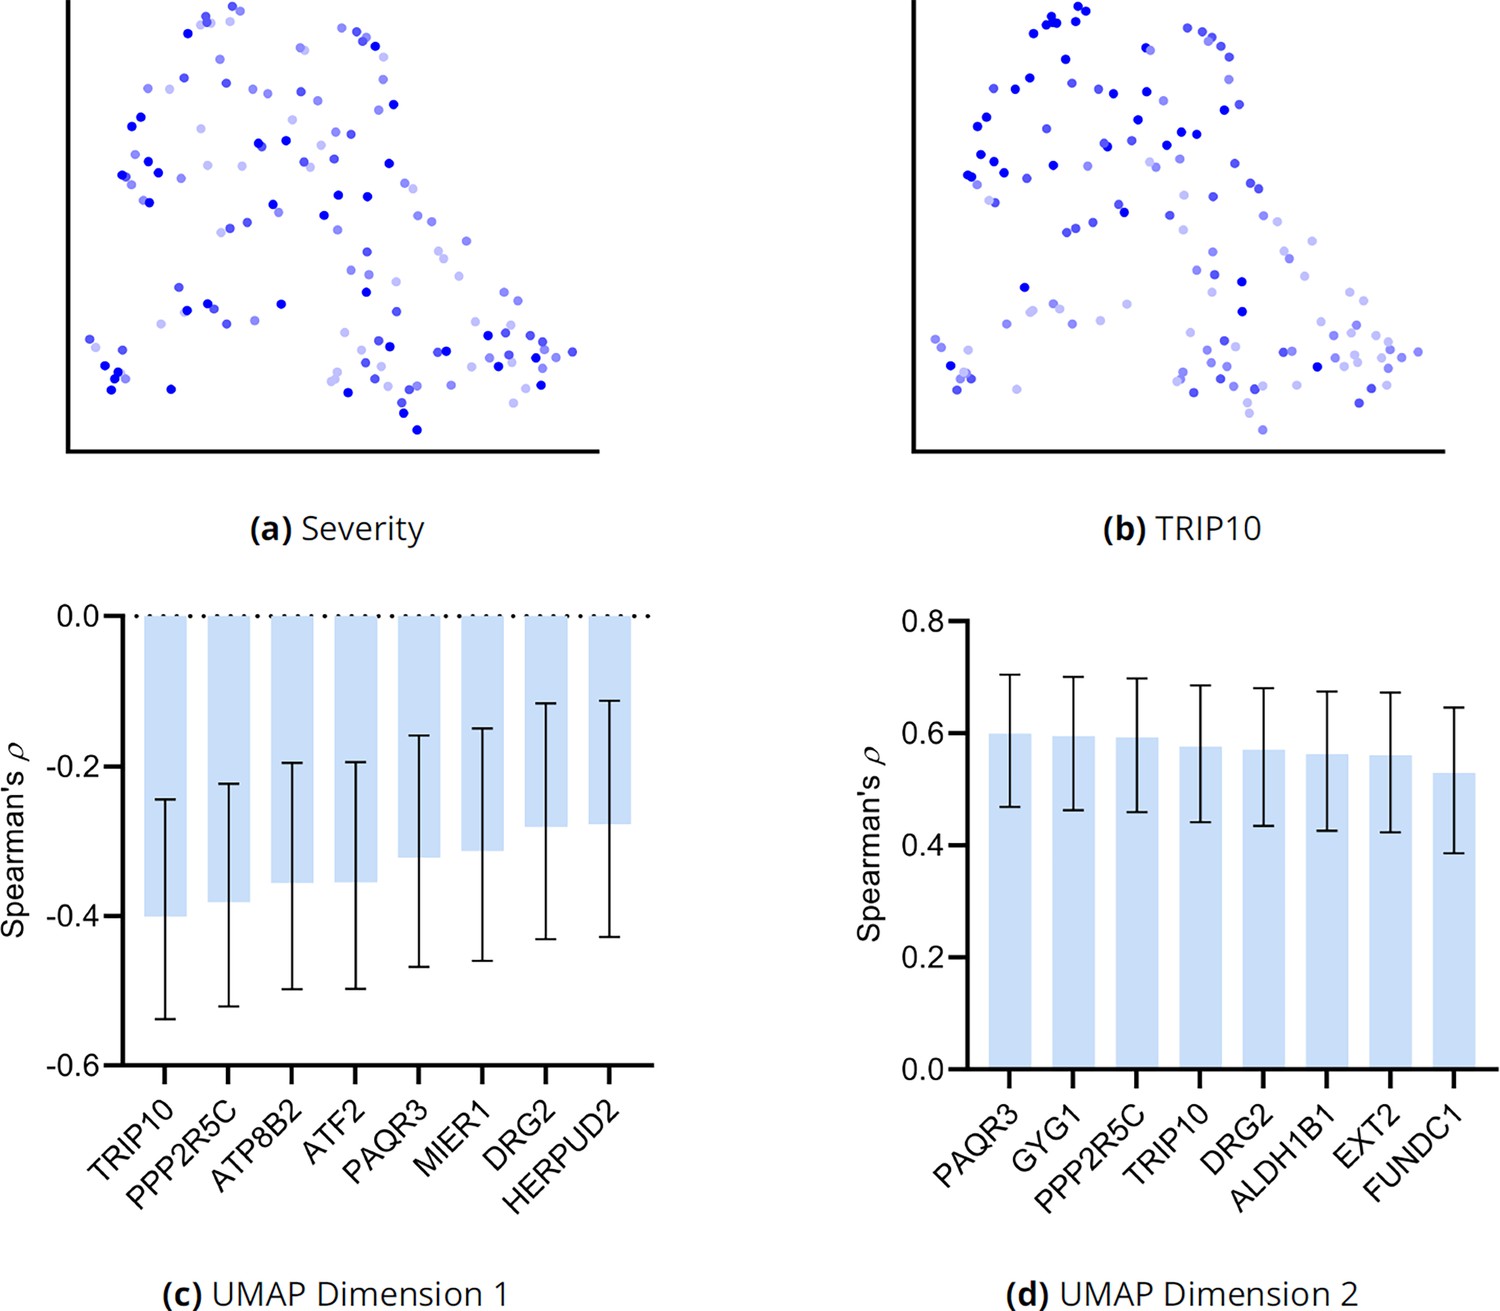
Additional analyses of the UMAP embedding for MS.
(a) The UMAP dimensions did not correlate with MS severity as assessed by EDSS. However, lower ranked genes such as TRIP10 correlated with both dimensions in (b). We expanded the analysis to the top 30 genes and plot the genes with the highest correlations to UMAP dimension one and two in (c) and (d), respectively. Error bars denote 95% confidence intervals, and the sample size corresponded to 137 individuals.
Tables
Appendix 1—table 1
Full pathway enrichment analysis results for all patients in the AMD dataset.
We list the Entrez gene IDs of up to the top three leading edge genes in the right-most column.
| Pathway | p-value | q-value | Effect Size | Leading Edge |
|---|---|---|---|---|
| Amino acid transport across the plasma membrane | 2.44e-05 | 0.038 | 0.995 | 81,406,510 |
| RHO GTPases Activate ROCKs | 2.09e-03 | 0.388 | 0.976 | 46,595,500 |
| Endosomal/Vacuolar pathway | 2.32e-03 | 0.388 | 0.998 | 3107 |
| Diseases of Cellular Senescence | 2.97e-03 | 0.388 | 0.997 | 1021 |
| Binding of TCF/LEF:CTNNB1 to target gene promoters | 6.52e-03 | 0.68 | 0.993 | 4609 |
| APEX1-Indep. Resolution of AP Sites via Nucleotide Replacement | 7.28e-03 | 0.712 | 0.980 | 112,847,515 |
| MASTL Facilitates Mitotic Progression | 1.59e-02 | 0.978 | 0.911 | 84,930,983 |
| PI5P Regulates TP53 Acetylation | 1.94e-02 | 0.978 | 0.980 | 79837 |
| Formation of Incision Complex in GG-NER | 2.24e-02 | 0.978 | 0.791 | 296,699,782,967 |
| Glycine degradation | 2.24e-02 | 0.978 | 0.977 | 1738 |
| Prefoldin mediated transfer of substrate to CCT/TriC | 3.96e-02 | 0.978 | 0.787 | 5,203,520,110,576 |
Appendix 1—table 2
Full pathway enrichment analysis results for all patients in the MS dataset.
We again list up to the top three leading edge genes in the right-most column.
| Pathway | p-value | q-value | Effect Size | Leading Edge |
|---|---|---|---|---|
| APC truncation mutants have impaired AXIN binding | 1.91e-06 | 3.45E-04 | 0.960 | 55,255,527 |
| EPH-ephrin signaling | 4.23e-05 | 6.12E-03 | 0.826 | 88,741,028,976 |
| Ethanol oxidation | 2.02e-03 | 0.182 | 0.967 | 219,128 |
| RHOQ GTPase cycle | 2.72e-03 | 0.226 | 0.793 | 9,322,887,410,395 |
| Glycogen storage disease type 0 (muscle GYS1) | 2.72e-03 | 0.322 | 0.996 | 2992 |
| NFE2L2 regulating TCA cycle genes | 6.31e-03 | 0.414 | 0.970 | 41,993,417 |
| C6 deamination of adenosine | 7.42e-03 | 0.414 | 0.981 | 103,104 |
| Ion channel transport | 7.63e-03 | 0.414 | 0.728 | 5,719,854,055,515 |
| Synthesis of IP3 and IP4 in the cytosol | 7.63e-03 | 0.414 | 0.904 | 363,380,523,236 |
| Diseases associated with glycosaminoglycan metabolism | 8.21e-03 | 0.414 | 0.894 | 2,132,112,853,339 |
| Signaling by SCF-KIT | 8.67e-03 | 0.414 | 0.794 | 700,655,783,815 |
Additional files
Download links
A two-part list of links to download the article, or parts of the article, in various formats.
Downloads (link to download the article as PDF)
Open citations (links to open the citations from this article in various online reference manager services)
Cite this article (links to download the citations from this article in formats compatible with various reference manager tools)
Discovering root causal genes with high-throughput perturbations
eLife 13:RP100949.
https://doi.org/10.7554/eLife.100949.3


