Capsular polysaccharide restrains type VI secretion in Acinetobacter baumannii
- Laboratory of Molecular Microbiology, Global Health Institute, School of Life Sciences, Ecole Polytechnique Fédérale de Lausanne, Switzerland
- Bioelectron Microscopy Core Facility, School of Life Sciences, Station 19, EPFL-SV-PTBIOEM, Ecole Polytechnique Fédérale de Lausanne, Switzerland
Figures
Figure 1 with 1 supplement
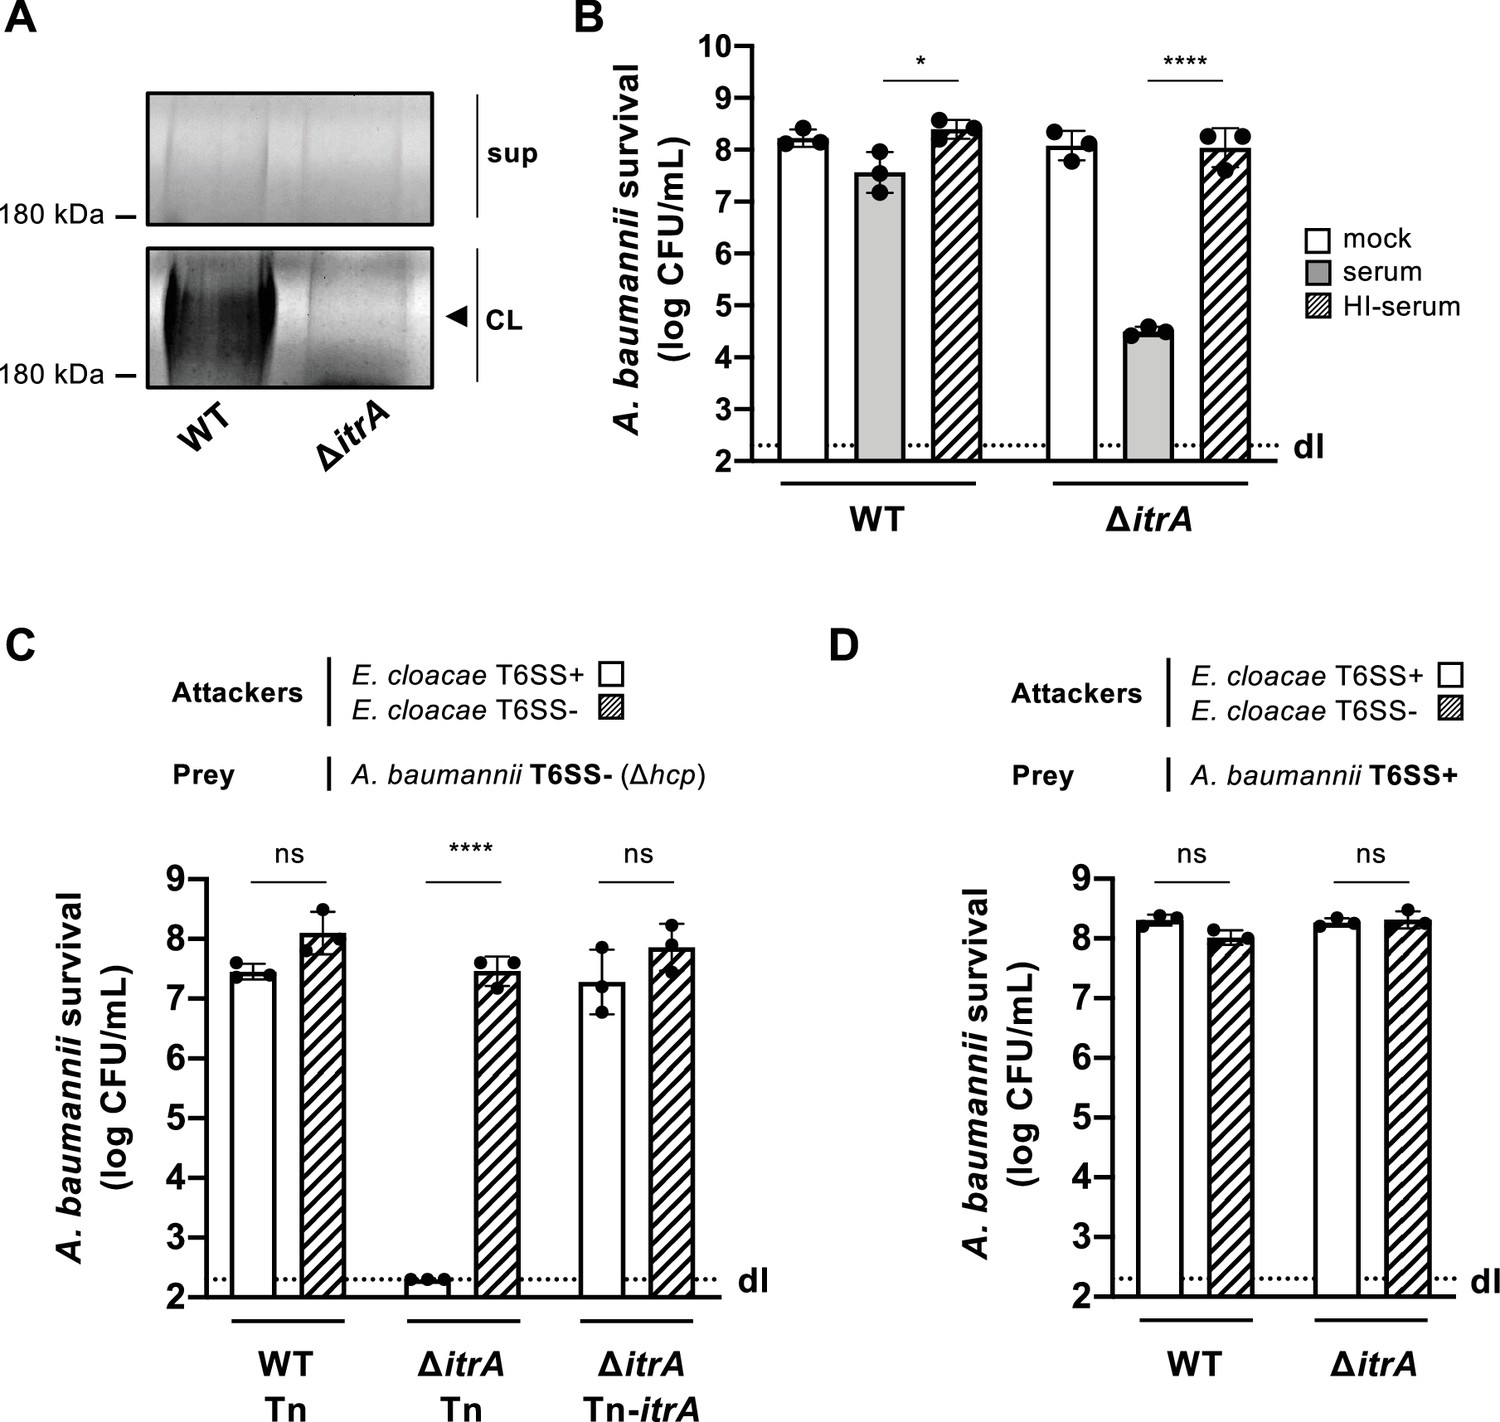
Capsular polysaccharide protects A. baumannii against external T6SS assaults.
(A) Analysis of polysaccharides in the cell lysate (CL) and supernatant (sup) of wild-type (WT) or capsule-deficient (ΔitrA) strains of A. baumannii, separated by SDS–PAGE and stained with Alcian blue. The arrowhead indicates the polysaccharide band. (B) Protection against complement-mediated killing. Exponential growth cultures of WT and ΔitrA strains were incubated for 1 hr with PBS (mock), complement-containing serum (serum), or heat-inactivated serum (HI-serum). Following treatment, the cultures were serially diluted and plated on LB agar to quantify colony-forming units (CFU), as shown on the Y-axis. (C, D) Capsule-dependent survival against T6SS assaults. T6SS-negative (Δhcp) (C) or T6SS-positive (D) strains of A. baumannii were co-incubated with T6SS+ (white bars) or T6SS− (dashed bars) Enterobacter cloacae. Strains were either capsulated (WT background) or non-capsulated (ΔitrA background). In panel (C), capsulation was restored by provision of PBAD-itrA on a miniTn7 transposon (Tn-itrA) and provision of 2% arabinose. Tn is shown for WT and mutant strains containing the transposon without a specific cargo gene. A. baumannii survival was quantified and is shown on the Y-axis. The data represent means from three independent experiments with individual values shown by the circles (± SD, indicated by error bars). Statistical significance was assessed using an ordinary one-way ANOVA test. *p < 0.05, ****p < 0.0001, ns = not significant. Detection limits (dl) were noted where applicable.
-
Figure 1—source data 1
PDF file containing the original gels for Figure 1A, indicating the relevant bands.
- https://cdn.elifesciences.org/articles/101032/elife-101032-fig1-data1-v2.pdf
-
Figure 1—source data 2
Original files for gels displayed in Figure 1A.
- https://cdn.elifesciences.org/articles/101032/elife-101032-fig1-data2-v2.zip
Figure 1—figure supplement 1
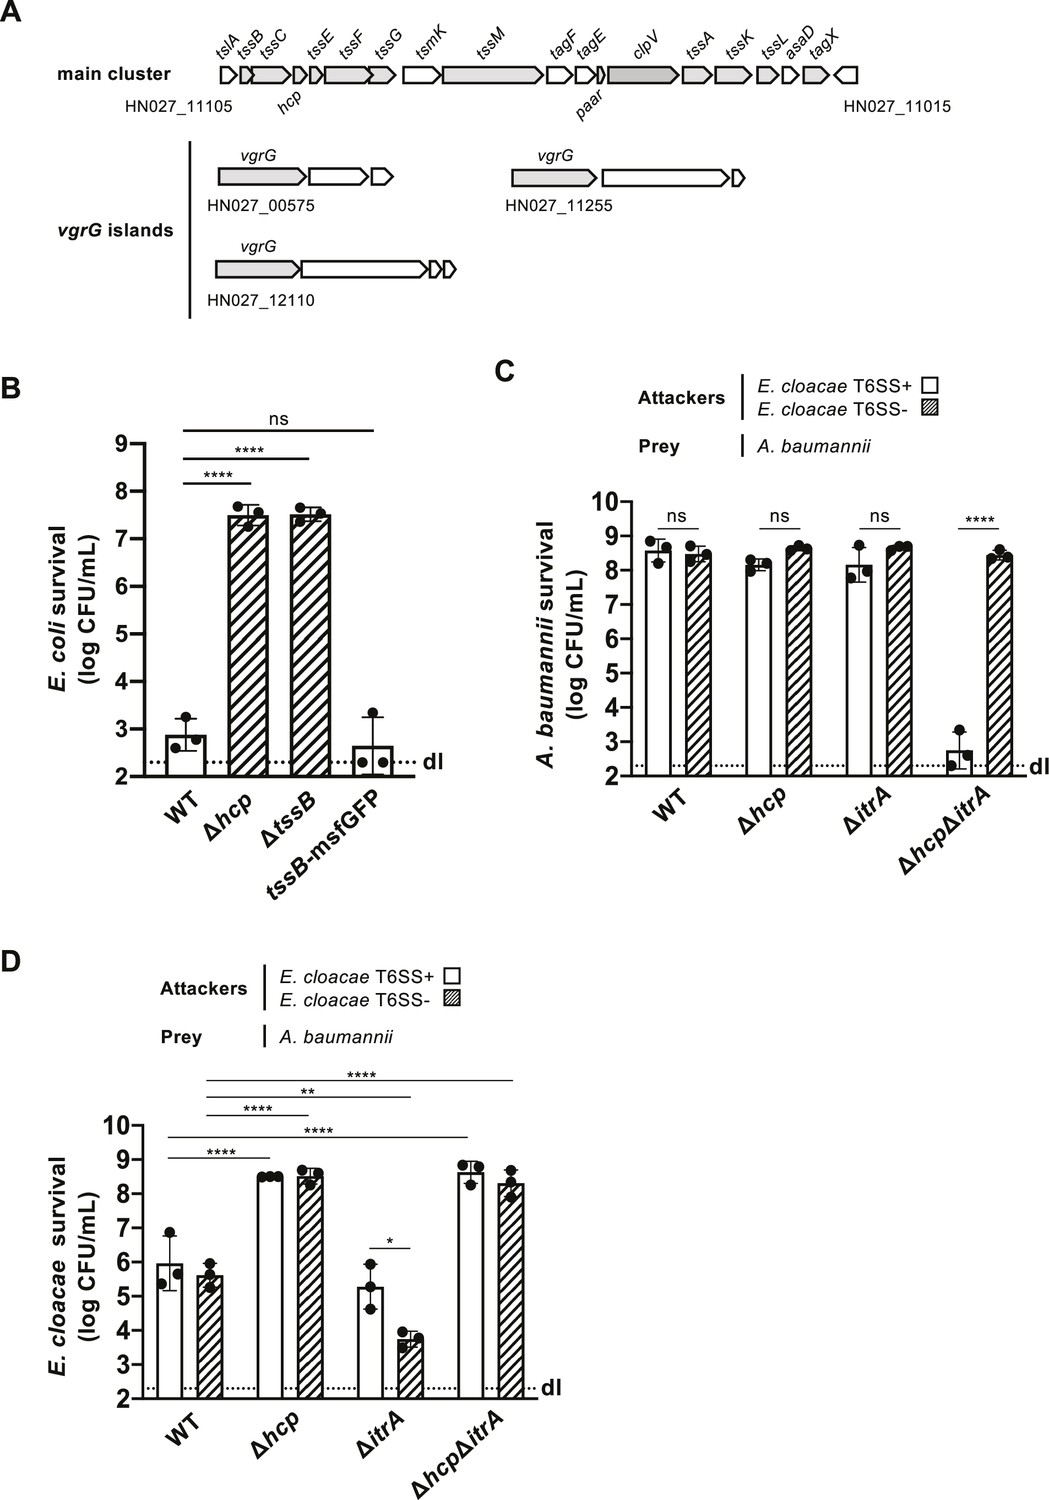
A. baumannii strain A118 produces functional T6SS.
(A) Illustration of the T6SS gene arrangement in A. baumannii strain A118. The core components of the T6SS are highlighted in gray. (B) Survival of E. coli following interaction with wild-type (WT) (strain A118), the two T6SS-inactive mutants (Δhcp and ΔtssB), or the TssB translational fusion-carrying strain (tssB-msfGFP) of A. baumannii. Survival rates are presented on the Y-axis. (C, D) A. baumannii kills E. cloacae in a T6SS-dependent manner. (C) Survival of capsulated (WT), T6SS-inactive (Δhcp), non-capsulated (ΔitrA), or T6SS-inactive and non-capsulated (ΔhcpΔitrA) A. baumannii after co-incubation with T6SS+ (white bars) or T6SS− (dashed bars) E. cloacae. Survival rates for E. cloacae are shown as in panel (D). Data points are from three independent experiments, with bars indicating mean values (± SD, depicted by error bars). Statistical significance was determined using an ordinary one-way ANOVA test. *p < 0.05, **p < 0.01, ****p < 0.0001, ns = not significant. The detection limit (dl) is indicated.
Figure 2
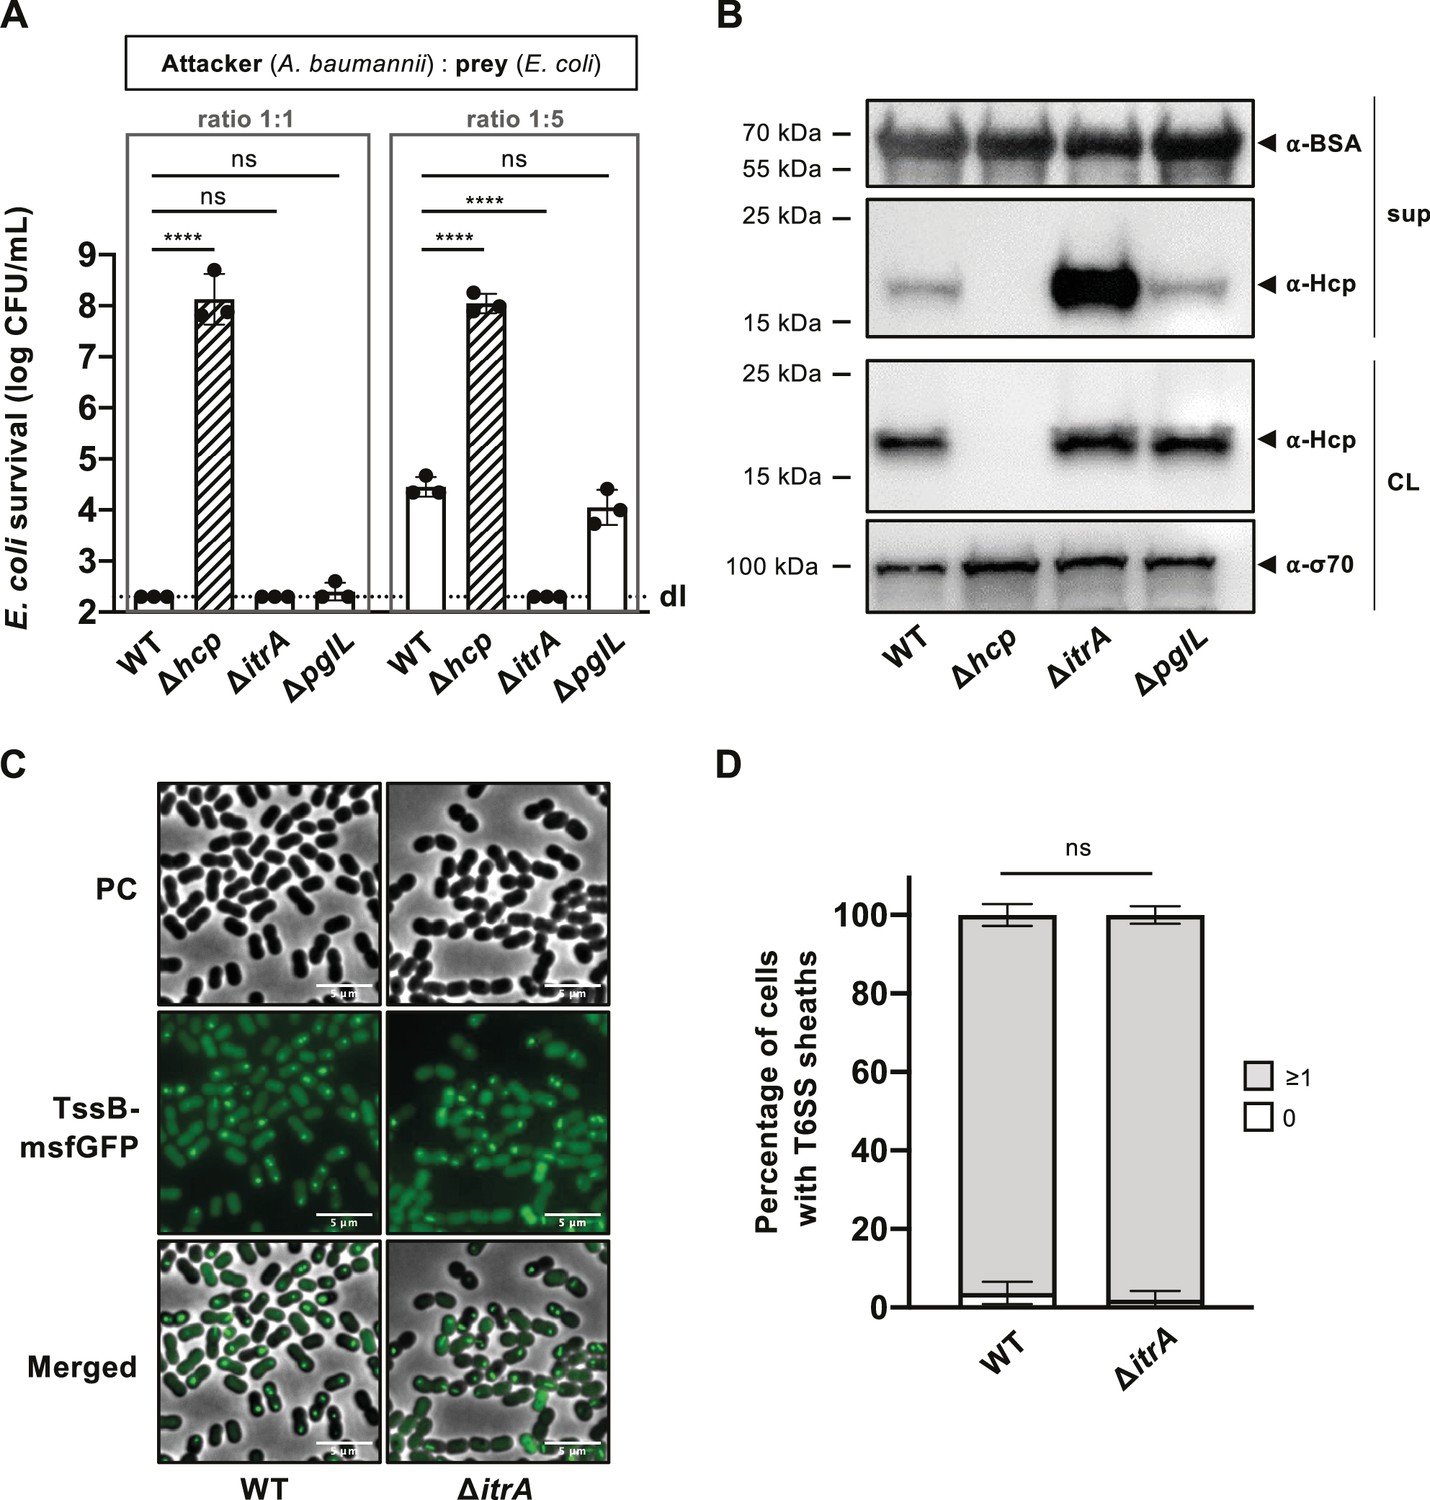
Capsular polysaccharide (CPS) interferes with T6SS activity.
(A) Non-capsulated strains show increased T6SS killing-mediated activity. Survival of E. coli after encountering capsulated (wild-type, WT), T6SS-inactive (Δhcp), non-capsulated (ΔitrA), or O-glycosylation (ΔpglL) mutant A. baumannii, with different attacker-to-prey ratios as indicated. Survival rates are shown as on the Y-axis. (B) Analysis of Hcp production and secretion in the strains mentioned in (A). Cell lysates (CL) and culture supernatants (sup) were tested through immunoblotting, using antibodies against Hcp (α-Hcp). The loading control (α-σ70) confirms equal amounts of the CL. BSA was added to supernatants and detected with α-BSA antibodies as a precipitation control. The data is representative of three independent experiments. (C) Fluorescence light micrographs of exponentially grown A. baumannii cells, either producing (WT) or not producing (ΔitrA) CPS, with a translational fusion (msfGFP) to the T6SS sheath protein TssB. Images include phase contrast (PC), green fluorescence (TssB-msfGFP), and a merged view of both channels. Scale bar: 5 μm. (D) Quantification of T6SS assembly over 5-min time-lapses in TssB-msfGFP-carrying bacteria, comparing capsulated (WT; n = 2832 cells) and non-capsulated (ΔitrA; n = 2831 cells) cells. The Y-axis shows the percentage of cells producing T6SS structures, with cells not producing T6SS in white and those producing at least one structure in gray. Data are averages from three experiments (± SD, as defined by error bars). Statistical significance compared to WT is marked, determined via an ordinary one-way ANOVA test (A) or a two-way ANOVA test (D), with ****p < 0.0001, ns = not significant. Detection limits (dl) are indicated.
-
Figure 2—source data 1
PDF file containing original western blots for Figure 2B, indicating the relevant bands and treatments.
- https://cdn.elifesciences.org/articles/101032/elife-101032-fig2-data1-v2.pdf
-
Figure 2—source data 2
Original files for western blot analysis displayed in Figure 2B.
- https://cdn.elifesciences.org/articles/101032/elife-101032-fig2-data2-v2.zip
Figure 3 with 1 supplement
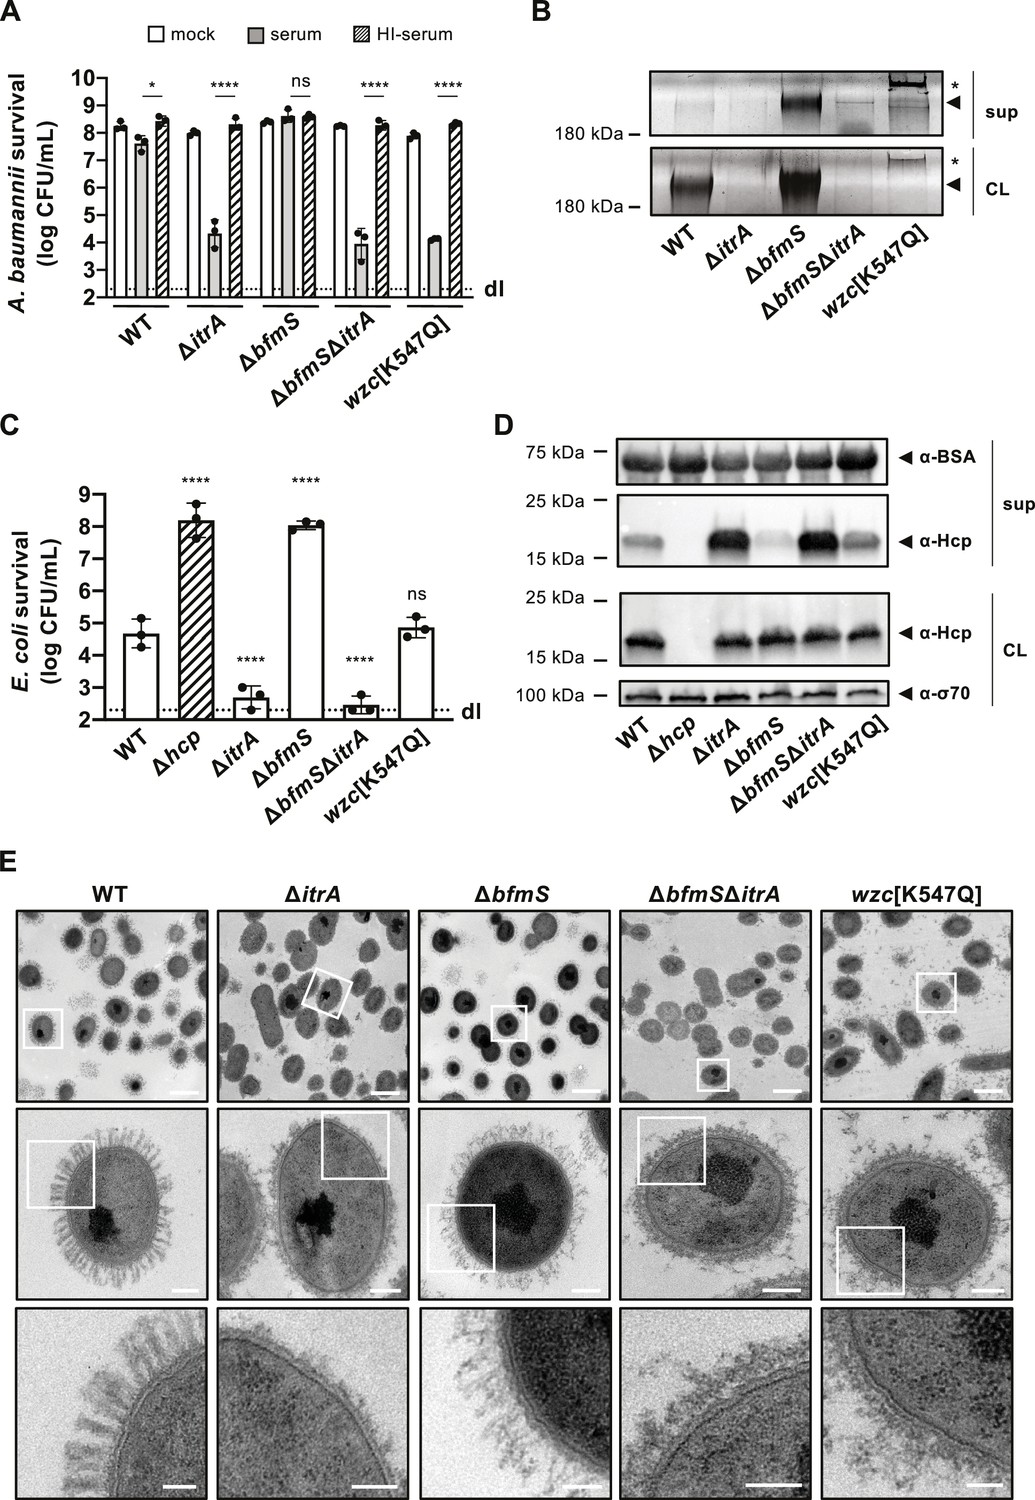
Increased capsular polysaccharide (CPS) production inhibits T6SS activity.
(A) Complement resistance assay across A. baumannii strains. The assay tested the resistance against complement-containing serum of these strains: capsulated wild-type (WT), non-capsulated (ΔitrA), capsule-overproducing (ΔbfmS), a ΔbfmSΔitrA double mutant, and a strain carrying mutated wzc (encoding Wzc[K547Q]). Details as described for Figure 1B. (B) Polysaccharide analysis in WT and variants described in panel A. Polysaccharides from cell lysate (CL) or supernatants (sup) were separated by SDS–PAGE and stained with Alcian blue. Arrowheads point to polysaccharide bands with the asterisks marking high molecular size polysaccharides. (C) Survival of E. coli prey after interaction with the A. baumannii strains described in panel (A) as attackers. A T6SS-inactive strain (Δhcp, dashed bar) was added as control. The attacker-to-prey ratio of 1:5 was used. Survival rates are indicated on the Y-axis. Details as for Figure 2A. (D) Hcp production and secretion levels of WT and mutant A. baumannii strains described in panel (A). Details as in Figure 2B. (E) Transmission electron microscopy images of WT, ΔitrA, ΔbfmS, ΔbfmSΔitrA, and wzc[K547Q] strains. White squares indicate zoomed areas. Scale bars correspond to 1, 0.2, and 0.1 μm for the top, middle, and bottom images, respectively. Data for panels (B), (D), and (E) are representative of three independent experiments. For panels (A) and (C), data points are averages from three experiments (± SD, shown by error bars). Statistical significance compared to the heat-inactive serum treatment (A) or to the WT strain (C) is noted above the charts, determined with an ordinary one-way ANOVA test. *p < 0.05, ****p < 0.0001, ns = not significant. Detection limits (dl) were noted where applicable.
-
Figure 3—source data 1
PDF file containing the original gels for Figure 3B, indicating the relevant bands.
- https://cdn.elifesciences.org/articles/101032/elife-101032-fig3-data1-v2.pdf
-
Figure 3—source data 2
Original files for gel displayed in Figure 3B.
- https://cdn.elifesciences.org/articles/101032/elife-101032-fig3-data2-v2.zip
-
Figure 3—source data 3
PDF file containing original western blots for Figure 3D, indicating the relevant bands and treatments.
- https://cdn.elifesciences.org/articles/101032/elife-101032-fig3-data3-v2.pdf
-
Figure 3—source data 4
Original files for western blot analysis displayed in Figure 3D.
- https://cdn.elifesciences.org/articles/101032/elife-101032-fig3-data4-v2.zip
Figure 3—figure supplement 1
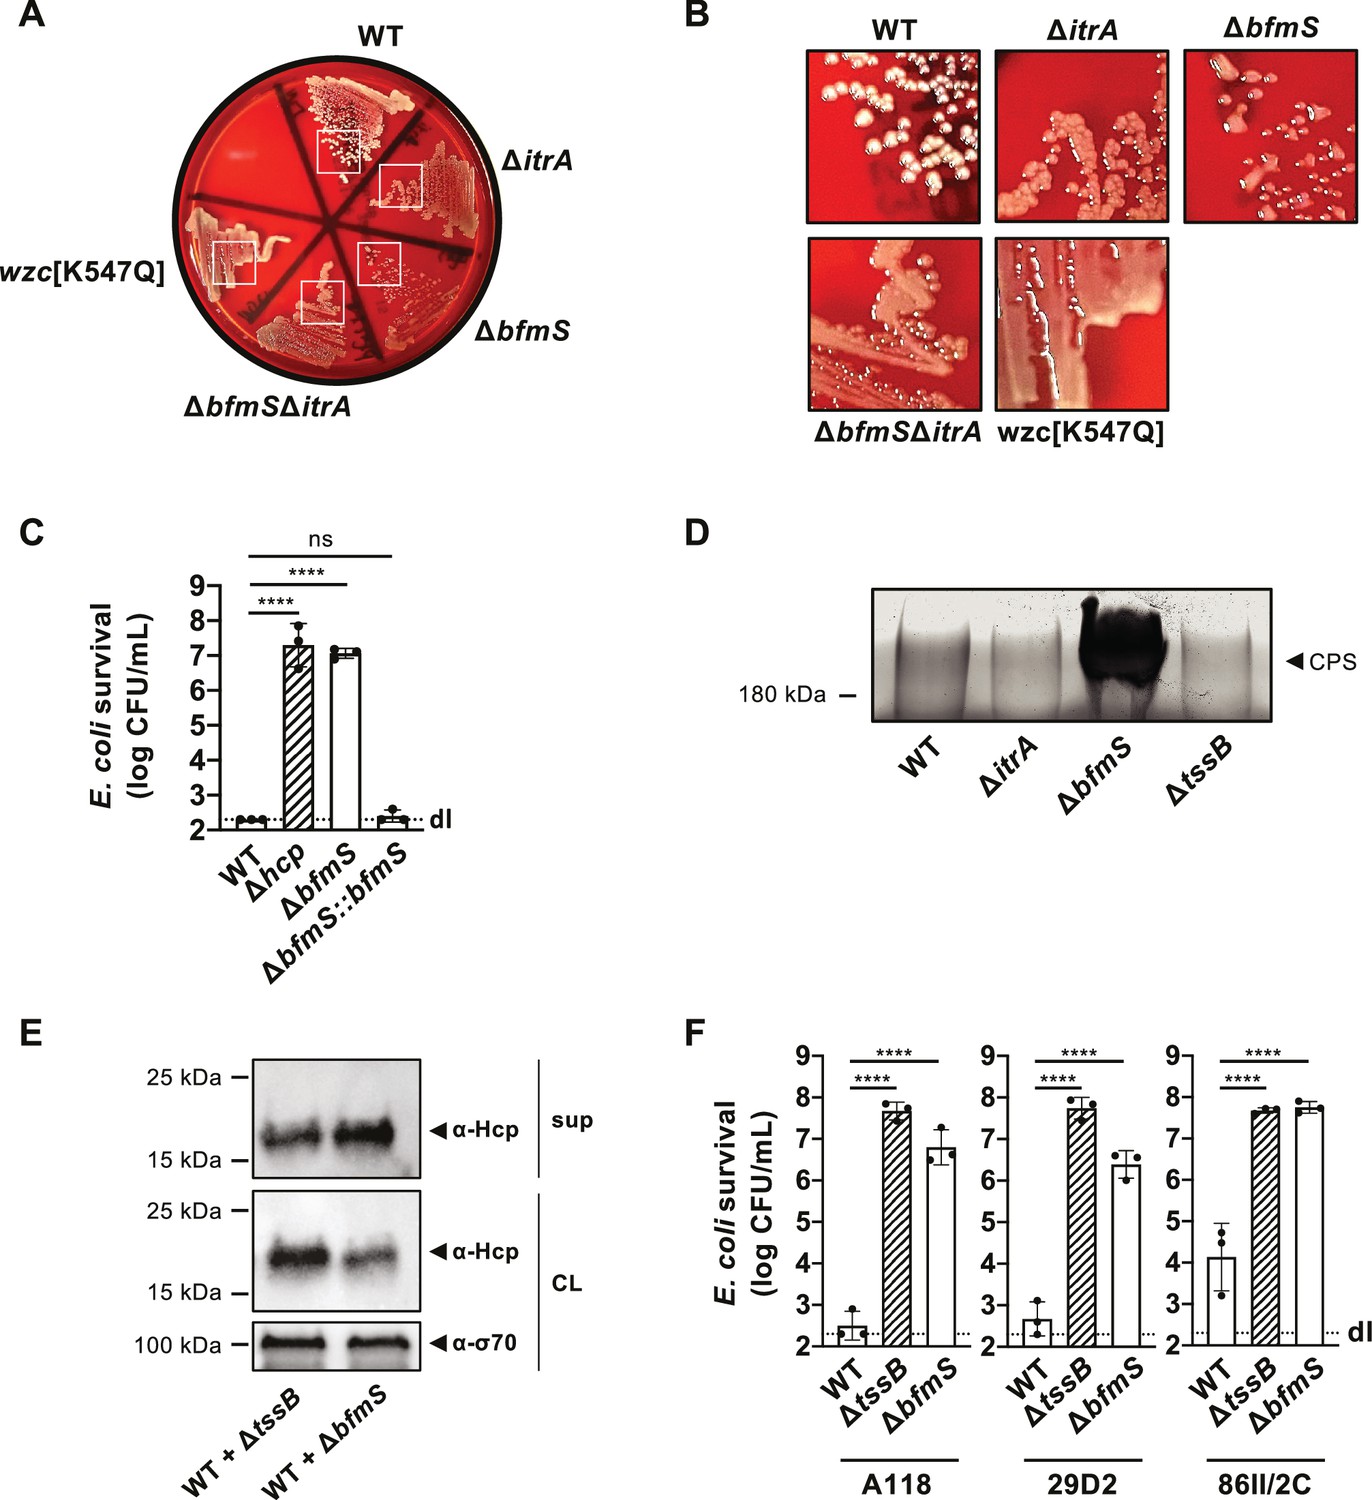
Deletion of bfmS and its effect on T6SS activity in A. baumannii.
(A, B) Colony morphologies on blood agar plates after 24 hr of growth, with strain genotypes indicated. (B) depicts zoomed regions of the white boxes shown in panel A. (C) Complementation of bfmS deletion assessed by T6SS-mediated killing activity. Enumeration of E. coli after exposure to wild-type (WT), T6SS-inactive (Δhcp), ΔbfmS, and the bfmS-complemented strain (ΔbfmS::bfmS), with survival shown on the Y-axis. (D) Capsule production in WT, capsule-deficient (ΔitrA), capsule-overproducing (ΔbfmS), and secretion-impaired (ΔtssB) strains. Polysaccharides from supernatant were precipitated, separated by SDS–PAGE, and visualized with Alcian blue staining. The arrowhead marks the polysaccharide band. (E) Hcp secretion remains detectable in WT co-cultured with secretion-impaired (+ΔtssB) or capsule-overproducing ∆bfmS (+ΔbfmS) strains, as analyzed by immunoblotting. Details as described in Figure 2B. (F) Survival of E. coli prey after contact with A. baumannii WT and mutants Δhcp, ΔbfmS strains across various strain backgrounds (A118, 29D2, and 86II/2C). Details as in panel C. Statistical analysis as in Figure 3A with ****p < 0.0001.
-
Figure 3—figure supplement 1—source data 1
PDF file containing the original gels for Figure 3—figure supplement 1D, indicating the relevant bands.
- https://cdn.elifesciences.org/articles/101032/elife-101032-fig3-figsupp1-data1-v2.pdf
-
Figure 3—figure supplement 1—source data 2
Original files for gel displayed in Figure 3—figure supplement 1D.
- https://cdn.elifesciences.org/articles/101032/elife-101032-fig3-figsupp1-data2-v2.zip
-
Figure 3—figure supplement 1—source data 3
PDF file containing original western blots for Figure 3—figure supplement 1E, indicating the relevant bands and treatments.
- https://cdn.elifesciences.org/articles/101032/elife-101032-fig3-figsupp1-data3-v2.pdf
-
Figure 3—figure supplement 1—source data 4
Original files for western blot analysis displayed in Figure 3—figure supplement 1E.
- https://cdn.elifesciences.org/articles/101032/elife-101032-fig3-figsupp1-data4-v2.zip
Figure 4
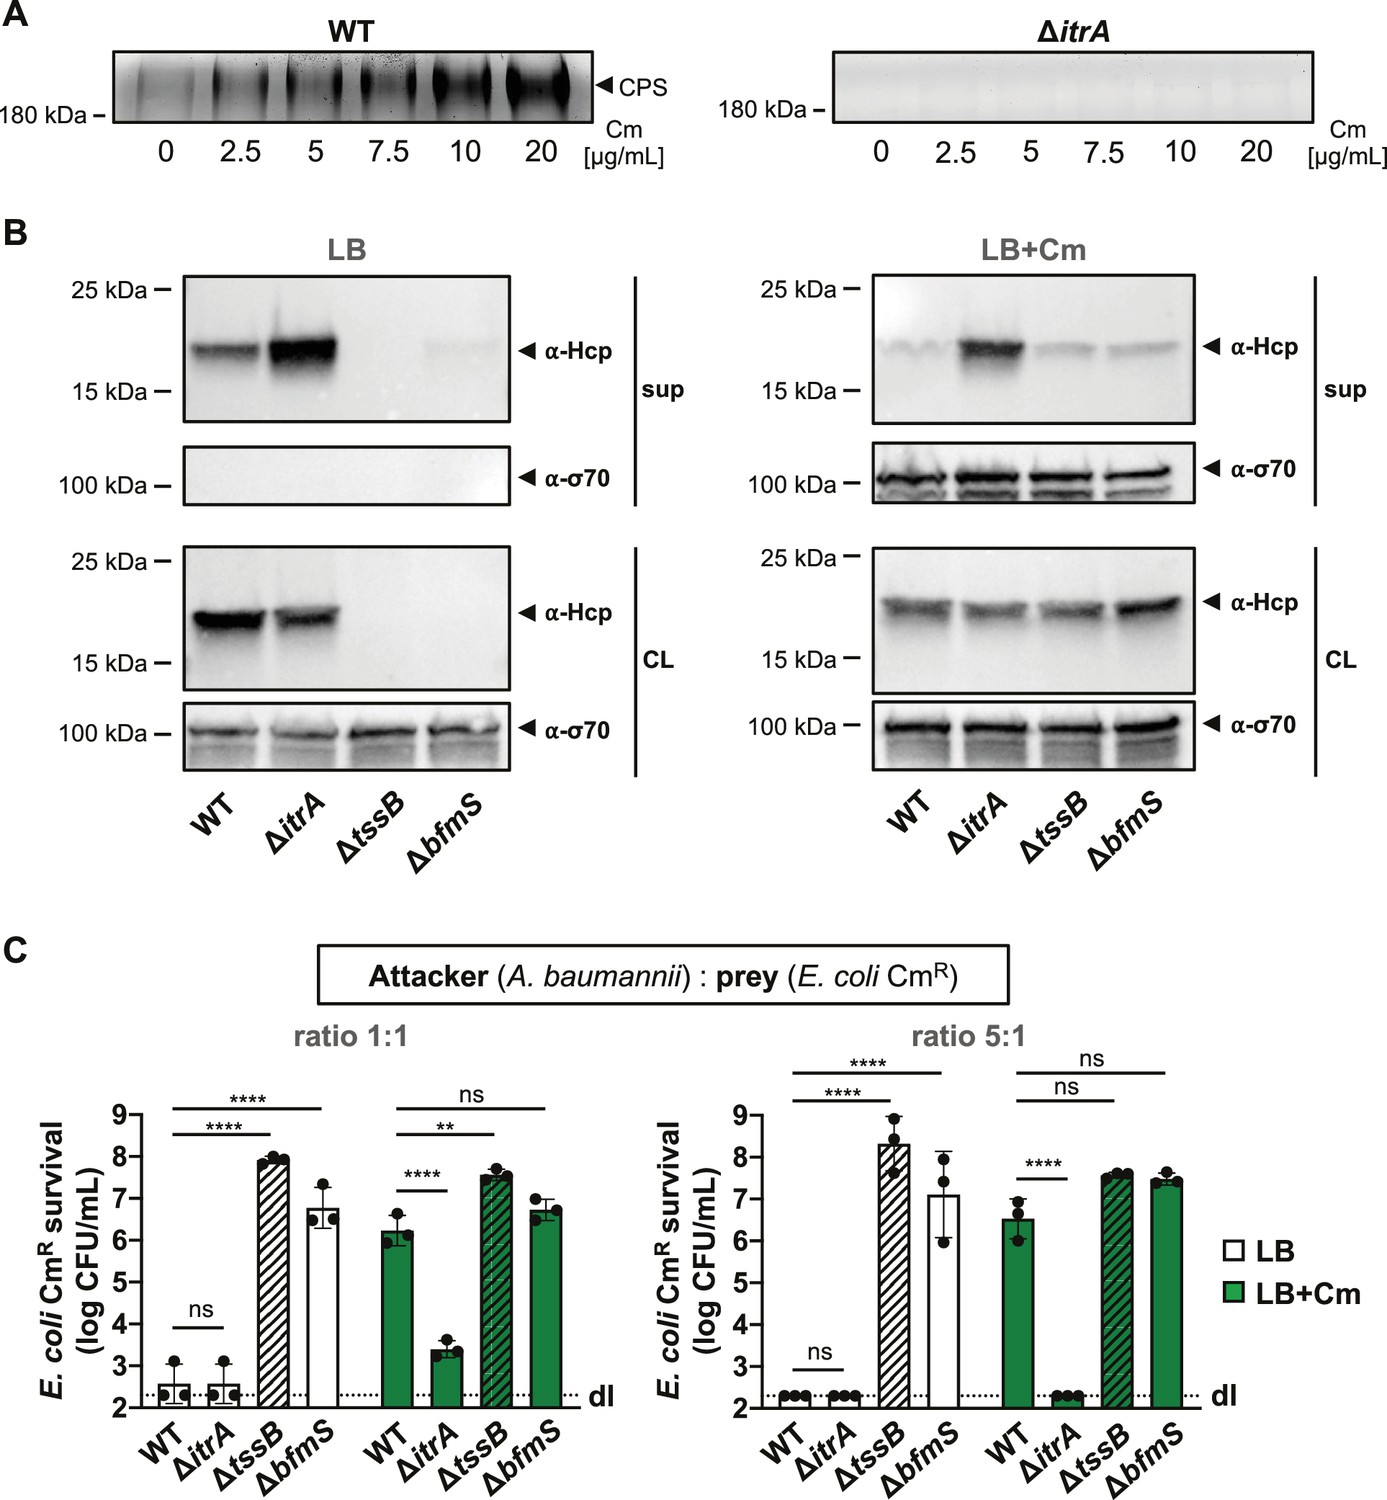
T6SS inhibition upon capsular polysaccharide (CPS) overproduction due to antibiotic treatment.
(A) Capsule production in wild-type (WT, left panel) or capsule-deficient (ΔitrA, right panel) strains was induced using varying concentrations of chloramphenicol, as indicated. Polysaccharides from supernatant were precipitated, separated by SDS–PAGE, and visualized with Alcian blue staining. The arrowhead marks the polysaccharide band. (B) Hcp secretion in chloramphenicol-untreated (LB) or treated (LB+Cm) cells. Hcp production and secretion were analyzed in WT, ΔitrA, ΔtssB, and ΔbfmS strains through immunoblotting. Details as described in Figure 2B. σ-70 detection served as loading (CL) and lysis control (sup). (C) Survival of chloramphenicol-resistant (CmR) E. coli after contact with various A. baumannii attackers: capsulated (WT), non-capsulated (ΔitrA), T6SS-inactive (∆tssB, dashed bars), or capsule-overexpressing (ΔbfmS) strains. Assay was conducted at different attacker-to-prey ratios, as indicated, under two conditions: unexposed (white bars) and exposed to 20 μg/ml chloramphenicol (green bars) to induce capsule production. Survival rates are indicated on the Y-axis. For panel (C), data points are averages from three independent experiments (± SD, shown by error bars). Statistical significance was determined with an ordinary one-way ANOVA test. **p < 0.01, ****p < 0.0001, ns = not significant. Detection limits (dl) were noted where applicable.
-
Figure 4—source data 1
PDF file containing the original gels for Figure 4A, indicating the relevant bands.
- https://cdn.elifesciences.org/articles/101032/elife-101032-fig4-data1-v2.pdf
-
Figure 4—source data 2
Original files for gel displayed in Figure 4A.
- https://cdn.elifesciences.org/articles/101032/elife-101032-fig4-data2-v2.zip
-
Figure 4—source data 3
PDF file containing original western blots for Figure 4B, indicating the relevant bands and treatments.
- https://cdn.elifesciences.org/articles/101032/elife-101032-fig4-data3-v2.pdf
-
Figure 4—source data 4
Original files for western blot analysis displayed in Figure 4B.
- https://cdn.elifesciences.org/articles/101032/elife-101032-fig4-data4-v2.zip
Figure 5 with 1 supplement
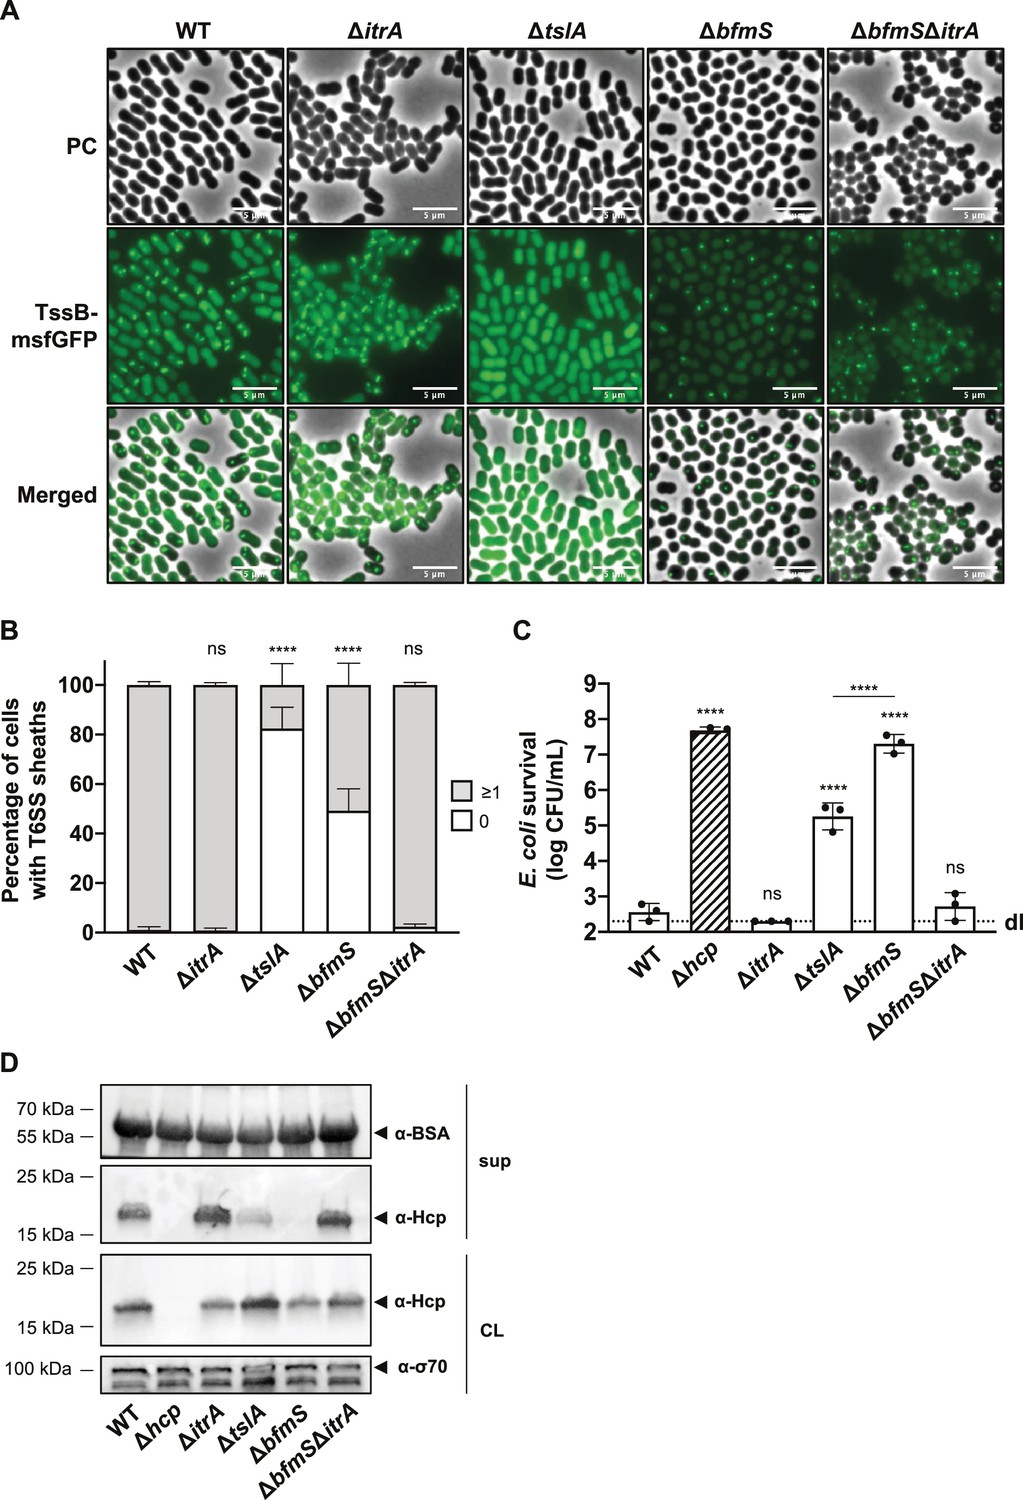
T6SS inhibition in capsular polysaccharide (CPS) overproducing strain goes beyond inability of cell-to-cell contact sensing.
(A) Fluorescence light micrographs of TssB-msfGFP-producing A. baumannii. Strain backgrounds: capsulated (wild-type, WT), non-capsulated (ΔitrA), cell contact sensing mutant (ΔtslA), capsule-overexpressing (ΔbfmS), and ΔbfmSΔitrA double mutant. Details as described for Figure 2C. Scale bar: 5 μm. (B) Quantification of T6SS structures in the A. baumannii strains described in panel (A). Details as for Figure 2D. Number of analyzed cells was 3041, 2685, 2805, 3667, and 4800 for the strains indicated on the X-axis. Data are averages from three independent experiments (± SD, as defined by error bars). (C) Survival rates of E. coli prey after exposure to the A. baumannii WT, ΔitrA, ΔtslA, ΔbfmS, and ΔbfmS attacker strains with native (non-fused) tssB. An attacker-to-prey ratio of 1:1 was used. Survival is indicated on the Y-axis. Bars indicate mean values (± SD, as shown by error bars). (D) Hcp production and secretion were analyzed for the same A. baumannii strains as in panel (C). Experimental details as for Figure 2B. Statistical analyses show the significance compared to WT conditions, utilizing a two-way ANOVA test for (B) and an ordinary one-way ANOVA test for (C). ****p < 0.0001, ns = not significant. Detection limits (dl) are indicated.
-
Figure 5—source data 1
PDF file containing original western blots for Figure 5D, indicating the relevant bands and treatments.
- https://cdn.elifesciences.org/articles/101032/elife-101032-fig5-data1-v2.pdf
-
Figure 5—source data 2
Original files for western blot analysis displayed in Figure 5D.
- https://cdn.elifesciences.org/articles/101032/elife-101032-fig5-data2-v2.zip
Figure 5—figure supplement 1
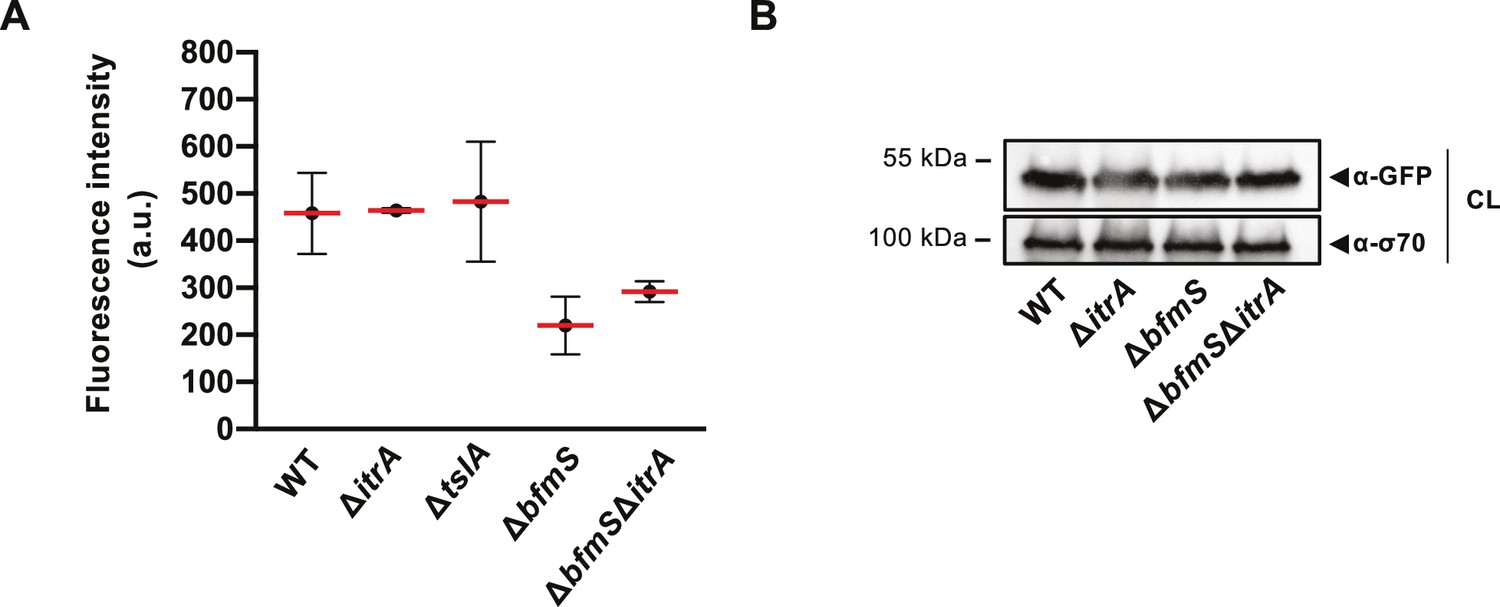
TssB-msfGFP-producing A. baumannii strains.
(A) Fluorescence intensity measurement for TssB-msfGFP-producing A. baumannii. Strain backgrounds: capsulated (wild-type, WT), non-capsulated (ΔitrA), cell contact sensing mutant (ΔtslA), capsule-overexpressing (ΔbfmS), and ΔbfmSΔitrA double mutant. Number of analyzed cells was 3041, 2685, 2805, 3667, and 4800 for the strains indicated on the X-axis. Data are averages from three independent experiments (mean represented by red bars; ± SD, as defined by error bars). a.u., arbitrary units. (B) Equal TssB production in various strains. TssB production was assessed in exponentially growing strains carrying a translational fusion of the T6SS sheath protein TssB and msfGFP (tssB-msfGFP) by immunoblot analysis using anti-GFP antibodies. Strain backgrounds: WT, ΔitrA, ΔbfmS, and ΔbfmSΔitrA. Equal loading of the cell lysates (CL) was confirmed by detection of σ-70.
-
Figure 5—figure supplement 1—source data 1
PDF file containing original western blots for Figure 5—figure supplement 1B, indicating the relevant bands and treatments.
- https://cdn.elifesciences.org/articles/101032/elife-101032-fig5-figsupp1-data1-v2.pdf
-
Figure 5—figure supplement 1—source data 2
Original files for western blot analysis displayed in Figure 5—figure supplement 1B.
- https://cdn.elifesciences.org/articles/101032/elife-101032-fig5-figsupp1-data2-v2.zip
Figure 6 with 1 supplement
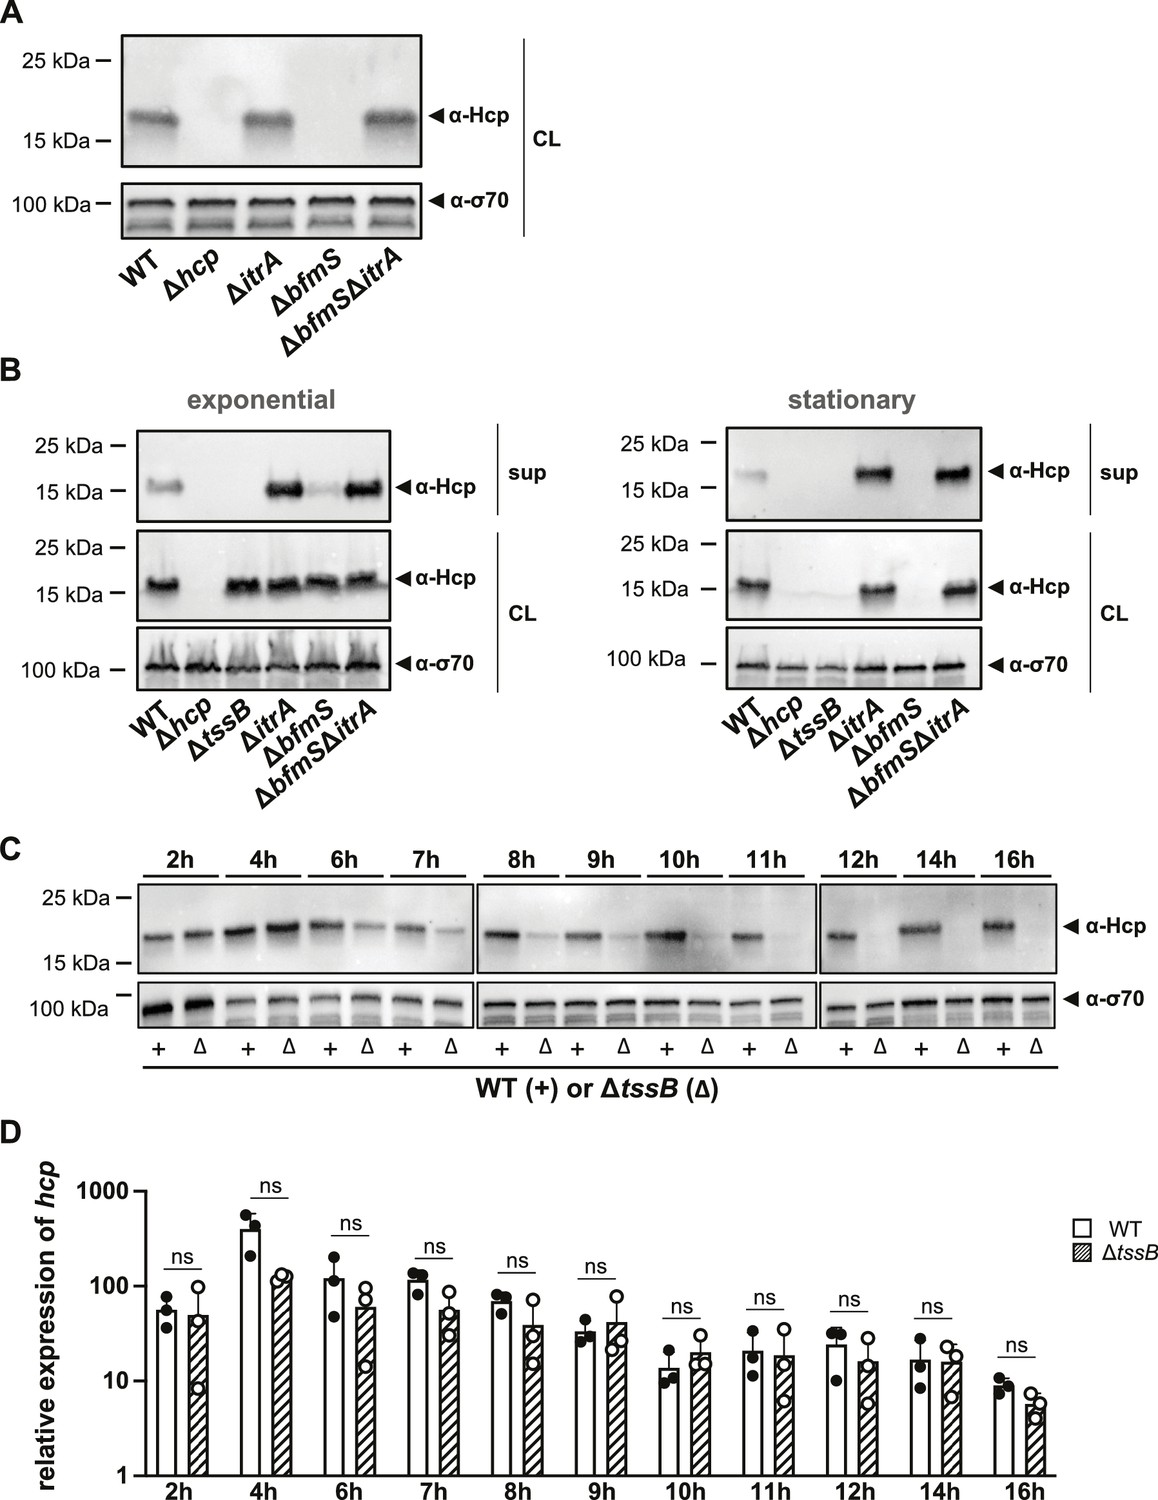
Secretion-impaired strains degrade Hcp during stationary phase.
(A) Immunoblot analysis of Hcp protein levels in cell lysates (CL) of capsulated (wild-type, WT), T6SS-inactive (Δhcp), non-capsulated (ΔitrA), capsule-overexpressing (ΔbfmS), and ΔbfmSΔitrA mutant strains grown to stationary phase. (B) Comparative analysis of Hcp production and secretion in A. baumannii strains during exponential (left) and stationary (right) growth phases. Strains as explained in panel (A) with the addition of a secretion-impaired ΔtssB mutant. Details as described for Figure 2B. (C, D) Hcp abundance is regulated at the post-translational level. (C) Hcp protein production over a 16-hr period in the WT strain (white bars) versus the secretion-impaired strain (ΔtssB, dashed bars), as analyzed by immunoblotting. (D) Relative hcp gene expression levels over the same 16-hr period in the WT strain (white bars) versus the secretion-impaired strain (ΔtssB, dashed bars). These results are representative of three independent experiments, and the bars show the mean (± SD, as defined by error bars). Statistical analyses were performed on log-transformed data using a two-way ANOVA. ns = not significant.
-
Figure 6—source data 1
PDF file containing original western blots for Figure 6A, indicating the relevant bands and treatments.
- https://cdn.elifesciences.org/articles/101032/elife-101032-fig6-data1-v2.pdf
-
Figure 6—source data 2
Original files for western blot analysis displayed in Figure 6A.
- https://cdn.elifesciences.org/articles/101032/elife-101032-fig6-data2-v2.zip
-
Figure 6—source data 3
PDF file containing original western blots for Figure 6B, indicating the relevant bands and treatments.
- https://cdn.elifesciences.org/articles/101032/elife-101032-fig6-data3-v2.pdf
-
Figure 6—source data 4
Original files for western blot analysis displayed in Figure 6B.
- https://cdn.elifesciences.org/articles/101032/elife-101032-fig6-data4-v2.zip
-
Figure 6—source data 5
PDF file containing original western blots for Figure 6C, indicating the relevant bands and treatments.
- https://cdn.elifesciences.org/articles/101032/elife-101032-fig6-data5-v2.pdf
-
Figure 6—source data 6
Original files for western blot analysis displayed in Figure 6C.
- https://cdn.elifesciences.org/articles/101032/elife-101032-fig6-data6-v2.zip
Figure 6—figure supplement 1
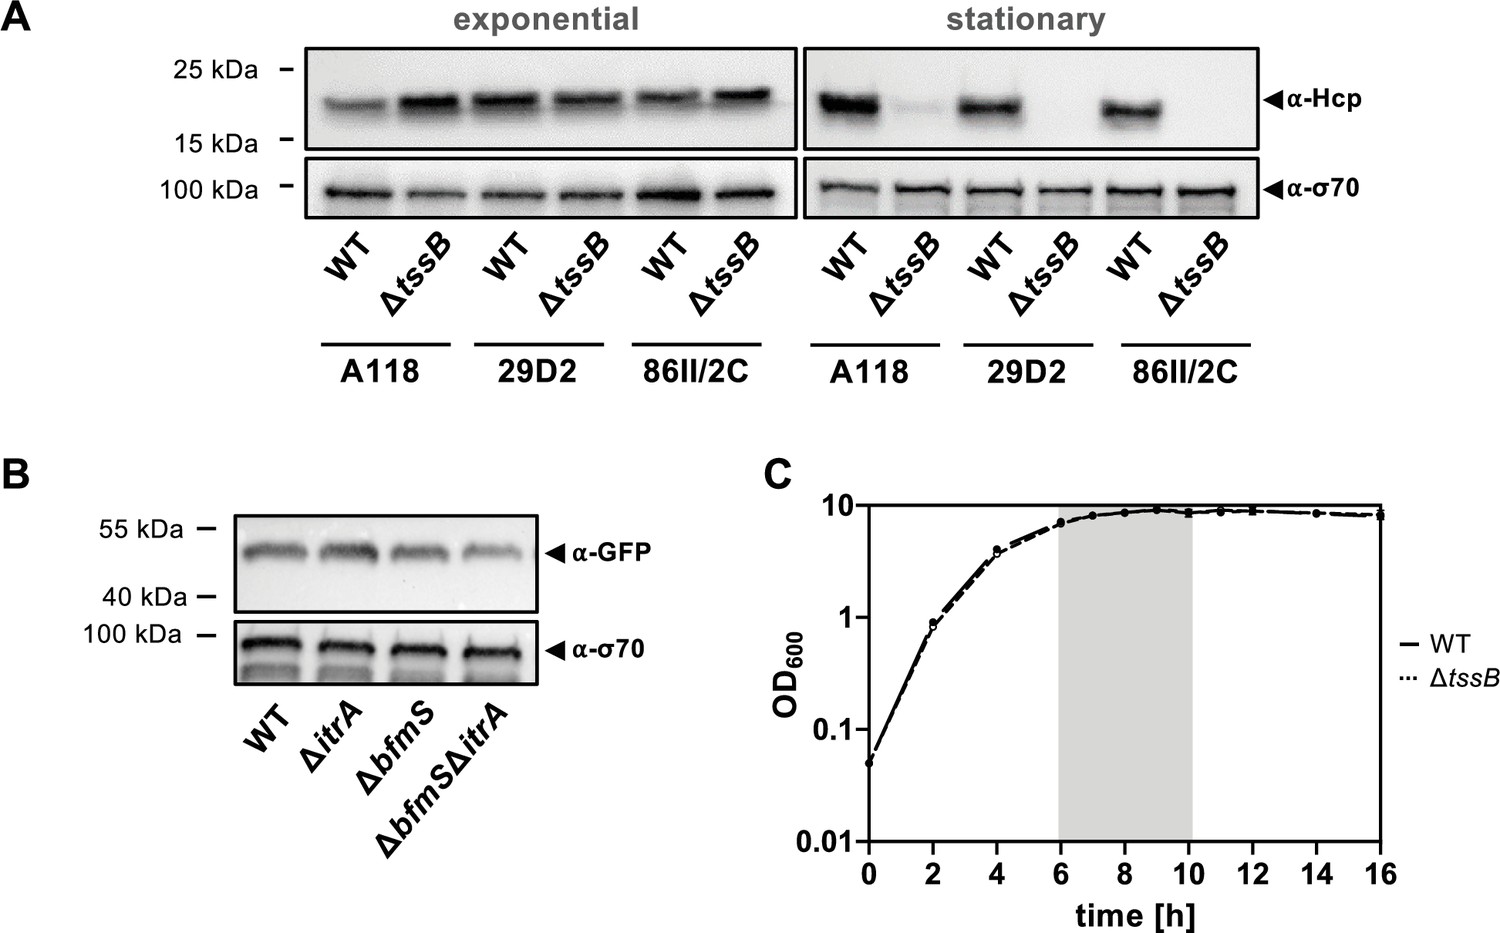
Hcp degradation is conserved across A. baumannii strains.
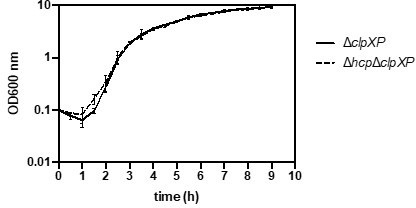
(A) Hcp levels in wild-type (WT) and the ΔtssB mutant of A. baumannii strains A118, 29D2, and 86IIC were evaluated under exponential (left) and stationary (right) growth phases via immunoblot analysis. Details as described for Figure 2B. (B) TssB production remains equal during stationary phase. Strains harboring the translational fusion TssB-msfGFP were cultured under stationary growth conditions and analyzed for GFP production. Details on strains and immunoblotting conditions as described for panel Figure 5—figure supplement 1B. (C) Growth curve of WT and the ΔtssB mutant over a 16-hr timeframe, with the gray zone highlighting the observed period of Hcp degradation shown in Figure 6C.
-
Figure 6—figure supplement 1—source data 1
PDF file containing original western blots for Figure 6—figure supplement 1A, indicating the relevant bands and treatments.
- https://cdn.elifesciences.org/articles/101032/elife-101032-fig6-figsupp1-data1-v2.pdf
-
Figure 6—figure supplement 1—source data 2
Original files for western blot analysis displayed in Figure 6—figure supplement 1A.
- https://cdn.elifesciences.org/articles/101032/elife-101032-fig6-figsupp1-data2-v2.zip
-
Figure 6—figure supplement 1—source data 3
PDF file containing original western blots for Figure 6—figure supplement 1B, indicating the relevant bands and treatments.
- https://cdn.elifesciences.org/articles/101032/elife-101032-fig6-figsupp1-data3-v2.pdf
-
Figure 6—figure supplement 1—source data 4
Original files for western blot analysis displayed in Figure 6—figure supplement 1B.
- https://cdn.elifesciences.org/articles/101032/elife-101032-fig6-figsupp1-data4-v2.zip
Figure 7 with 1 supplement
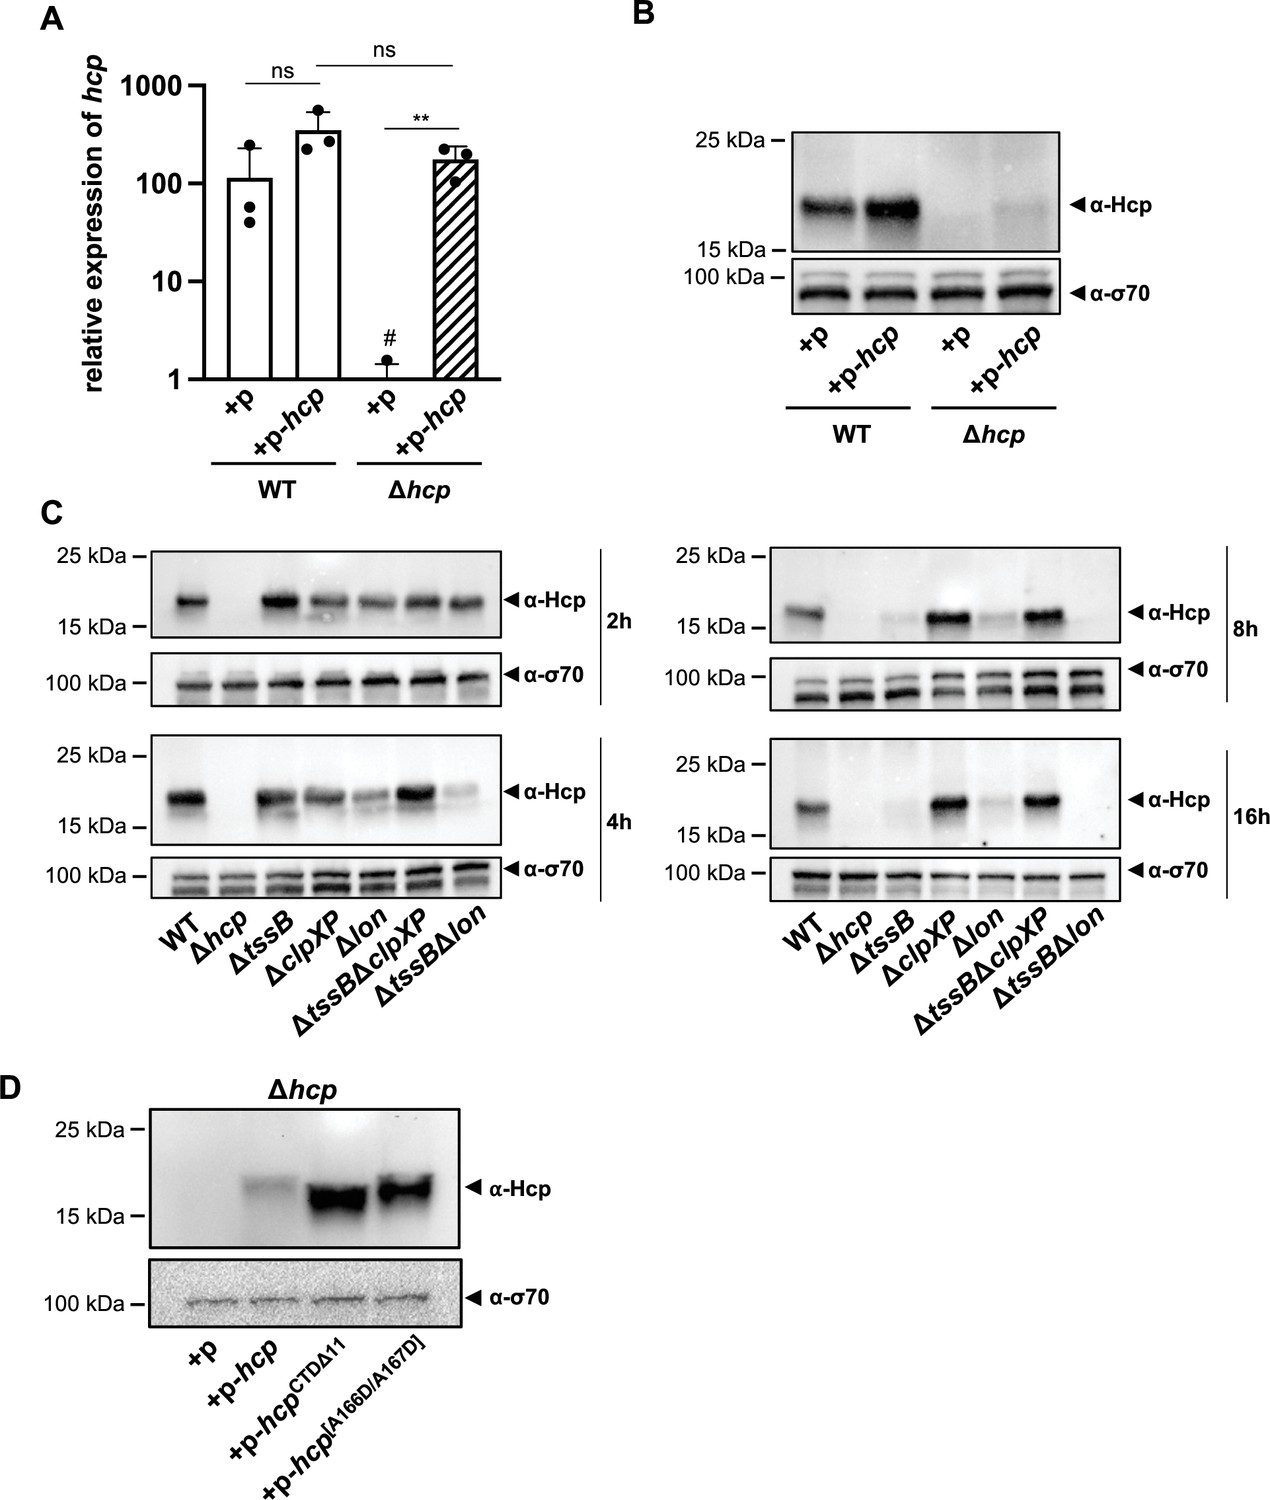
ClpXP protease machinery mediates Hcp degradation.
(A) Relative expression levels of hcp in wild-type (WT) or the hcp mutant, either carrying an empty plasmid (+p) or a plasmid designed for hcp overexpression (+p hcp). # denotes nonspecific amplification noise. (B) Hcp abundance in the same strains as shown on panel A, assessed by immunoblotting. (C) Hcp accumulation over time in clpXP-deficient mutants. Hcp levels were examined in cell lysates from various A. baumannii strains including capsulated WT, T6SS-inactive (Δhcp and ΔtssB), and protease-deficient (ΔclpXP and Δlon) mutants, or strains lacking multiple genes (ΔtssBΔclpXP and ΔtssBΔlon). The bacteria were grown over 2-, 4-, 8-, and 16-hr growth periods. Immunoblot analyses were performed as described for Figure 2B. (D) The C-terminus of Hcp is essential for its degradation by ClpXP. Hcp abundance in the hcp mutant carrying either an empty plasmid (+p), a plasmid encoding Hcp (+p-hcp), a plasmid encoding a C-terminus-deficient variant of Hcp (+p-hcpCTDΔ11), or a plasmid encoding Hcp with substitutions of the last two amino acid (+p-hcp[A166D/A167D]). These results are representative of three independent experiments and bars show the mean (± SD, as shown by error bars). Statistical significance was assessed on log-transformed data using a two-way ANOVA. **p < 0.01, ns = not significant.
-
Figure 7—source data 1
PDF file containing original western blots for Figure 7B, indicating the relevant bands and treatments.
- https://cdn.elifesciences.org/articles/101032/elife-101032-fig7-data1-v2.pdf
-
Figure 7—source data 2
Original files for western blot analysis displayed in Figure 7B.
- https://cdn.elifesciences.org/articles/101032/elife-101032-fig7-data2-v2.zip
-
Figure 7—source data 3
PDF file containing original western blots for Figure 7C, indicating the relevant bands and treatments.
- https://cdn.elifesciences.org/articles/101032/elife-101032-fig7-data3-v2.pdf
-
Figure 7—source data 4
Original files for western blot analysis displayed in Figure 7C.
- https://cdn.elifesciences.org/articles/101032/elife-101032-fig7-data4-v2.zip
-
Figure 7—source data 5
PDF file containing original western blots for Figure 7D, indicating the relevant bands and treatments.
- https://cdn.elifesciences.org/articles/101032/elife-101032-fig7-data5-v2.pdf
-
Figure 7—source data 6
Original files for western blot analysis displayed in Figure 7D.
- https://cdn.elifesciences.org/articles/101032/elife-101032-fig7-data6-v2.zip
Figure 7—figure supplement 1
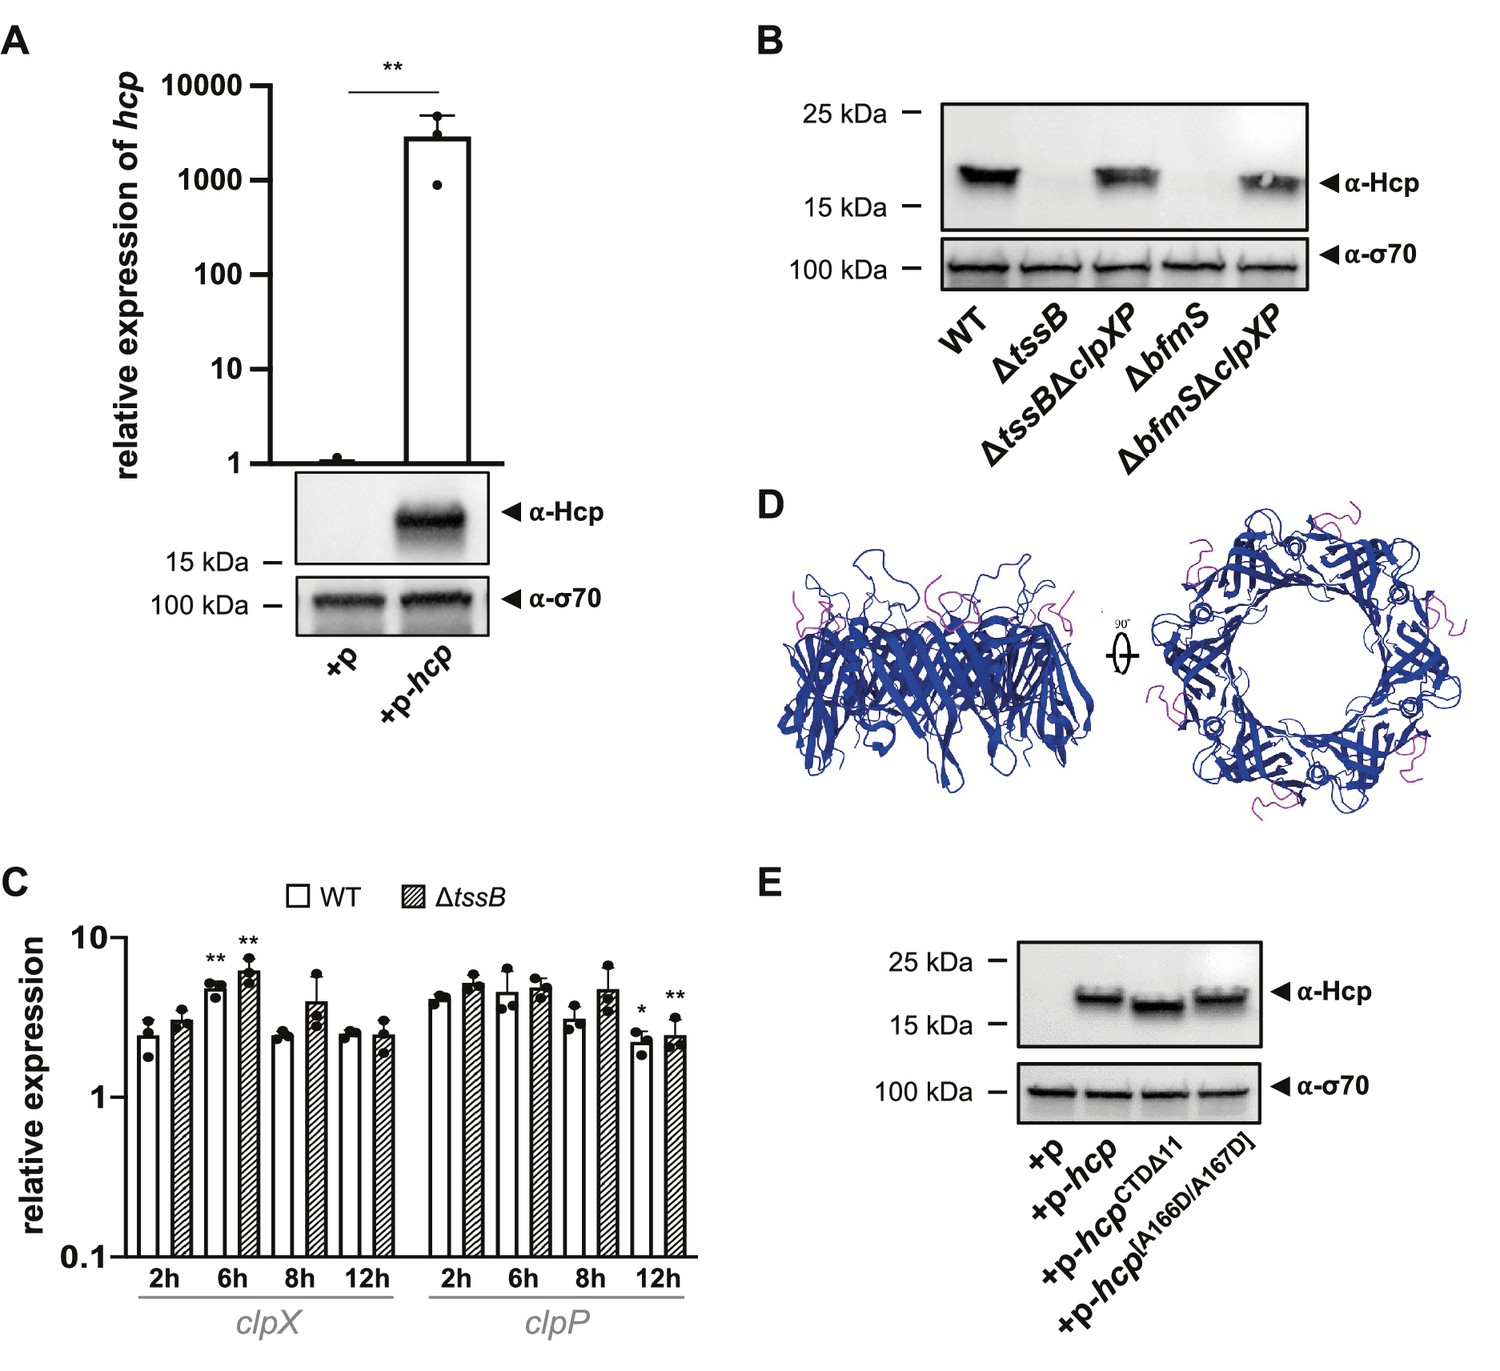
Hcp degradation by ClpXP.
(A) Assessment of hcp-overexpression plasmid in E. coli. The graph shows relative hcp expression levels in E. coli with an empty plasmid (+p) versus those with a plasmid for hcp overexpression (+p-hcp). The images below the graph illustrate Hcp production in these E. coli strains, which were assessed by immunoblotting. (B) Hcp accumulation over time in clpXP-deficient mutants. Hcp levels were examined in cell lysates from various A. baumannii strains including capsulated wild-type (WT), T6SS-inactive (ΔtssB), capsule-overproducing (ΔbfmS), and clpXP double mutants (ΔtssBΔclpXP and ΔbfmSΔclpXP). The bacteria were grown over 16-hr growth periods. Immunoblot analyses were performed as described for Figure 2B. (C) Relative expression of clpX and clpP over time. The panel compares the relative expression of clpX and clpP over a 12-hr period in WT and ΔtssB strains. (D) The C-terminus of Hcp is surface-exposed. The presented Hcp hexamer is based on PDB 4W64 (Ruiz et al., 2015) with the C-termini color-coded in pink. (E) Hcp abundance in E. coli carrying either an empty plasmid (+p), a plasmid designed for overexpression of the full-length Hcp (+p hcp), Hcp truncated at the last 11 amino acids (+p-hcpCTDΔ11), or a Hcp with A166D and A167D amino acid substitutions (+p-hcp[A166D/A167D]). Data are representative of three independent experiments. For the graphs in panels (A) and (C), data are represented as means (± SD, as indicated by error bars). Statistical significance was assessed using an unpaired t-test (A) or two-way ANOVA (C) or on log-transformed data, comparing values between the vector control (+p) or plasmid p-hcp (A) or between the WT and ΔtssB conditions at 2 hr versus later time points (C). *p < 0.05, **p < 0.01. Statistical values showing no significant differences have been omitted for clarity.
-
Figure 7—figure supplement 1—source data 1
PDF file containing original western blots for Figure 7—figure supplement 1A, indicating the relevant bands and treatments.
- https://cdn.elifesciences.org/articles/101032/elife-101032-fig7-figsupp1-data1-v2.pdf
-
Figure 7—figure supplement 1—source data 2
Original files for western blot analysis displayed in Figure 7—figure supplement 1A.
- https://cdn.elifesciences.org/articles/101032/elife-101032-fig7-figsupp1-data2-v2.zip
-
Figure 7—figure supplement 1—source data 3
PDF file containing original western blots for Figure 7—figure supplement 1B, indicating the relevant bands and treatments.
- https://cdn.elifesciences.org/articles/101032/elife-101032-fig7-figsupp1-data3-v2.pdf
-
Figure 7—figure supplement 1—source data 4
Original files for western blot analysis displayed in Figure 7—figure supplement 1B.
- https://cdn.elifesciences.org/articles/101032/elife-101032-fig7-figsupp1-data4-v2.zip
-
Figure 7—figure supplement 1—source data 5
PDF file containing original western blots for Figure 7—figure supplement 1E, indicating the relevant bands and treatments.
- https://cdn.elifesciences.org/articles/101032/elife-101032-fig7-figsupp1-data5-v2.pdf
-
Figure 7—figure supplement 1—source data 6
Original files for western blot analysis displayed in Figure 7—figure supplement 1E.
- https://cdn.elifesciences.org/articles/101032/elife-101032-fig7-figsupp1-data6-v2.zip
Figure 8

Model of capsule function and its impact on T6SS activity in A. baumannii.
Left panel: A. baumannii capsular polysaccharide and T6SS protect against competitor T6SS attacks independently of immunity proteins. Middle panel: Under permissive conditions, the capsule only slightly impairs type VI secretion, preventing intracellular accumulation of Hcp. Right panel: Under non-permissive conditions, capsule overexpression—induced by bfmS deletion (ΔbfmS) or sub-MIC antibiotic treatment—modifies cell-associated polysaccharide organization, inhibiting T6SS secretion and therefore killing activity. ClpXP machinery degrades Hcp to prevent its accumulation over time.
Author response image 1
Videos
Video 1
Movie demonstrating an example of the image analysis pipeline.
A representative movie is shown, with snapshots captured every 30 s over a 5-min duration. The panel displays split views: the phase-contrast channel on the left, the bleach- and drift-compensated fluorescence channel in the center, and the color-coded channel showing contracted and extended sheath structures on the right. A mask representing the segmented bacteria is overlaid on all three panels.
Tables
Key resources table
| Reagent type (species) or resource | Designation | Source or reference | Identifiers | Additional information |
|---|---|---|---|---|
| Strain, strain background (Acinetobacter baumannii) | Acinetobacter baumannii, strain A118 | PMID:20181905 PMID:25164683 | Acinetobacter baumannii strain background | See Supplementary file 1 for strains used in this study |
| Strain, strain background (Escherichia coli) | S17-1λpir | Simon et al., 1983, Nat Biotechnol 1, 784–791 | E. coli cloning and mating strain | See Supplementary file 1 for strains used in this study |
| Strain, strain background (Escherichia coli) | MFDpir | PMID:20935093 | E. coli mating strain | See Supplementary file 1 for strains and plasmids used in this study |
| Commercial kit or assay | High-fidelity Q5 polymerase | New England Biolabs | M0491L | Polymerase for PCR |
| Commercial kit or assay | GoTaq G2 DNA polymerase | Promega | M7848 | Polymerase for PCR |
| Recombinant DNA reagent | Plasmids | This study | Plasmids | See Supplementary file 1 for plasmids used in this study |
| Sequence-based reagent | PCR primers | This study | PCR primers | See Supplementary file 2 for oligonucleotides used in this study |
| Antibody | Anti-Sigma70 monoclonal antibodies (Mouse IgG3) | BioLegend | 663208 | 1:10,000 diluted |
| Antibody | Anti-BSA HRP-conjugated antibodies (mouse monoclonal IgG1) | Santa Cruz Biotechnology Inc | sc-32816 HRP | 1:2000 diluted |
| Antibody | Anti-GFP mouse monoclonal antibodies | Roche | 1181446001 | 1:5000 diluted |
| Antibody | Anti-rabbit IgG monoclonal antibodies conjugated to horseradish peroxidase (produced in goat) | Sigma-Aldrich | A9169 | 1:10,000 diluted |
| Antibody | HRP-conjugated anti-mouse antibodies (produced in sheep) | Sigma-Aldrich | A6782 | 1:20,000 diluted |
| Antibody | Anti Hcp-A118-2 polyclonal antibodies (produced in rabbit) | Eurogentec | Custom-made (2110850 cl.2) | 1:667 diluted |
| Other | CHROMagar Acinetobacter | CHROMagar, France | AC092 | Selective medium; additional, standard growth media are described under growth conditions |
Additional files
-
Supplementary file 1
Table containing information about the strains and plasmids used in the study.
- https://cdn.elifesciences.org/articles/101032/elife-101032-supp1-v2.docx
-
Supplementary file 2
Table containing information on the oligonucleotides used in the study.
- https://cdn.elifesciences.org/articles/101032/elife-101032-supp2-v2.xlsx
-
Supplementary file 3
Source data for all non-gel and non-WB data are provided in this file.
- https://cdn.elifesciences.org/articles/101032/elife-101032-supp3-v2.xlsx
-
MDAR checklist
- https://cdn.elifesciences.org/articles/101032/elife-101032-mdarchecklist1-v2.pdf
Download links
A two-part list of links to download the article, or parts of the article, in various formats.
Downloads (link to download the article as PDF)
Open citations (links to open the citations from this article in various online reference manager services)
Cite this article (links to download the citations from this article in formats compatible with various reference manager tools)
Capsular polysaccharide restrains type VI secretion in Acinetobacter baumannii
eLife 14:e101032.
https://doi.org/10.7554/eLife.101032


