Molecular and spatial transcriptomic classification of midbrain dopamine neurons and their alterations in a LRRK2G2019S model of Parkinson’s disease
- Northwestern University Feinberg School of Medicine, Dept of Neurology, United States
- Northwestern University, Dept of Neurobiology, United States
- Aligning Science Across Parkinson’s (ASAP) Collaborative Research Network, United States
- McGill University (Montreal Neurological Institute), Faculty of Medicine and Health Sciences, Dept of Neurology and Neurosurgery, Canada
- Northwestern University Feinberg School of Medicine, Dept of Pharmacology, United States
Figures
Figure 1 with 1 supplement
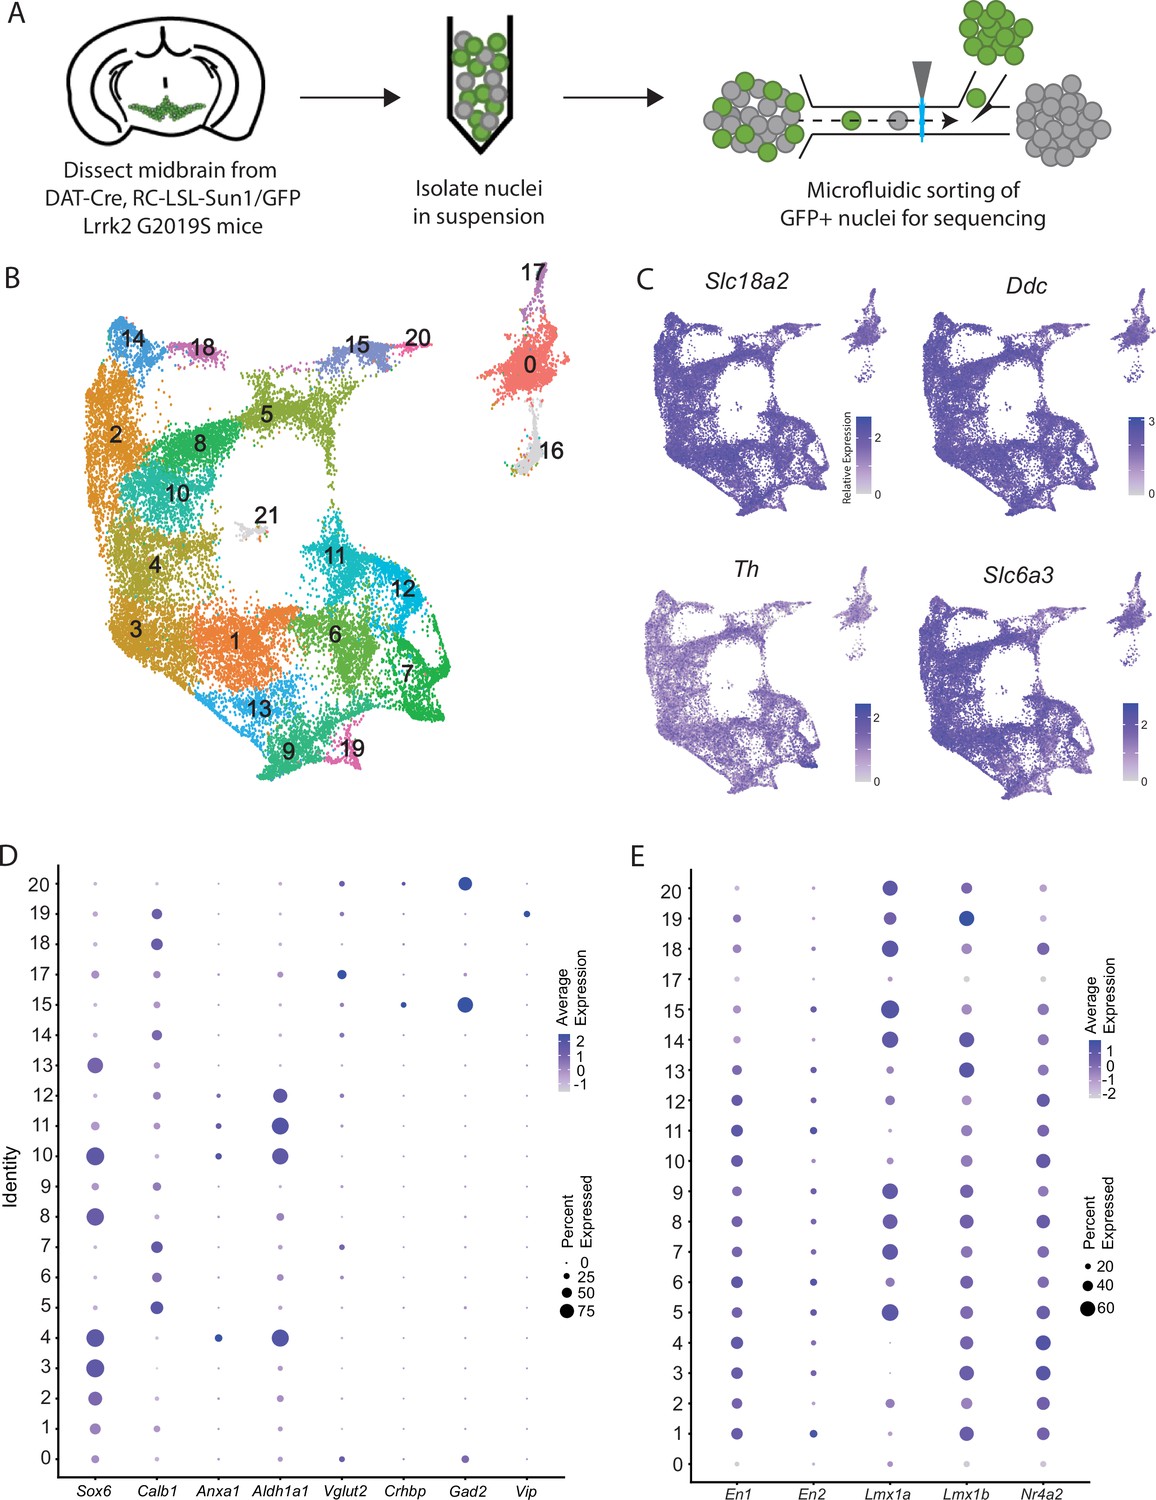
Generation of a large RNAseq dataset of midbrain dopamine neurons.
(A) Schematic of single nucleus isolation pipeline using microfluidic chip-based sorting from n=8 DAT-IRES-Cre (referred to as DAT-Cre), CAG-Sun1/sfGFP (referred to as RC-LSL-Sun1/GFP) mice. (B) UMAP representation of clusters. Of note, putative clusters 16 and 21 are shown in gray, and are removed from analyses due to co-expression of glial markers. (C) Expression of the defining midbrain dopaminergic neuron markers vesicular monoamine transporter 2 (Vmat2; Slc18a2), DOPA decarboxylase (Ddc), tyrosine hydroxylase (Th), and dopamine transporter (Dat; Slc6a3). Robust expression is observed throughout all clusters. (D) Dot plot showing expression of several markers of previously described dopamine neuron subtypes, consistent with finding additional heterogeneity within established subtypes. (E) Expression patterns of midbrain floorplate markers. All clusters show robust expression with the exception of 0 and 17, which indicates these populations are not midbrain dopamine (DA) neurons but might be located in nearby hypothalamic nuclei.
Figure 1—figure supplement 1
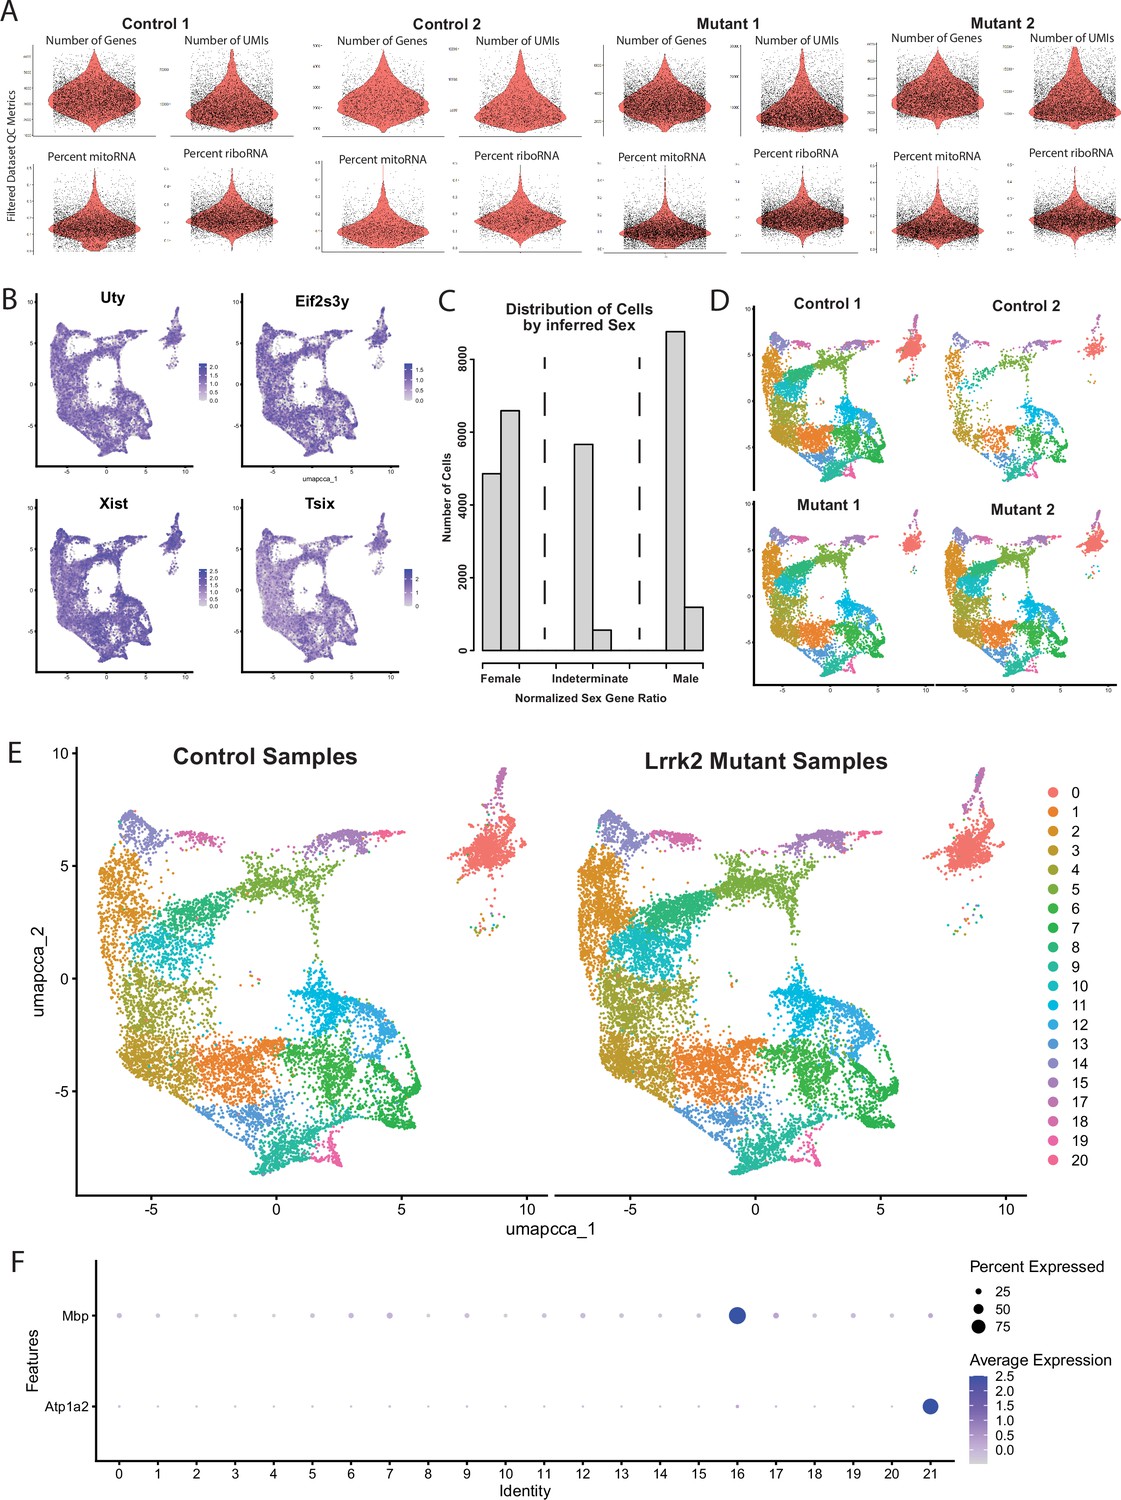
Quality control for dataset generation.
(A) Violin plots for each of our four samples (post-filtering) for each of the four QC metrics used for filtering our datasets. (B) Expression patterns of sex-specific genes. All clusters are represented by both sexes. (C) Histogram of a number of cells plotted by male-to-female gene ratios (scored continuously along the x-axis). Three discrete peaks emerge, representing cells likely originating from either sex or those with indeterminate ratios due to technical drop-off in RNAseq reads. Similar numbers of male and female cells were observed, as represented by the sums of adjacent bins in each of the three marked regions on the x-axis. (D) Cluster representation from each individual RNAseq library. All clusters were represented in all samples. (E) Cluster representation from pooled control and Lrrk2 mutant samples. Distributions are roughly equivalent between conditions, suggesting no overt change in subtype composition as a function of genotype. (F) Dotplot of expression for glial marker genes Mbp and Atp1a2, showing high expression in clusters 16 and 21, respectively, indicating likely doublets of dopamine (DA) neurons and glia.
Figure 2 with 2 supplements
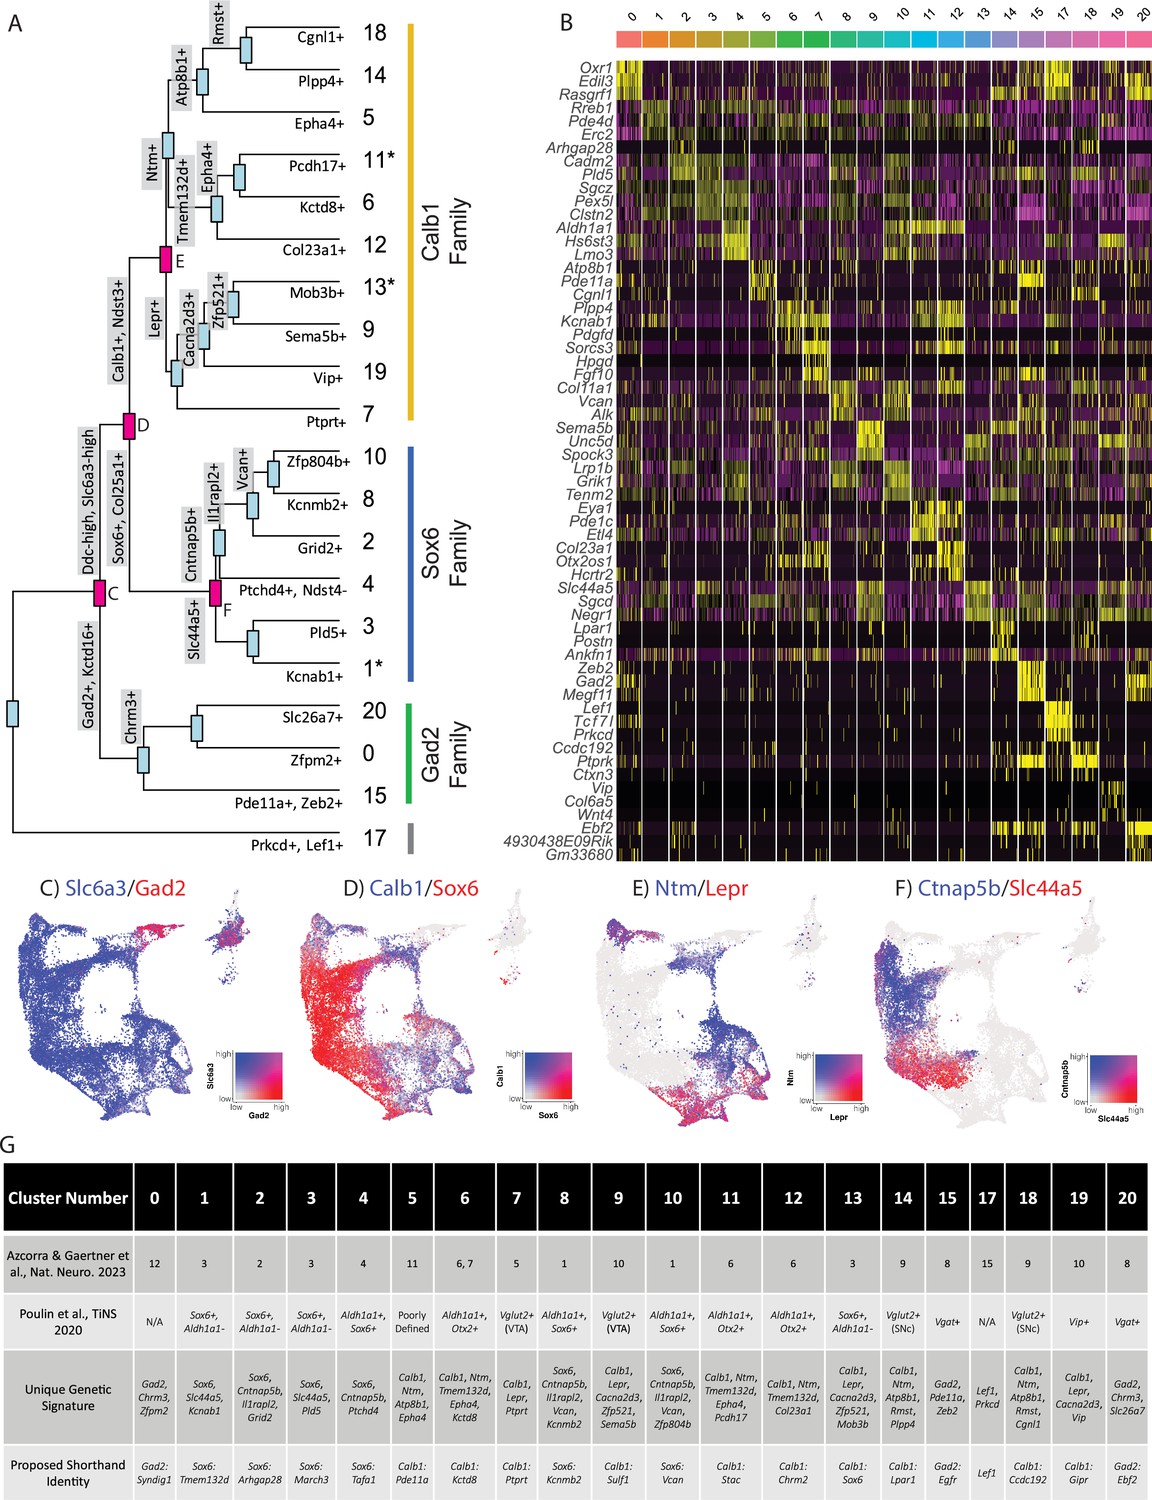
Mapping subtype identities, marker genes, and relationships to previously described populations.
(A) Dendrogram of dopamine (DA) neuron subtypes in our dataset. Distance between branch points represents approximations of relatedness between subsequent nodes, and genes labeled at each branch point represent the top differentially expressed genes distinguishing the downstream groups. Subtypes fell largely into three ‘families,’ with expression patterns generally defined by Gad2, Sox6, or Calb1. Notably, clusters 1, 11, and 13 are shown with an asterisk as these do not display differential expression in line with the defining genes of their cluster families (i.e. are not significantly enriched for their eponymous family genes). (B) Heatmap of top differentially expressed genes for each cluster. The top three genes for each cluster are shown. (C–F) Co-expression of genes at specified branch points denoted in 2 A. (G) Table describing putative clusters and relation to previous literature. Top row: cluster number. Second row: Equivalent cluster in Azcorra et al., 2023. Third row: stepwise genetic signatures based on the following sequential branch points of cluster dendrogram. Bottom row: Proposed shorthand name for subtypes, based on cluster family and top defining genes for that cluster within each family.
Figure 2—figure supplement 1
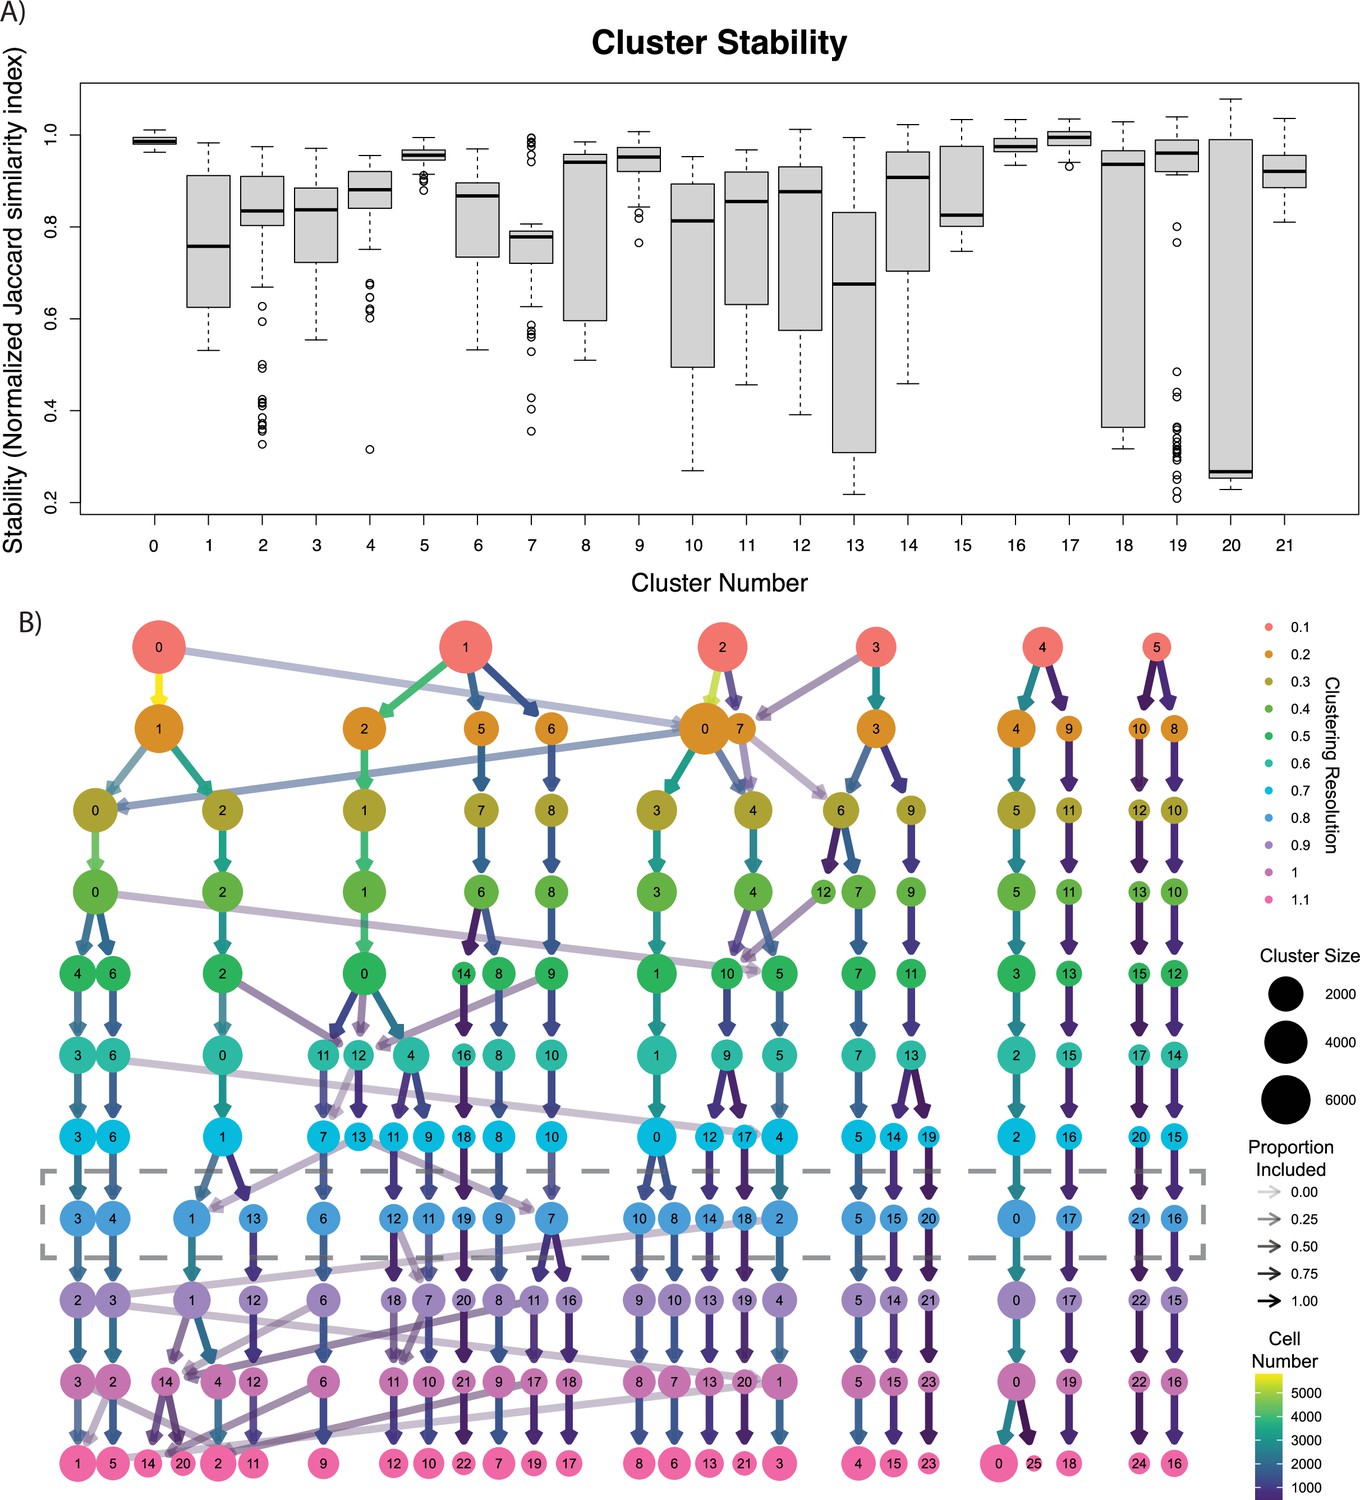
Representations of cluster heterogeneity.
(A) Cluster stability metrics are shown as a box plot for each cluster. Clusters with lower stability contain cells that more easily collapse into other clusters. Outliers (defined as more than 1.5 times the interquartile range (IQR) above the third quartile or below the first quartile) are shown as circles. (B) Cluster tree displaying the evolution of clusters when calculated at different resolutions. As resolution increases, new levels of heterogeneity emerge, but ultimately become largely stable at higher resolutions. Resolution used for our clustering scheme is highlighted by the dotted line.
Figure 2—figure supplement 2
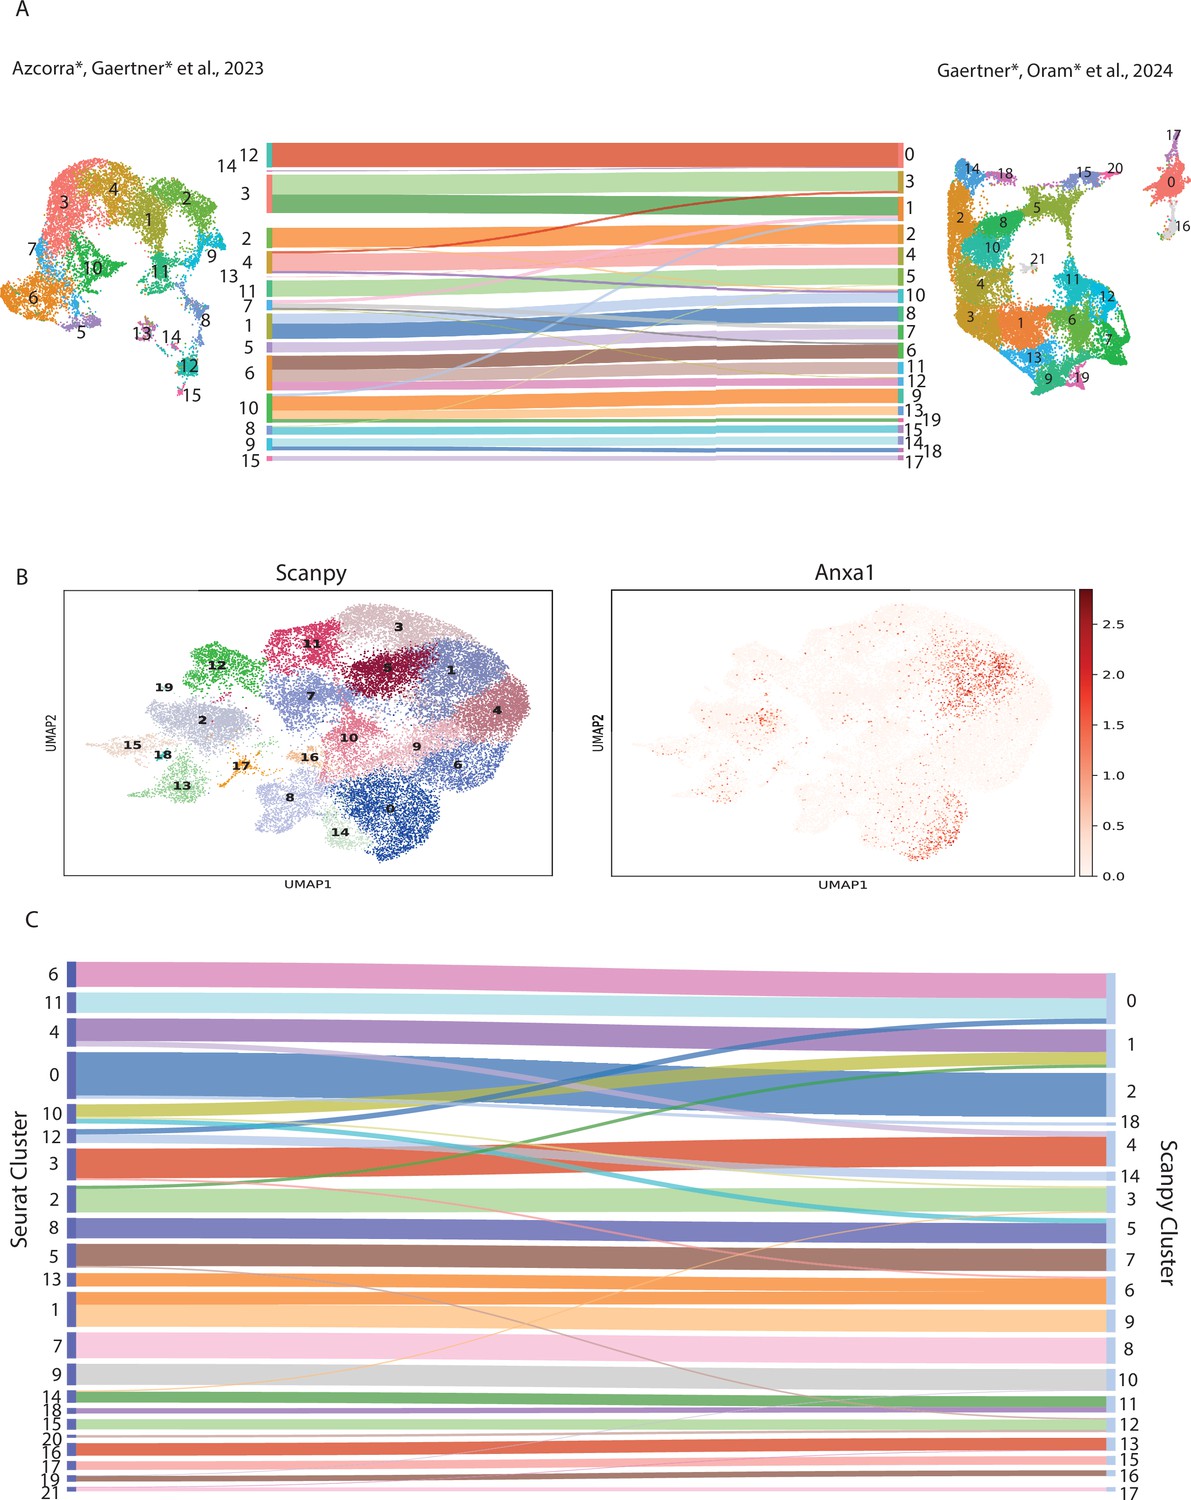
Validating single-nuclear RNA sequencing (snRNA-seq) clusters with Python and published dopamine (DA) clusters.
(A) Comparison of UMAP from Azcorra et al., 2023 and UMAP from Figure 1. A Sankey diagram was created by mapping nuclei collected in Figure 1 onto the clusters from Azcorra et al., 2023. The Sankey diagrams only include cell transfers that make up at least 5% of the cluster. (B) UMAP representation of clusters using Scanpy package on Python and expression of Anxa1 gene. (C) Sankey diagram comparing the clustering of the dataset from Figure 1 using Scanpy and Seurat. Note, that cells in cluster 19 of the Scanpy plot did not transfer to one cluster in Seurat with >5% of its total cell count.
Figure 3 with 2 supplements
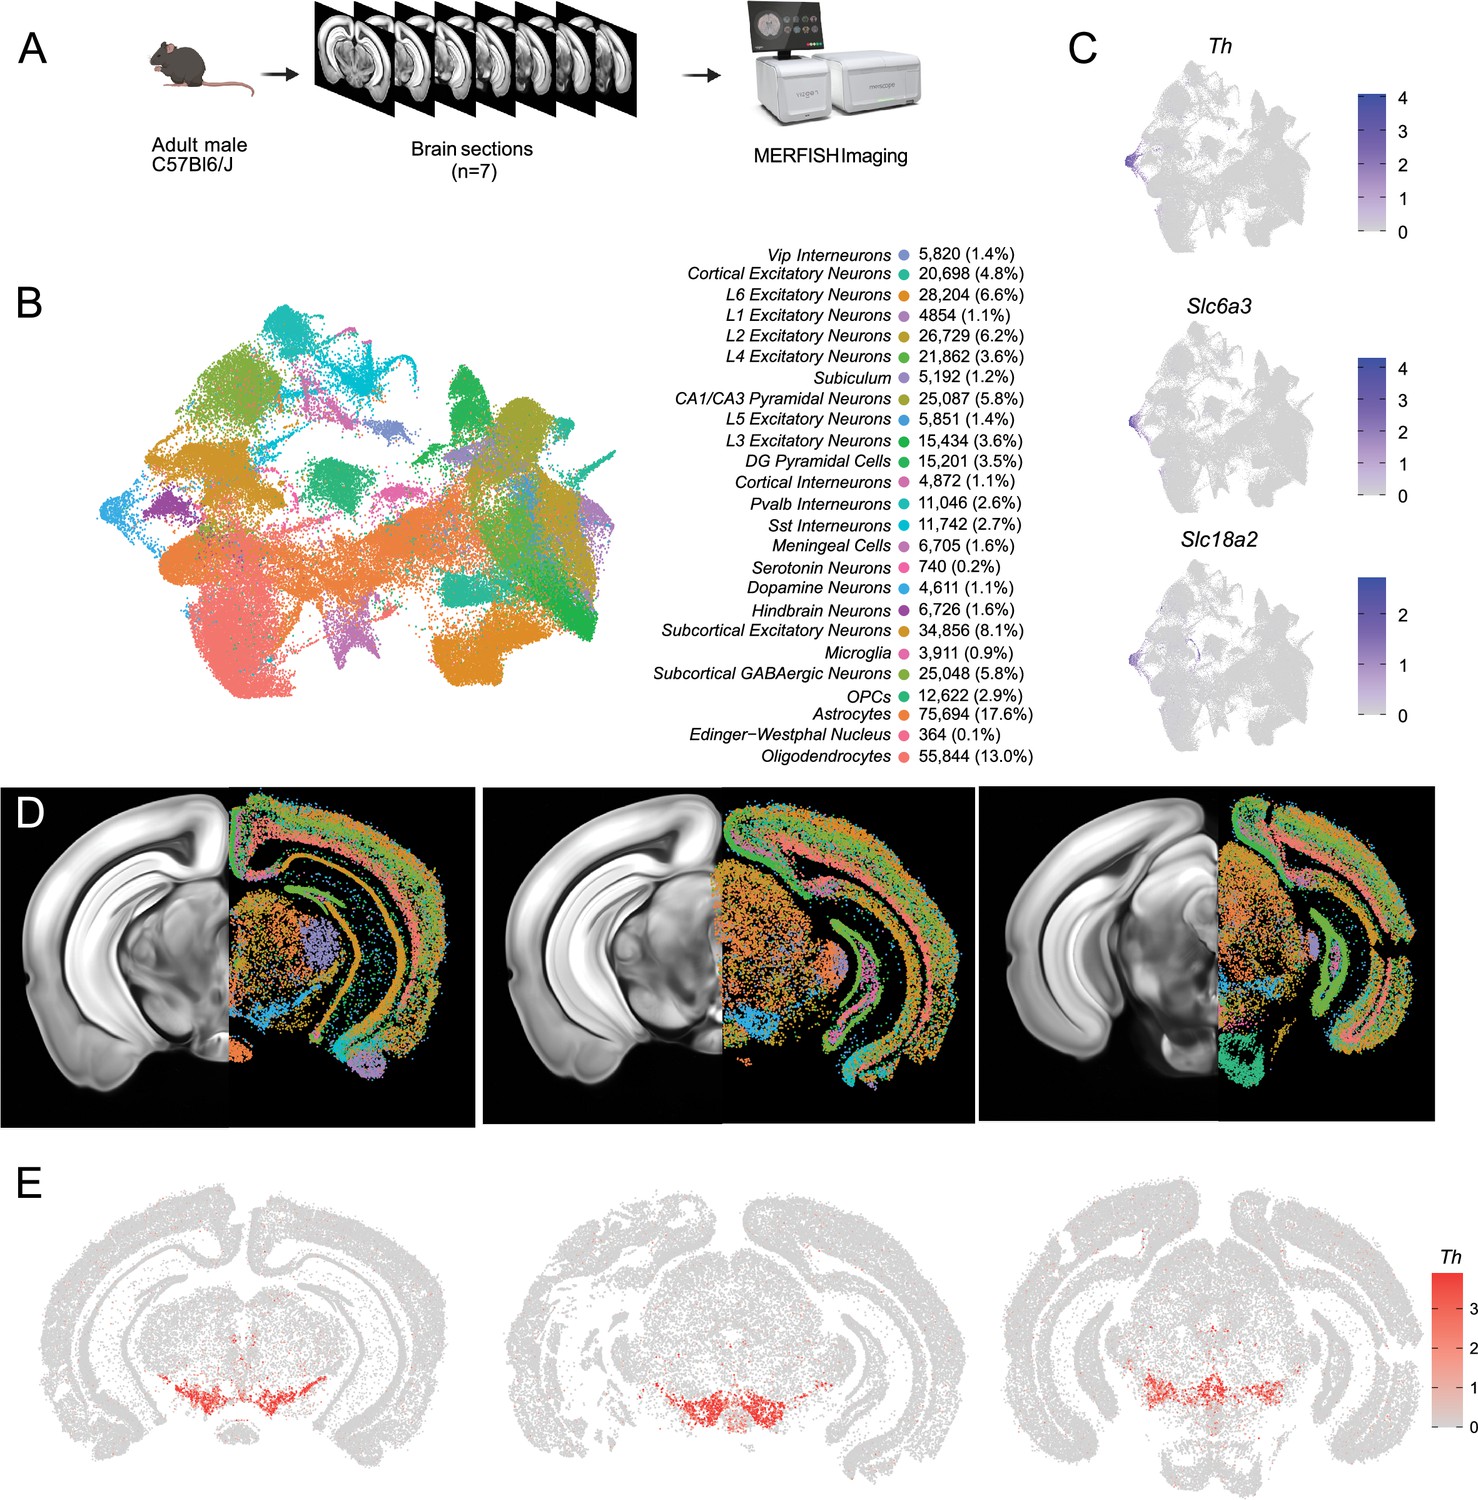
Identification of dopamine neurons in MERFISH.
(A) Schematic showing the processing and imaging of brain tissue with MERFISH. (B) Clustering and annotation of all cells identified by MERFISH. (C) Relative expression of Th, Slc6a3, and Slc18a2 shows the presence of a single cluster (blue cluster in B) that expresses all three genes. (D) Spatial location of neuronal clusters for whole brain MERFISH along three rostral-caudal delineations associated with −3.0, –3.2, and –3.6 mm Bregma. (E) Cellular expression of Th in the sections shown in (D).
Figure 3—figure supplement 1
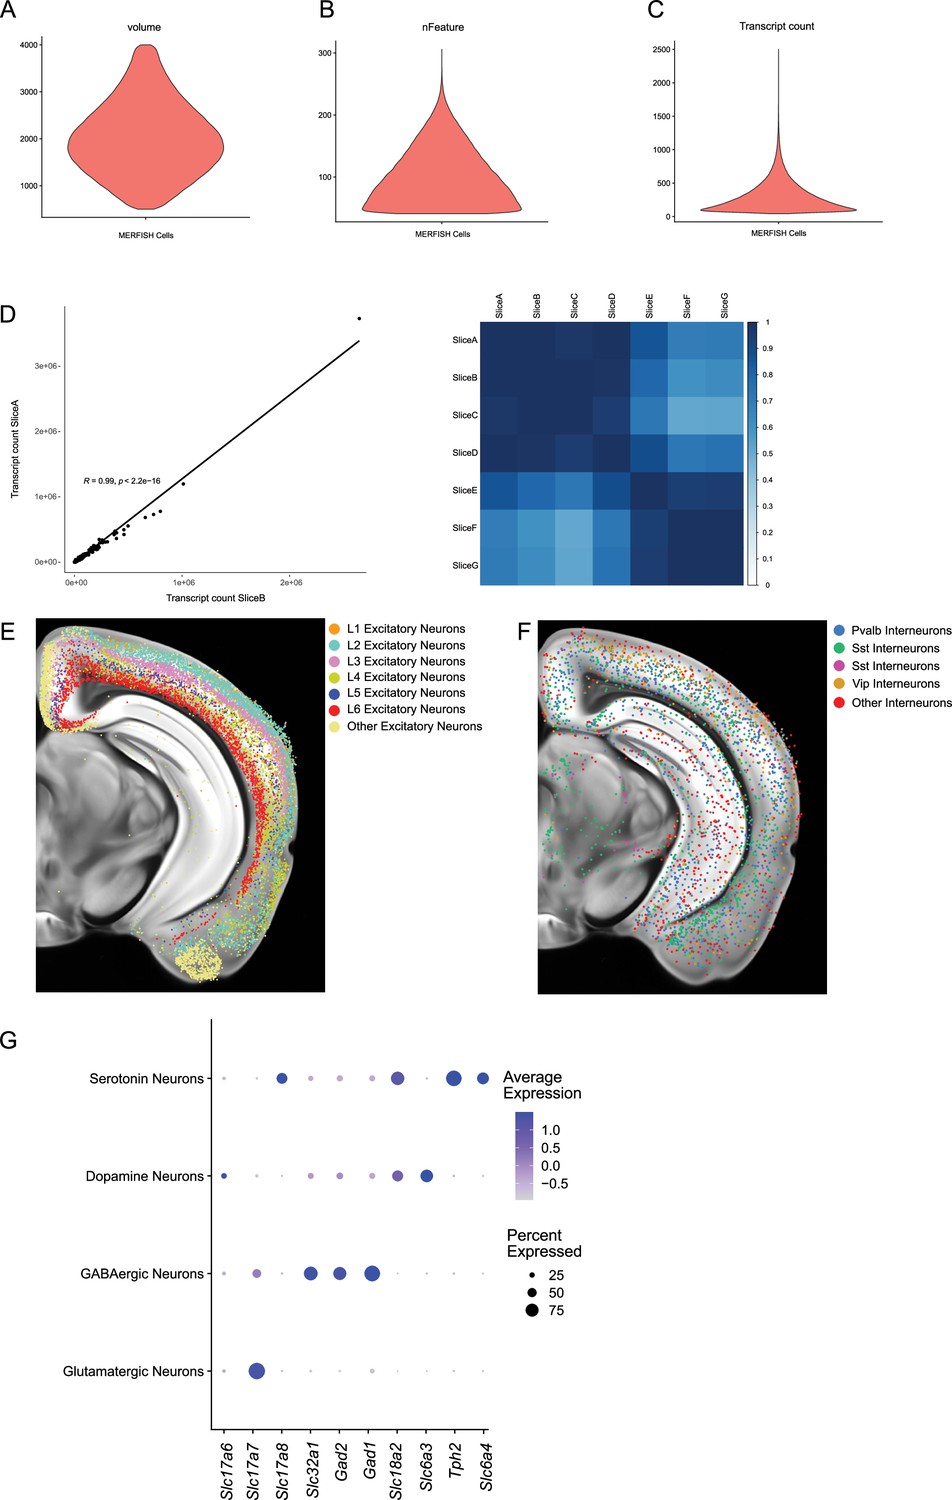
Quality control metrics for MERFISH experiments.
(A–C) Volume, number of features (nFeatures), and number of total transcripts counts (nCounts) metrics for each cell identified in MERFISH experiments after quality control. (D) Example correlation coefficient between total cellular transcripts detected for each gene across two experiments and a matrix showing experimental similarity. Spatial location of cortical excitatory (E) and inhibitory (F) neurons show distinct layering patterns by MERFISH imaging. (G) Relative expression levels of groups of genes associated with synthesis and secretion of glutamate (Slc17a6, Slc17a7, Slc17a8), GABA (Slc32a1, Gad1, Gad2), dopamine (Slc6a3, Th), and serotonin (Tph2, Slc6a4) showcase the multilingual nature of the dopaminergic and serotonergic systems.
Figure 3—figure supplement 2
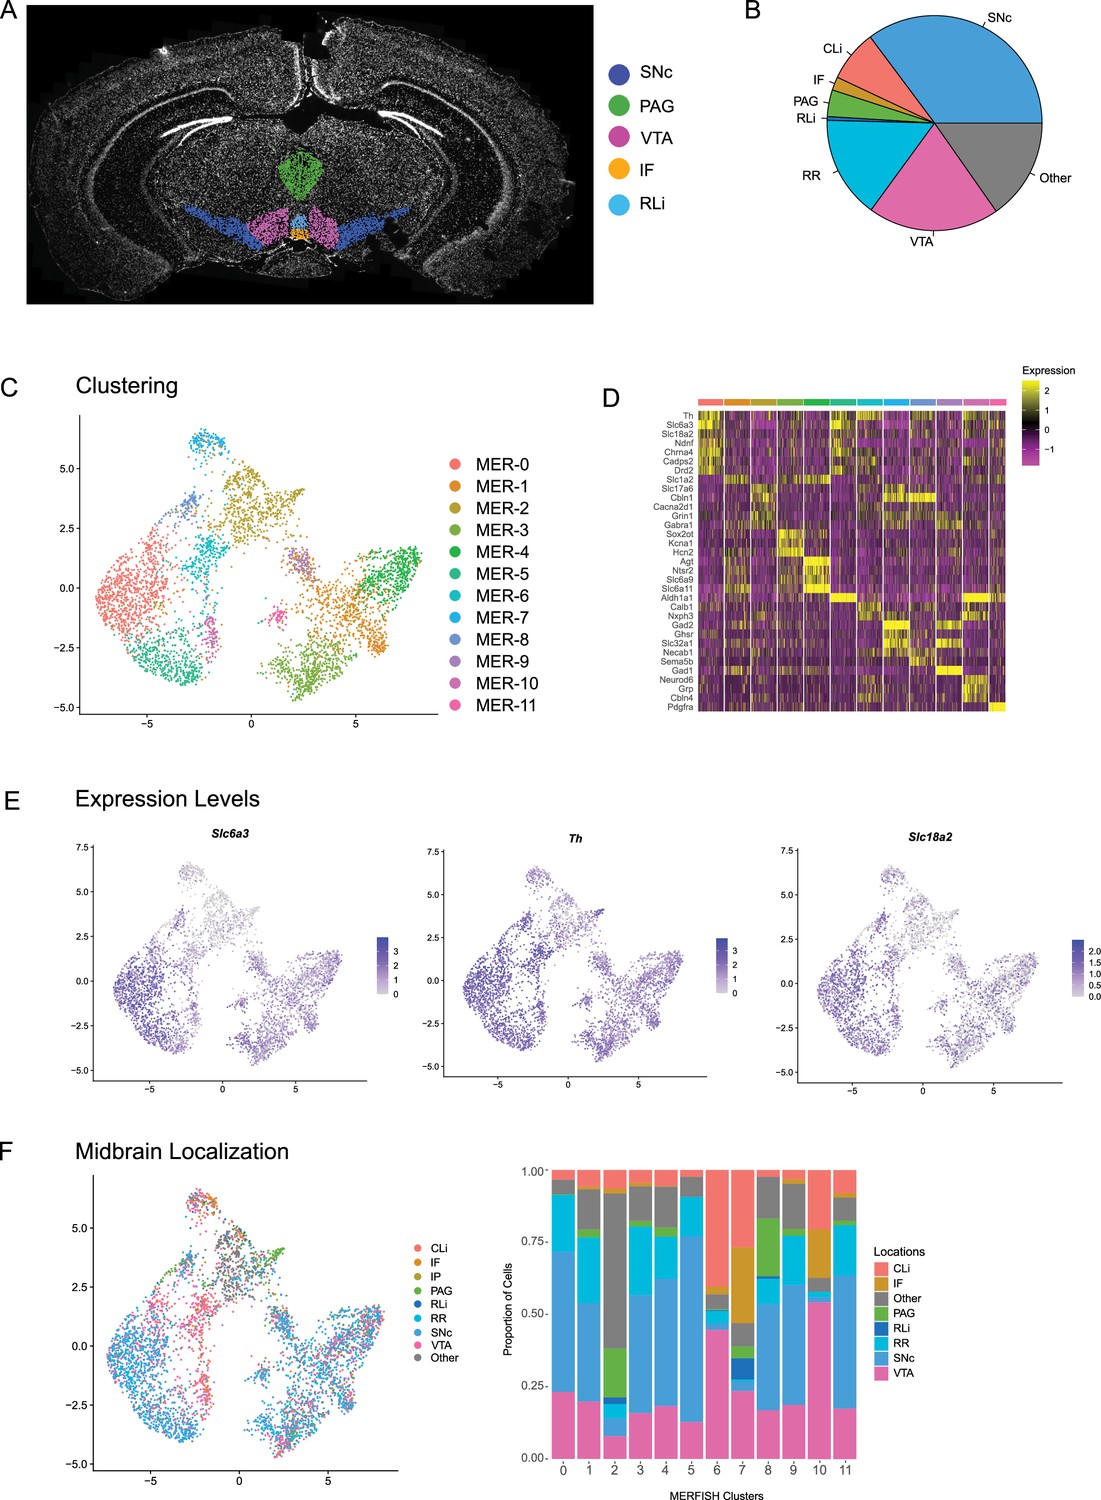
Clustering of dopamine (DA) neurons identified by MERFISH.
(A) Schematic showing the manual outlining of anatomical regions of the ventral midbrain. (B) Relative proportions of total DA neurons identified by MERFISH distributed throughout the following ventral midbrain structures: substantia nigra pars compacta (SNc), ventral tegmental area (VTA), interfascicular nucleus (IF), rostral linear nucleus (RLi), caudal linear nucleus (CLi), periaqueductal gray (PAG), and retrorubral region (RR). (C) Subclustering of DA neurons from the MERFISH dataset reveals 12 distinct subclusters. (D) Heatmap showing relative expression of genes associated with the dopaminergic character and the top three differentially expressed genes within each cluster identified in (c). (E) Relative expression of genes associated with dopaminergic character (Slc6a3, Th, Slc18a2) distributed across DA clusters. (F) Midbrain location of clusters identified by MERFISH using the manual outlining described in (A).
Figure 4 with 3 supplements
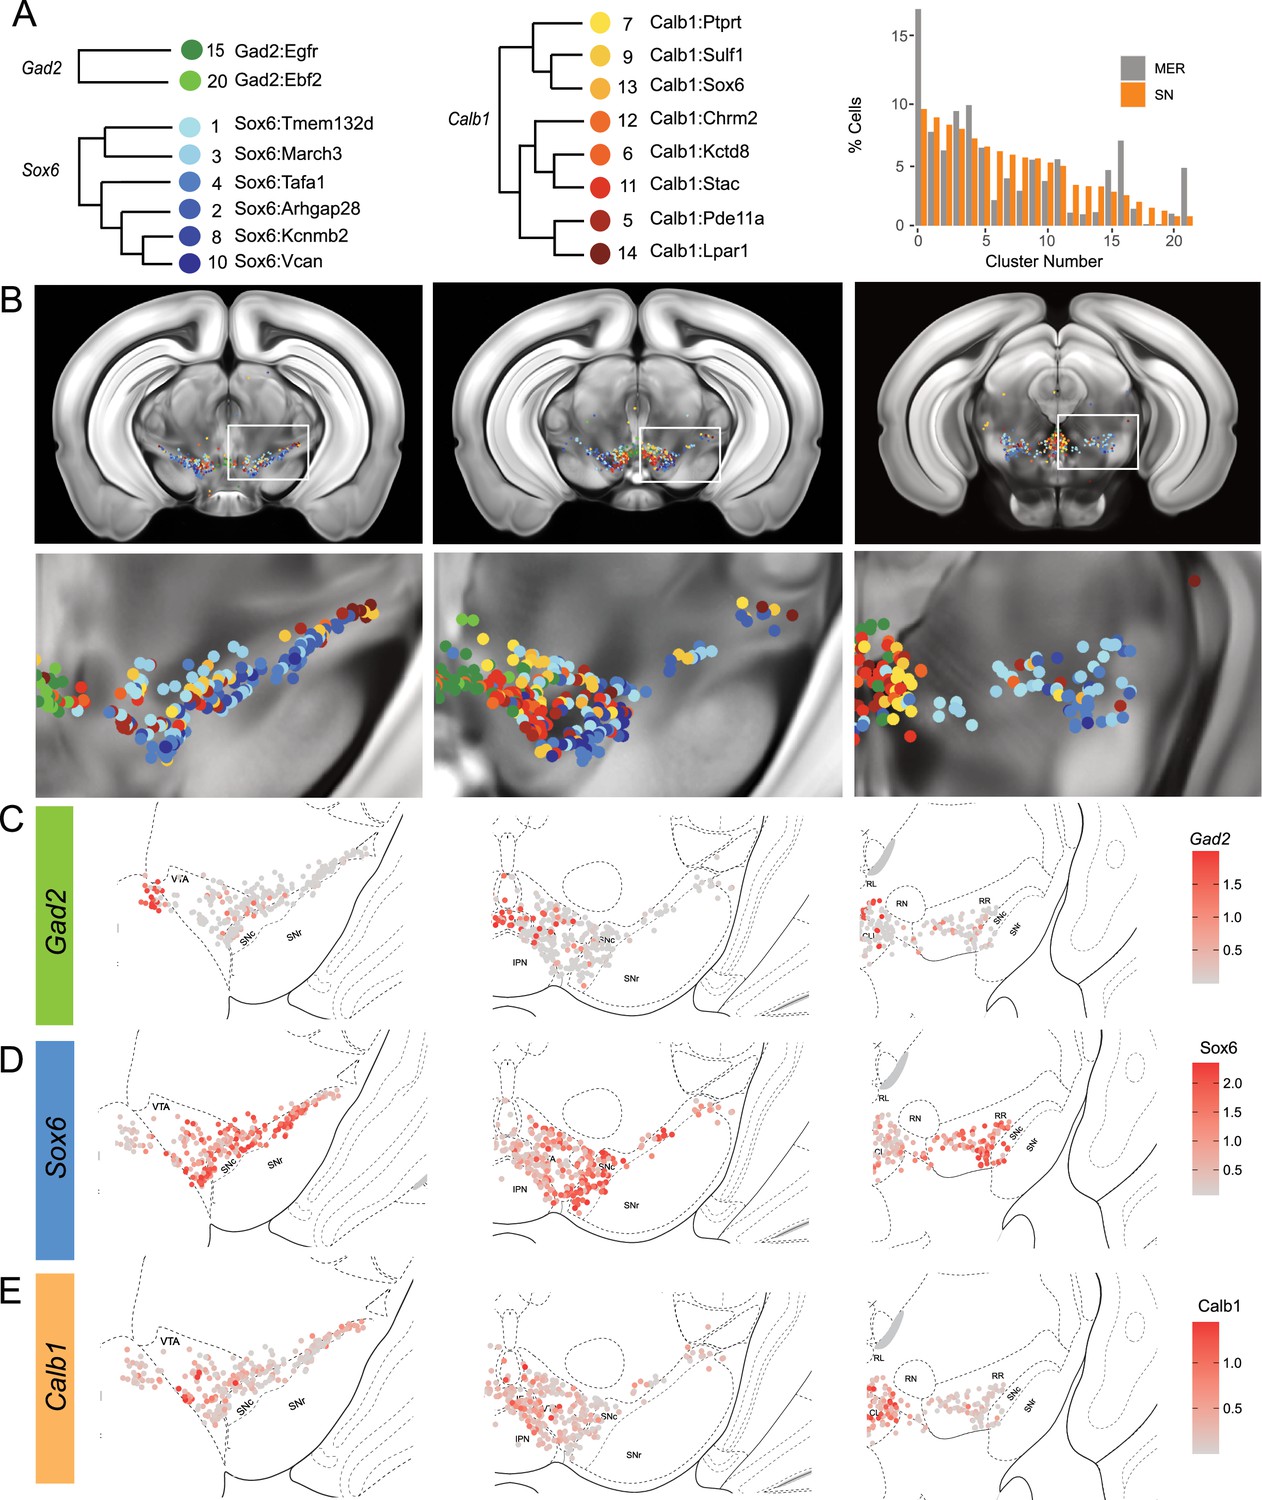
Mapping of MERFISH data with single-nuclear RNA sequencing (snRNA-seq) clustering: (A) Grouping and recoloring of snRNA-seq clusters into distinct families represented by Gad2, Sox6, and Calb1 (Left).
Relative proportion of dopamine neurons comprising each cluster from the snRNA-seq (SN, orange) and MERFISH label transfer (MER, gray) data (Right). (B) Spatial representation of predicted clustering across the rostral-caudal axis, zoom of one representative hemisphere shown below. (C–E) Imputed cellular expression of Gad2, Calb1, and Sox6 across the rostral-caudal axis.
Figure 4—figure supplement 1
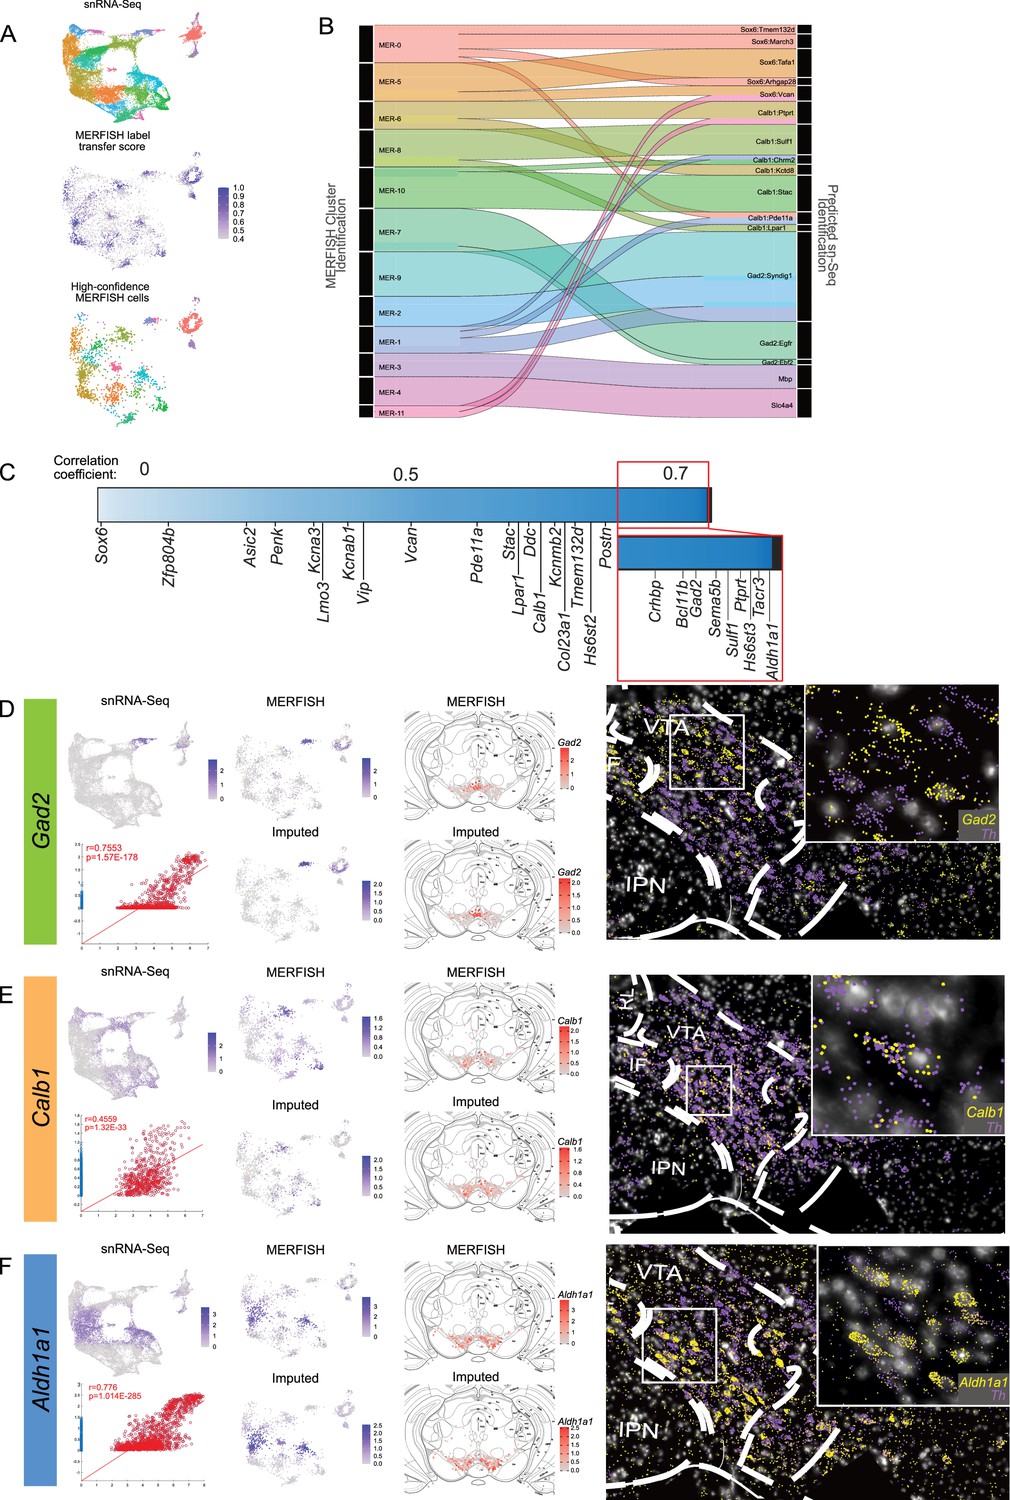
Integrating MERFISH with single-nuclear RNA sequencing (snRNA-seq): (A) Overview of MERFISH integration with snRNA-seq dataset (top).
snRNA-seq UMAP space and cluster identification were transferred to MERFISH cells by identifying mutual nearest neighbors (MNN) and assigning a score based on the overlap of neighbor cells that share the same labeling (middle). High-confidence MERFISH cells (bottom) were identified as those that showed a cell similarity score >0.5 (2298 of 4399 original dopamine, DA neurons). (B) Sankey plot showing the proportion of cells from MERFISH clustering identities that make up the snRNA-seq clustering identities. Flow chart only includes cell transfers that make up at least 10% of the snRNA-seq cluster. (C) Heatmap showing the distribution of correlation coefficients for each gene in our MERFISH panel. Correlation coefficients were found by calculating the correlation between MERFISH transcript counts vs. Predicted (Imputed) transcript counts for the 500 genes used in our panel. The heatmap is made up of 500 columns with each column colored to associate with that genes r-value, so it is not a linear plot. The labels point to the column representing genes associated with major family subdivisions. The minimum correlation value is –0.189 for Sox6. (D–F) Comparison of the transcript detection in snRNA-seq dataset, MERFISH dataset, and imputed gene expression for Gad2, Calb1, and Aldh1a1. Spatial location of normalized transcript counts and imputed data show similar distributions (middle). Example representations of individual transcripts detected by MERFISH in the ventral tegmental area (VTA) for each gene (right and inset).
Figure 4—figure supplement 2
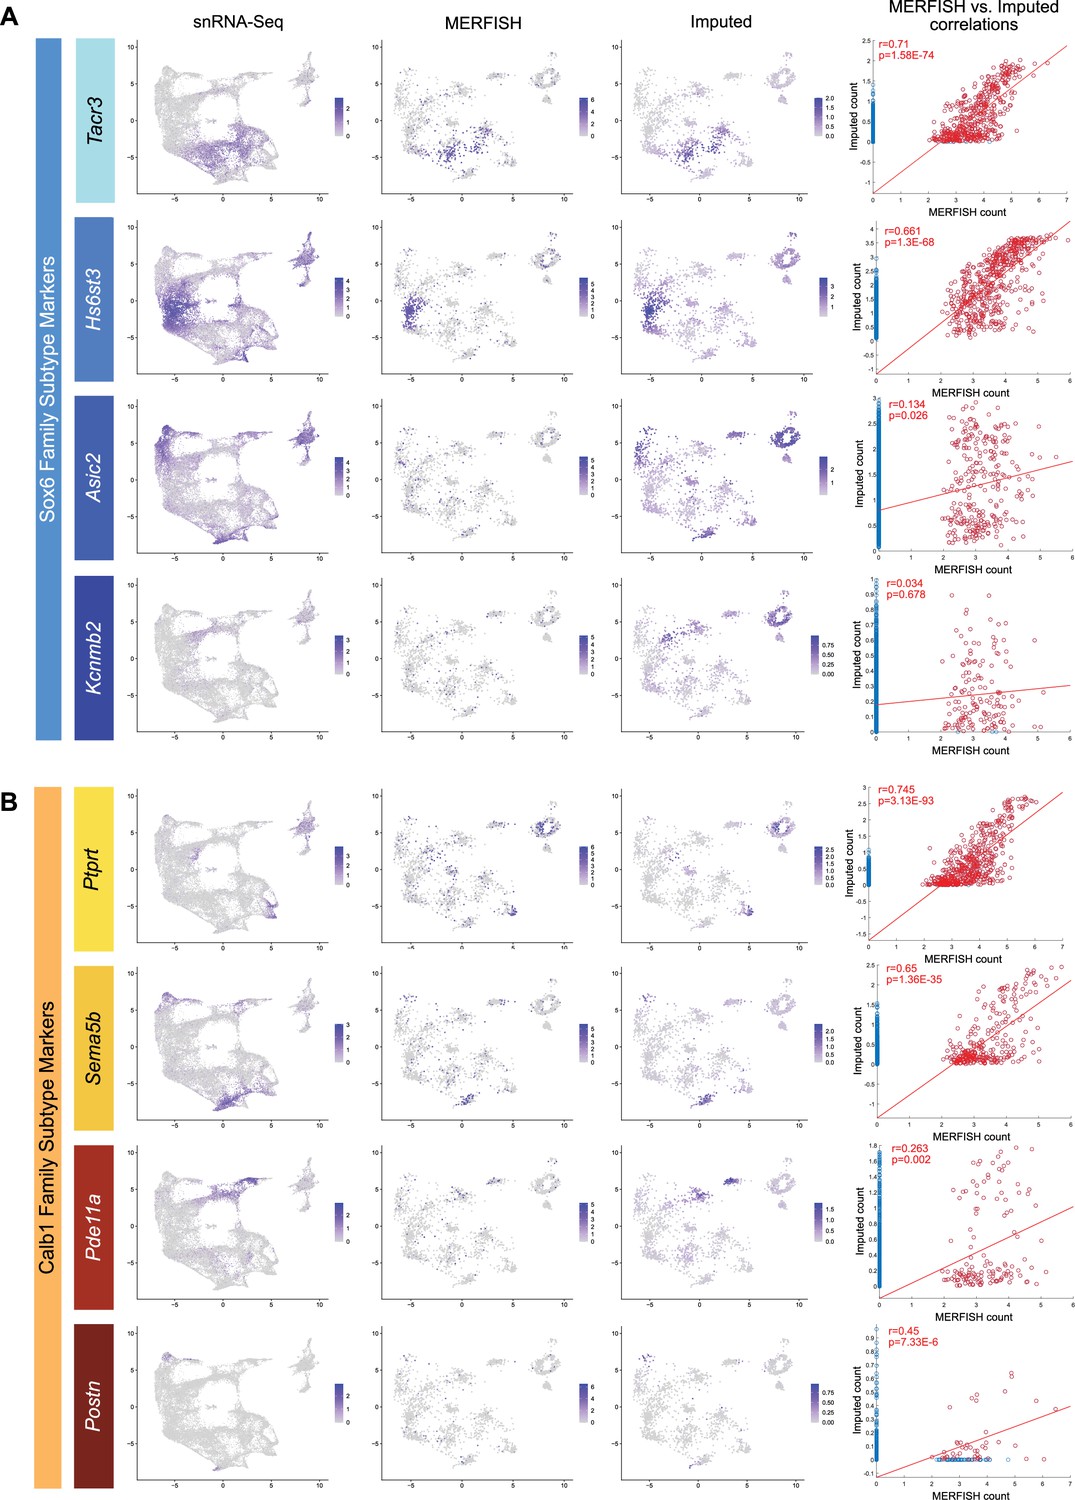
Correlation of MERFISH vs imputed transcript counts for markers of the Sox6 (A) and Calb1 (B) families.
Expression plots were generated comparing the expression of single-nuclear RNA sequencing (snRNA-seq) (far left), MERFISH (second from left), and imputed (second from right) transcripts for genes associated with each cluster family. Only high-confidence cells from the MERFISH experiments were used in these plots. Correlation plot of MERFISH vs imputed transcript counts (far right) show the strength of imputation. Correlation coefficients were calculated using only cells with non-zero transcript counts in MERFISH and imputed datasets. Each family shows two genes that correlate strongly and two genes that correlate weakly, the latter of which may be due to technical limitations.
Figure 4—figure supplement 3

Quantifications of subtypes by anatomic localization.
(A) Anatomical distribution of dopamine (DA) neurons colored by cluster family. (B) Anatomical distribution of DA neurons colored by individual cluster identity.
Figure 5
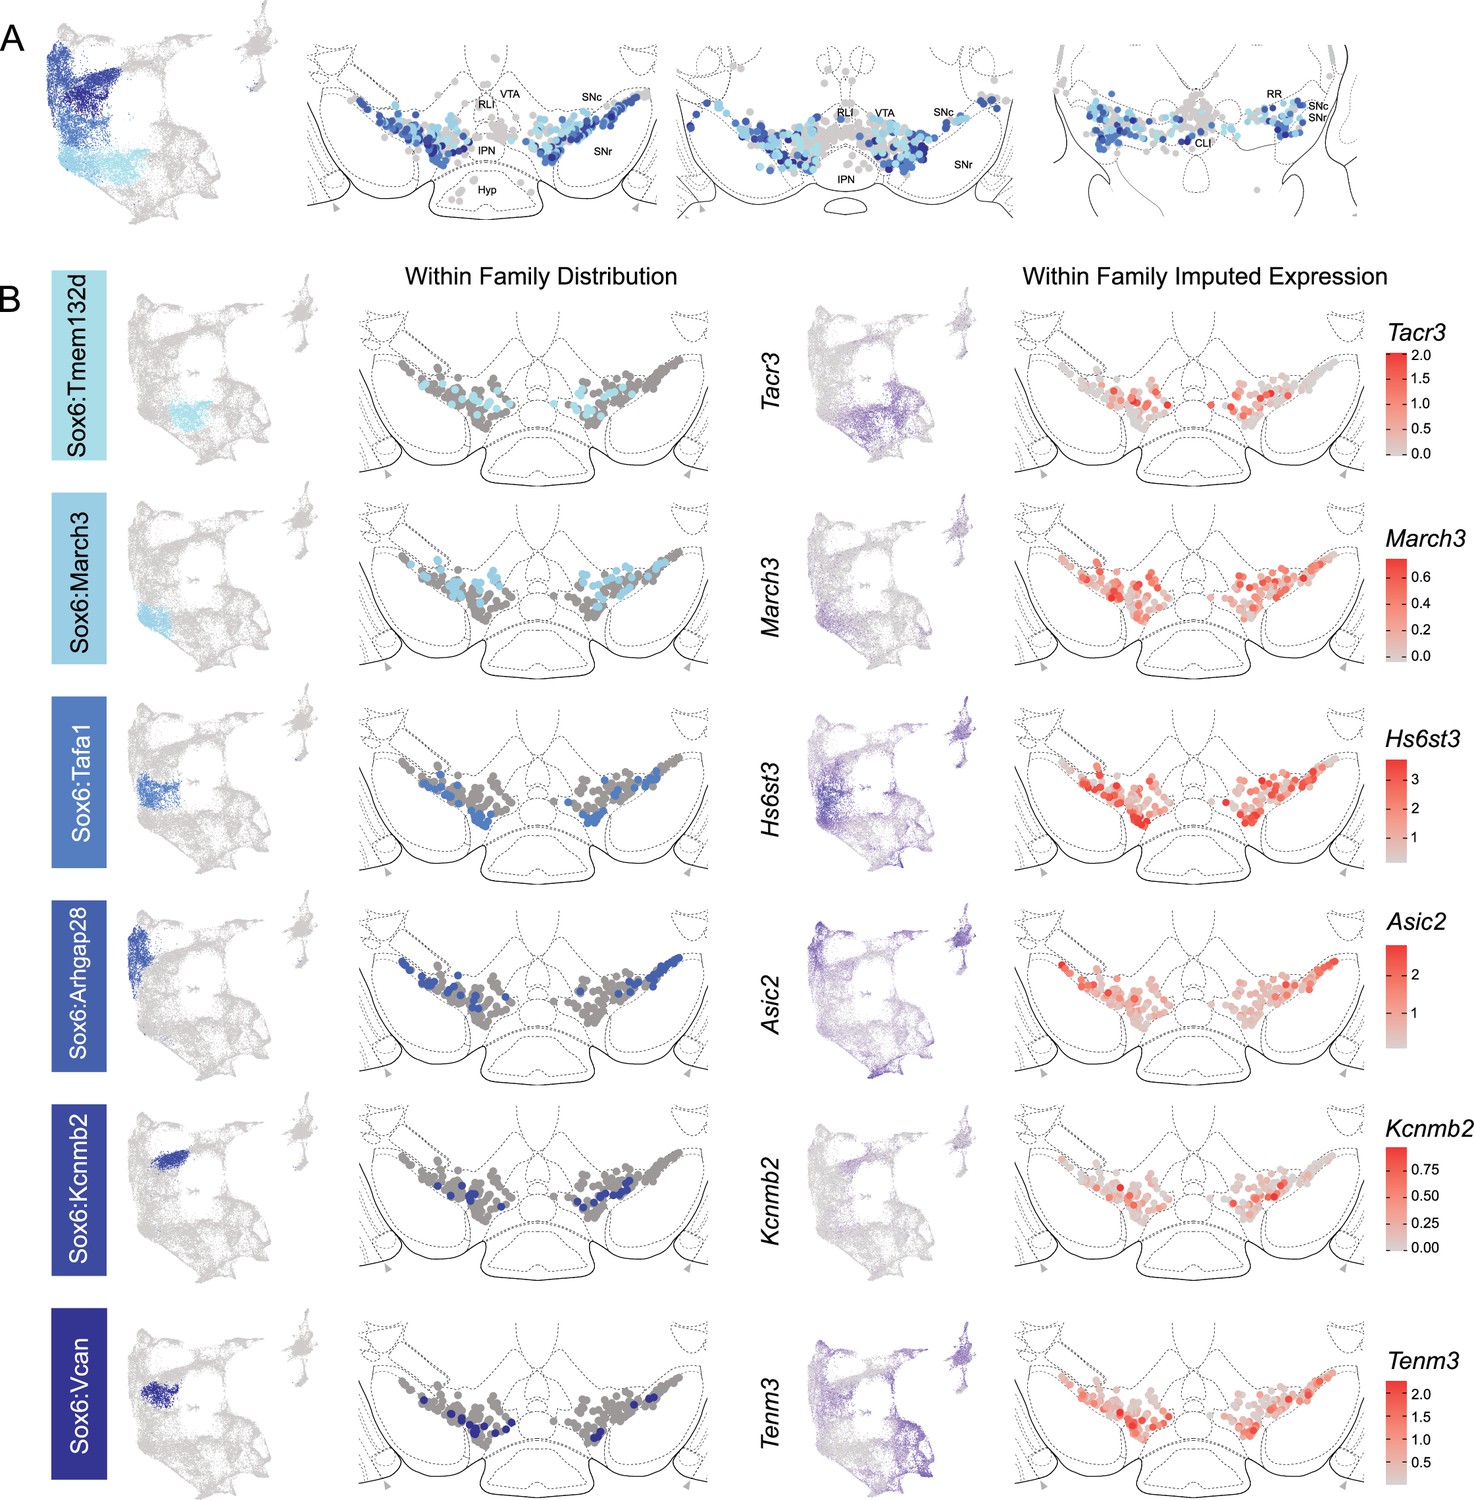
Spatial localization of Sox6 family of dopamine (DA) neurons.
(A) Distribution of Sox6 family DA neuron subtypes relative to all other DA neurons along the rostral-caudal axis. DA cells belonging to the Calb1 and Gad2 families are colored in light gray. (B) Location of individual subtype within the Sox6 family (left two panels) with other cells in the Sox6 family shown in dark gray. Relative cellular expression of genetic markers associated with each subfamily is shown in a UMAP and a midbrain section.
Figure 6
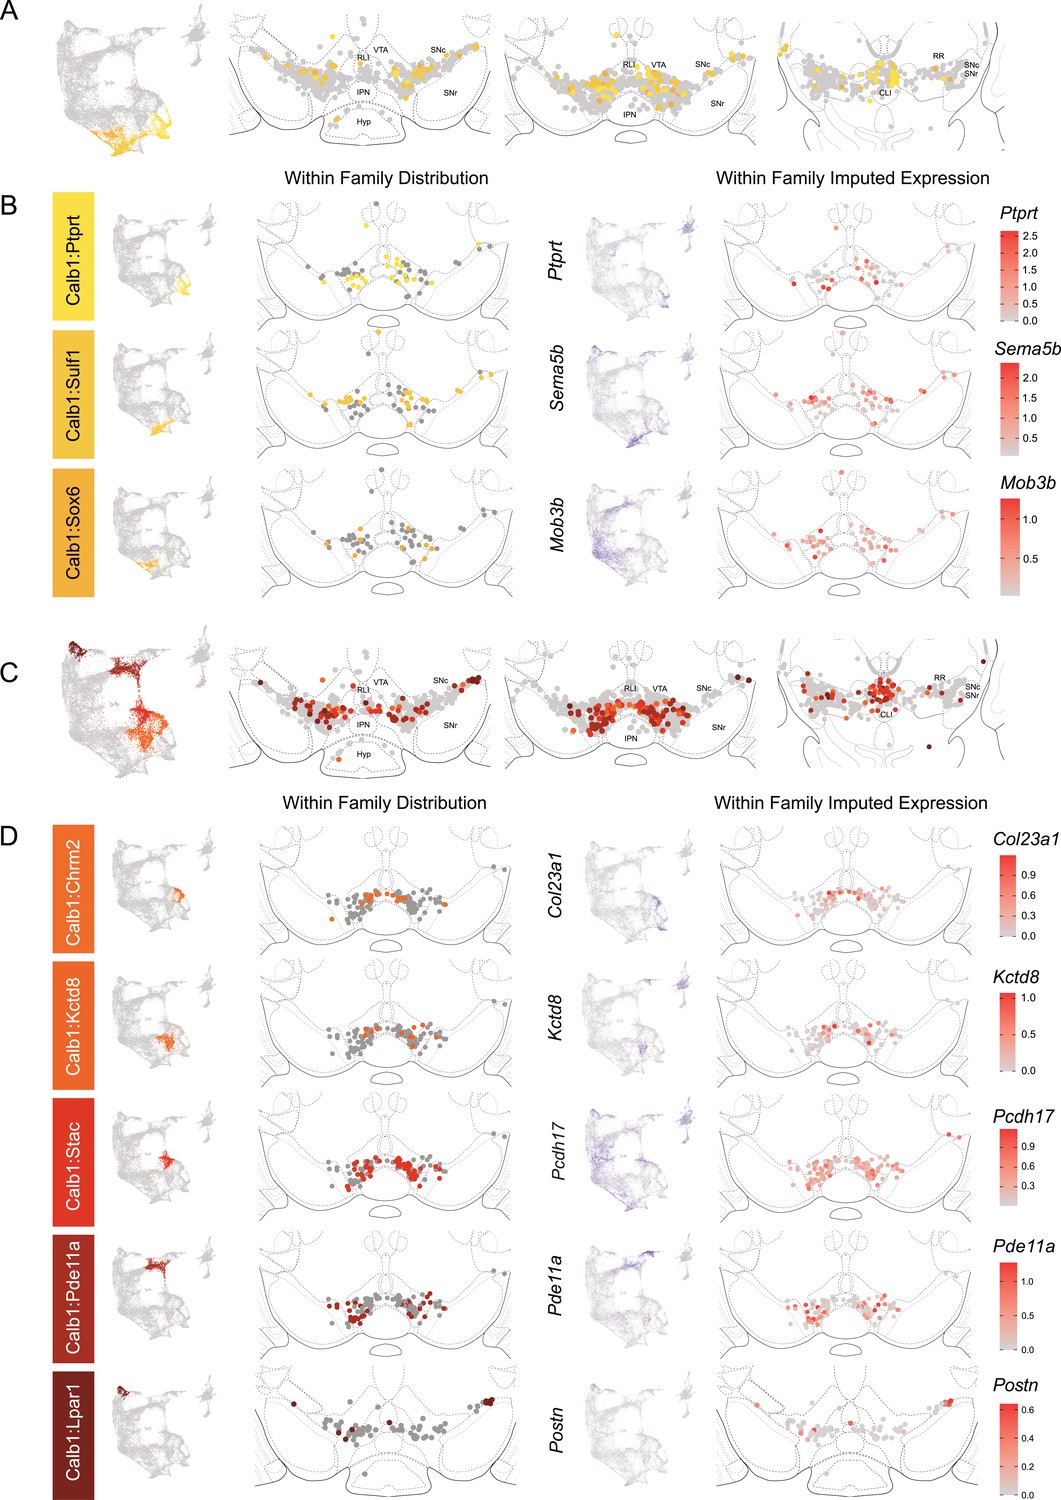
Spatial localization of the Calb1 family dopamine (DA) neurons.
(A) Calb1 family of neurons was divided into two distinct branches based on hierarchical clustering. Distribution of Branch 1 of Calb1 family DA neurons along the rostral-caudal axis with all other DA cells colored in gray. (B) Location of individual clusters within Branch 1 of the Calb1 family. Only cells in the Branch 1 subset are shown. Relative cellular expression of genetic markers associated with each subtype is shown in a UMAP and brain section. (C) and (D) equivalent plots as (A-B), but for Branch 2 of the Calb1 family of DA neurons. Relative cellular expression of genetic markers associated with each subfamily is shown in a UMAP and a midbrain section.
Figure 7
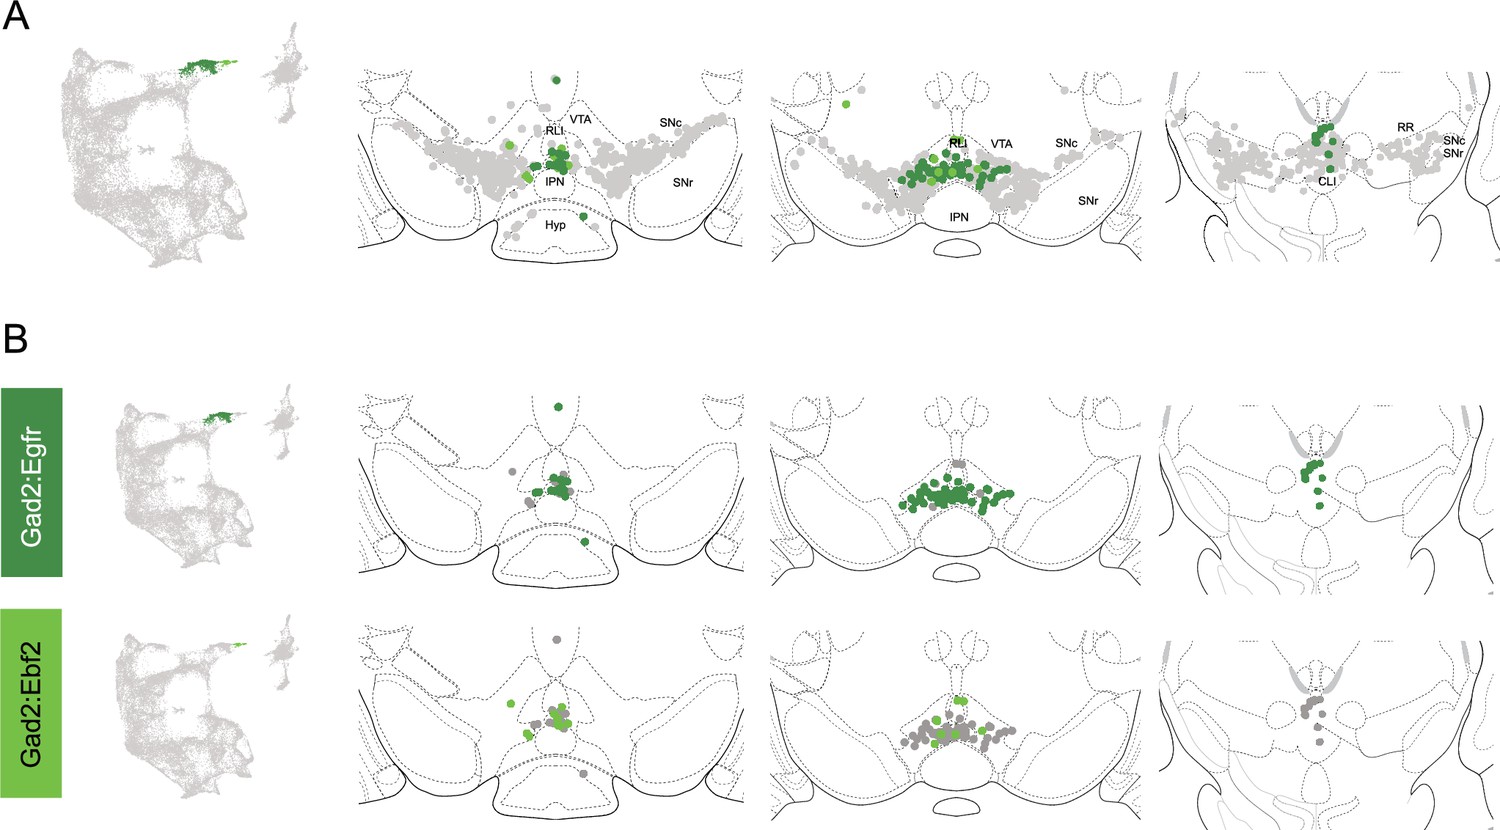
Spatial location of Gad2 family dopamine (DA) neurons.
(A) Distribution of Gad2 family DA neurons along the rostral-caudal axis with other DA cells colored in gray. (B) Location of individual subtypes within the Gad2 family with only cells of the Gad2 family shown in gray.
Figure 8 with 1 supplement
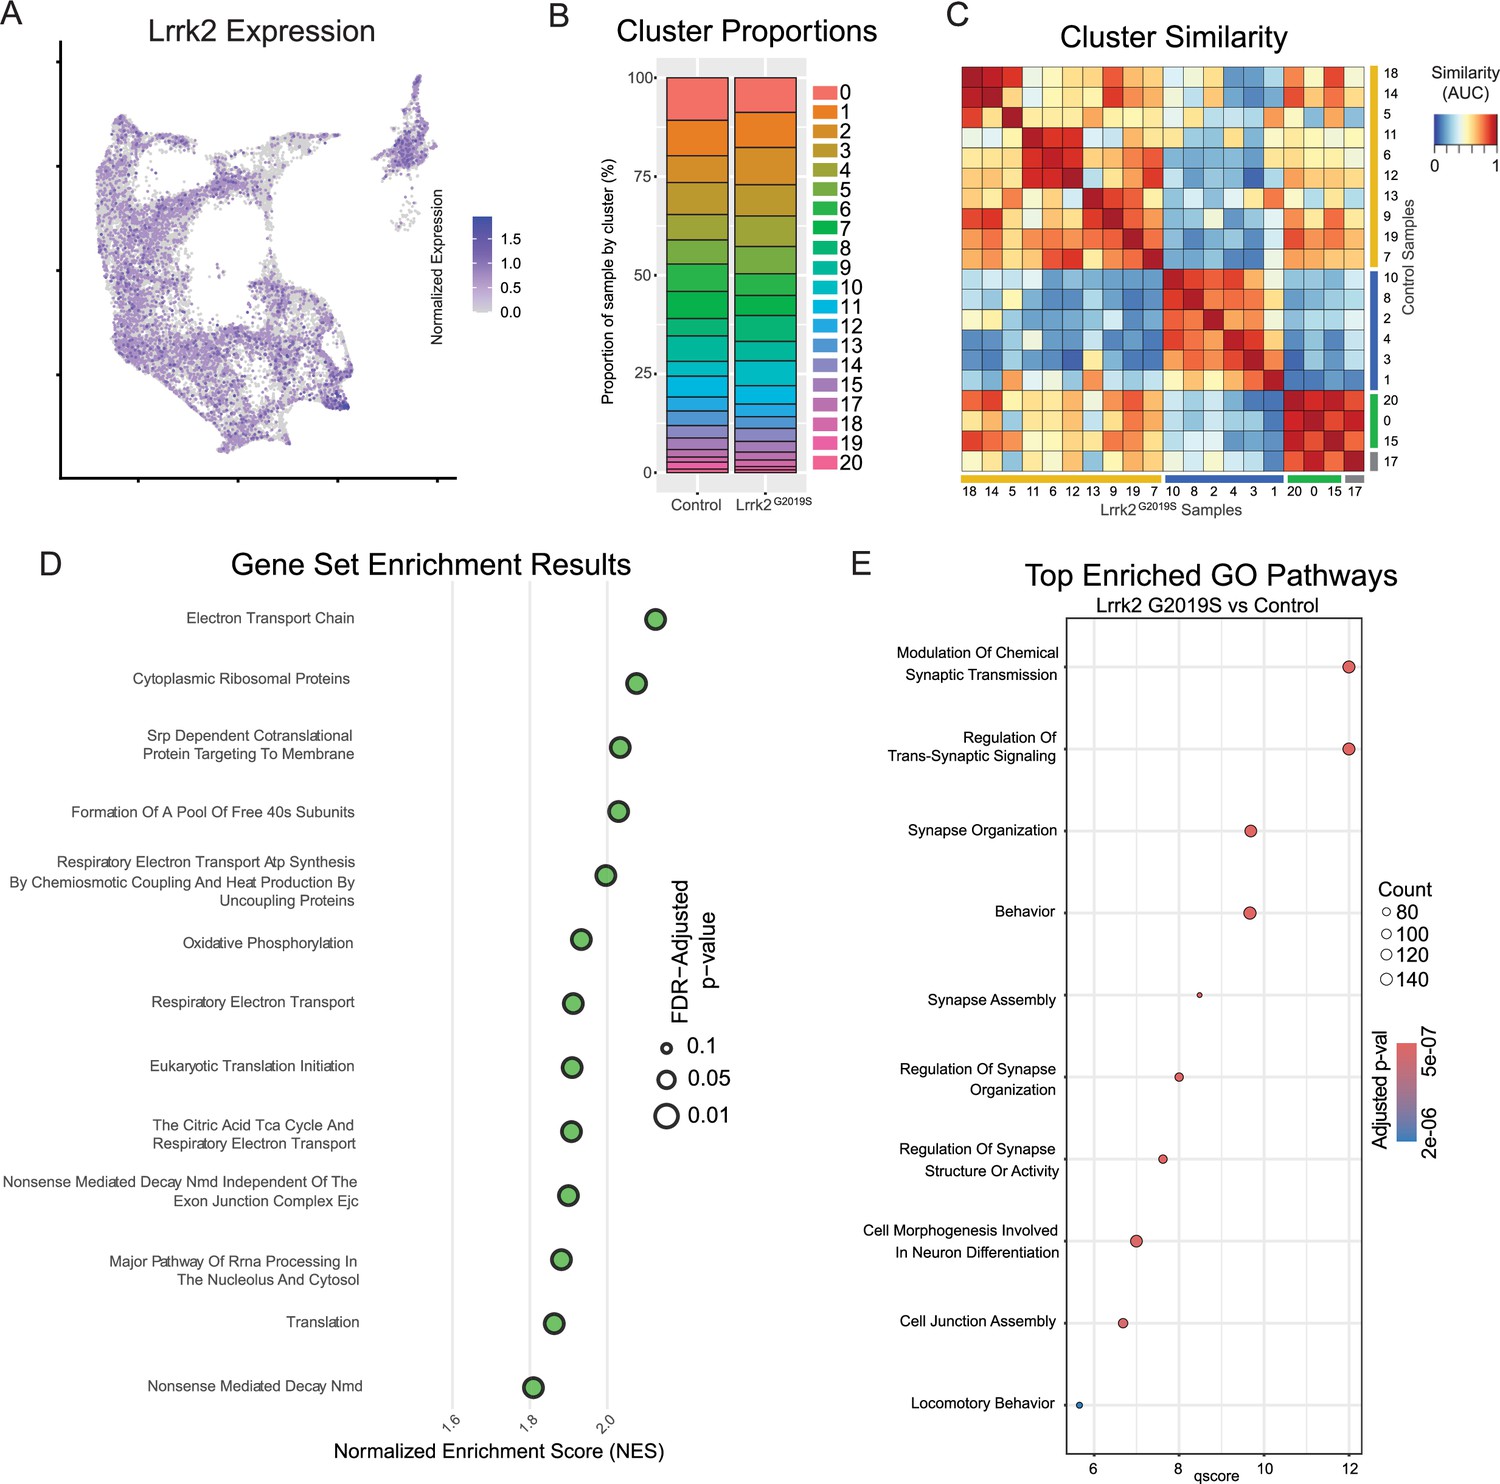
Global effects of Lrrk2G2019S mutation are observed across all clusters.
(A) Expression pattern of Lrrk2 RNA, which is present in all clusters, though notably low in Gad2Egfr (cluster 15). (B) Cluster proportions in control and mutant samples. Relative proportions of each subtype within the dataset are relatively unchanged. (C) MetaNeighbor-generated cluster similarity heatmap shows that each cluster from control samples is more similar to its corresponding cluster in the mutant samples, suggesting there is no large-scale change in cell type across samples. (D) Gene set enrichment analysis (GSEA) results comparing all clusters across conditions. Several top enriched pathways in Lrrk2 mutants are related to mitochondrial energy production/oxidative phosphorylation. (E) Gene ontology (GO) results comparing all clusters across conditions. Top enriched pathways are related to synapse organization and function, consistent with previously described synaptic dysfunction in Lrrk2G2019S mutant mice.
Figure 8—figure supplement 1
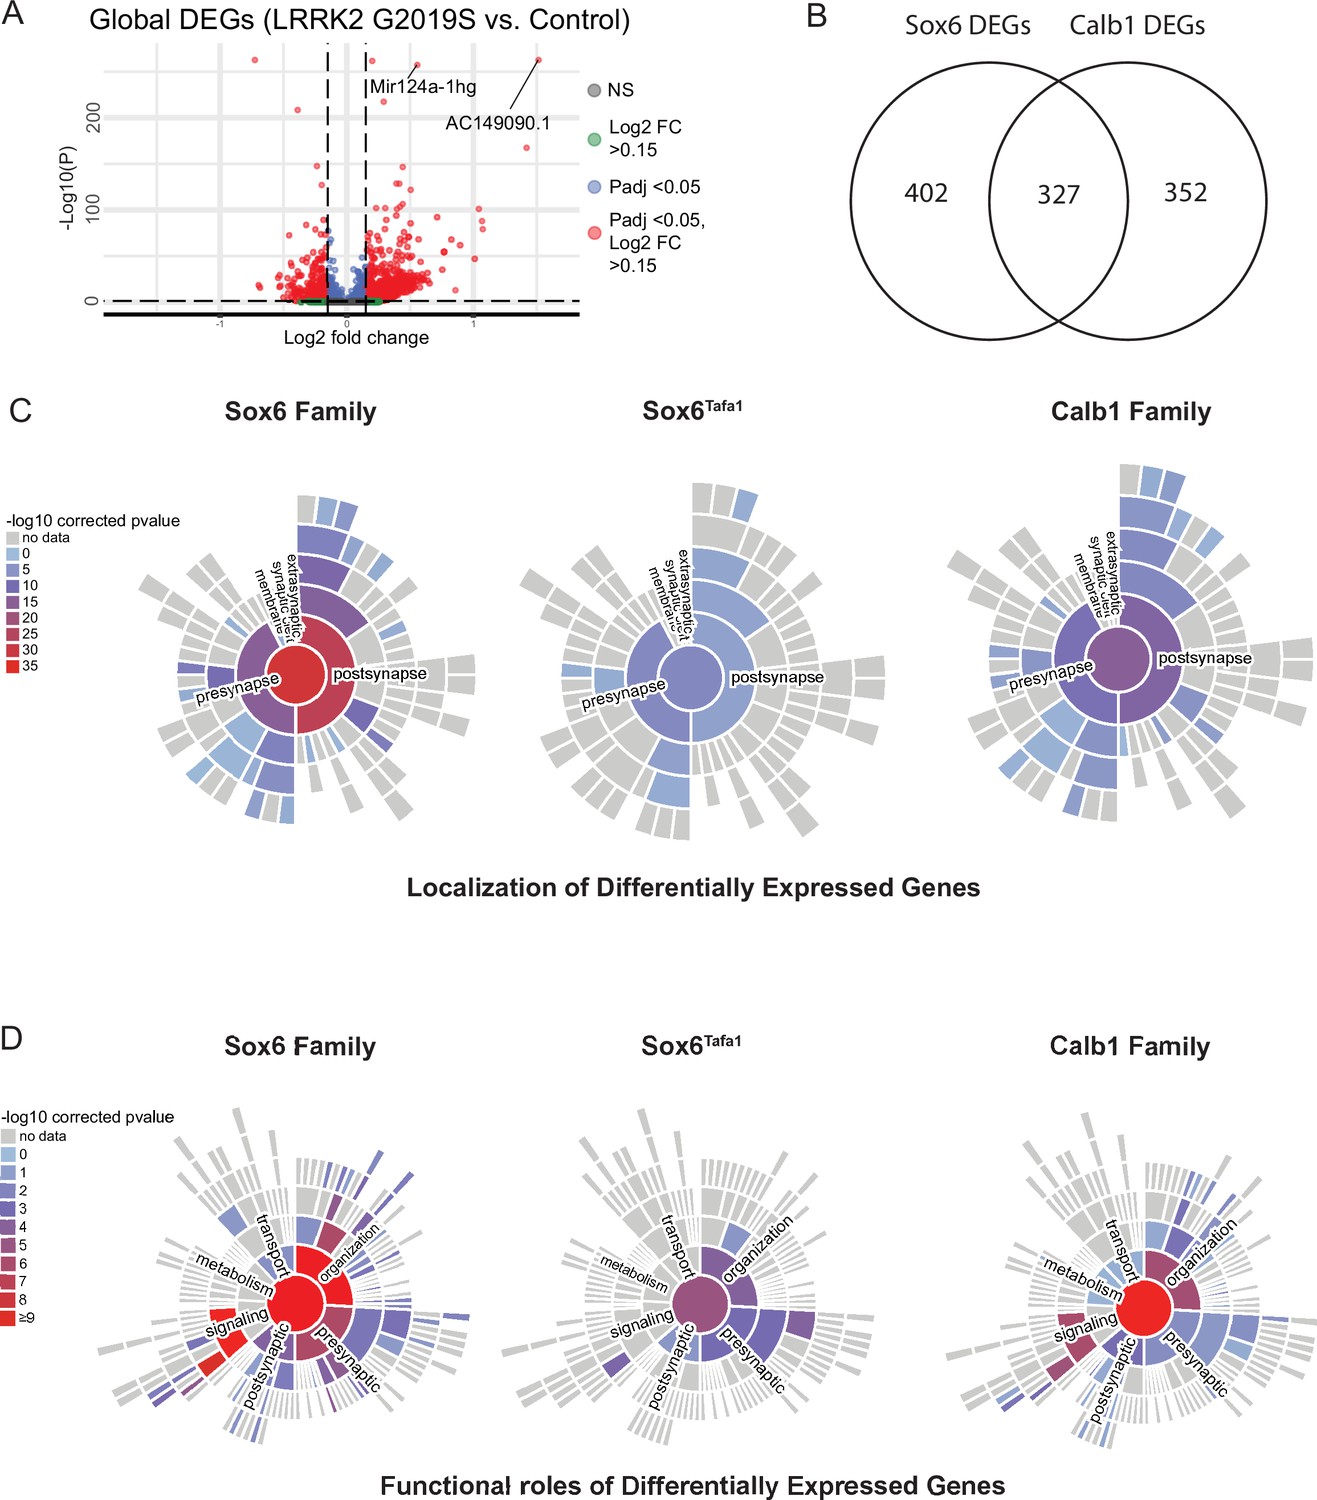
Analysis of differentially expressed genes and their synaptic localizations and functional roles using SynGO.
(A) Volcano plot of differentially expressed genes across conditions. Each point is colored according to its significance and magnitude of fold change. (B) Venn diagram of differentially expressed genes (DEGs) between Sox6 and Calb1 families. (C) Mapping of pre- and post-synaptic genes found among significant DEGs in Lrrk2G2019S mutants compared to controls for the Sox6 family, Sox6Tafa1, and Calb1 family of clusters. Bars are colored according to the relative association with each cellular compartment. (D) Functional roles of synaptic DEGs in each population in Lrrk2G2019S mutants compared to controls.
Figure 9 with 1 supplement
Changes in gene expression are observed in Parkinson’s disease (PD)-implicated dopamine (DA) neuron subtypes in Lrrk2G2019S mice.
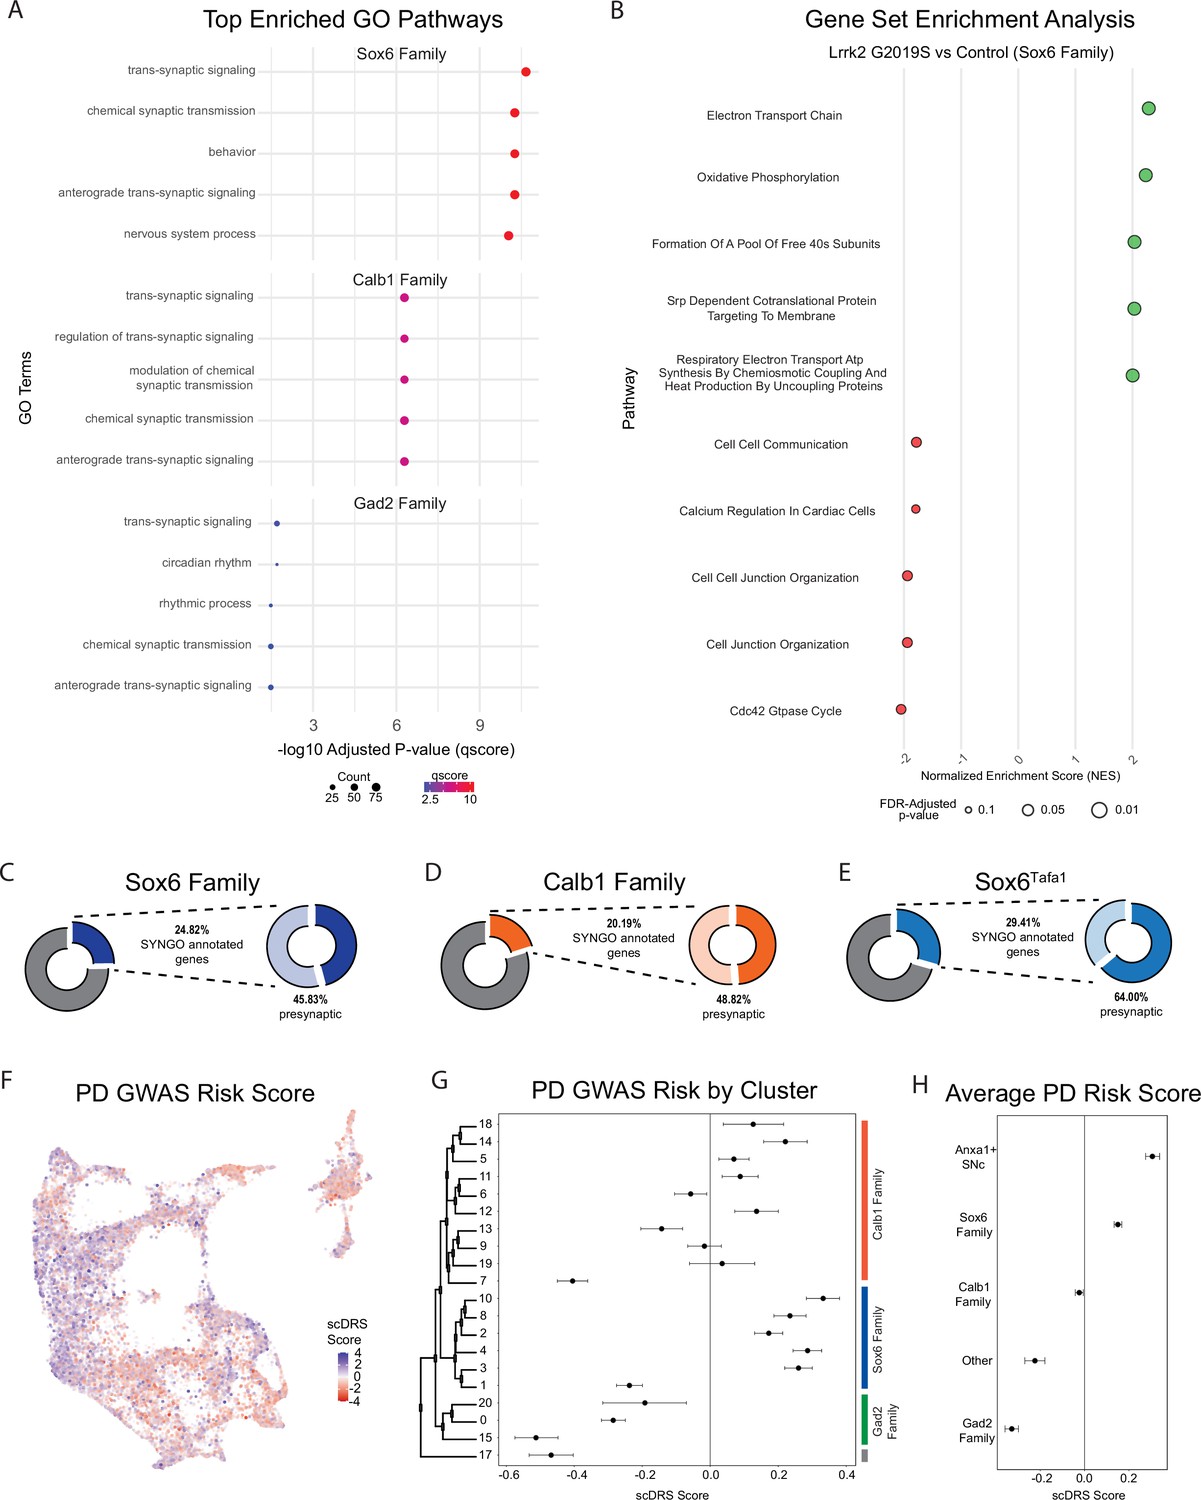
(A) Gene ontology (GO) results comparing each cluster family across conditions (top five enriched pathways shown). Several pathways are highly relevant to locomotor behavior and previously described dysfunction (such as synaptic organization pathways) in Lrrk2G2019S mutant mice. (B) Gene Set Enrichment Analysis (GSEA) results comparing Sox6 cluster family across conditions. While twenty pathways were positively enriched in mutant Sox6 family clusters (BH-corrected p-values <0.05), several additional pathways were enriched in either direction using a less conservative cutoff of p<0.1. The top five positively and negatively enriched pathways with this less conservative cutoff are shown. Pathway enrichment was similar to global changes, but more pronounced in the Sox6 family of clusters. (C–E) Results of SynGO analyses for Sox6 family (9 C), Calb1 family (9D), or Sox6Tafa1 clusters (9E). SynGO-annotated (i.e. synaptic) genes were enriched among differentially expressed genes (DEGs) for ventral substantia nigra (SNc) populations, particularly Sox6Tafa1. Of note, among these synaptic genes, the Sox6Tafa1 cluster showed much heavier enrichment for those localized to the presynapse, which may suggest subtype-specific presynaptic function in acceleration-corrected subtypes. (F) Feature plot of each cell’s association with PD risk loci proposed by GWAS as calculated by scDRS scores. Clear differences are observed across clusters. (G) Mean and 95% confidence intervals for PD GWAS risk (scDRS scores) for each cluster. The Sox6 family of clusters is particularly elevated. (H) Average risk scores with 95% confidence intervals among cluster families, as well as the combination of clusters Sox6Tafa1 and Sox6Vcan, the two Anxa1-expressing SNc clusters, which showed the highest average risk scores.
Figure 9—figure supplement 1
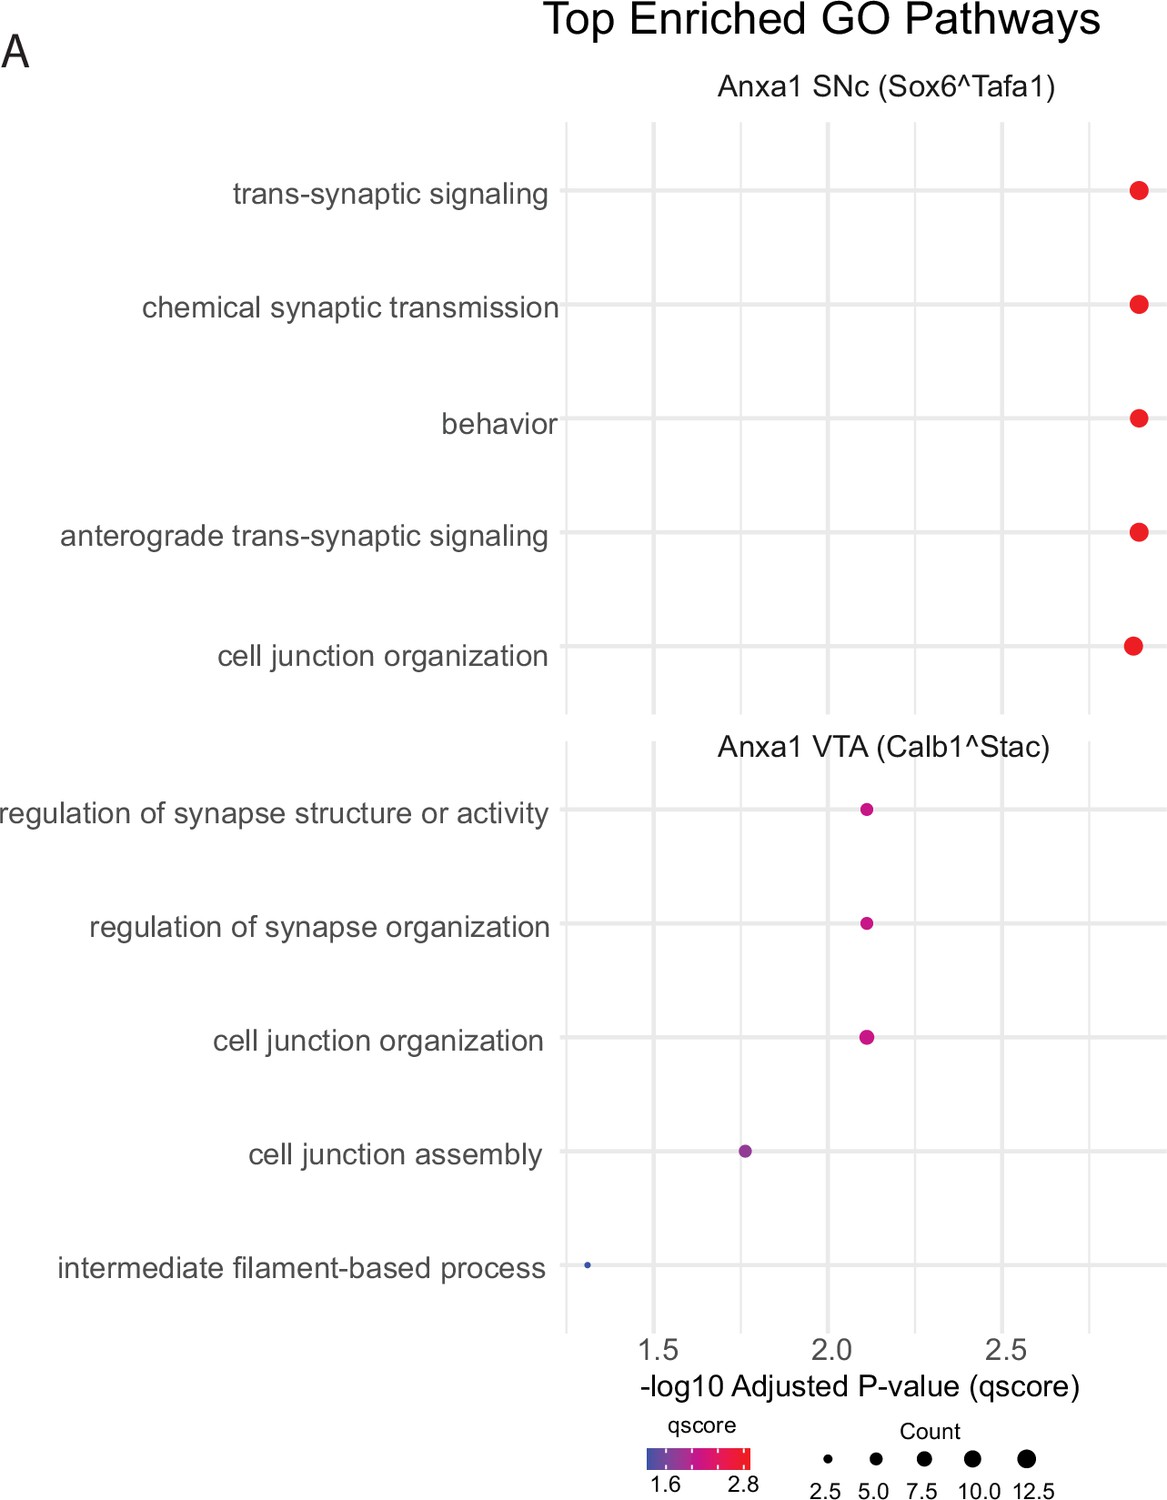
Comparison of pathway analysis results between Anxa1 + clusters.
(A) Gene ontology results for clusters 4 (Sox6Tafa1) and 11 (Calb1Stac) showi increased significance of pathway changes in Anxa1 + substantia nigra (SNc) neurons compared to an Anxa1 + ventral tegmental area (VTA) cluster.
Author response image 1

(A)Trajectory analysis of wildtype and (B) LRRK2G2019S samples.
(C) Pseudotime scores for each cluster across wildtype and Lrrk2 conditions. Error bars represent the confidence of error for false positives discovery rate of 5%.
Additional files
-
Supplementary file 1
The list of all probes on the MERFISH panel.
- https://cdn.elifesciences.org/articles/101035/elife-101035-supp1-v1.xlsx
-
Supplementary file 2
Extended data files contain raw differential expression analysis results in Excel format.
Tabs within the file are provided for various comparisons referenced/used throughout the text.
- https://cdn.elifesciences.org/articles/101035/elife-101035-supp2-v1.xlsx
-
MDAR checklist
- https://cdn.elifesciences.org/articles/101035/elife-101035-mdarchecklist1-v1.docx
Download links
A two-part list of links to download the article, or parts of the article, in various formats.
Downloads (link to download the article as PDF)
Open citations (links to open the citations from this article in various online reference manager services)
Cite this article (links to download the citations from this article in formats compatible with various reference manager tools)
Molecular and spatial transcriptomic classification of midbrain dopamine neurons and their alterations in a LRRK2G2019S model of Parkinson’s disease
eLife 13:RP101035.
https://doi.org/10.7554/eLife.101035.3


