Prophage-encoded Hm-oscar gene recapitulates Wolbachia-induced male-killing in the tea tortrix moth Homona magnanima
- National Agriculture and Food Research Organization, Japan
- United Graduate School of Agricultural Science, Tokyo University of Agriculture and Technology, Japan
- Department of Agricultural and Environmental Biology, Graduate School of Agricultural and Life Sciences, The University of Tokyo, Japan
- Crop Environment Section, Tea and Beverage Research Station, Ministry of Agriculture, Taiwan
Figures
Figure 1
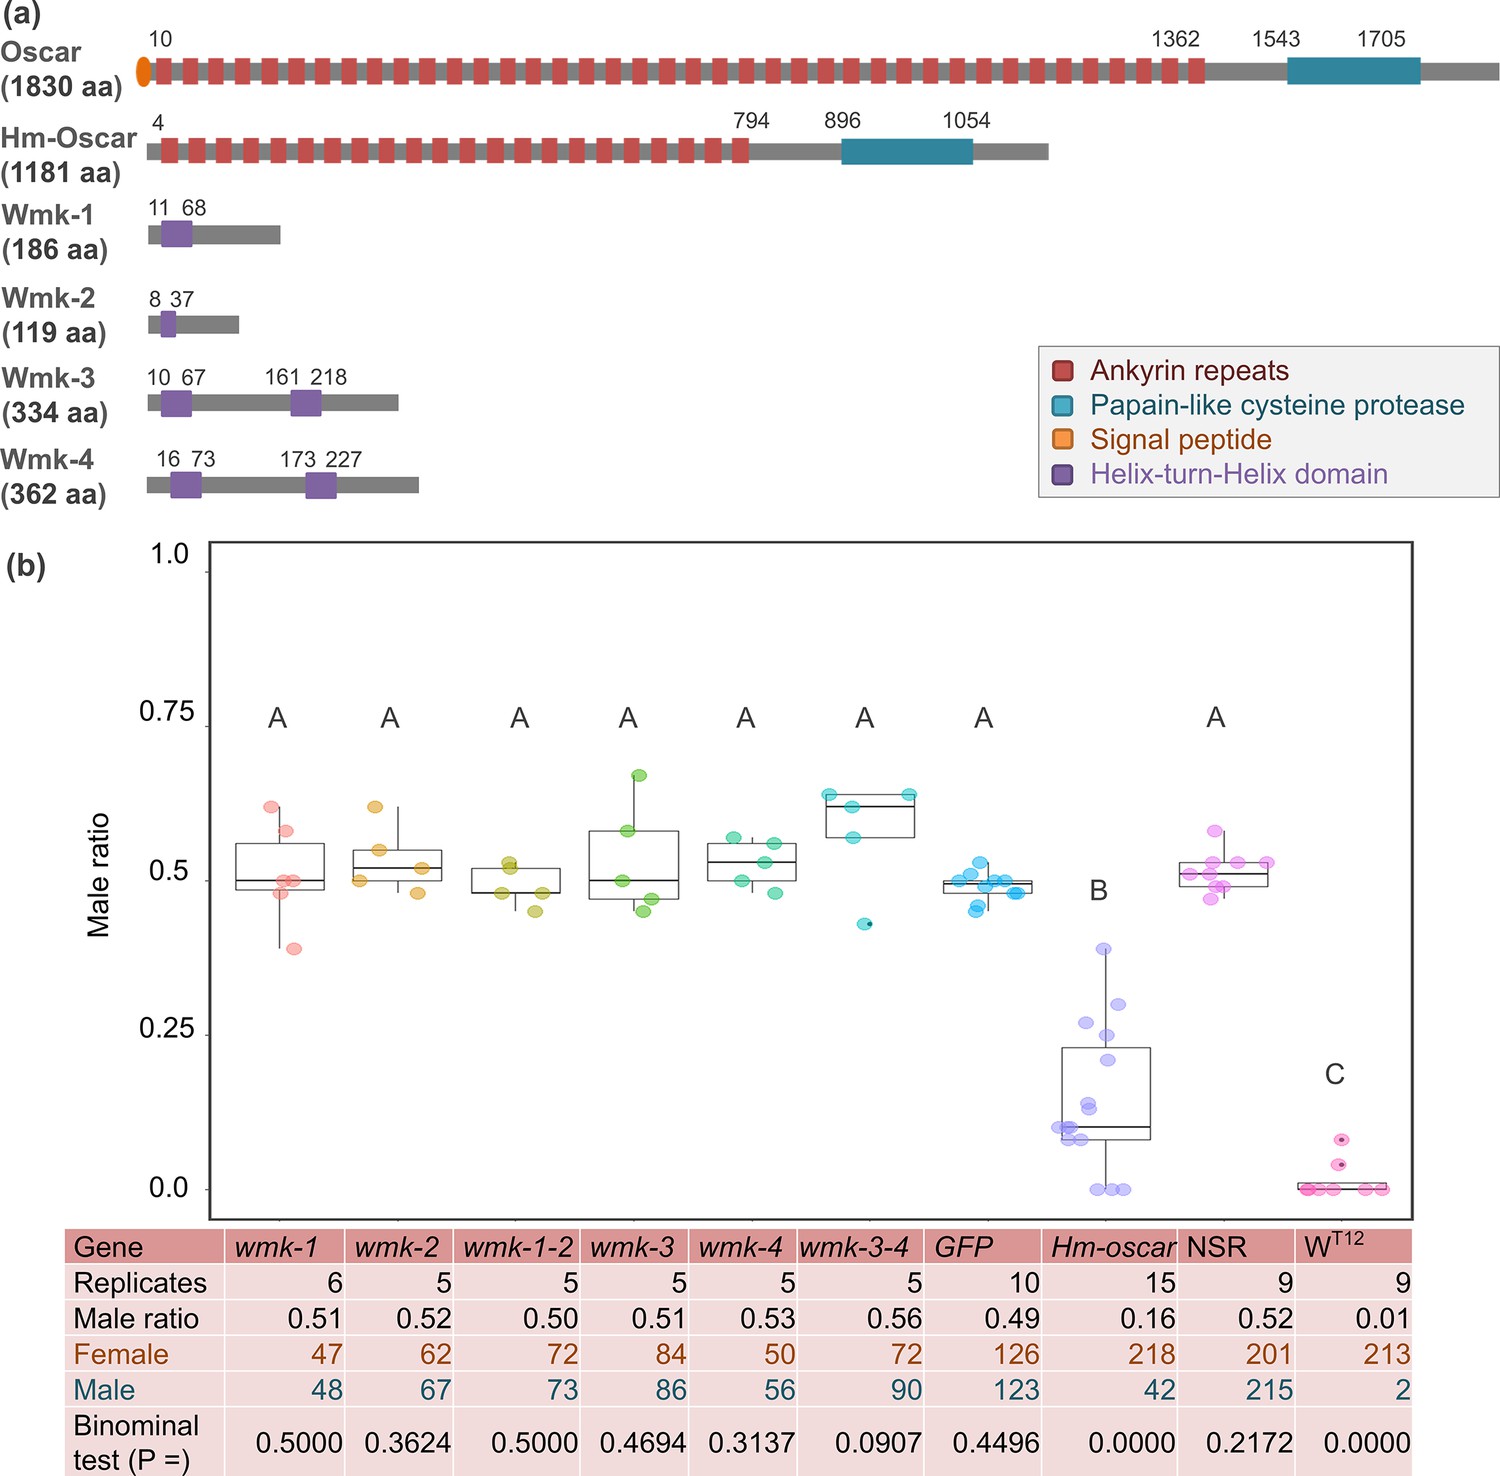
Transient expressions of the homologs of oscar (Hm-oscar) gene resulted in female-biased sex ratios.
(a) Structures of wFur-encoded Oscar and wHm-t-encoded Hm-Oscar and four Wmk proteins. (b) Male ratio of adult progeny obtained from cRNA-injected groups (wmk-1, wmk-2, T2A-bridged wmk-1 and wmk-2, wmk-3, wmk-4, T2A-bridged wmk-3 and wmk-4, GFP, and Hm-oscar; n = 5–15 independent replicates using different egg masses), the non-injected normal sex ratio (NSR) line, and the male-killing (MK) wHm-t-positive WT12 line. The total numbers of adult females and males are shown at the bottom. Different letters indicate significant differences (Steel–Dwass test, p<0.05). The dot plots show all data points individually.
-
Figure 1—source data 1
Sequence ID and data for wmk and oscar homologs displayed in Figure 1a.
- https://cdn.elifesciences.org/articles/101101/elife-101101-fig1-data1-v1.xlsx
-
Figure 1—source data 2
Number of males and females and sex ratio displayed in Figure 1b.
- https://cdn.elifesciences.org/articles/101101/elife-101101-fig1-data2-v1.xlsx
-
Figure 1—source data 3
Statistical analysis (Steel-Dwass test) data displayed in Figure 1b.
- https://cdn.elifesciences.org/articles/101101/elife-101101-fig1-data3-v1.xlsx
Figure 2
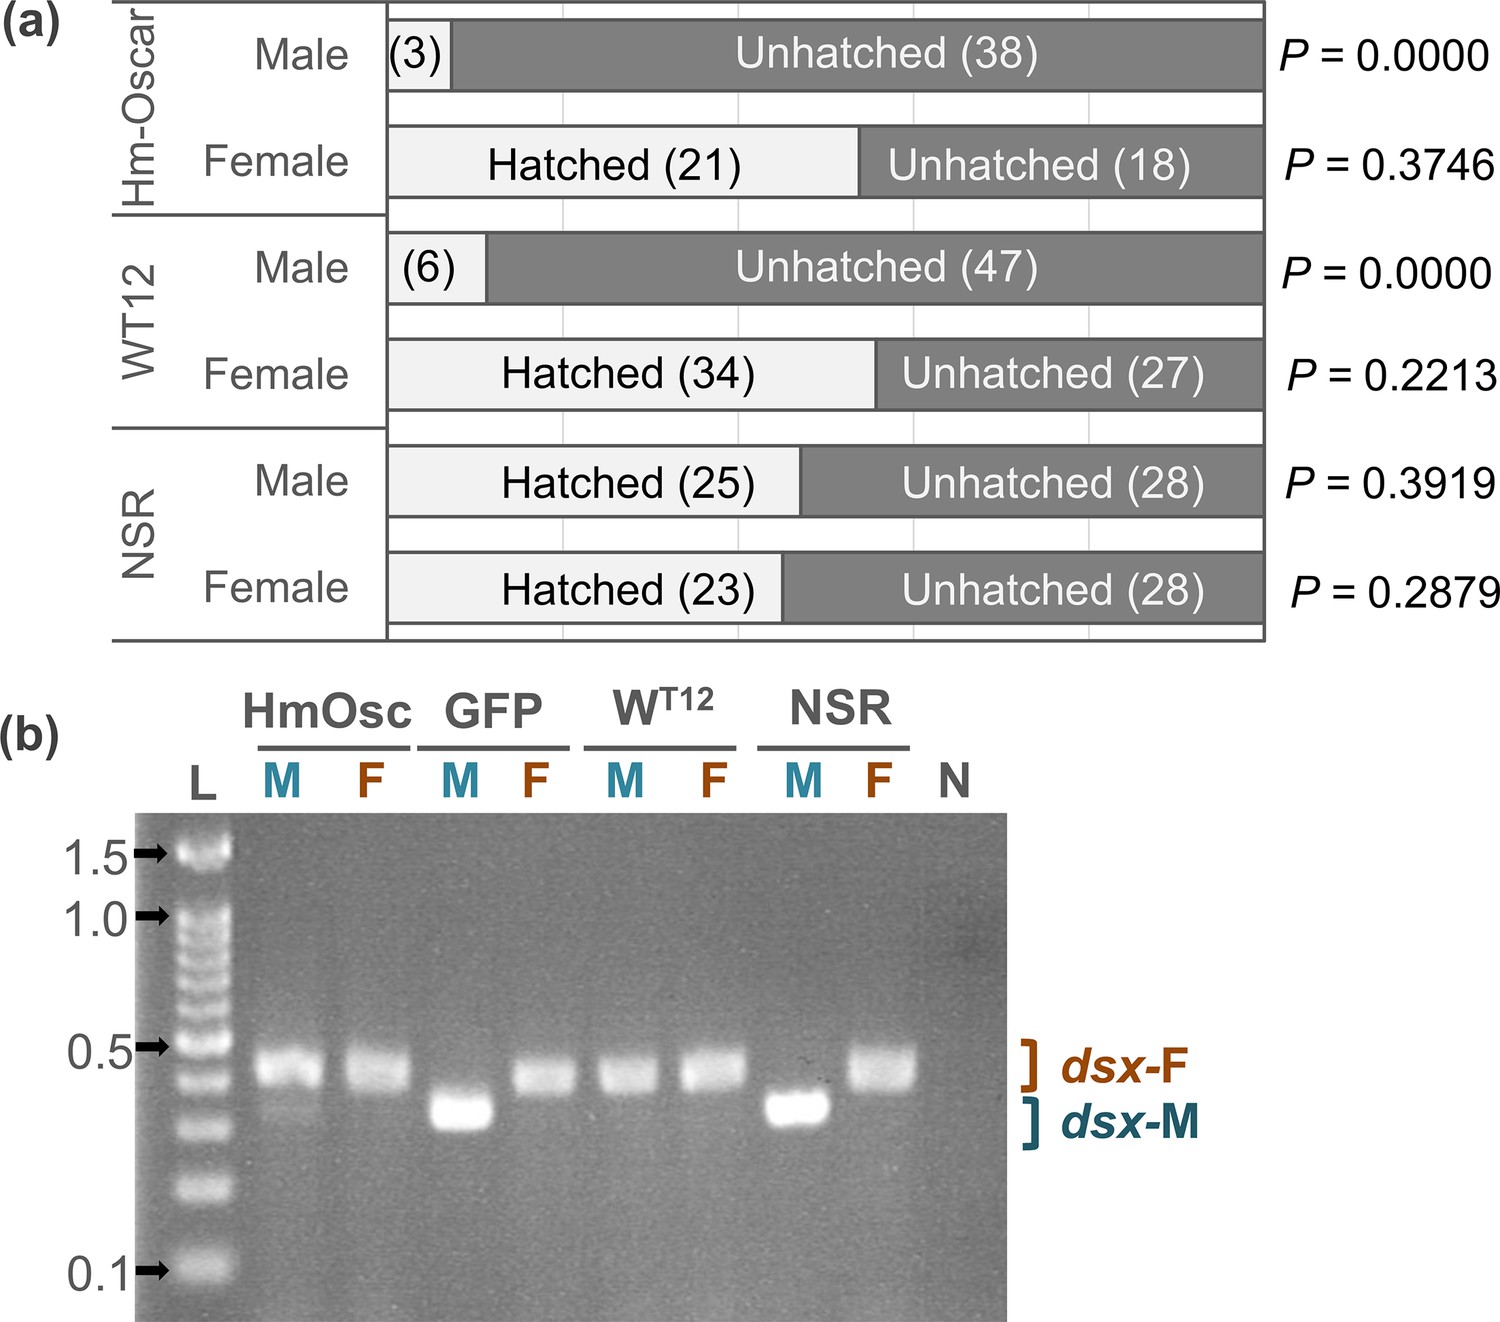
Homologs of oscar (Hm-Oscar) induced lethality in male embryos with the female-type sex determination.
(a) Sex ratio of the hatched larvae and unhatched embryos in the Hm-oscar-expressed, wHm-t-infected, and non-infected/expressed groups. Females and males were discriminated based on the presence or absence of W chromatin. The number of individuals is indicated in brackets. (b) Splicing patterns of the downstream sex-determining gene dsx of H. magnanima embryos (5 d post oviposition). Abbreviations: HmOsc, Hm-oscar injected group; GFP, GFP-injected group; WT12, wHm-t-infected line; NSR, non-infected/injected line. M and F indicate W chromatin-negative (ZZ: male genotype) and W chromatin-positive (ZW: female genotype) mature embryos, respectively. dsx-F and dsx-M represent female and male-specific splicing variants, respectively. L: 100 bp DNA ladder (ExcelBand 100 bp DNA Ladder, SMOBIO Technology, Inc, Hsinchu, Taiwan). 0.1, 0.5, 1.0, and 1.5 kb markers are indicated with arrows. N: negative control (water).
-
Figure 2—source data 1
Number of males and females displayed in Figure 2a.
- https://cdn.elifesciences.org/articles/101101/elife-101101-fig2-data1-v1.xlsx
-
Figure 2—source data 2
Original gel image for band patterns of dsx displayed in Figure 2b.
- https://cdn.elifesciences.org/articles/101101/elife-101101-fig2-data2-v1.zip
-
Figure 2—source data 3
PDF file containing an original gel image for Figure 2b, indicating the relevant bands and treatments.
- https://cdn.elifesciences.org/articles/101101/elife-101101-fig2-data3-v1.pdf
Figure 3
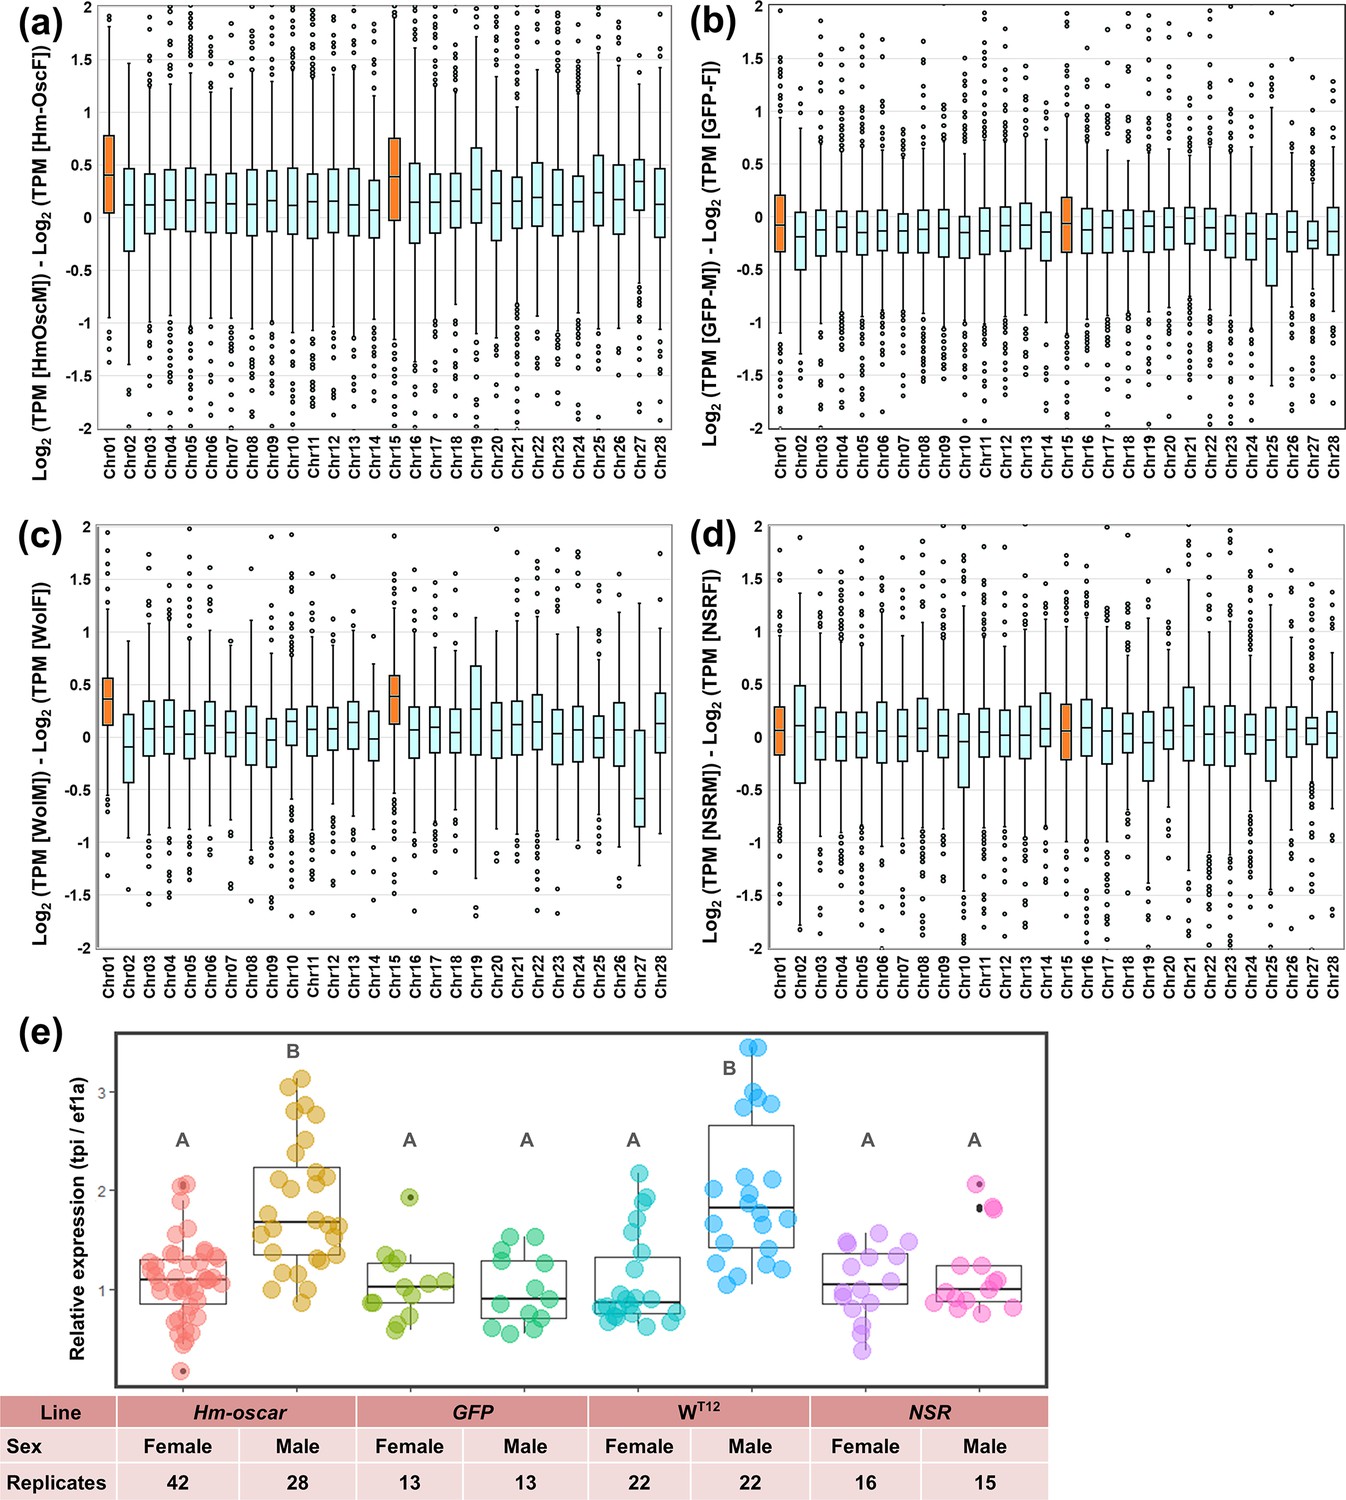
Homologs of oscar (Hm-oscar)-overexpressed male embryos showed higher levels of Z-linked gene expression.
(a–d) Normalized expression levels (TPM) and chromosomal distributions of transcripts in H. magnanima embryos. RNA-seq data of embryos (108 hpo) were used to make the following comparisons: Hm-oscar-injected males versus Hm-oscar injected females (a), GFP-injected males versus GFP-injected females (b), WT12 males versus WT12 females (c), and normal sex ratio (NSR) males versus NSR females (d). The chromosome number for each H. magnanima transcript-derived contig was assigned based on Bombyx mori gene models. The x-axis represents the chromosome number of B. mori (shown as chr01 to chr28), and chr01 and chr15 (highlighted in orange) correspond to the Z chromosome of H. magnanima (Arai et al., 2023b). (e) Relative expression of a Z-linked tpi gene in H. magnanima groups. Statistical significance is highlighted with different alphabets.
-
Figure 3—source data 1
Expression data displayed in Figure 3a.
- https://cdn.elifesciences.org/articles/101101/elife-101101-fig3-data1-v1.xlsx
-
Figure 3—source data 2
Statistical analysis (Steel-Dwass test) data displayed in Figure 3a.
- https://cdn.elifesciences.org/articles/101101/elife-101101-fig3-data2-v1.xlsx
-
Figure 3—source data 3
Expression data displayed in Figure 3b.
- https://cdn.elifesciences.org/articles/101101/elife-101101-fig3-data3-v1.xlsx
-
Figure 3—source data 4
Statistical analysis (Steel-Dwass test) data displayed in Figure 3b.
- https://cdn.elifesciences.org/articles/101101/elife-101101-fig3-data4-v1.xlsx
-
Figure 3—source data 5
Expression data displayed in Figure 3c.
- https://cdn.elifesciences.org/articles/101101/elife-101101-fig3-data5-v1.xlsx
-
Figure 3—source data 6
Statistical analysis (Steel-Dwass test) data displayed in Figure 3c.
- https://cdn.elifesciences.org/articles/101101/elife-101101-fig3-data6-v1.xlsx
-
Figure 3—source data 7
Expression data displayed in Figure 3d.
- https://cdn.elifesciences.org/articles/101101/elife-101101-fig3-data7-v1.xlsx
-
Figure 3—source data 8
Statistical analysis (Steel-Dwass test) data displayed in Figure 3d.
- https://cdn.elifesciences.org/articles/101101/elife-101101-fig3-data8-v1.xlsx
-
Figure 3—source data 9
Expression data displayed in Figure 3e.
- https://cdn.elifesciences.org/articles/101101/elife-101101-fig3-data9-v1.xlsx
-
Figure 3—source data 10
Statistical analysis (Steel-Dwass test) data displayed in Figure 3e.
- https://cdn.elifesciences.org/articles/101101/elife-101101-fig3-data10-v1.xlsx
Figure 4
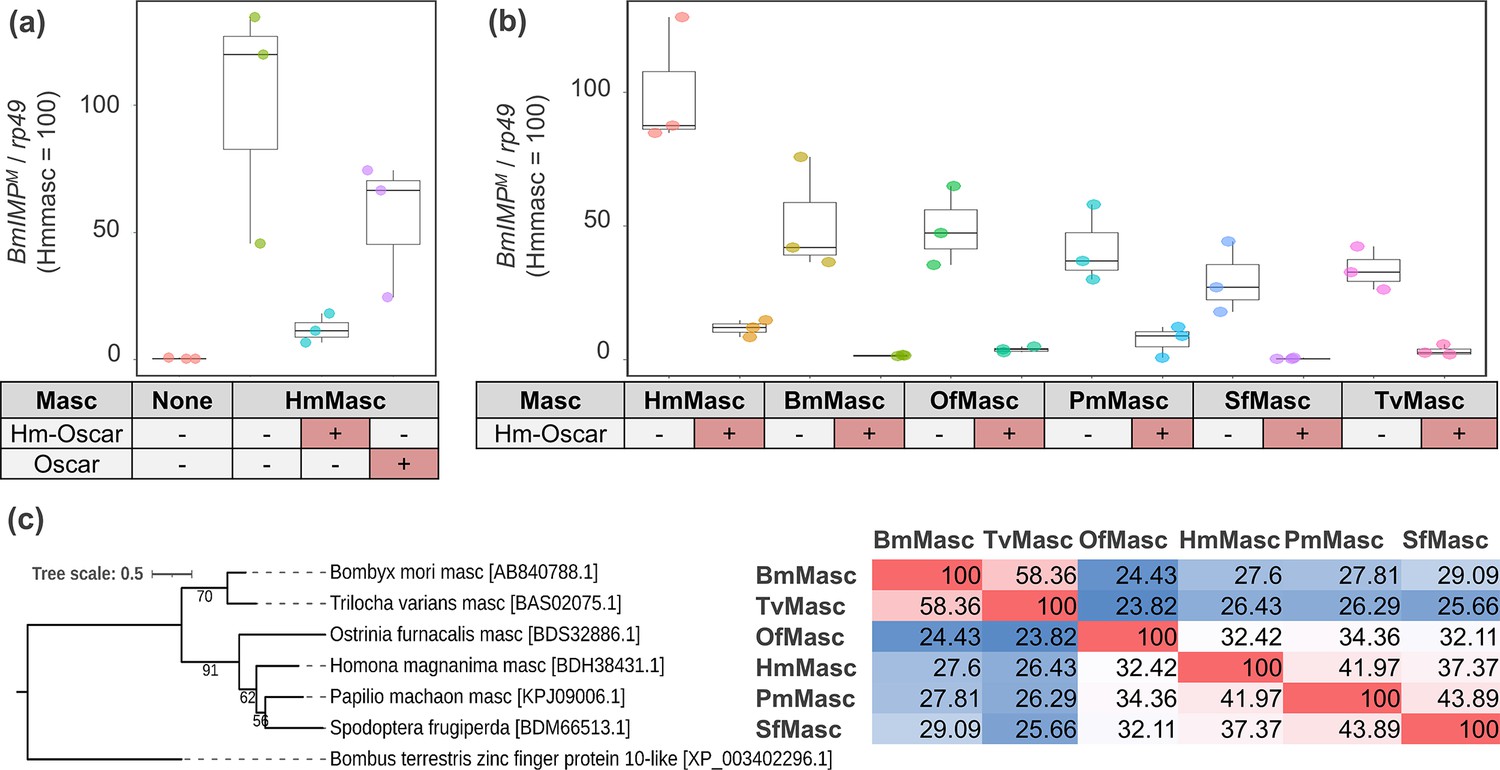
Hm-oscar suppressed the masculinizing function of lepidopteran Masc.
(a) Relative expression levels of the male-specific BmImpM variant in transfected BmN-4 cells. The relative expression of BmImpM in the control (non-inserted pIZ/V5) and Hm-oscar/oscar co-transfected groups was normalized by setting the mean in the Hmmasc single transfected group as 100. (b) Relative expression levels of the BmImpM in Hm-oscar/masc transfected BmN-4 cells. The relative expression of BmImpM in each condition was normalized by setting the mean in the Hmmasc single transfected group as 100. The dot plots show all data points individually. Each experimental condition was replicated three times. Abbreviations: Hm, Homona magnanima; Bm, Bombyx mori; Of, Ostrinia furnacalis; Pm, Papilio machaon; Sf, Spodoptera frugiperda; and Tv, Trilocha varians. (c) Phylogeny and homologies of the Masc protein sequences used in this study. The sequence homology between each pair is presented in the figure and visualized as a heatmap, with red indicating high homology (Max = 100) and blue indicating low homology (Min = 23.82).
-
Figure 4—source data 1
Expression data for IMP gene displayed in Figure 4a.
- https://cdn.elifesciences.org/articles/101101/elife-101101-fig4-data1-v1.xlsx
-
Figure 4—source data 2
Expression data for IMP gene displayed in Figure 4b.
- https://cdn.elifesciences.org/articles/101101/elife-101101-fig4-data2-v1.xlsx
-
Figure 4—source data 3
Sequence homology data displayed in Figure 4c.
- https://cdn.elifesciences.org/articles/101101/elife-101101-fig4-data3-v1.xlsx
Additional files
Download links
A two-part list of links to download the article, or parts of the article, in various formats.
Downloads (link to download the article as PDF)
Open citations (links to open the citations from this article in various online reference manager services)
Cite this article (links to download the citations from this article in formats compatible with various reference manager tools)
Prophage-encoded Hm-oscar gene recapitulates Wolbachia-induced male-killing in the tea tortrix moth Homona magnanima
eLife 13:RP101101.
https://doi.org/10.7554/eLife.101101.4


