A mutation uncouples the tubulin conformational and GTPase cycles, revealing allosteric control of microtubule dynamics
- University of Texas Southwestern Medical Center, United States
- Cornell University, United States
Figures
Figure 1
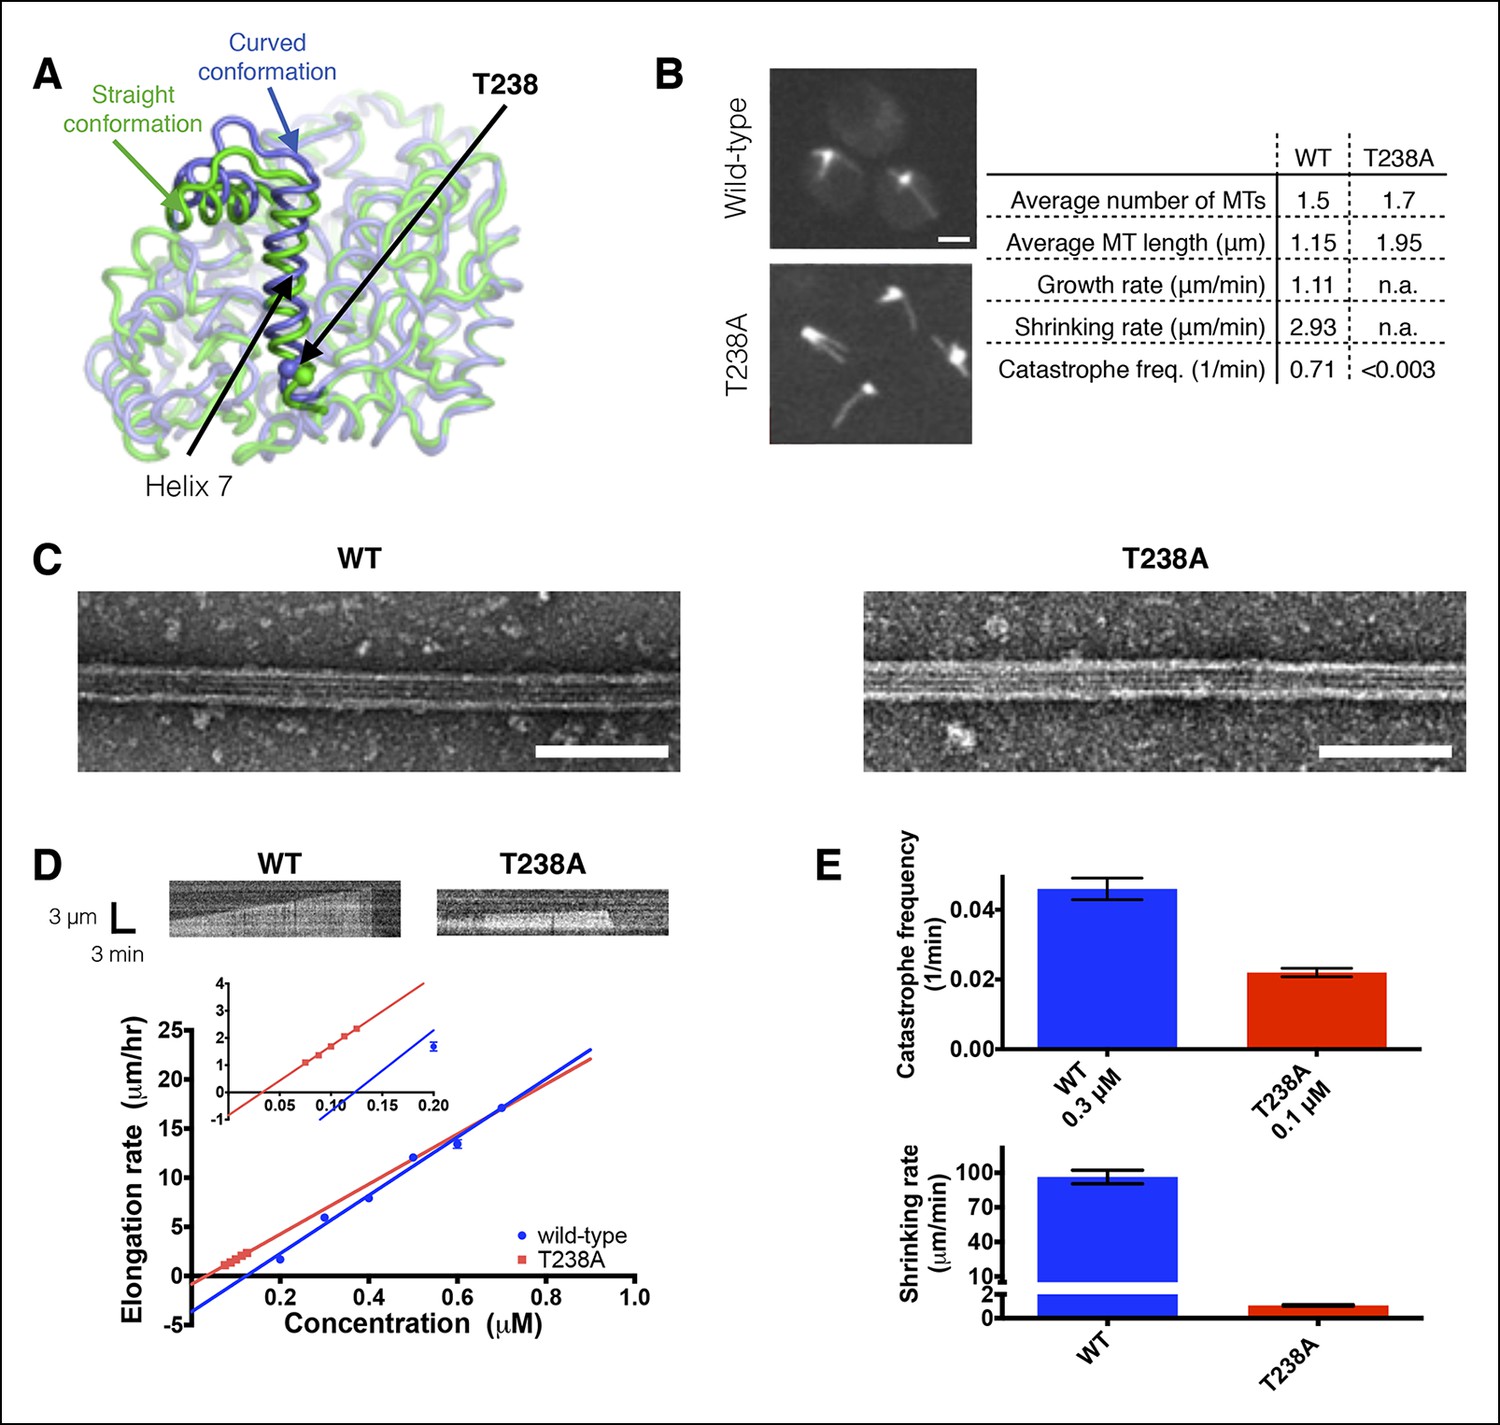
αβ-tubulin containing a buried mutation in β-tubulin gives hyperstable microtubules in vivo and in vitro.
(A) Superposition of polymerized (‘straight’, green, PDB 1JFF) and unpolymerized (‘curved’, blue, PDB 4FFB) conformations of β-tubulin. T238 is solvent inaccessible and resides on a helix (H7) that undergoes a piston-like movement between the two conformations. The view of β-tubulin shown here is as if from the center of the microtubule looking out, with the plus end at the top. (B) Time-lapse imaging of live yeast shows that cells expressing T238A αβ-tubulin make longer, less dynamic microtubules than their wild-type (WT) counterparts. N = 13, 18 for WT and T238A microtubules respectively, with t = 35, 72 min total time observed. See also Videos 1,2. Bar = 2 µm (C) Negative stain electron micrographs (magnification: 23,000x) of wild-type (left) and β:T238A (right) microtubules. Mutant microtubules have normal structure. Bar = 100 nm. (D) In vitro, T238A and wild-type microtubules show similar concentration-dependent growth rates (slopes: 29.6 +/- 1.8 µm/hr/µM for wild-type, 25.5 +/- 0.8 µm/hr/µM for β:T238A, the differences between the slopes are not statistically significant; x-intercepts: 0.12 µM for wild-type, 0.033 µM for β:T238A, this difference is statistically significant; significance of differences in regression parameters was evaluated using GraphPad Prism). Representative kymographs are shown above the plots. (N = 12 for all points except 0.2 µM where N = 20; bars show s.e.m.) (E) T238A microtubules catastrophe less frequently than wild-type (top; N = 99, 115 for wild-type and T238A respectively, bars show s.d.) and show a ∼hundredfold slower rate of post-catastrophe shrinking (bottom; N = 16 for wild-type and T238A, bars show s.e.m.).
Figure 2
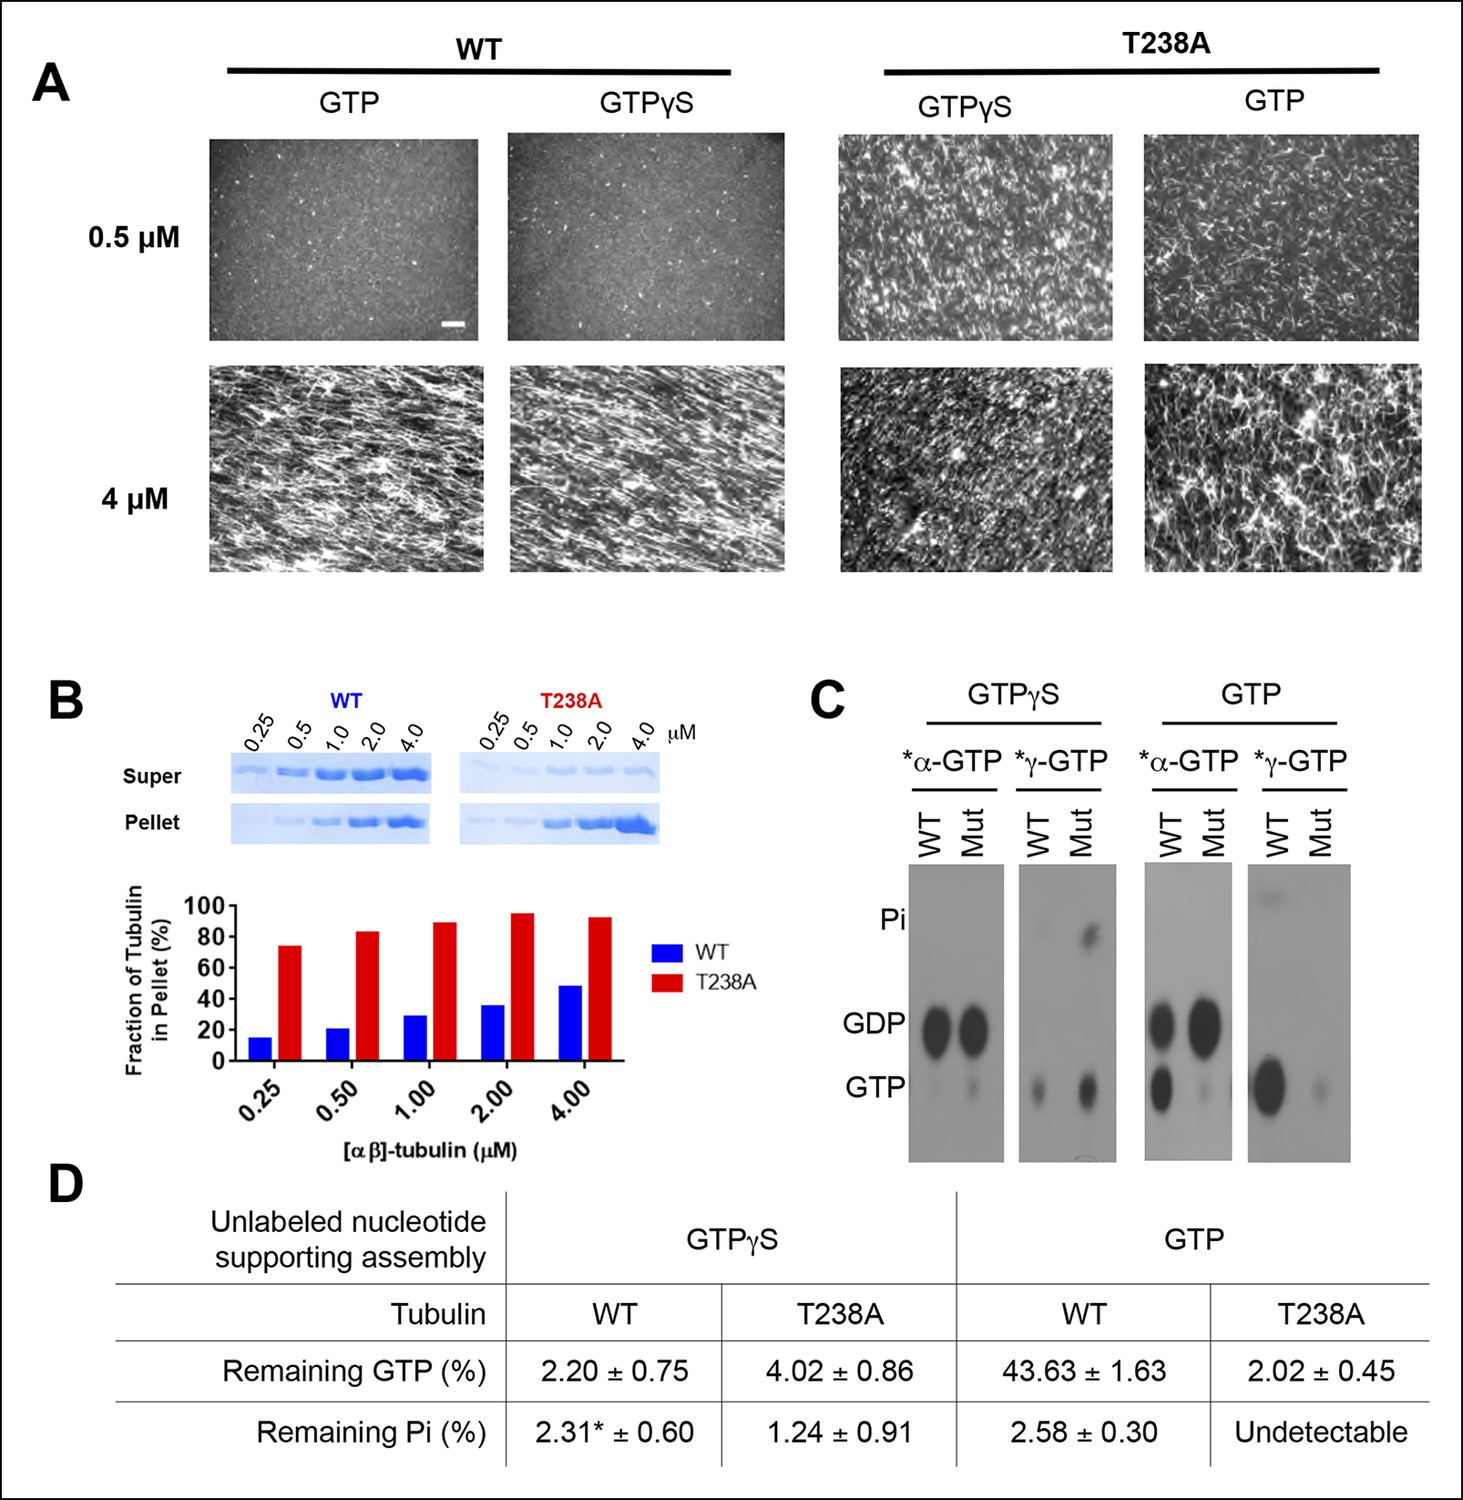
T238A αβ-tubulin undergoes spontaneous nucleation more readily than WT, even in the presence of a nonhydrolyzable GTP analog, GTPγS.
(A) Fluorescent images of crosslinked microtubules from spontaneous nucleation reactions. Even at low concentrations and in the presence of GTPγS, T238A tubulin shows increased spontaneous nucleation compared to WT. GTPγS reactions are presented next to each other to facilitate a side-by-side comparison. Scale bar in top left is 5 µm. (B) Microtubule spindown reactions show that under the same concentration range, in the presence of GTPγS, T238A tubulin produces a greater proportion of microtubules which sediment into the pellet. Gel images of supernatant and pellet fractions (top). (C) T238A microtubules do not accumulate GTP or GDP.Pi compared to wild-type. Images show TLC analysis of exchangeable nucleotide content of microtubules grown with GTP or GTPγS. Microtubules were spontaneously assembled using higher concentrations than for the dynamics assays: wild-type microtubules were prepared at 2 µM with GTP and 1 µM with GTPγS. β:T238A microtubules were prepared at 1 µM with either nucleotide. (D) Quantification of TLC data, n = 3 and errors shown represent s.d. *indicates one condition where we could not detect any Pi in one of the replicates; instead of using 0 we used the lower of the two other trials.
Figure 3

The buried β:T238A does not appreciably straighten unpolymerized αβ-tubulin.
(A) Cartoon schematics illustrating that TOG domains (blue) bind tightly to curved αβ-tubulin (pink and green; left) but weakly to straight αβ-tubulin (right). (B) Isotherms for individual Stu2 TOG domains binding to T238A αβ-tubulin. Both TOG domains bind with comparable affinity to T238A and WT tubulin. 1 Σσ confidence intervals for fitted affinities are provided in parentheses.
Figure 4
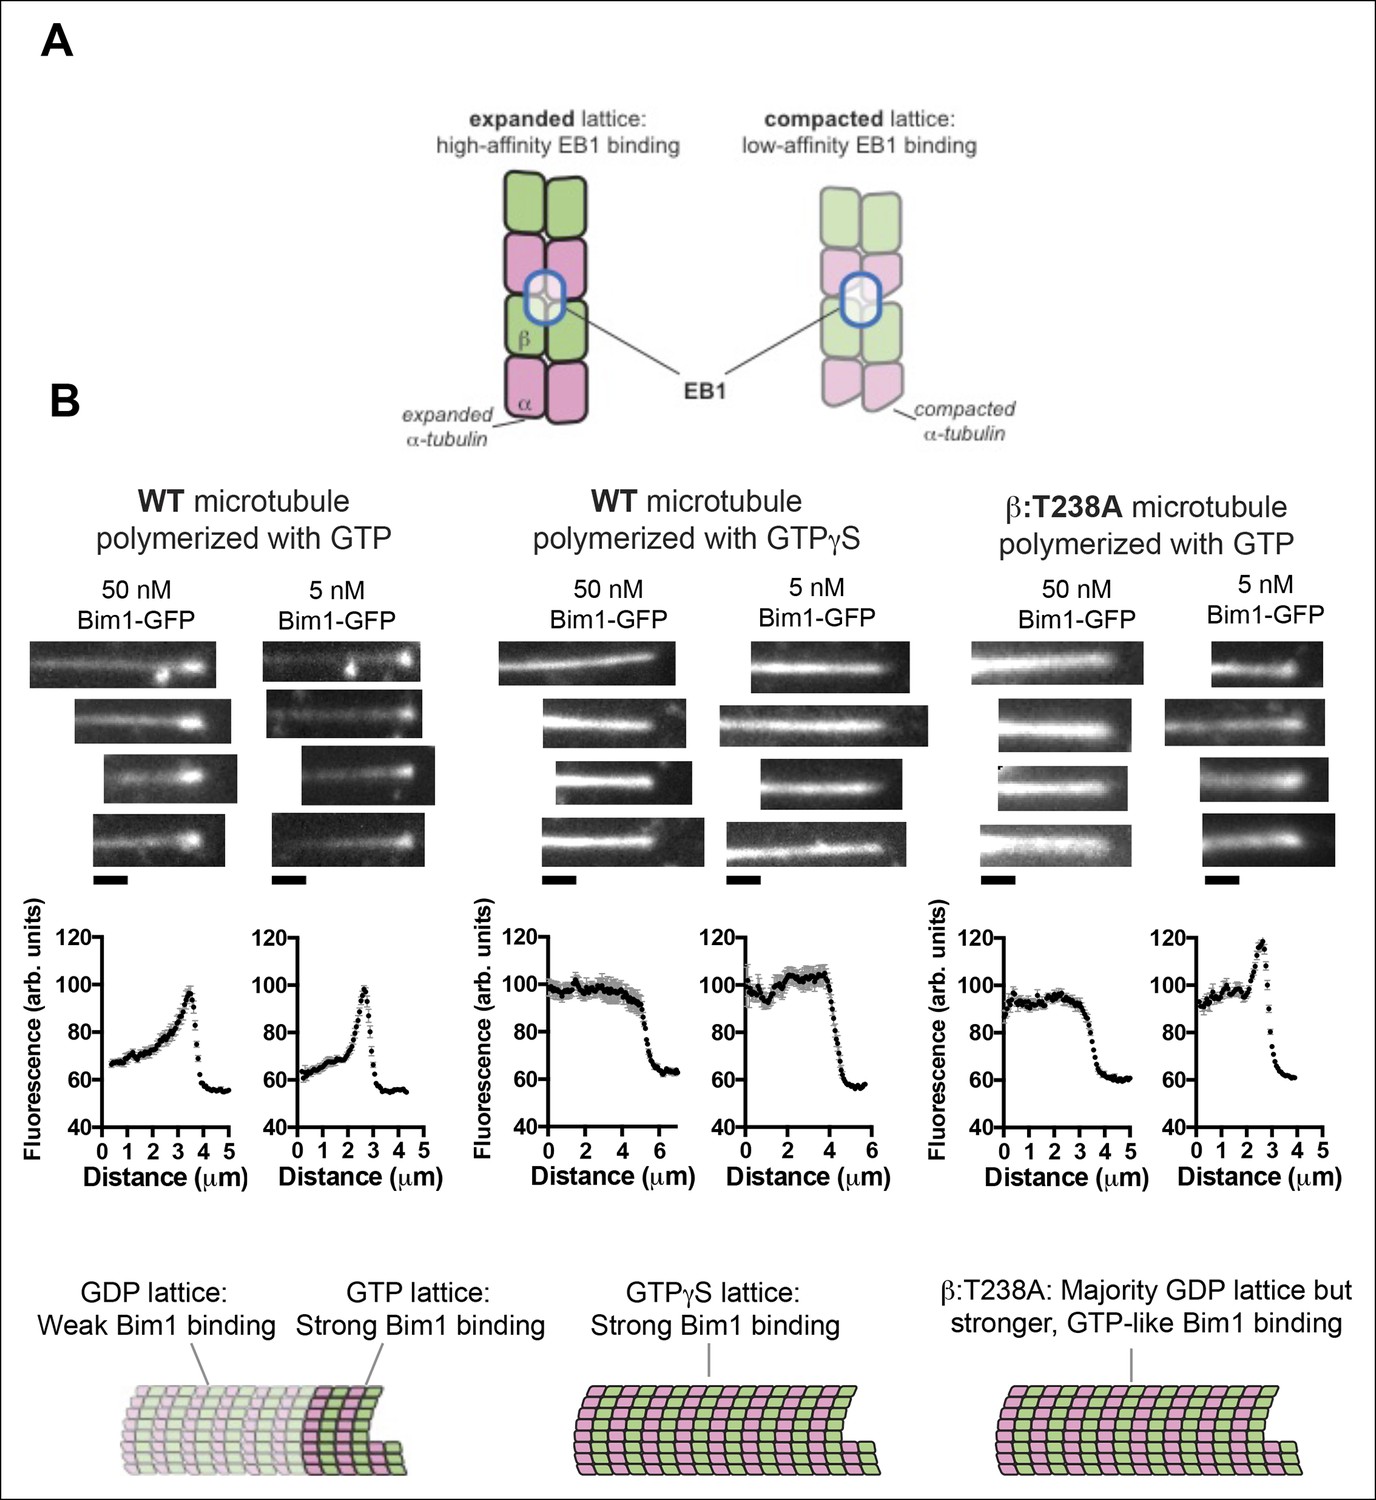
The buried β:T238A attenuates the conformational response to GDP in the lattice.
(A) Cartoon schematics illustrating the basis of the assay: EB1 proteins (blue outlined ovals) bind tightly to the GTP-lattice conformation of αβ-tubulin (left) but weakly to the GDP-like conformation (right). (B) Images of the distribution of Bim1-GFP (an EB1 family protein) on wild-type (left and center) or mutant microtubules (right). 4 microtubules are shown for each condition, and Bim1-GFP was present at 50 nM and 5 nM concentration for all microtubules. Plots represent average Bim1-GFP intensity on n = 9 microtubules for each condition. Error bars represent s.e.m. Cartoons illustrate the likely lattice conformation inferred from the Bim1-GFP binding. β:T238A microtubules appear GTP-like even though they contain GDP. Scale bars: 1 μm.
Figure 5
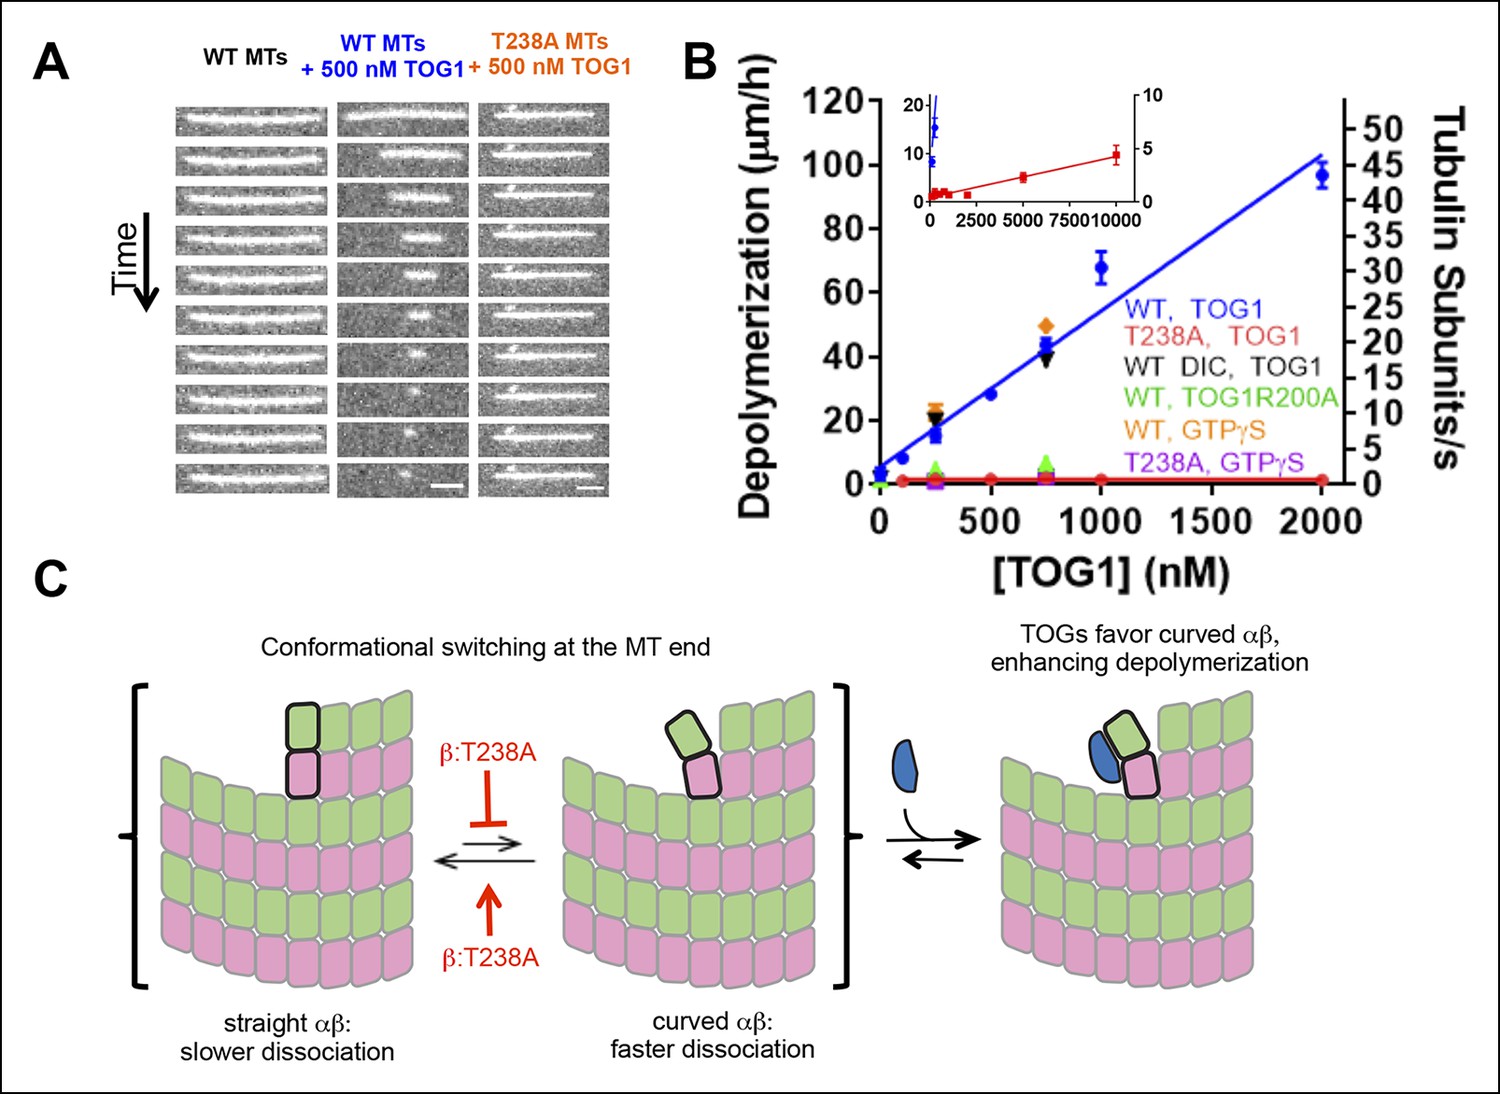
β:T238A microtubules are resistant to TOG-induced depolymerization.
(A) A time series of images of stabilized fluorescent microtubules show that under the same concentration of TOG1, T238A microtubules depolymerize substantially slower than WT microtubules. Scale bars: 1 µm. (B) Quantification of the dose-dependence of the rate of TOG-induced depolymerization. Inset: a plot showing that under higher TOG1 concentrations, T238A microtubules also undergo induced depolymerization. We observed similar rates of TOG-induced depolymerization using DIC instead of fluorescence to monitor microtubule length (black triangles), as well as using GTPγS instead of epothilone as a stabilizing reagent (orange diamonds, purple squares). Additional control experiments demonstrate that the TOG-induced depolymerization is greatly reduced when a weakly-binding TOG1 mutant (R200A) is used (green triangles). N = 30 for fluorescence measurements of wild-type TOG1-induced depolymerization of wild-type or β:T238A microtubules, N = 20 for the rest. Error bars represent s.e.m. (C) Cartoon model illustrating the mechanism of TOG-induced depolymerization, resulting from TOG-stabilization of tubulin subunits sampling curved conformation at the end of the microtubule. T238A microtubules depolymerize slower due to a decrease in tubulin subunits sampling the curved conformation once incorporated into the polymer.
Figure 6
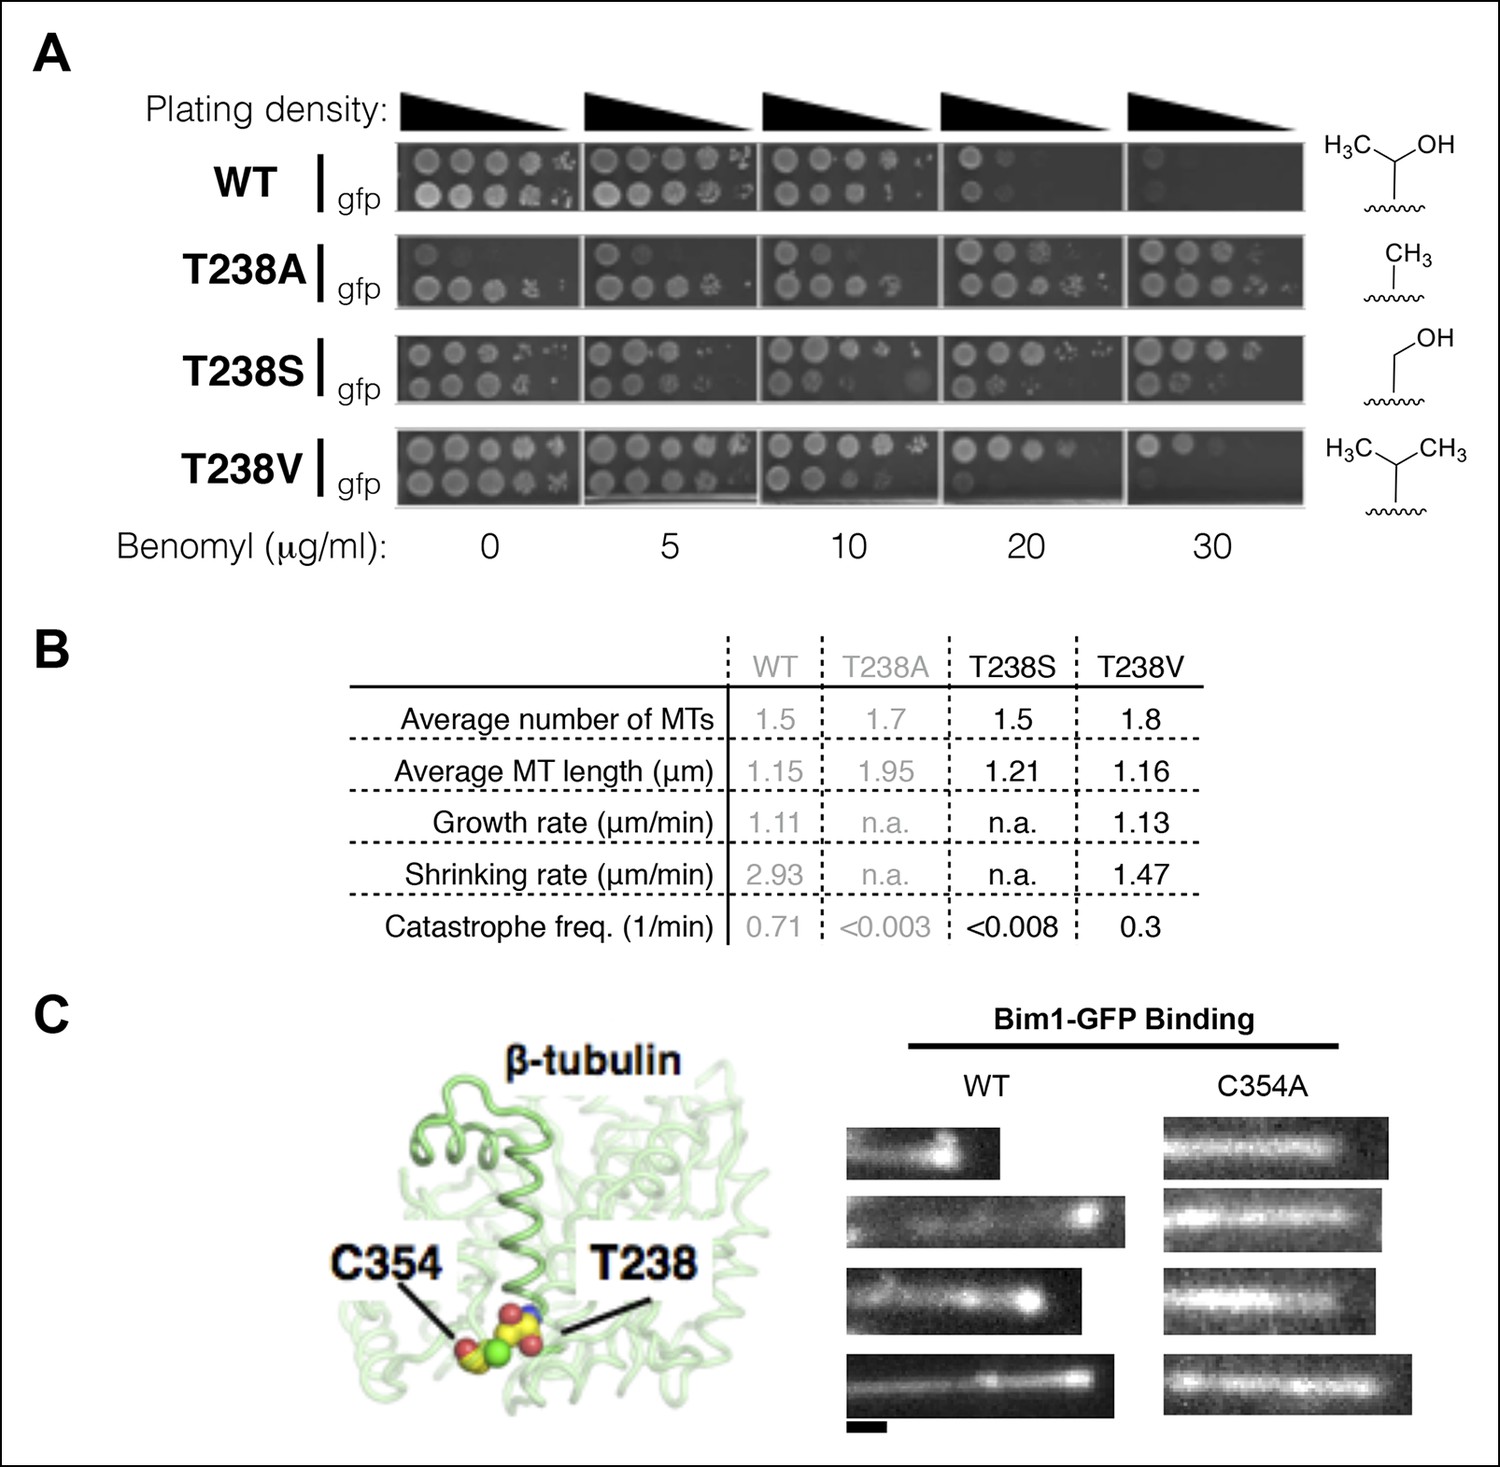
Insights into the mechanism underlying the β:T238A effects on the conformational cycle.
(A) Yeast with different substitutions for T238 (for each mutant, strains with and without GFP-Tub1p are shown) show intermediate degrees of benomyl resistance/dependence. The volume of the packing defect may be related to the magnitude of the resulting phenotype: T238S has a phenotype closer to T238A whereas T238V has a phenotype closer to wild type. (B) In vivo microtubule dynamics of yeast containing T238S and T238V αβ-tubulin. N = 24, 14 for T238S and T238V microtubules respectively, with t = 120, 43 min total time observed. (C) The buried β:C354A mutation immediately proximal to T238 (left) has also been shown to give slowly shrinking microtubules, and also shows an expanded lattice (right). The view of the structure is as if from the center of the microtubule looking out, with the plus end at the top. Scale bar: 1 µm.
Figure 7
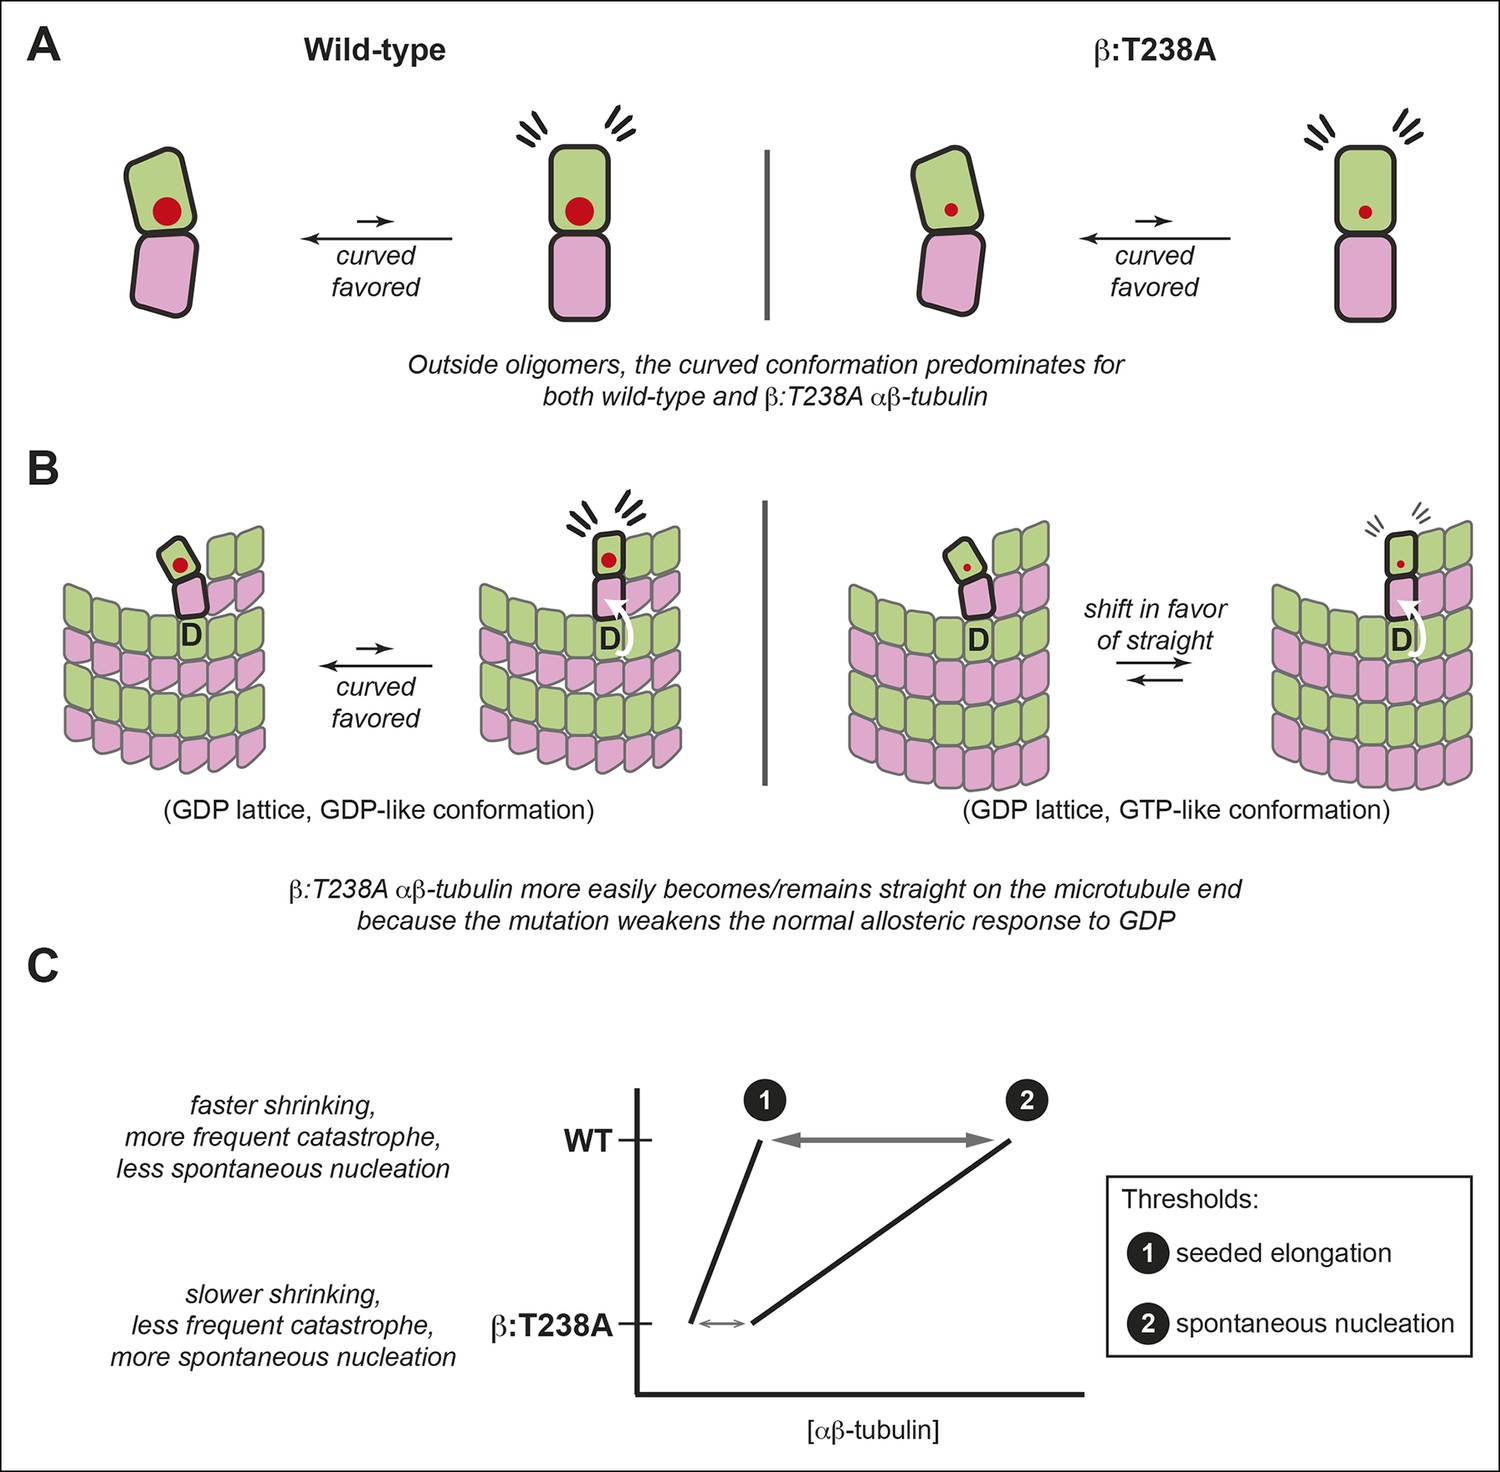
The αβ-tubulin conformational cycle and its impact on microtubule dynamics.
(A) Unoligomerized wild-type and β:T238A αβ-tubulin both adopt the curved conformation. That the straight conformation is strained (flare marks) even with the mutation-induced reduction in packing volume (cartooned by larger and smaller red circles for wild-type and β:T238A, respectively) suggests that extrinsic factors like interactions with the lattice control straightening. (B) Compared to wild-type, β:T238A αβ-tubulin is better able to populate a straight conformation on the end of GDP containing microtubules. ‘D’ indicates GDP underneath the bolded terminal subunit, compaction is represented as in Figure 4, and the white arrow cartoons trans-acting nucleotide (see text). The increased ability of the mutant to be straight could result from an altered response to GDP on the longitudinal interface, from more favorable interactions with the expanded lattice, or from a combination of both. (C) The schematic phase diagram illustrates that the mutation-induced changes to the αβ-tubulin conformational cycle decrease the threshold concentrations for appreciable elongation against catastrophe (line 1) and for spontaneous nucleation (line 2), and also narrows the gap between them. The normal αβ-tubulin conformational cycle contributes to microtubule dynamics and makes them more amenable to regulation.
Videos
Video 1
Microtubule dynamics in wild type yeast.
Time-lapse images of Tub1-GFP in TUB2 (β-tubulin) cells were taken at 15-s intervals; video plays at 4 frames/s. A frame from this video is shown in Figure 1B.
Video 2
Microtubule dynamics in tub2-150 (T238A mutation in Tub2p) yeast.
Time-lapse images of Tub1-GFP in tub2-150 cells were taken at 15-s intervals; video plays at 4 frames/s. A frame from this video is shown in Figure 1B.
Download links
A two-part list of links to download the article, or parts of the article, in various formats.
Downloads (link to download the article as PDF)
Open citations (links to open the citations from this article in various online reference manager services)
Cite this article (links to download the citations from this article in formats compatible with various reference manager tools)
A mutation uncouples the tubulin conformational and GTPase cycles, revealing allosteric control of microtubule dynamics
eLife 4:e10113.
https://doi.org/10.7554/eLife.10113


