Parabrachial CGRP neurons modulate active defensive behavior under a naturalistic threat
- School of Psychology, Korea University, Republic of Korea
Figures
Figure 1 with 1 supplement
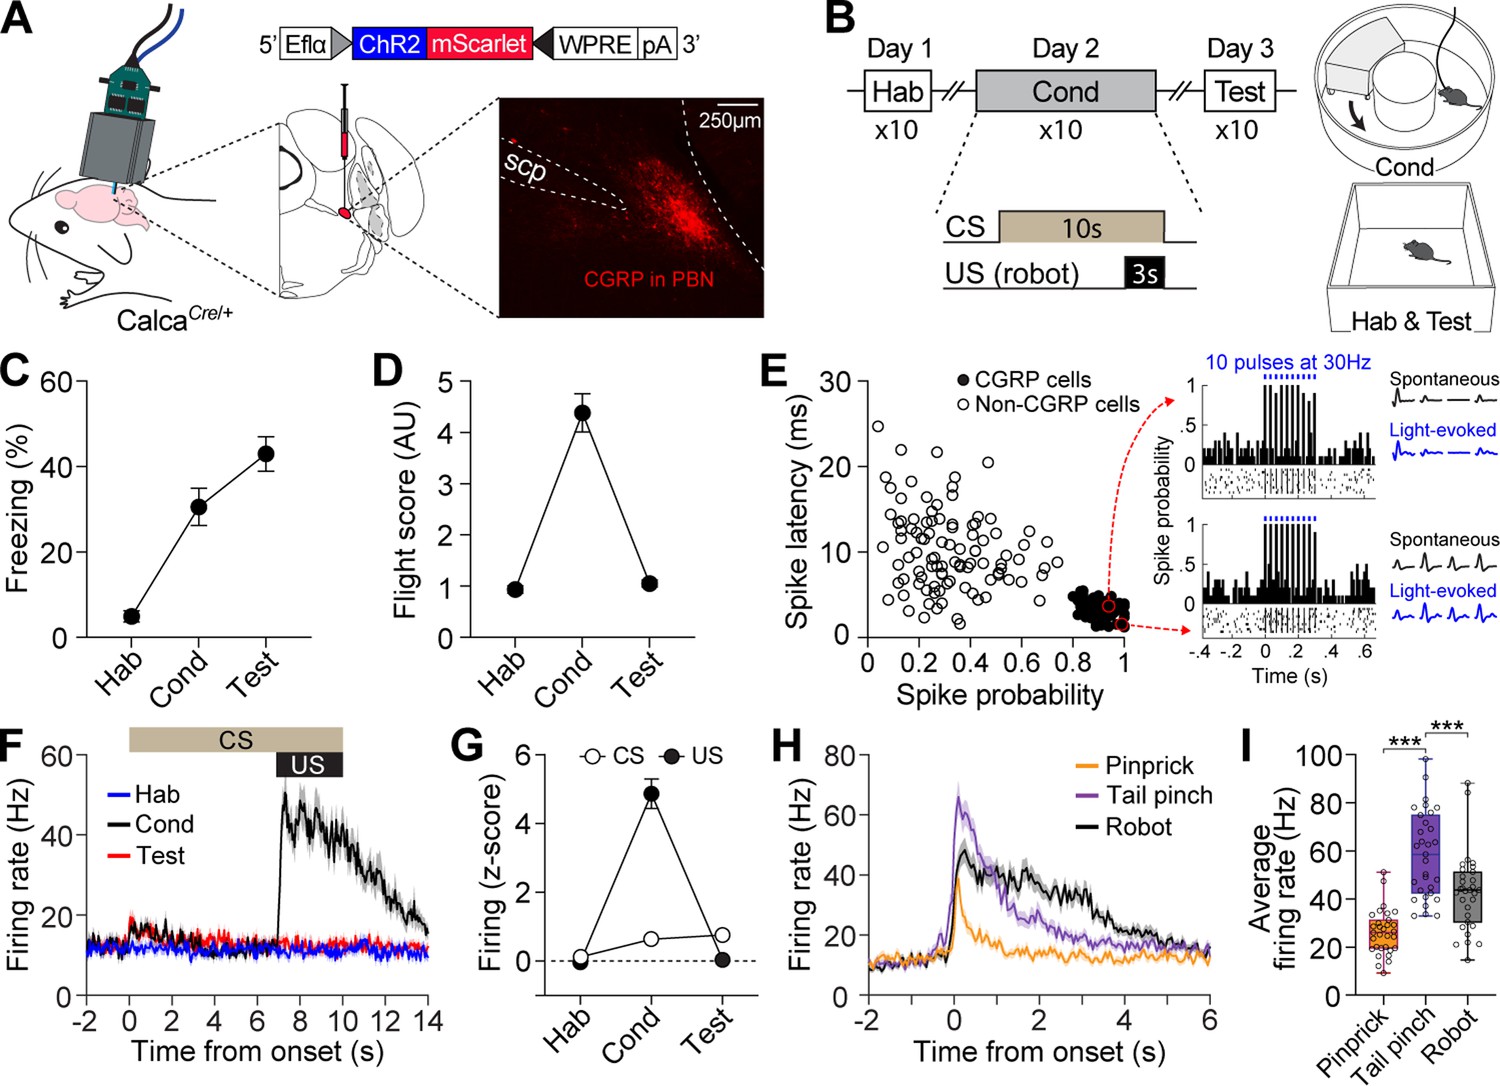
Distinct firing response patterns of calcitonin gene-related peptide (CGRP) neurons to different aversive stimuli.
(A) Schematic of AAV-DIO-ChR2-mScarlet injection and optrode implantation into the parabrachial nucleus (PBN) of CalcaCre/+ mice (n=6) and the corresponding representative histology image. (B) Procedures for fear conditioning experiments with the chasing robot and a schematic diagram of the context used. (C–D) Freezing (C) and fleeing behaviors (D) in response to the conditioned stimulus (CS) during habituation, conditioning, and retention test. (E) Characteristics of light-evoked responses. Neurons with a short spike latency and a high spike probability response to light stimulation (filled circles) were classified as CGRP neurons. Inset: histograms showing firing patterns of two representative opto-tagged CGRP neurons response to 10 blue light pulses at 30 Hz. (F) Population firing rates of all recorded CGRP neurons (hab: n=28; cond: n=29, test: n=27) during fear conditioning with the robot. (G) Normalized firing in response to CS and unconditioned stimulus (US). (H) Population responses of all recorded CGRP neurons (n=31) in response to three aversive stimuli. (I) Average firing rates of CGRP neurons to pinprick, tail pinch, and robot chasing. Among these aversive stimuli, tail pinch induced a significantly greater increase in firing rates compared to both pinprick and robot chasing (one-way ANOVA, F(2, 90)=35.87, p<0.001; post-hoc tests, <i>p-values <0.001). ***p<0.001.
-
Figure 1—source data 1
Behavior data for Figure 1.
- https://cdn.elifesciences.org/articles/101523/elife-101523-fig1-data1-v3.xlsx
-
Figure 1—source data 2
Electrophysiology data for Figure 1.
- https://cdn.elifesciences.org/articles/101523/elife-101523-fig1-data2-v3.xlsx
Figure 1—figure supplement 1
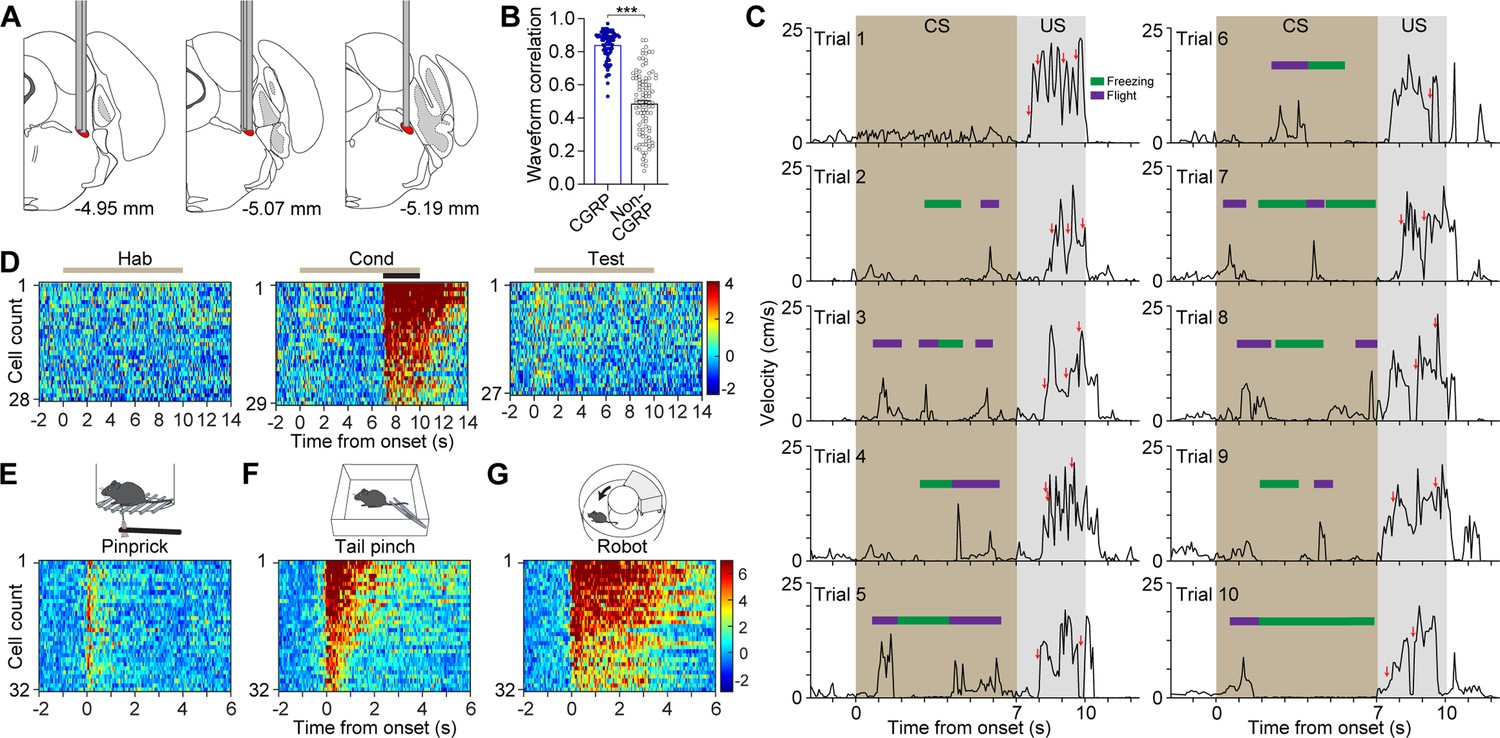
Characterization of CGRP neuron activity and behavioral responses during fear conditioning with chasing robot.
(A) Reconstruction of optrode implantation sites along the anterior-posterior extent of the parabrachial nucleus (PBN).Each bar indicates an optrode track included for data analysis in the experiment shown in Figure 1. (B) Correlations between spontaneous and light-evoked waveforms. Calcitonin gene-related peptide (CGRP) neurons showed higher correlations between spontaneous and light-evoked waveforms compared to non-CGRP neurons (t(181) = 15.16, p<0.001). (C) Velocity traces from a representative animal across fear conditioning trials. Red arrows indicate collisions with the robot. The animal exhibited both freezing and flight responses during the tone conditioned stimulus (CS). Freezing was defined as any immobile movement lasting at least 0.8 s, while flight was characterized by movement velocity exceeding 8 cm/s. (D) Color-coded, normalized firing rates of CGRP neurons during fear conditioning using the robot. (E–G) Color-coded, normalized firing rates of CGRP neurons during (E) pinprick, (F) tail pinch, and (G) chasing. ***p<0.001.
-
Figure 1—figure supplement 1—source data 1
Correlations between spontaneous and light-evoked waveforms.
- https://cdn.elifesciences.org/articles/101523/elife-101523-fig1-figsupp1-data1-v3.xlsx
-
Figure 1—figure supplement 1—source data 2
Velocity data for a representative animal across 10 fear conditioning trials.
- https://cdn.elifesciences.org/articles/101523/elife-101523-fig1-figsupp1-data2-v3.xlsx
Figure 2
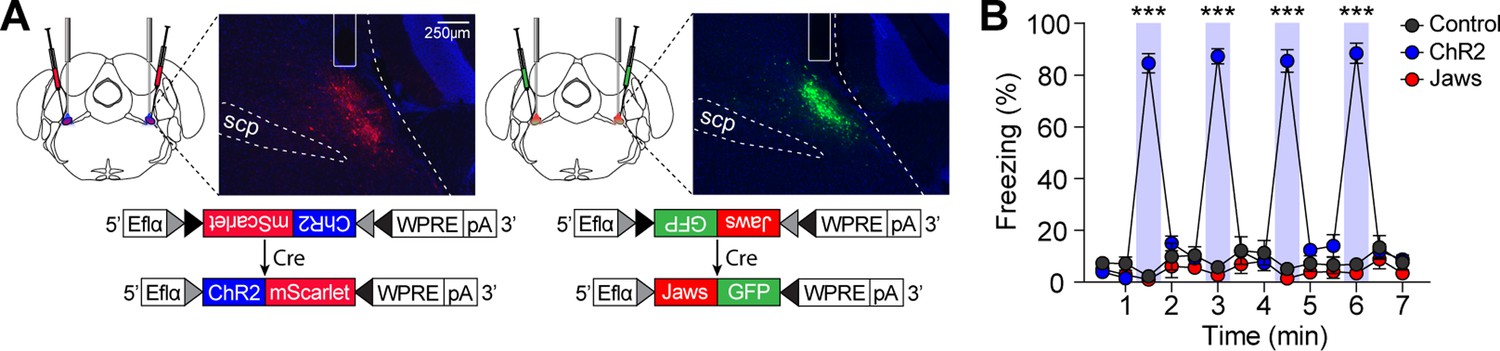
Stimulation of calcitonin gene-related peptide (CGRP) neurons in the absence of any external stimuli induces robust freezing behavior.
(A) Schematic of bilateral AAV-DIO-ChR2-mScarlet or AAV-DIO-Jaws-GFP injections and optic fiber implantation into the parabrachial nucleus (PBN), with representative histological images of viral expression. (B) 30 s stimulation of CGRP neurons at 40 Hz resulted in significantly higher time-locked freezing behaviors in the ChR2 group compared to both the Jaws and control groups (n=10 per group; significant group ×time interaction in a repeated-measures two-way ANOVA, F(26, 351)=61.32, p<0.001; post-hoc tests at each time, <i>p-values <0.001). ***p<0.001.
-
Figure 2—source data 1
Behavior data for Figure 2.
- https://cdn.elifesciences.org/articles/101523/elife-101523-fig2-data1-v3.xlsx
Figure 3 with 1 supplement
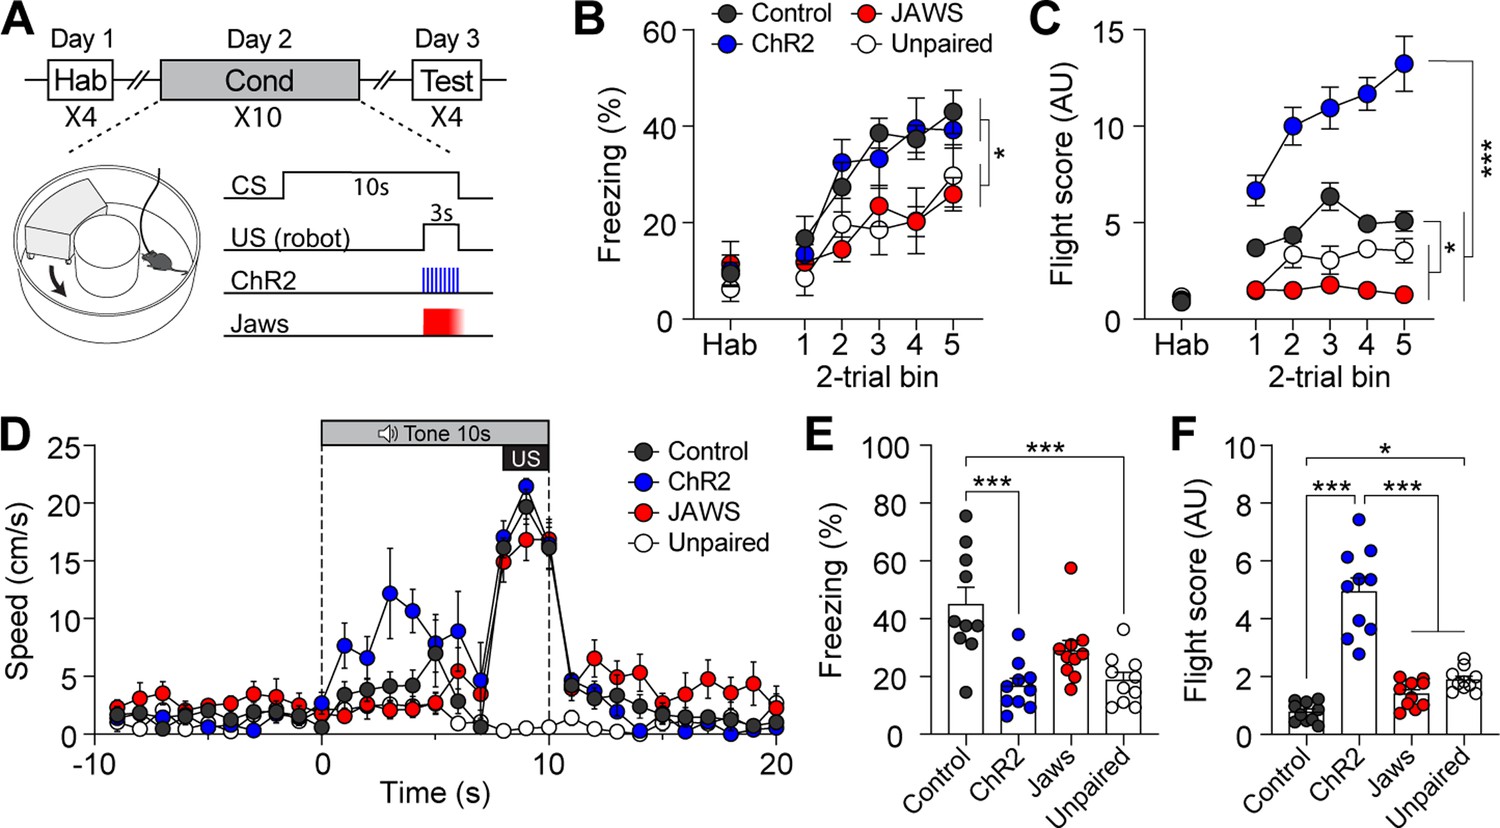
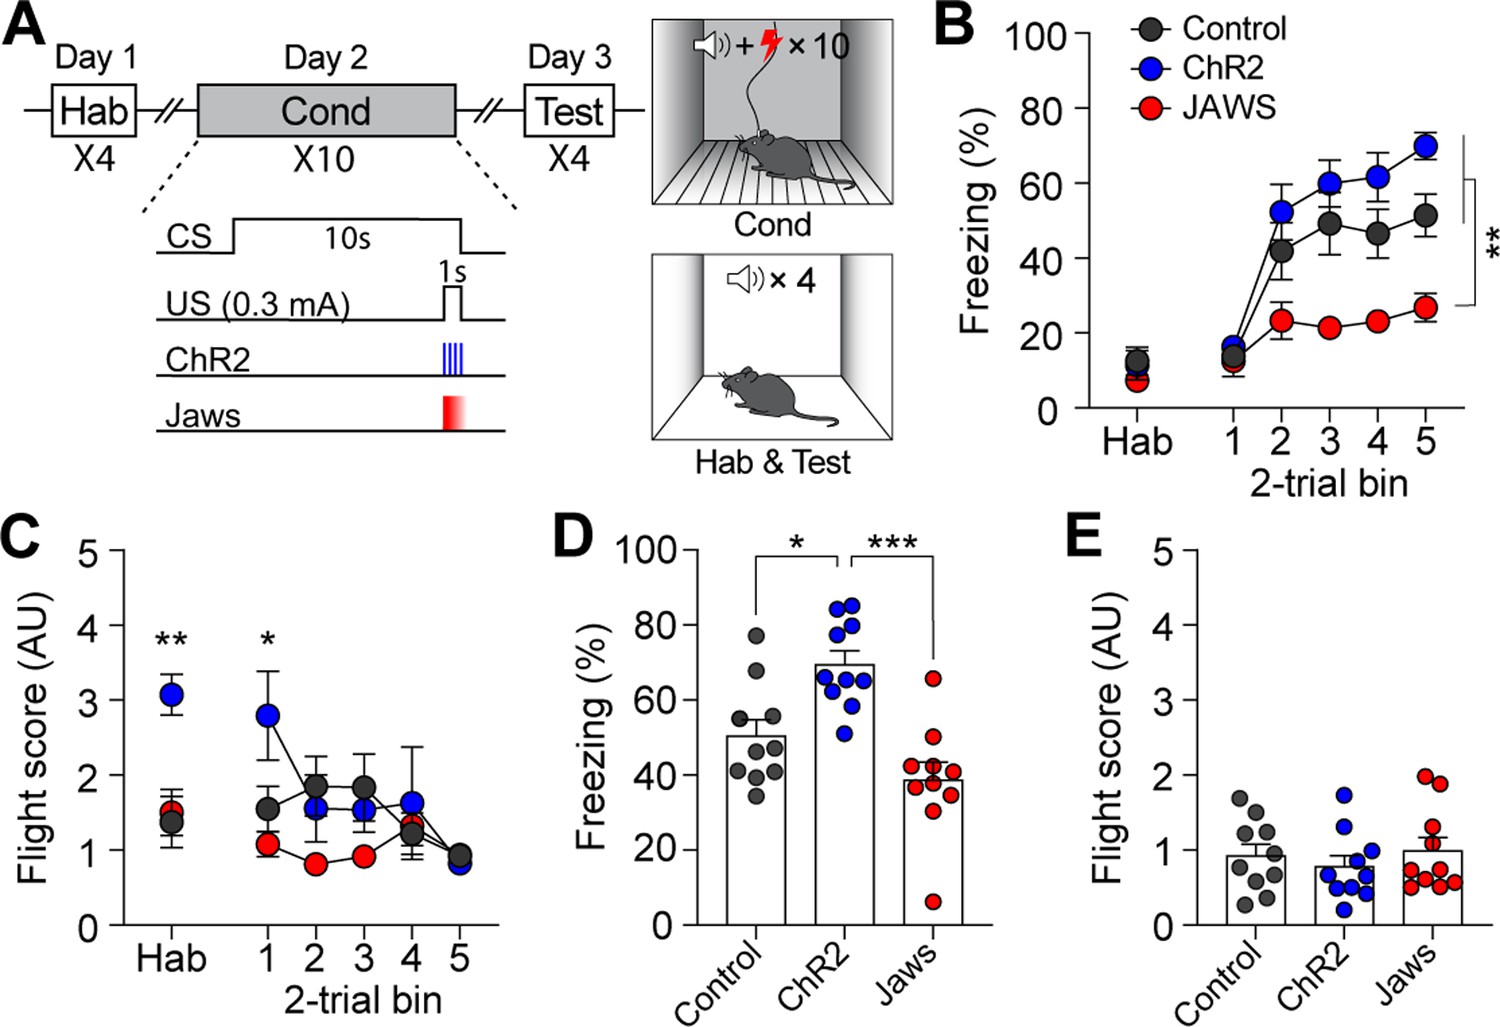
Activation of calcitonin gene-related peptide (CGRP) neurons during unconditioned stimulus (US) presentation enhances active defensive behavior.
(A) A schematic diagram of fear conditioning protocol with the robot. CGRP neuronal activity was bidirectionally manipulated during the presentation of the robot chasing. (B) Freezing to the conditioned stimulus (CS) during habituation and conditioning sessions. A progressive increase in freezing was observed in all four groups (n=10 per group), but the Jaws and unpaired groups showed significantly lower freezing levels compared to the other two groups (significant group effect in a repeated-measures two-way ANOVA, F(3, 36)=5.50, p<0.01; subsequent post-hoc tests, <i>p-values <0.05). (C) Flight scores during habituation and conditioning sessions. The ChR2 group displayed significantly higher flight scores compared to other three groups (significant group effect in a repeated-measures two-way ANOVA, F(3, 36)=102.05, p<0.001; post-hoc tests, <i>p-values <0.001), while both the Jaws and unpaired groups had lower flight scores than the control group (<i>p-values <0.05). (D) Average velocities in response to the CS during the conditioning. The average velocity of the ChR2 group during the CS (first 7 s from onset) was significantly higher compared to that observed in all three groups (significant group effect in a repeated-measures two-way ANOVA, F(3, 36)=20.47, p<0.001; post-hoc test, <i>p-values <0.01). (E) Average freezing in response to the CS during the retention test. The ChR2 group froze significantly less than the control group (one-way ANOVA, F(3, 36)=10.82, p<0.001; post-hoc test, <i>p-value <0.001). The unpaired group also exhibited significantly lower freezing compared to the control group (<i>p-value <0.001). (F) Average flight scores in response to the CS during the retention test. The ChR2 group exhibited significantly higher flight scores than all three groups (one-way ANOVA, F(3, 36)=50.56, p<0.001; post-hoc test, <i>p-values <0.001). The unpaired group showed a significantly lower flight response compared to the control group (<i>p-value <0.05). *p<0.05, ***p<0.001.
-
Figure 3—source data 1
Behavior data for Figure 3.
- https://cdn.elifesciences.org/articles/101523/elife-101523-fig3-data1-v3.xlsx
Figure 3—figure supplement 1
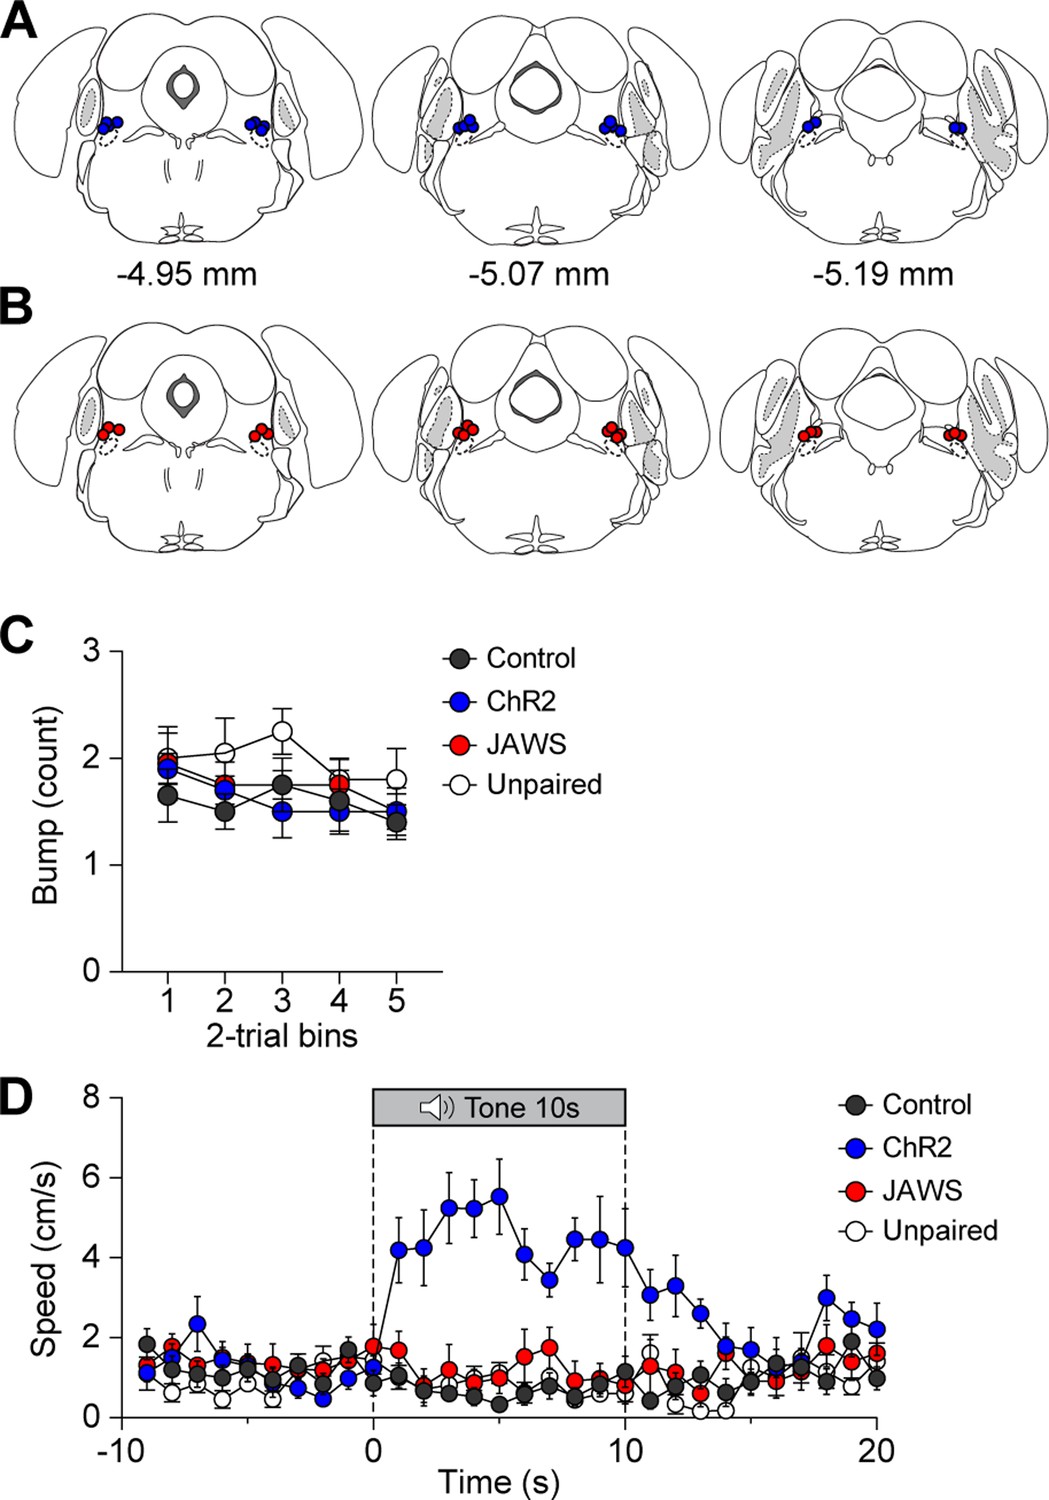
Optic fiber placements and behavioral assessments during conditioning and retention test.
(A–B) Anatomical locations of optic fiber tips above the parabrachial nucleus (PBN) of (A) ChR2 and (B) Jaws groups.(C) Number of times bumping with the robot. No group differences were observed throughout the trials across the three groups (repeated-measures two-way ANOVA, F(3, 36)=1.41, p=0.26). (D) Average velocities in response to the conditioned stimulus (CS) during the retention test. The average velocity of the ChR2 group during the CS was significantly higher compared to that observed in the Jaws and control groups (significant group effect in a repeated-measures two-way ANOVA, F(3, 36)=56.65, p<0.001; post-hoc test, <i>p-values <0.01). ***p<0.001.
-
Figure 3—figure supplement 1—source data 1
Number of bumping incidents across different groups and velocity data for Figure 3—figure supplement 1D.
- https://cdn.elifesciences.org/articles/101523/elife-101523-fig3-figsupp1-data1-v3.xlsx
Figure 4
Calcitonin gene-related peptide (CGRP) activation during conventional fear conditioning promotes passive, but not active, defensive behavior.
(A) A schematic diagram of fear conditioning protocol with the footshock. (B) Freezing to the conditioned stimulus (CS) during habituation and conditioning sessions. All three groups showed a progressive increase in freezing as trials progressed, but the Jaws group froze significantly less compared to the other two groups (significant group effect in a repeated-measures two-way ANOVA, F(2, 27)=19.74, p<0.001; subsequent post-hoc tests, <i>p-values <0.01). (C) Flight scores in response to the CS during habituation and conditioning sessions. The ChR2 group showed significantly higher fleeing responses during habituation, suggesting some residual effect from fear conditioning with the robot (one-way ANOVA, F(2, 27)=9.37, p<0.01; post-hoc test, <i>p-value <0.01). A repeated-measures two-way ANOVA revealed significant group differences during conditioning (F(2, 27)=8.91, p<0.01); however, post-hoc analysis showed that these differences were only significant in the first block of trials, where the ChR2 group exhibited higher fleeing responses than the other two groups, with no group differences observed in subsequent blocks. (D) Average freezing in response to the CS during the retention test. The ChR2 group froze significantly more than the Jaws and control groups (one-way ANOVA, F(2, 27)=13.31, p<0.001; post-hoc tests, <i>p-values <0.05). (E) Average flight scores to the CS during the retention test. Fleeing responses were minimal across all three groups, and no significant differences were observed (one-way ANOVA, F(2, 27)=0.12, p=0.63). *p<0.05, **p<0.01, ***p<0.001.
-
Figure 4—source data 1
Behavior data for Figure 4.
- https://cdn.elifesciences.org/articles/101523/elife-101523-fig4-data1-v3.xlsx
Figure 5 with 1 supplement
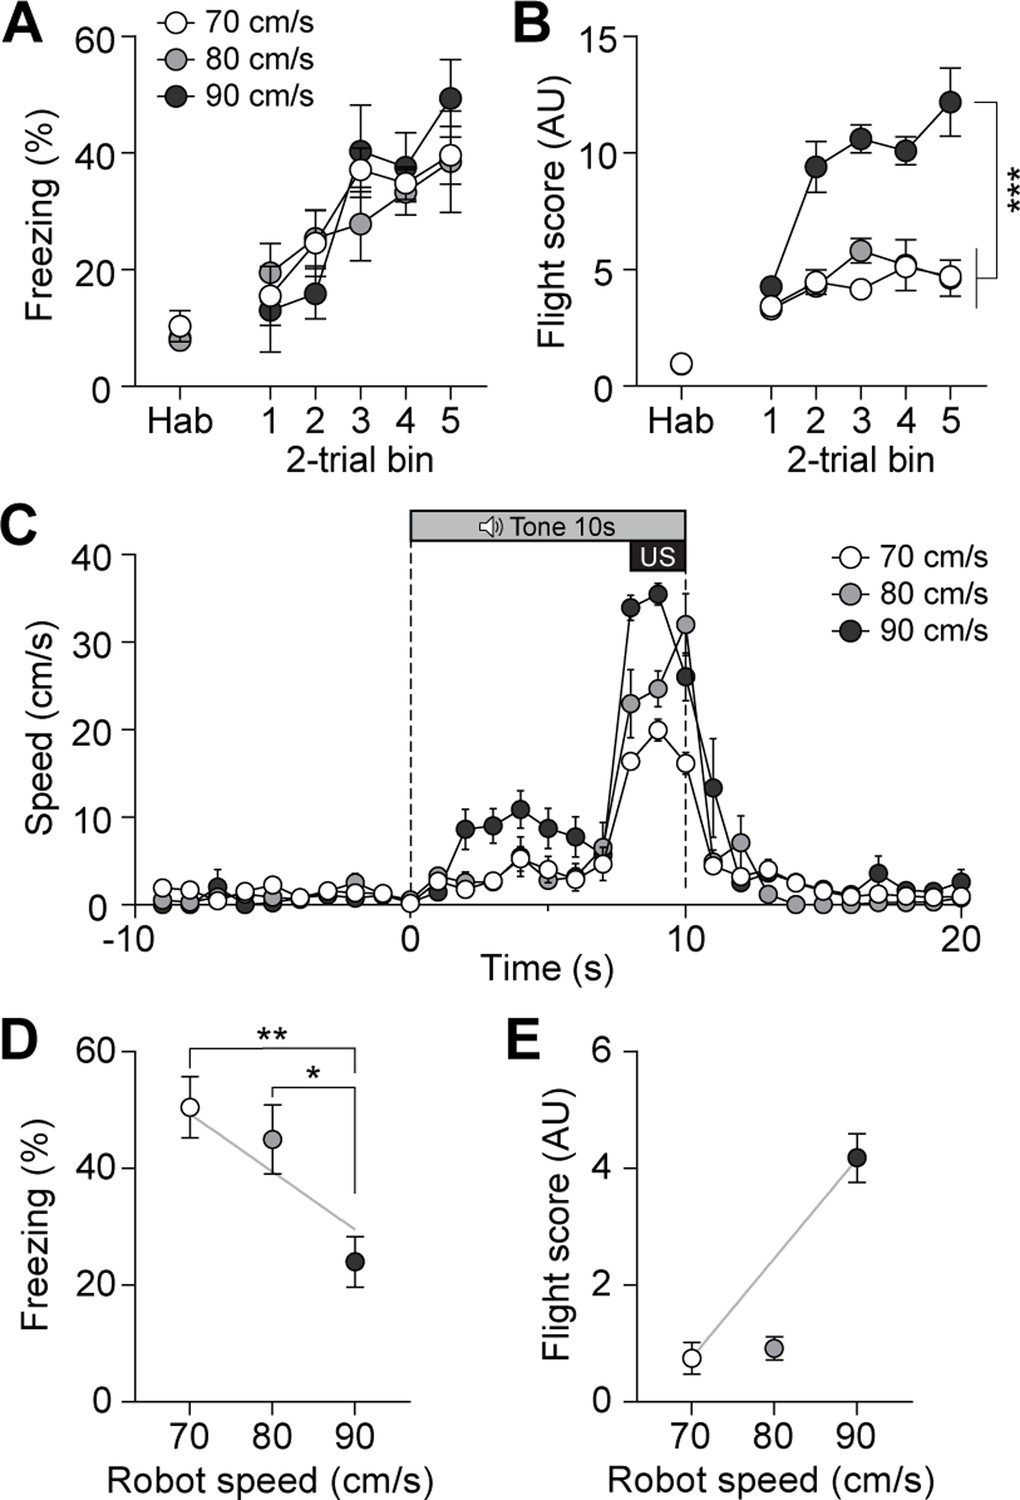
Escalating threat intensity modulates defensive behavior.
(A) Freezing to the conditioned stimulus (CS) during habituation and conditioning sessions for groups subjected to three different robot speeds (n=8 per group). All three groups showed an equivalent progressive increase in freezing as trials progressed, with no significant differences between the groups (repeated-measures two-way ANOVA, F(2, 21)=0.11, p=0.89). (B) Flight scores in response to the CS during habituation and conditioning sessions. Animals exposed to 90 cm/s robot speed exhibited higher flight scores compared to the other two groups (repeated-measures two-way ANOVA, F(2, 21)=76.43, p<0.001; post-hoc tests, <i>p-values <0.001). (C) Average velocities in response to the CS during the conditioning. The average velocity of the 90 cm/s group during the CS was significantly higher than that observed in the 70- and 80 cm/s groups (significant group effect in a repeated-measures two-way ANOVA, F(2, 21)=8.42, p<0.001; post-hoc test, <i>p-values <0.01). (D) Average freezing in response to the CS during the retention test. Animals exposed to 70- or 80 cm/s robot speed froze significantly more compared to those subjected to 90 cm/s (one-way ANOVA, F(2, 21)=6.60, p<0.01; post-hoc tests, <i>p-values <0.05). There was a negative correlation between freezing responses and robot speed (gray line; r=–0.61, p<0.01). (E) Average flight scores in response to the CS during the retention test. Animals subjected to 90 cm/s robot speed displayed significantly higher flight scores compared to those exposed to 70- and 80 cm/s (one-way ANOVA, F(2, 21)=58.09, p<0.001; post-hoc tests, <i>p-values <0.001). Fleeing responses were positively correlated with robot speed (gray line; r=0.82, p<0.001).
-
Figure 5—source data 1
Behavior data for Figure 5.
- https://cdn.elifesciences.org/articles/101523/elife-101523-fig5-data1-v3.xlsx
Figure 5—figure supplement 1
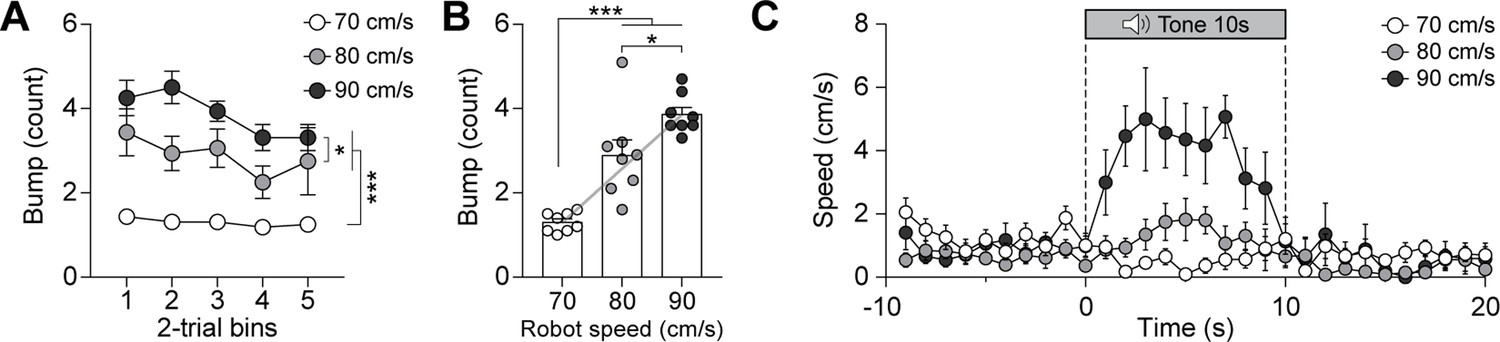
Effects of robot speed on bumping incidents and behavioral responses.
(A) Number of times bumping with the robot at different speeds.Bumping occurrence increased with robot speeds (significant group effect in a mixed-design ANOVA, F(2, 21)=29.44, p<0.001): 80 cm/s resulted in more bumps than 70 cm/s (p<0.001), 90 cm/s resulted in more bumps than 80 cm/s (p<0.05), and 90 cm/s resulted in more bumps than 70 cm/s (p<0.001). (B) Average number of times bumping during conditioning. There was a positive correlation between number of bumping and robot speed (gray line; r=0.85, p<0.001). (C) Average velocities in response to the conditioned stimulus (CS) during the retention test. The average velocity of the 90 cm/s group during the CS was significantly higher than that observed in the 70- and 80 cm/s groups (significant group effect in a repeated-measures two-way ANOVA, F(2, 21)=38.55, p<0.001; post-hoc test, <i>p-values <0.001). *p<0.05, ***p<0.001.
-
Figure 5—figure supplement 1—source data 1
Number of bumping incidents across groups at different robot speeds and velocity data for Figure 5—figure supplement 1C.
- https://cdn.elifesciences.org/articles/101523/elife-101523-fig5-figsupp1-data1-v3.xlsx
Figure 6 with 1 supplement
Calcitonin gene-related peptide (CGRP) neurons are necessary for promoting active defensive behaviors under high-speed threat conditions.
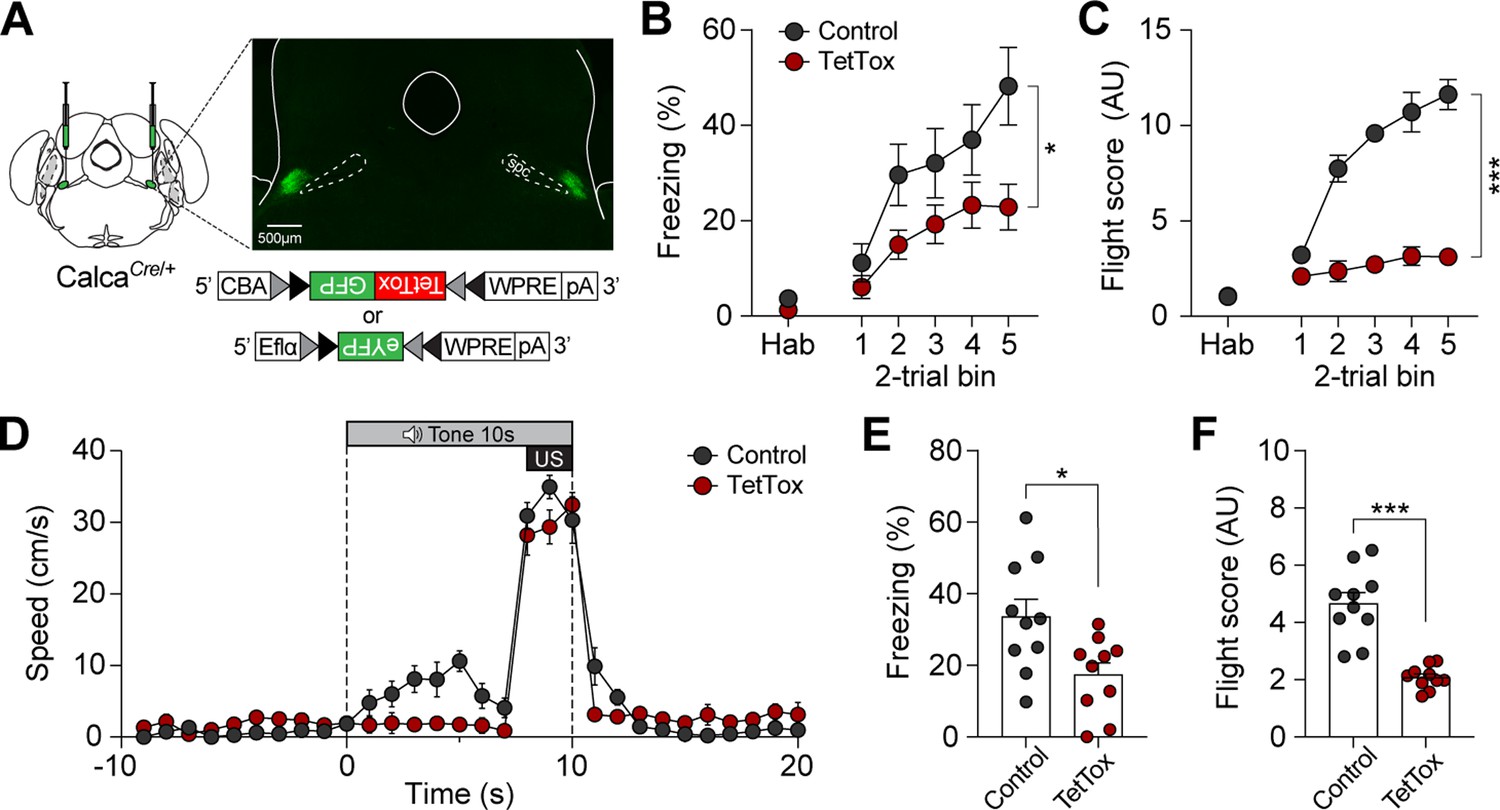
(A) Schematic of bilateral AAV-DIO-GFP:TetTox or AAV-DIO-eYFP (control) injections into the parabrachial nucleus (PBN) and representative histological images of TetTox expression. (B) Freezing to the conditioned stimulus (CS) during habituation and conditioning sessions (n=10 per group). Both groups showed a progressive increase in freezing, but the TetTox group, with inactivated CGRP neurons, exhibited significantly lower levels of freezing compared to the control group (significant group effect in a repeated-measures two-way ANOVA, F(1, 18)=6.42, p<0.05). (C) Flight scores in response to the CS during habituation and conditioning sessions. The control group showed significantly greater levels of fleeing responses compared to the TetTox group (significant group effect in a repeated-measures two-way ANOVA, F(1, 18)=235.27, p<0.001). (D) Average velocities in response to the CS during the conditioning. Control animals displayed significantly higher flight scores compared to the TetTox group (repeated-measures two-way ANOVA, F(1, 18)=31.91, p<0.001). (E) Average freezing to the CS during the retention test. The TetTox group displayed significantly lower levels of freezing compared to the control group (independent t-test, t(18) = 2.7, p<0.05). (F) Average flight scores in response to the CS during the retention test. The TetTox group showed significantly lower levels of fleeing compared to the control group (independent t-test, t(18) = 6.29, p<0.001). *p<0.05, ***p<0.001.
-
Figure 6—source data 1
Behavior data for Figure 6.
- https://cdn.elifesciences.org/articles/101523/elife-101523-fig6-data1-v3.xlsx
Figure 6—figure supplement 1
Effects of CGRP neuron silencing on bumping and CS-evoked velocity.
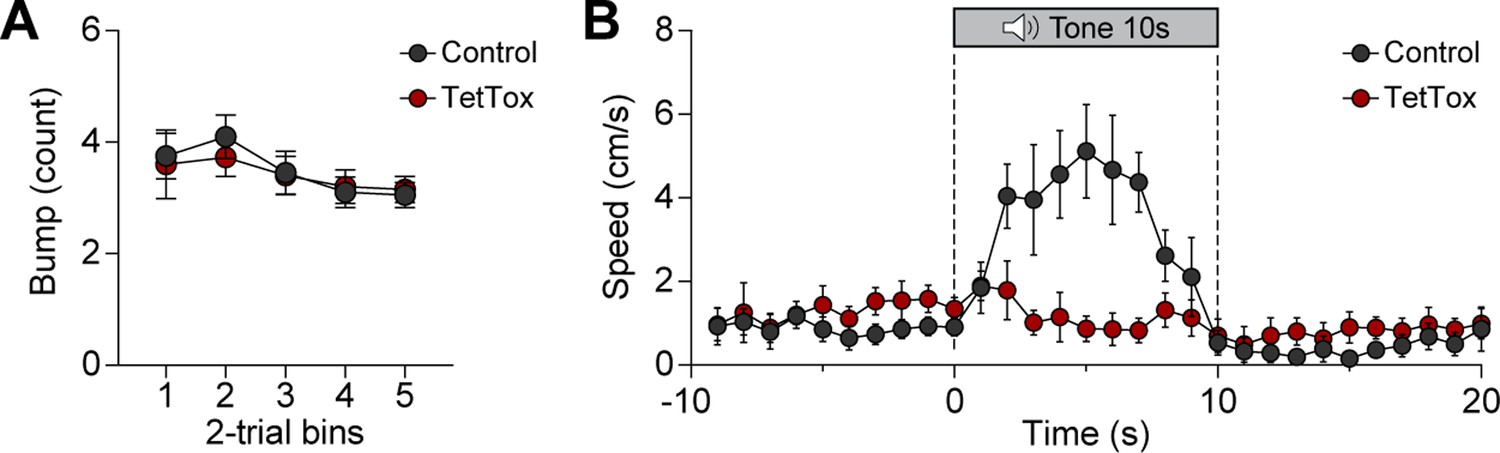
(A) Number of times bumping with the robot.No group differences were observed throughout the trials (repeated-measures two-way ANOVA, F(1, 18)=0.41, p=0.84). (B) Average velocities in response to the conditioned stimulus (CS) during the retention test. The average velocity of the control group during the CS was significantly higher than that of the TetTox group (significant group effect in a repeated-measures two-way ANOVA, F(1, 18)=43.02, p<0.001). ***p<0.001.
-
Figure 6—figure supplement 1—source data 1
Number of bumping incidents and velocity data for Figure 6—figure supplement 1B.
- https://cdn.elifesciences.org/articles/101523/elife-101523-fig6-figsupp1-data1-v3.xlsx
Author response image 1
Videos
Video 1
Fleeing behavior during conditioning in the ChR2 group in response to conditioned stimulus (CS).
The video shows the behavior of a representative animal from the control, ChR2, and Jaws groups during the last trial of conditioning. The sequence includes 10 s pre-CS, 10 s of CS (7 s of CS alone followed by 3 s of robot chasing), and 10 s post-CS. The ChR2 animal demonstrated high levels of fleeing behavior in response to the CS, compared to the control and Jaws groups.
Video 2
Fleeing behavior during aversive memory recall in the ChR2 group in response to conditioned stimulus (CS).
To test the fear memory in the retention test, we used a rectangular box instead of the donut maze used during conditioning. The box was placed on top of the donut maze, preventing the animals from seeing the robot’s location. The CS was delivered from the robot’s speaker, with the flashing light indicating the onset of the CS. The video shows the animals' behavior during the first trial of the retention test, where the ChR2 mouse showed more fleeing behavior compared to the other two mice.
Tables
Key resources table
| Reagent type (species) or resource | Designation | Source or reference | Identifiers | Additional information |
|---|---|---|---|---|
| Strain, strain background (Mus musculus) | B6.Cg-Calcatm1.1(cre/EGFP)Rpa/J | The Jackson Laboratory | RRID:IMSR_JAX:033168 | |
| Strain, strain background (C57BL/6 J, C57BL/6 J) | C57BL/6 J | The Jackson Laboratory | RRID:IMSR_JAX:000664 | |
| Recombinant DNA reagent | AAV-DIO-ChR2-mScarlet | IBS Virus Facility | N/A | |
| Recombinant DNA reagent | AAV-DIO-Jaws-GFP | Jo et al., 2018 | N/A | |
| Recombinant DNA reagent | AAV-DIO-eYFP | Addgene | RRID:Addgene_27056 | |
| Recombinant DNA reagent | AAV-DIO-TetTox-GFP | Han et al., 2015 | N/A | |
| Software, algorithm | ANY-maze 5.3 | Stoelting Co | N/A | |
| Software, algorithm | GraphPad Prism | GraphPad software | N/A | |
| Software, algorithm | SPSS | IBM | N/A | |
| Software, algorithm | Offline Sorter | Plexon Inc | N/A |
Additional files
-
MDAR checklist
- https://cdn.elifesciences.org/articles/101523/elife-101523-mdarchecklist1-v3.docx
-
Supplementary file 1
Statistical summary of behavioral and neural data.
- https://cdn.elifesciences.org/articles/101523/elife-101523-supp1-v3.xlsx
-
Source code 1
Arduino code for controlling the chasing robot.
- https://cdn.elifesciences.org/articles/101523/elife-101523-code1-v3.zip
Download links
A two-part list of links to download the article, or parts of the article, in various formats.
Downloads (link to download the article as PDF)
Open citations (links to open the citations from this article in various online reference manager services)
Cite this article (links to download the citations from this article in formats compatible with various reference manager tools)
Parabrachial CGRP neurons modulate active defensive behavior under a naturalistic threat
eLife 14:e101523.
https://doi.org/10.7554/eLife.101523


