MorphoCellSorter is an Andrews plot-based sorting approach to rank microglia according to their morphological features
- Claude Bernard Lyon 1 University, France
- Institut MeLiS, INSERM U1314 CNRS UMR5284, France
- Institut National des Sciences Appliquées (INSA), France
- Institut de Neurosciences Cognitives et Intégratives d'Aquitaine, CNRS UMR 5287, Université de Bordeaux, France
- CarMeN Laboratory, INRAE U1397, INSERM U1060, Claude Bernard Lyon 1 University, France
- CNRS, France
- Sorbonne Université, Institut du Cerveau – Paris Brain Institute – ICM, Inserm, CNRS, APHP, Hôpital de la Pitié Salpêtrière, France
- French Reference Center on Paraneoplastic Neurological Syndromes and Autoimmune Encephalitis, Hospices Civils de Lyon, France
- Centre de Recherche en Neurosciences de Lyon (CNRL), INSERM 1028 CNRS UMR5292, France
Figures
Figure 1

k-means clustering identifies highly different populations contralaterally vs ipsilaterally in an ischemic stroke model but offers a heterogeneous cluster composition.
(A) T2-weighted MRI acquisition of the tMCAo rat brain 24 hr after reperfusion (top). Z maximum projections of IBA1 staining of microglia on the ipsilateral side to the lesion (bottom left) and contralateral side (bottom right). Scale bar: 20 µm. (B) Scatter plot with each dot representing one microglia from the complete dataset (ipsilateral and contralateral), plotted in function of their first principal component (PC1) against PC2 values from the principal component analysis (PCA) conducted on all 20 initial morphological parameters. The colors represent the clusters identified by the k-means method, and the ‘x’ symbols are the centers of each cluster. (C) Sample of microglial cells and their affiliated cluster. (D) Pie chart illustrating the proportion of each cluster constituting the contralateral and ipsilateral sides.
Figure 2 with 1 supplement
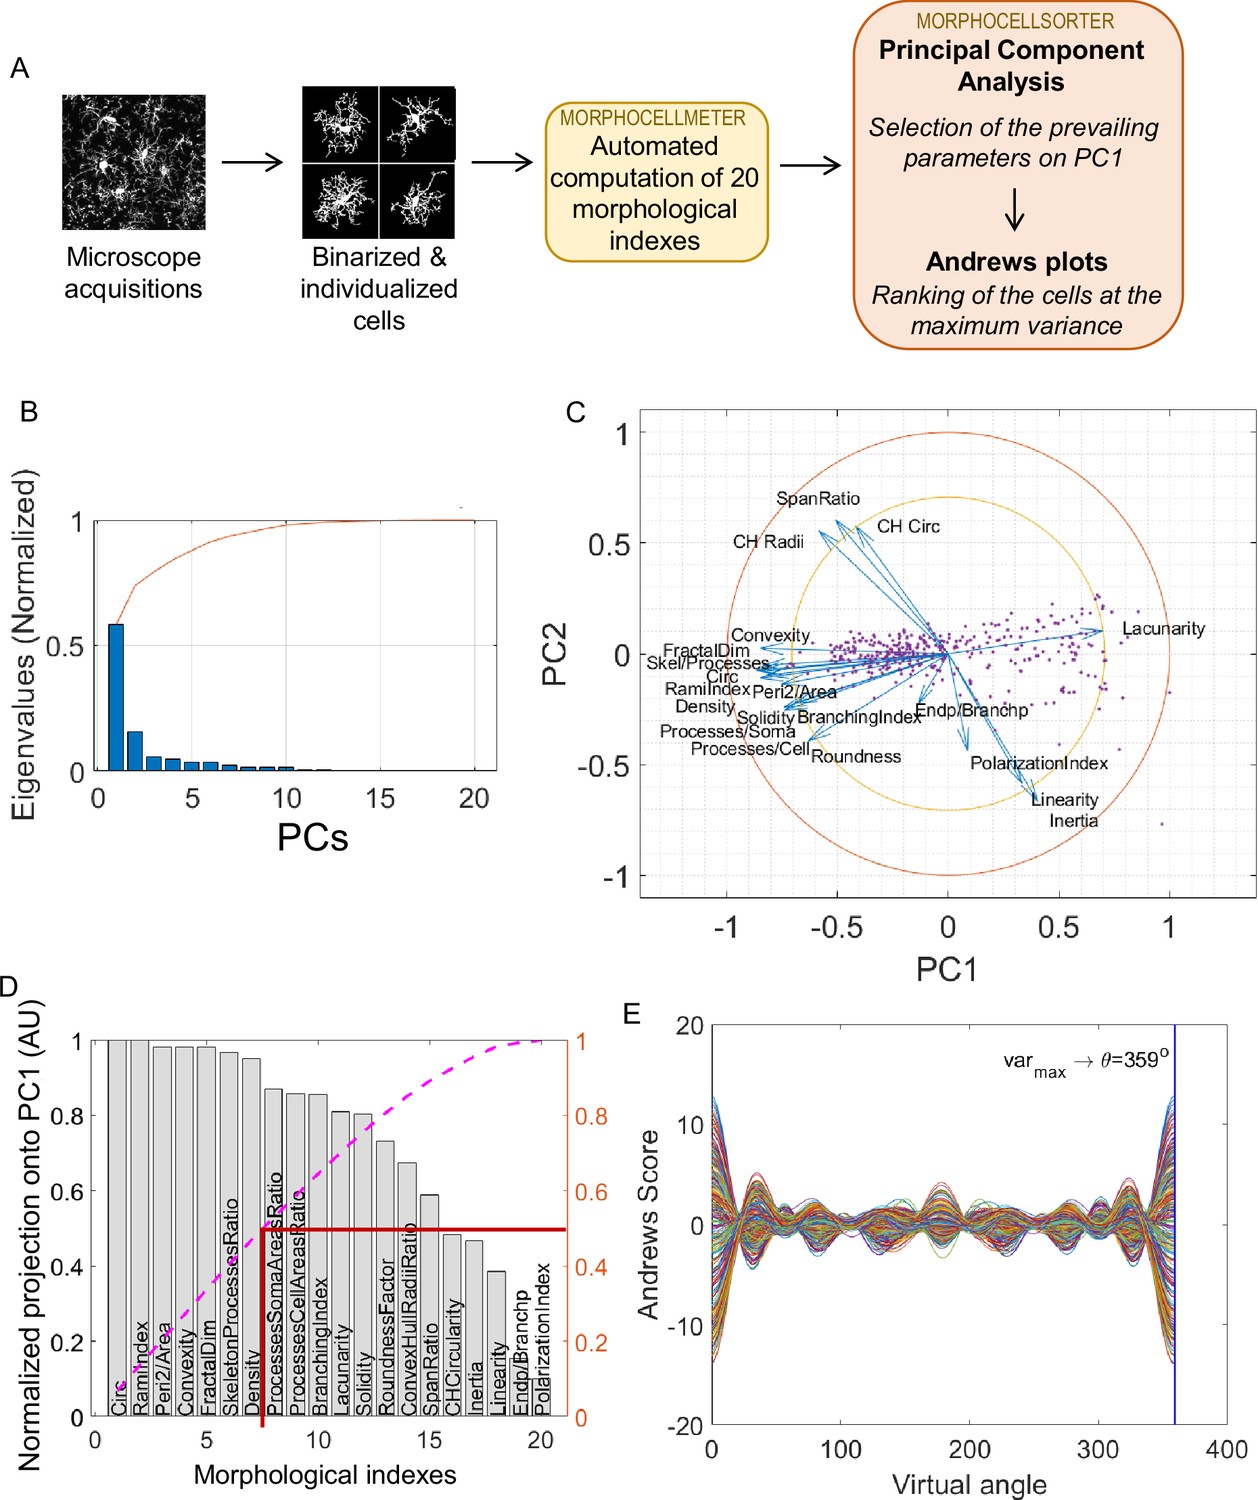
MorphoCellSorter approach to generate a ranking of the cells based on their morphology applied to the ischemic stroke model on fixed tissue.
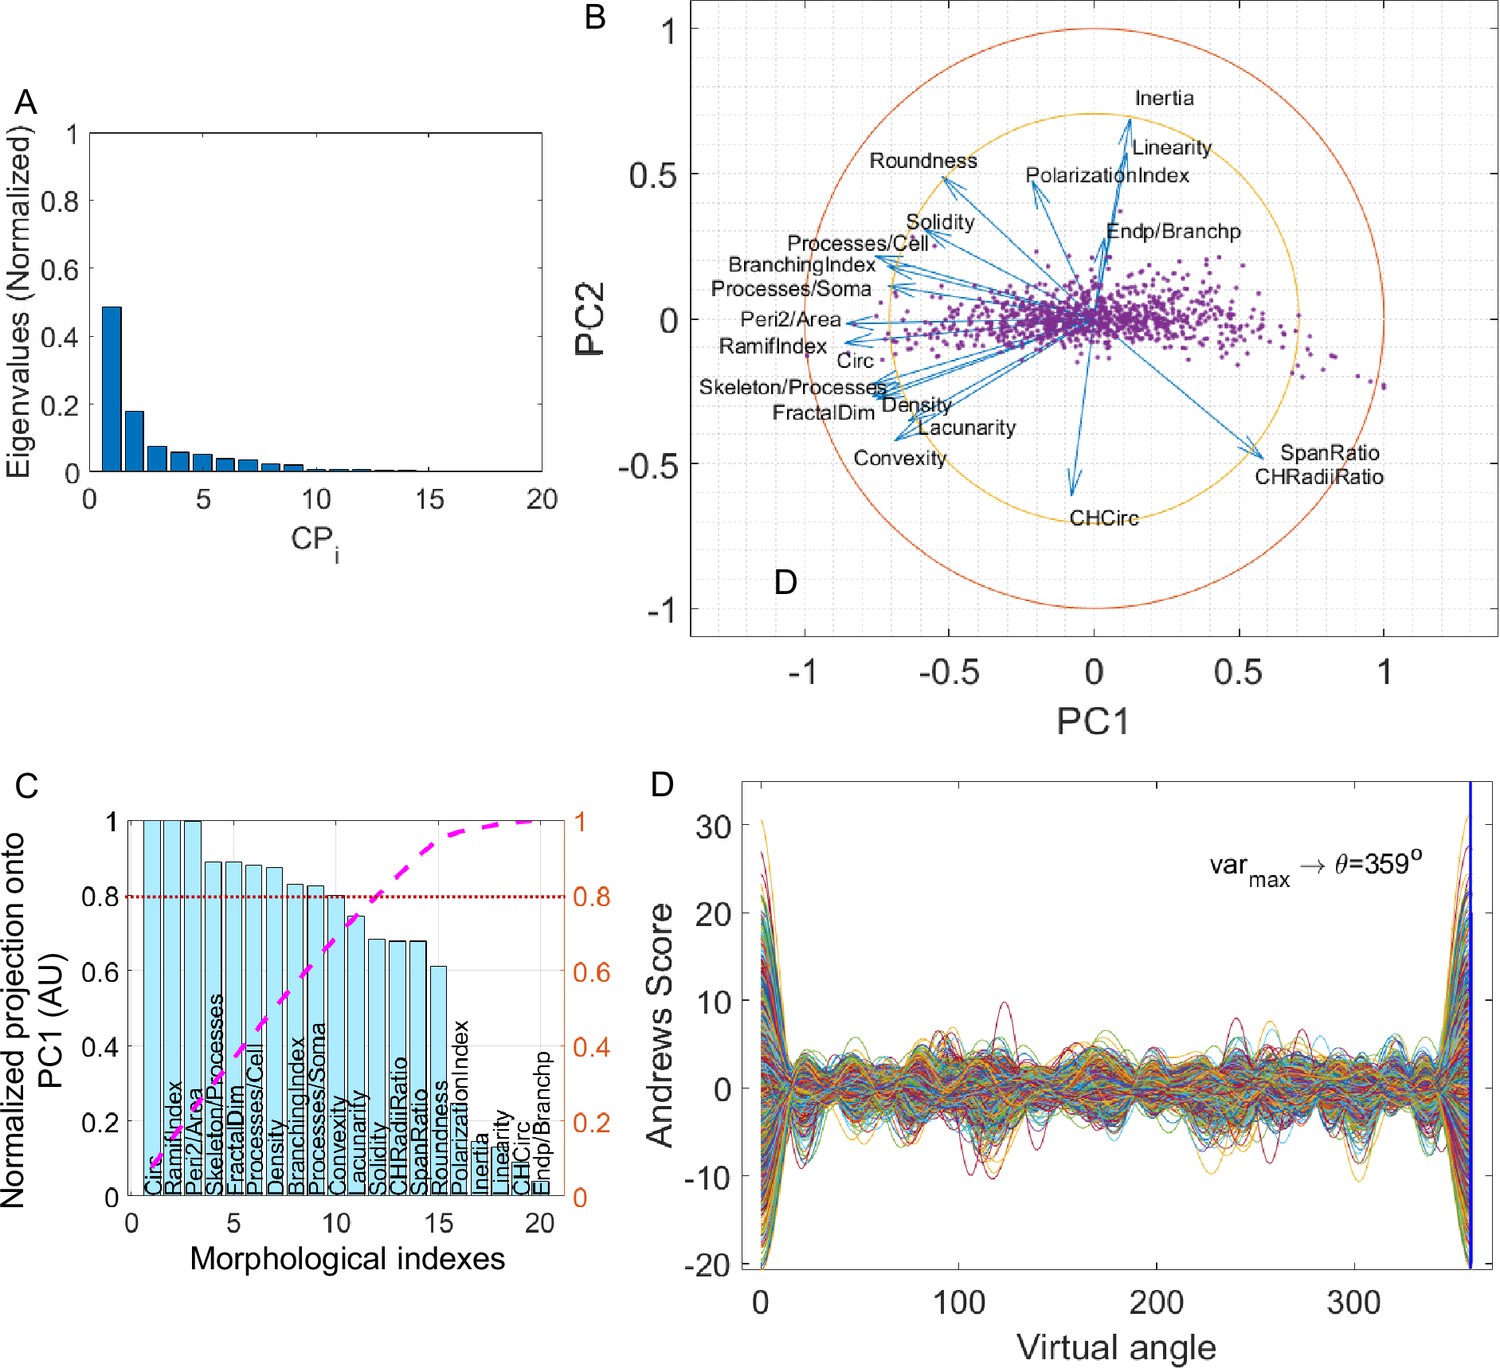
(A) Summary of the fully automated MorphoCellSorter approach: morphological indexes of the individualized and binarized microglia are computed on a first script (MorphoCellMeter), and the resulting data table is used as an entry for MorphoCellSorter to generate the ranking of the cells based on their morphological characteristics. (B) Cascade of normalized eigenvalues. The blue bars represent the eigenvalues for each principal component (PCs), and the red curve is the cumulative sum of the values. The first two eigenvalues corresponding to the first two PCs that account for over 70% of the total sum. (C) Correlation circle in the PC1 and PC2 planes. (D) Parameters ranked according to their projection on PC1. Values are normalized by the highest projection value. To determine the number of morphological parameters selected, here we consider the median number of the normalized cumulative projection (pink curve), leading to a threshold at 0.5 (red line), and thus seven kept parameters in this case. (E) Andrews plots generated with the seven parameters weighted according to their contribution onto PC1. Each curve represents one microglia in the high-dimensional space of the seven strongest parameters’ projections onto PC1. The maximum variance between curves is obtained at 359°.
Figure 2—figure supplement 1
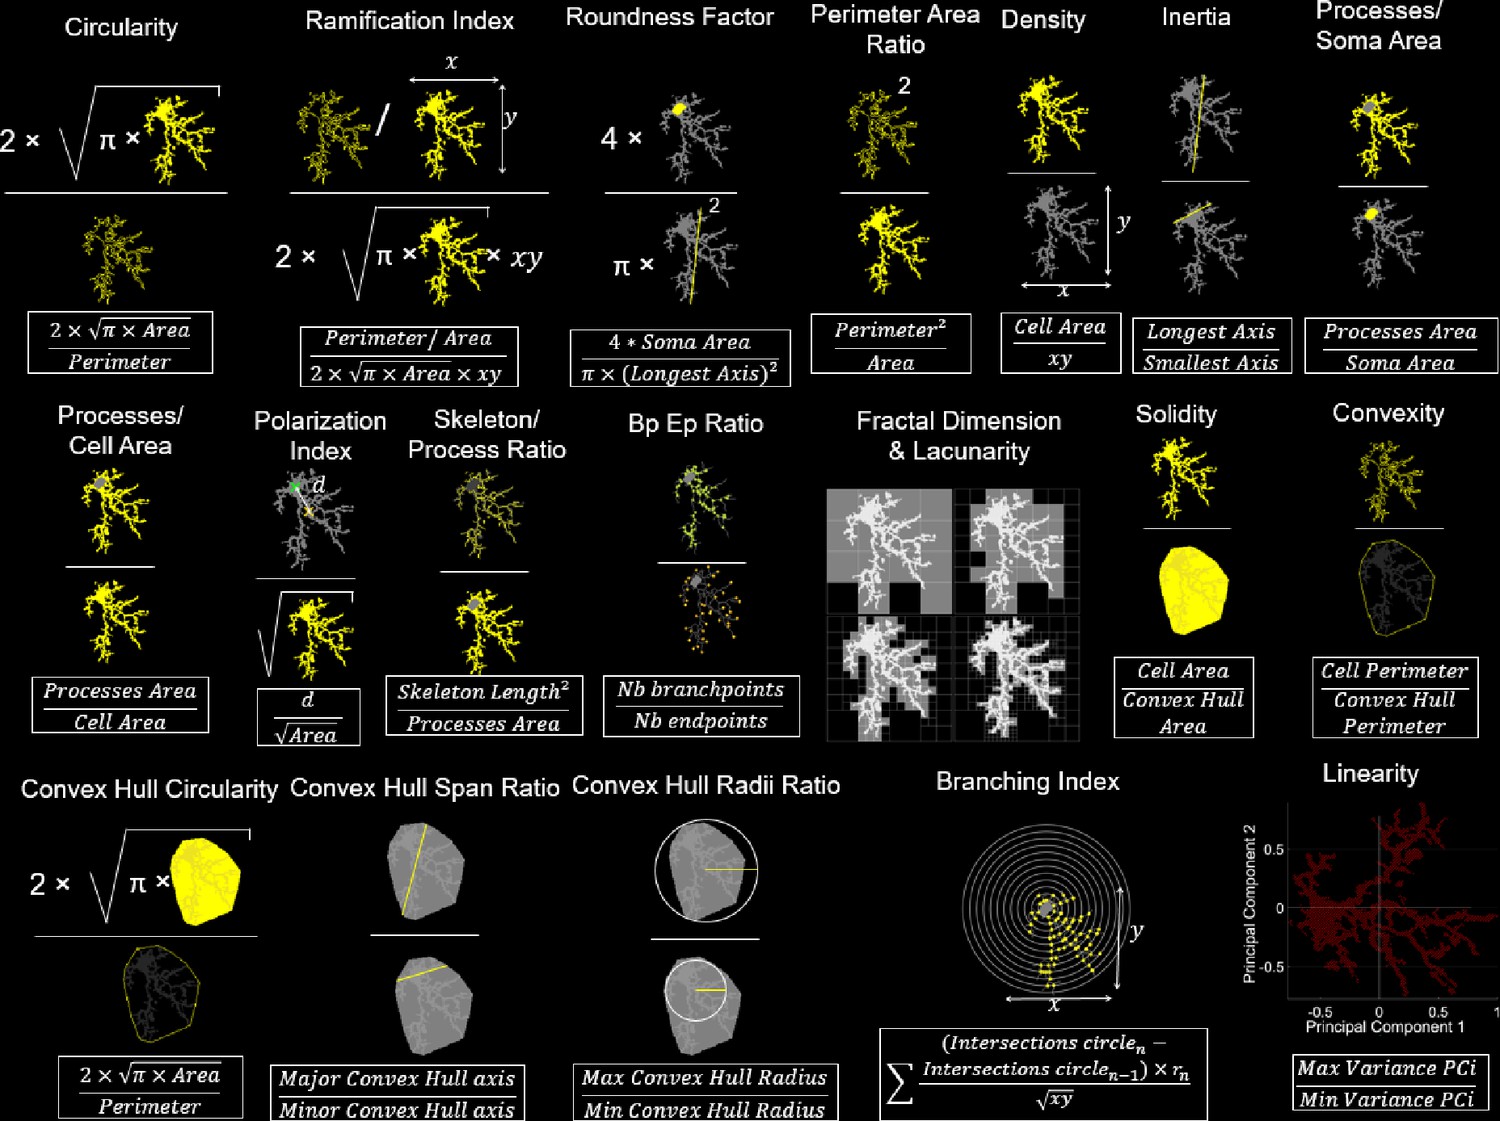
Illustration of the 20 morphological indexes automatically computed.
Figure 3
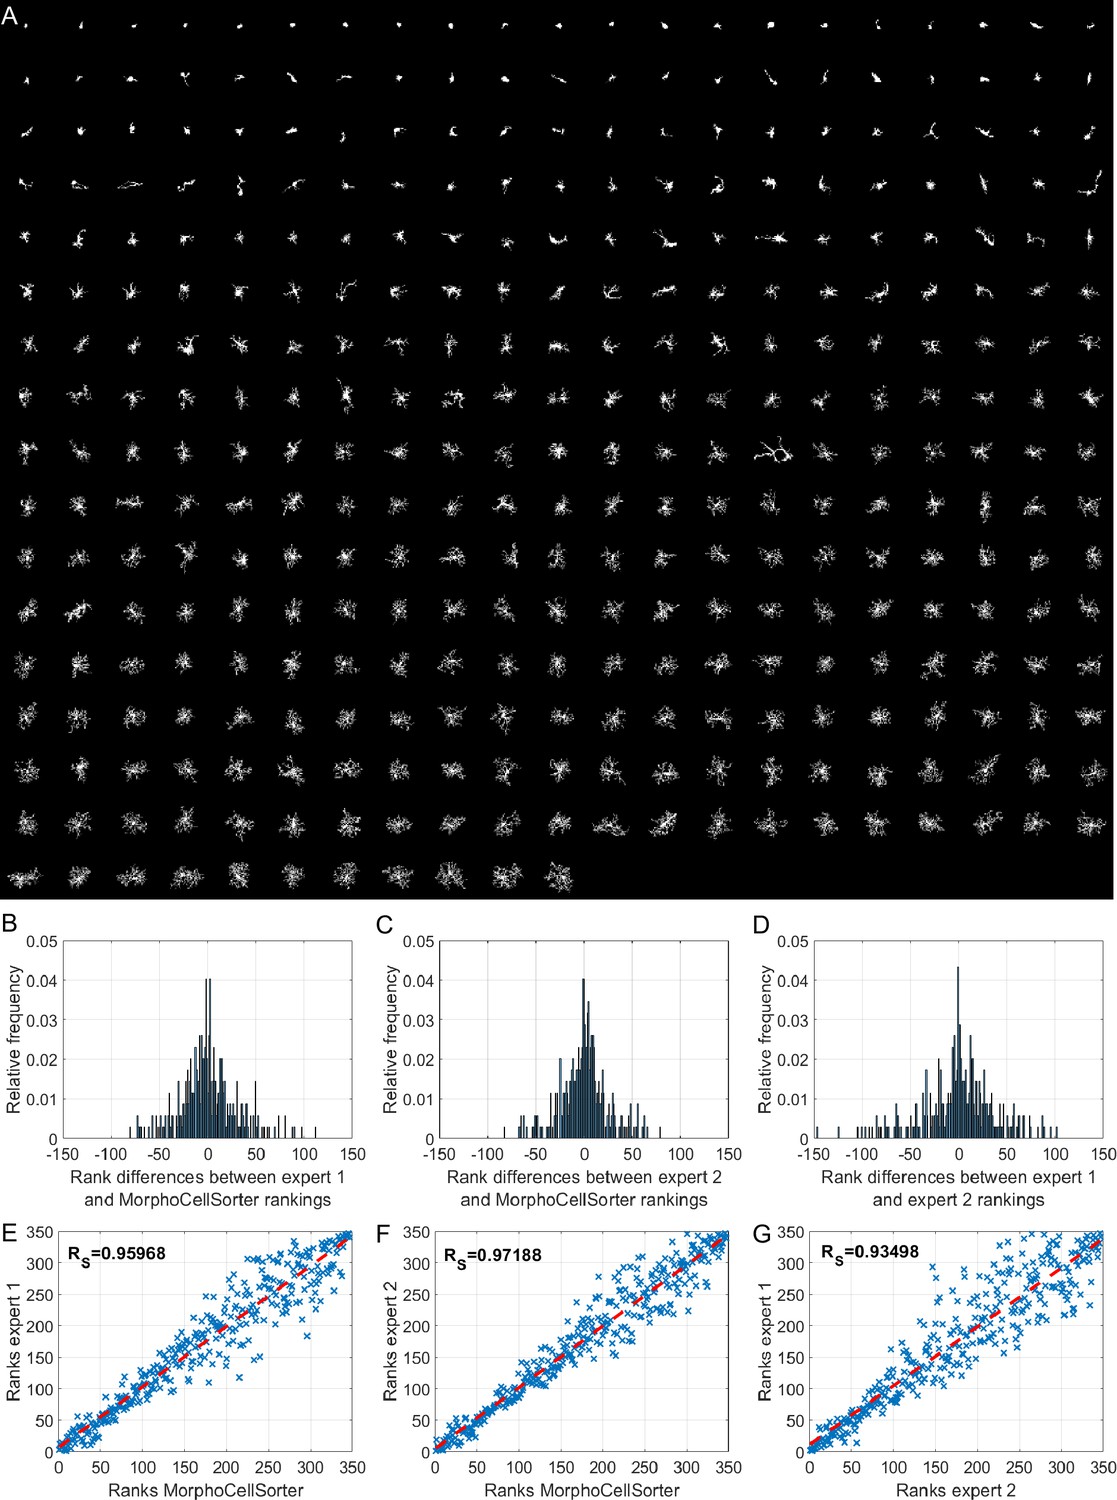
MorphoCellSorter offers a reliable ranking of microglia in an ischemic stroke model based on their morphologies.
(A) Automatic ranking generated by MorphoCellSorter of the 347 microglia constituting the ischemic stroke model dataset. (B) Distribution of the rank difference between expert 1 manual and MorphoCellSorter rankings. (C) Distribution of the rank difference between expert 2 manual and MorphoCellSorter rankings. (D) Distribution of the rank difference between expert 1 and expert 2 manual rankings. (E) Correlation between expert 1 and MorphoCellSorter rankings. Spearman’s correlation coefficient Rs = 95,968, p<0.0001. (F) Correlation between expert 2 and MorphoCellSorter rankings. Spearman’s correlation coefficient Rs = 97,188, p<0.0001. (G) Correlation between expert 1 and expert 2 rankings. Spearman’s correlation coefficient Rs = 93,498, p<0.0001.
Figure 4 with 6 supplements
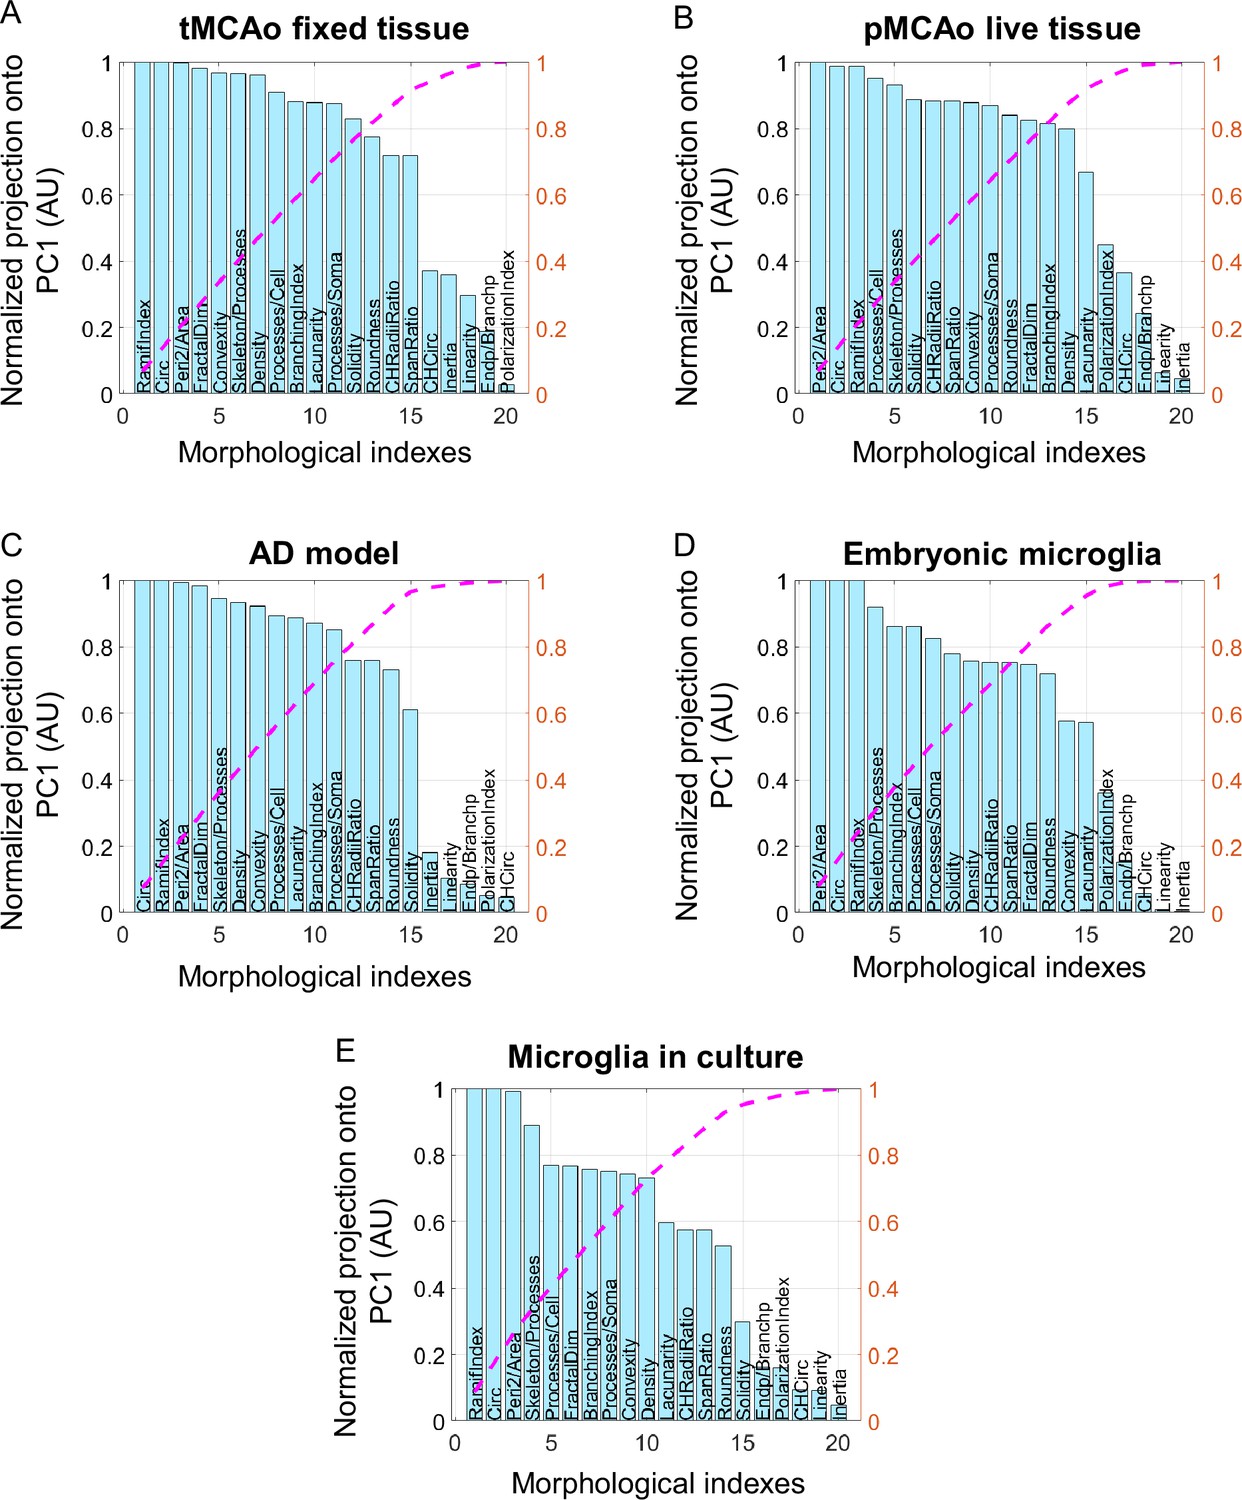
Parameters ranked according to their normalized projection onto the first principal component (PC1) for the five tested datasets.
Parameters ranked according to their projection onto PC1 for the following datasets: temporary mean cerebral artery occlusion (tMCAo) on fixed tissue (A), permanent mean cerebral artery occlusion (pMCAo) on live tissue (B), Alzheimer’s disease (AD) model (C), embryonic microglia (D), and microglia in culture (E). Values are normalized by the highest projection value. The number of morphological parameters selected is determined by the threshold corresponding value of the normalized cumulative projection selected (pink curve).
-
Figure 4—source data 1
Raw data relative to experiments on temporary mean cerebral artery occlusion (tMCAo) model.
- https://cdn.elifesciences.org/articles/101630/elife-101630-fig4-data1-v1.xlsx
-
Figure 4—source data 2
Raw data relative to experiments on embryonic microglia.
- https://cdn.elifesciences.org/articles/101630/elife-101630-fig4-data2-v1.xlsx
Figure 4—figure supplement 1
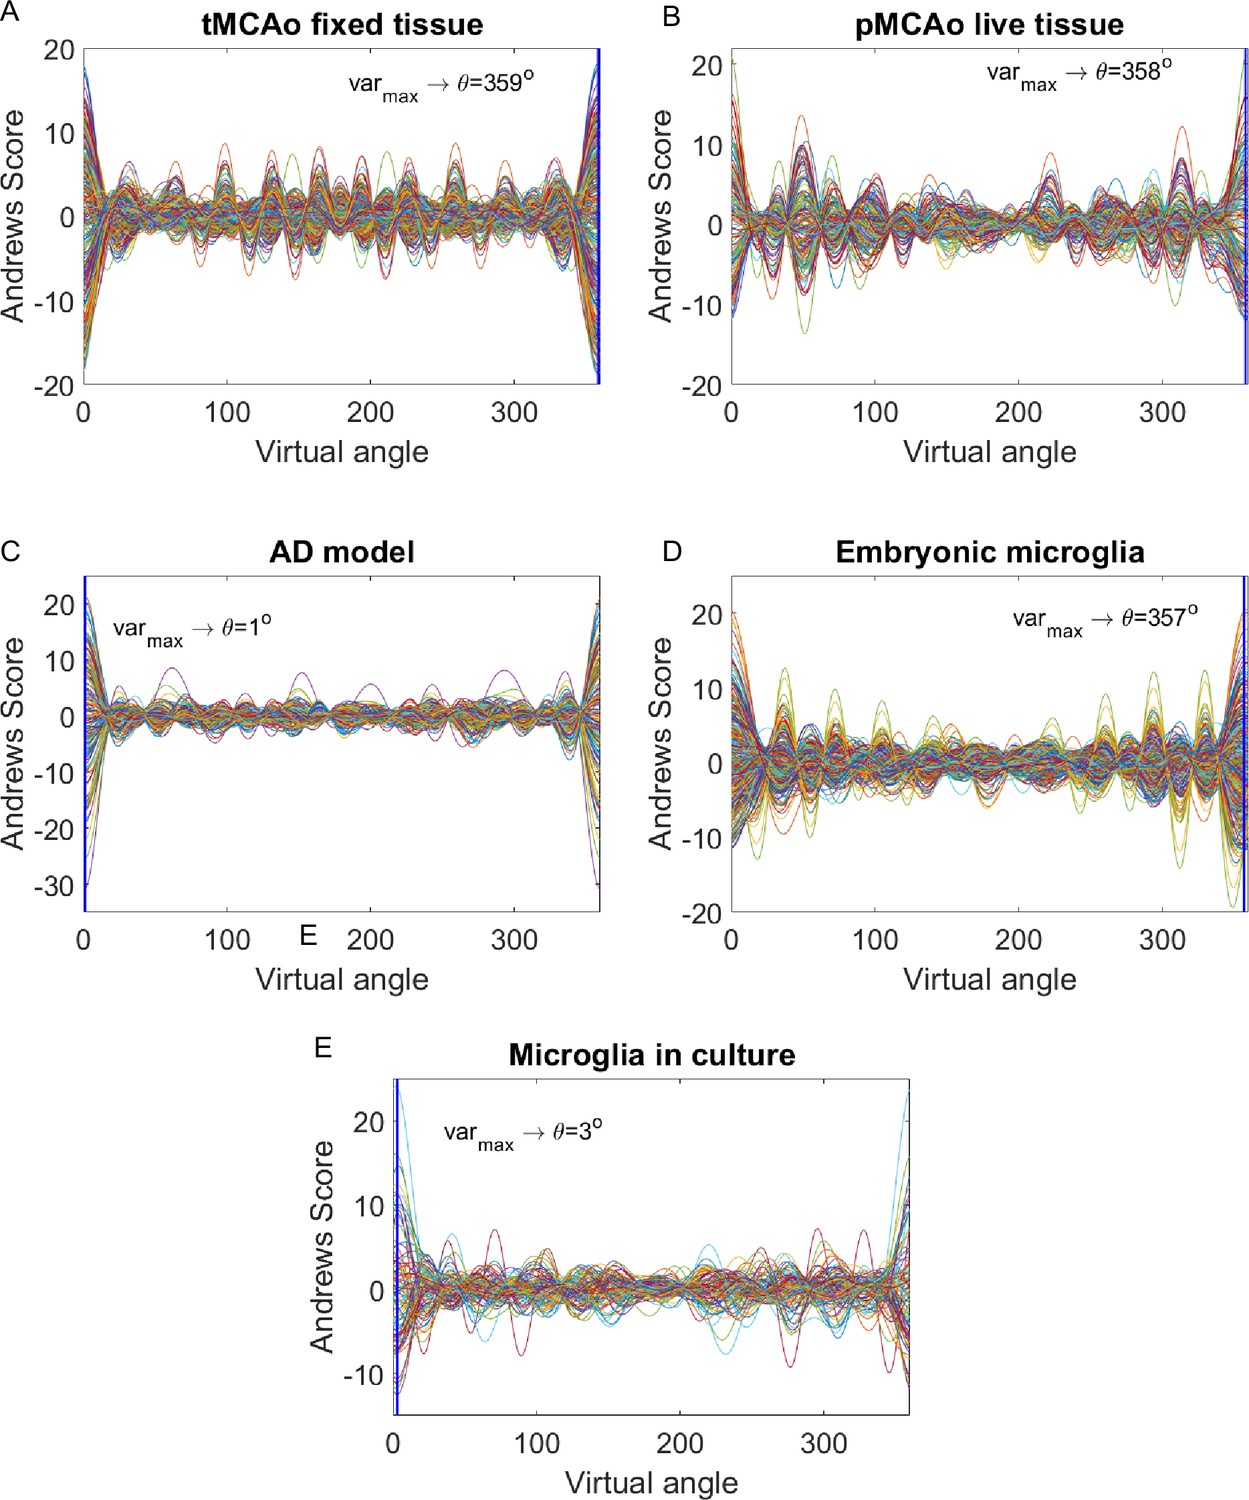
Andrews plots at a 0.8 threshold.
Andrews plots for the following datasets: temporary mean cerebral artery occlusion (tMCAo) on fixed tissue (A), permanent mean cerebral artery occlusion (pMCAo) on live tissue (B), Alzheimer’s disease (AD) model (C), embryonic microglia (D), and microglia in culture (E).
Figure 4—figure supplement 2
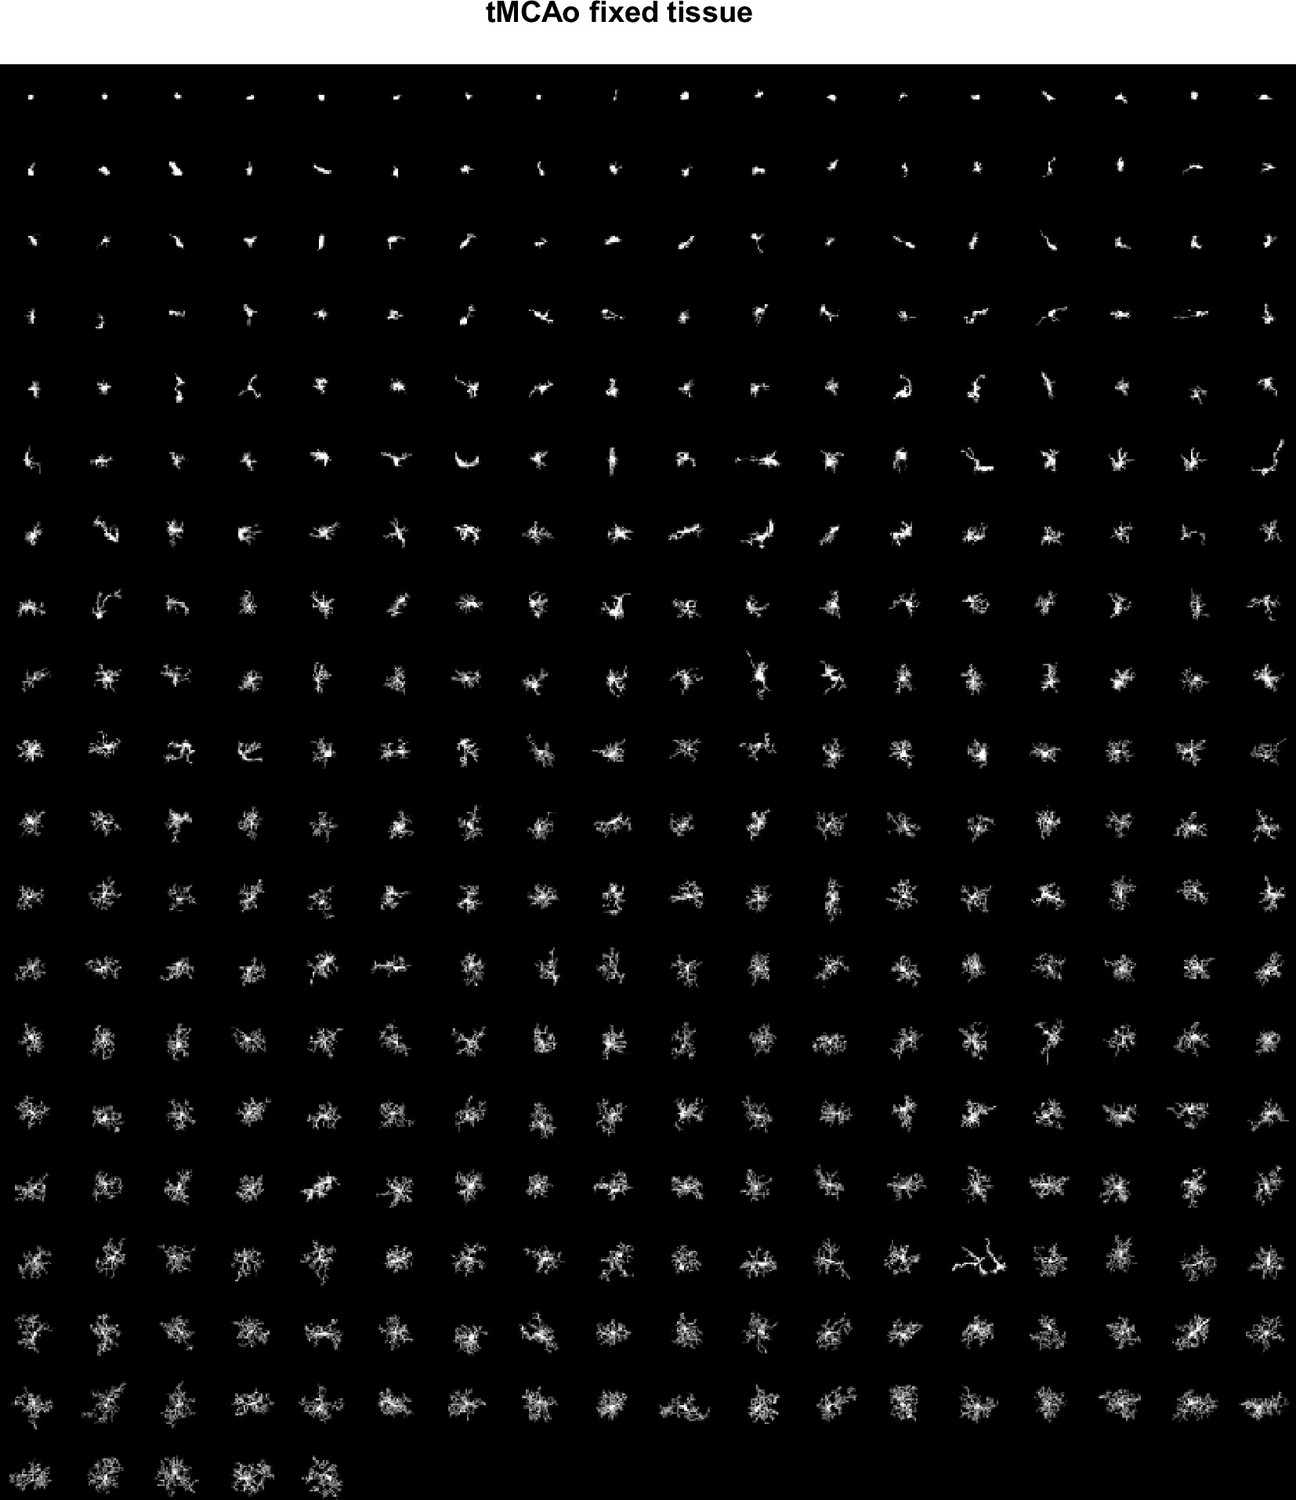
MorphoCellSorter rankings generated for temporary mean cerebral artery occlusion (tMCAo) datasets.
Ranking for the tMCAo fixed tissue data set at a 0.8 threshold, n=347 cells.
Figure 4—figure supplement 3
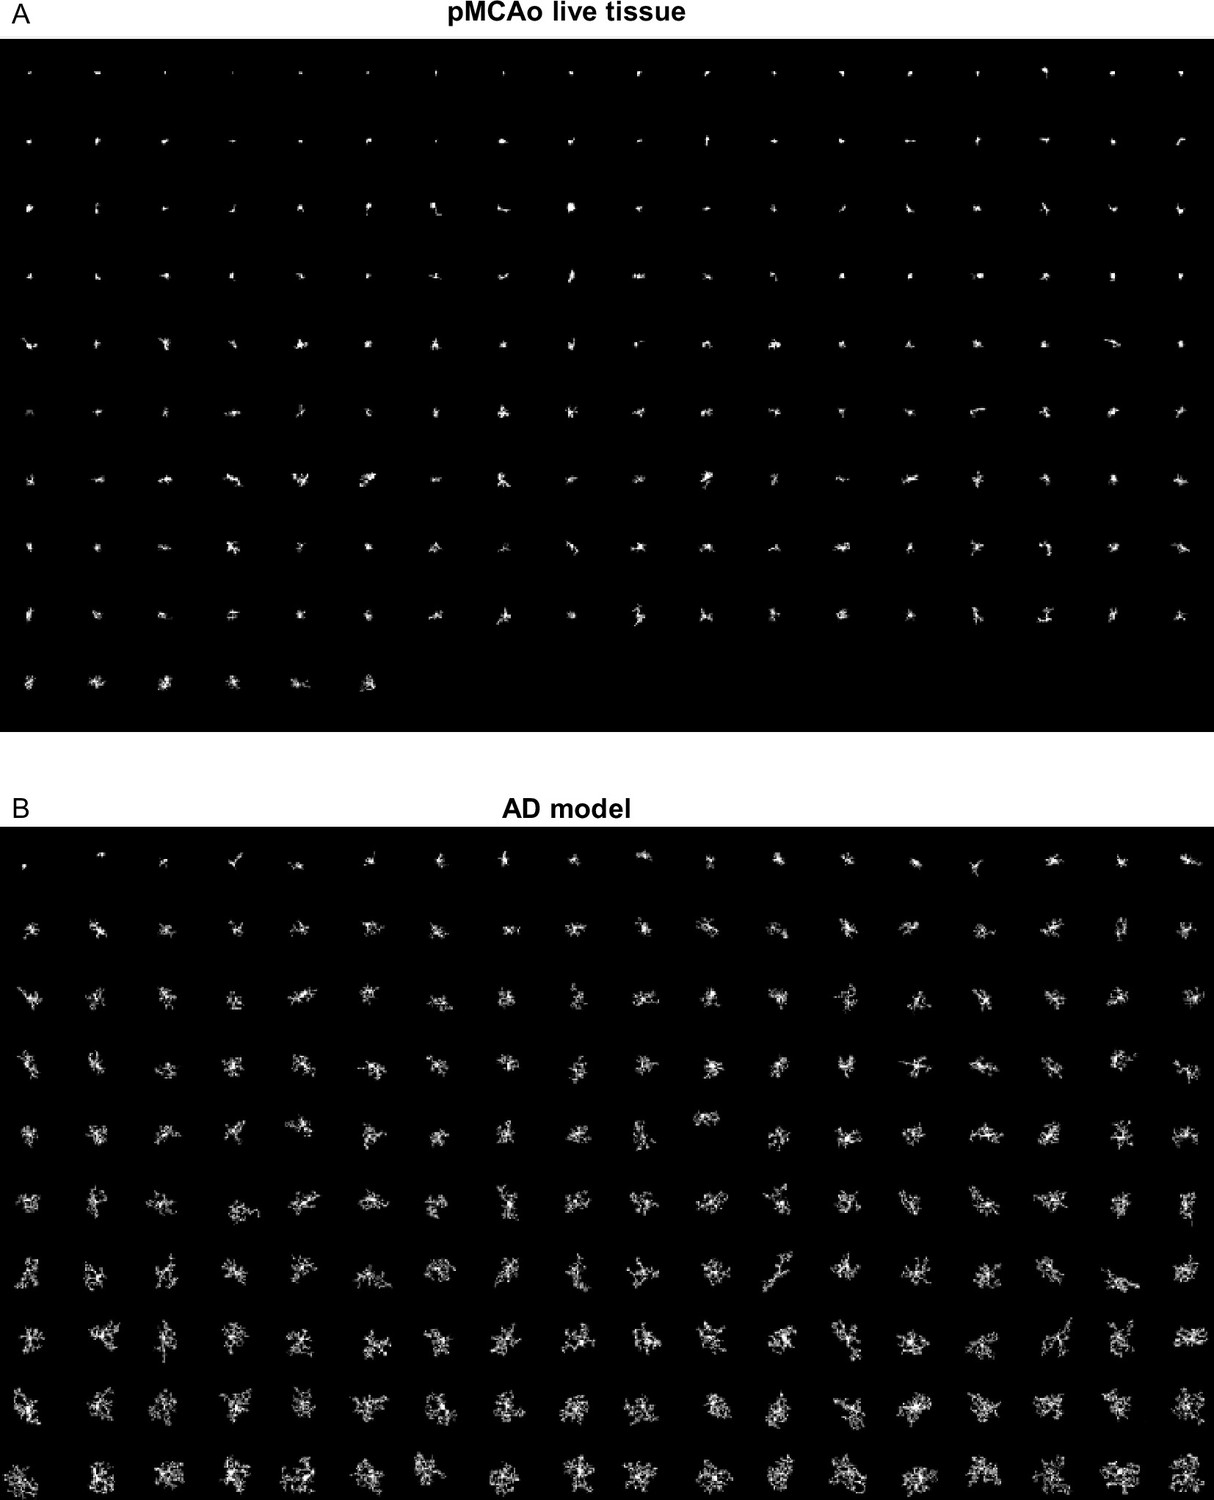
MorphoCellSorter rankings generated for permanent mean cerebral artery occlusion (pMCAo) and Alzheimer’s disease (AD) model datasets.
(A) Ranking for the pMCAo live tissue data set at a 0.8 threshold, n=168 cells. (B) Ranking for the AD model data set at a 0.8 threshold, n=180 cells.
Figure 4—figure supplement 4
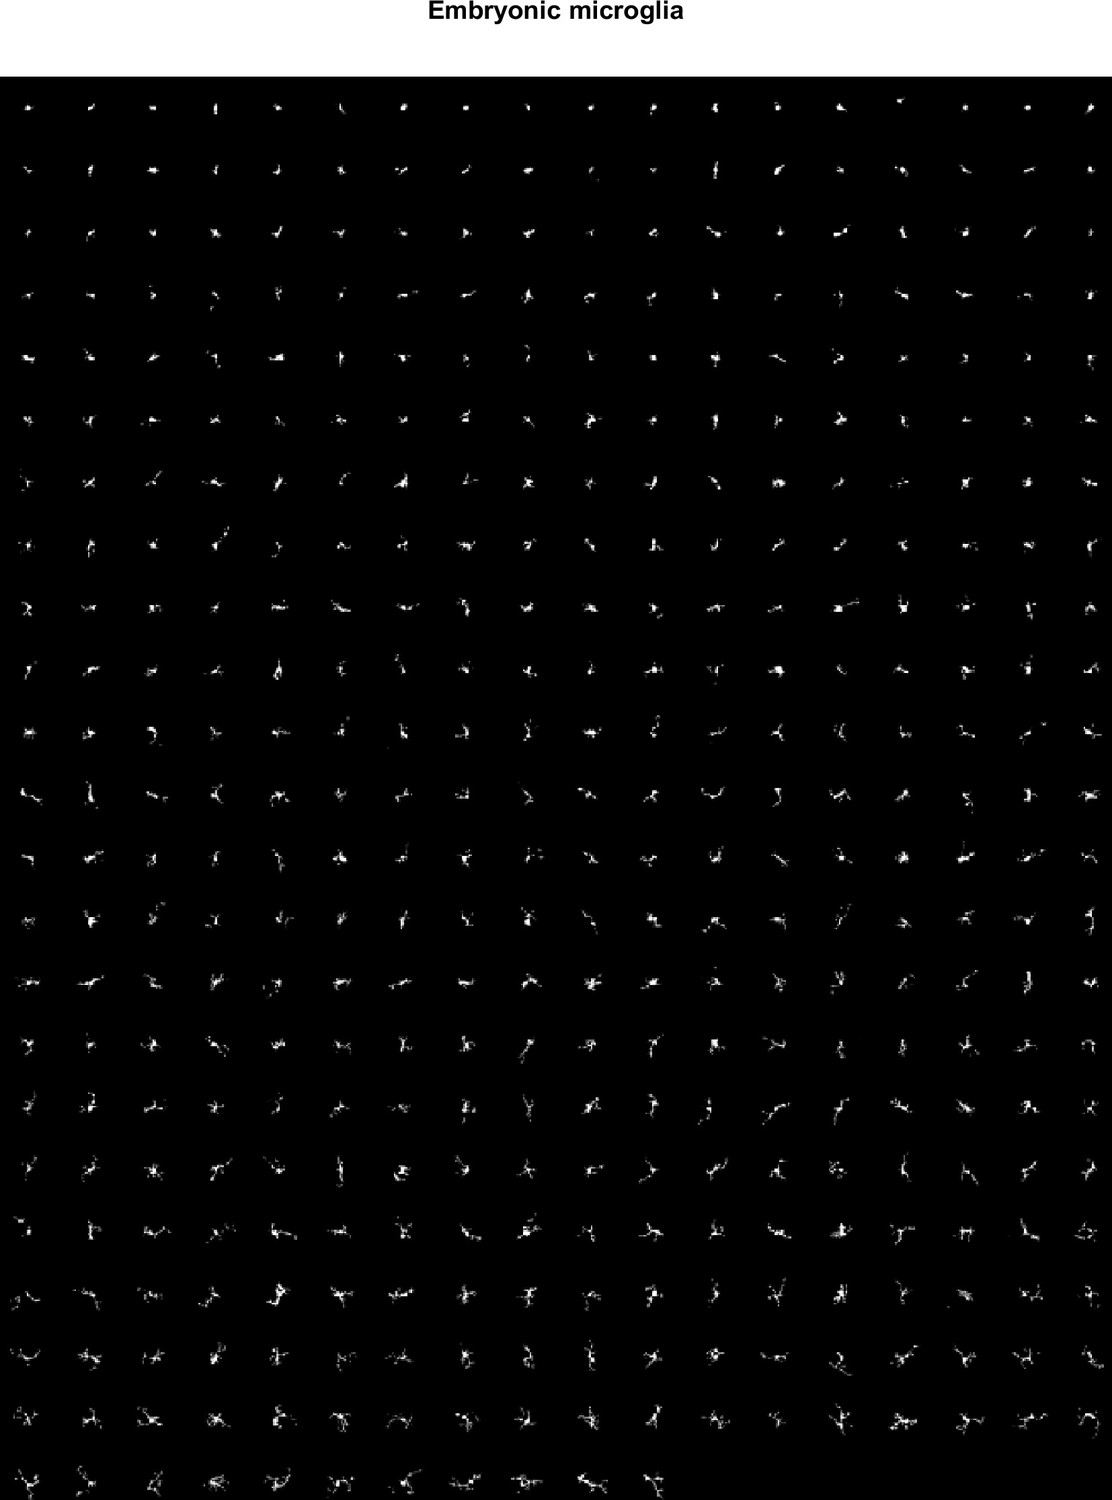
MorphoCellSorter rankings generated for embryonic datasets.
Ranking for the embryonic data set, at a 0.8 threshold, n=407 cells.
Figure 4—figure supplement 5
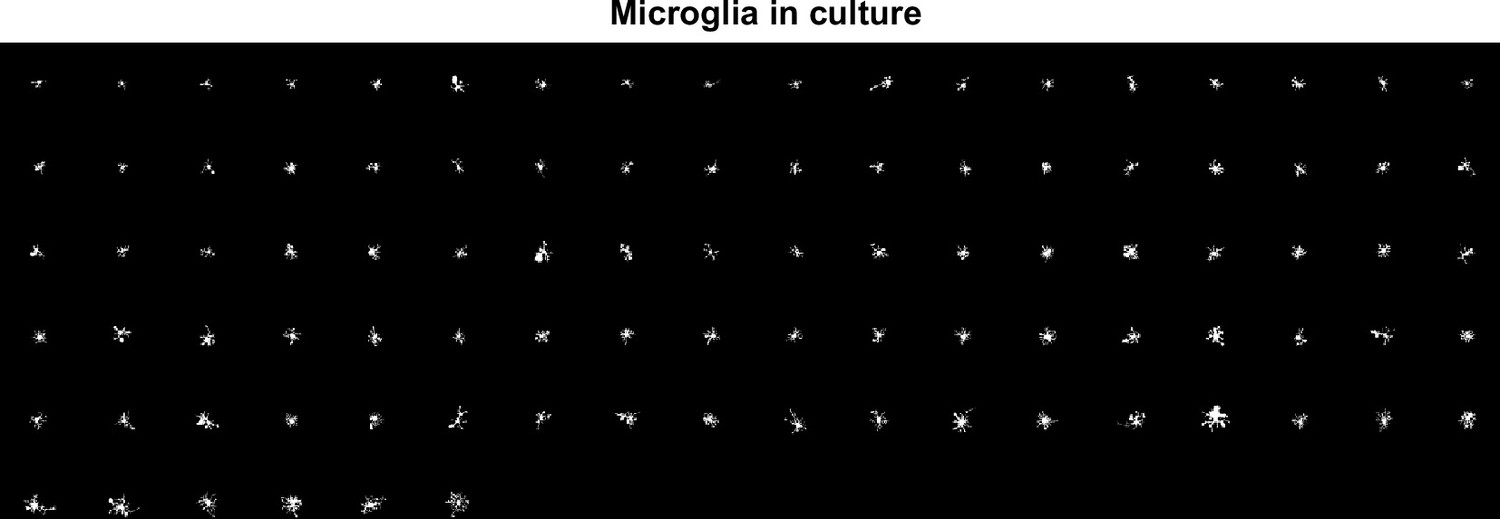
MorphoCellSorter rankings generated for microglia in culture.
Ranking for microglia in culture dataset at a 0.8 threshold, n=96 cells.
Figure 4—figure supplement 6
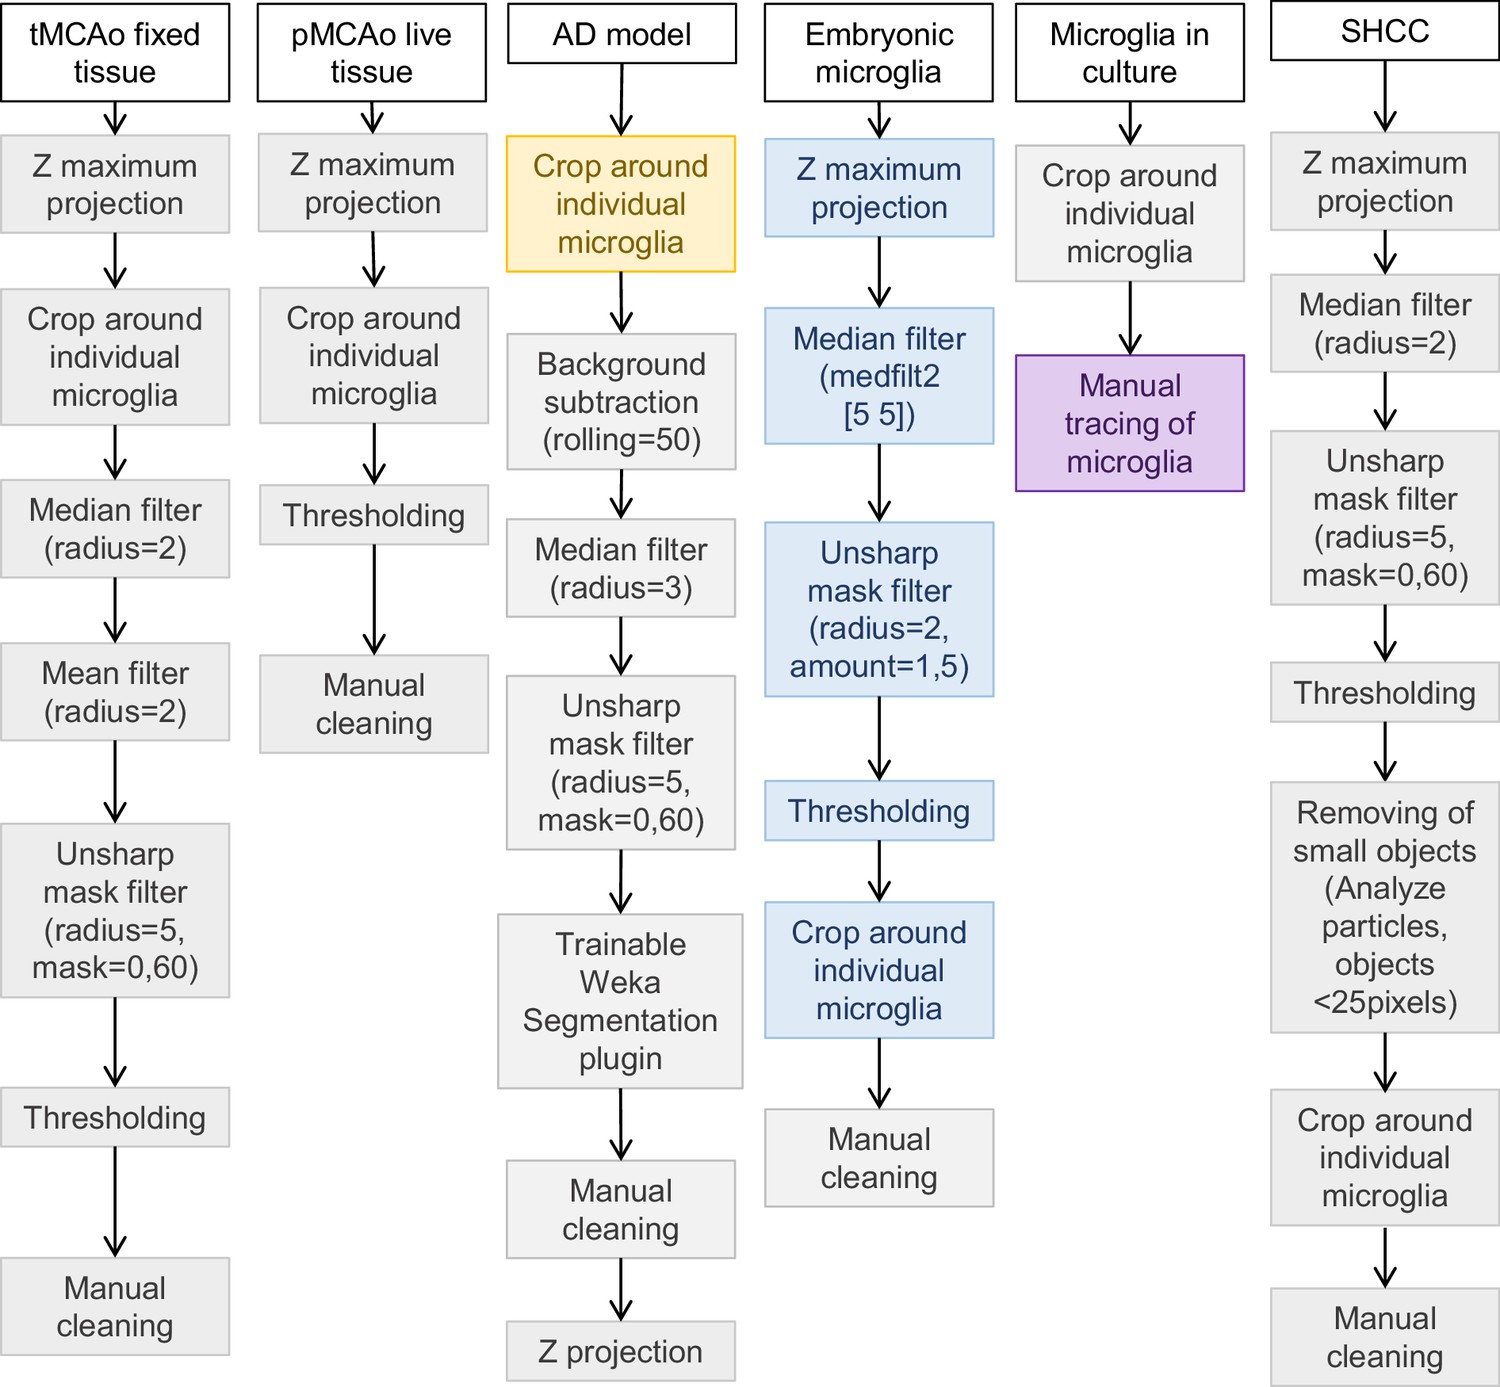
Pre-processing and segmentation procedure for all used datasets.
Steps in gray were performed on FIJI, blue on MATLAB, yellow on ZEISS ZEN, and purple on Procreate.
Figure 5 with 1 supplement
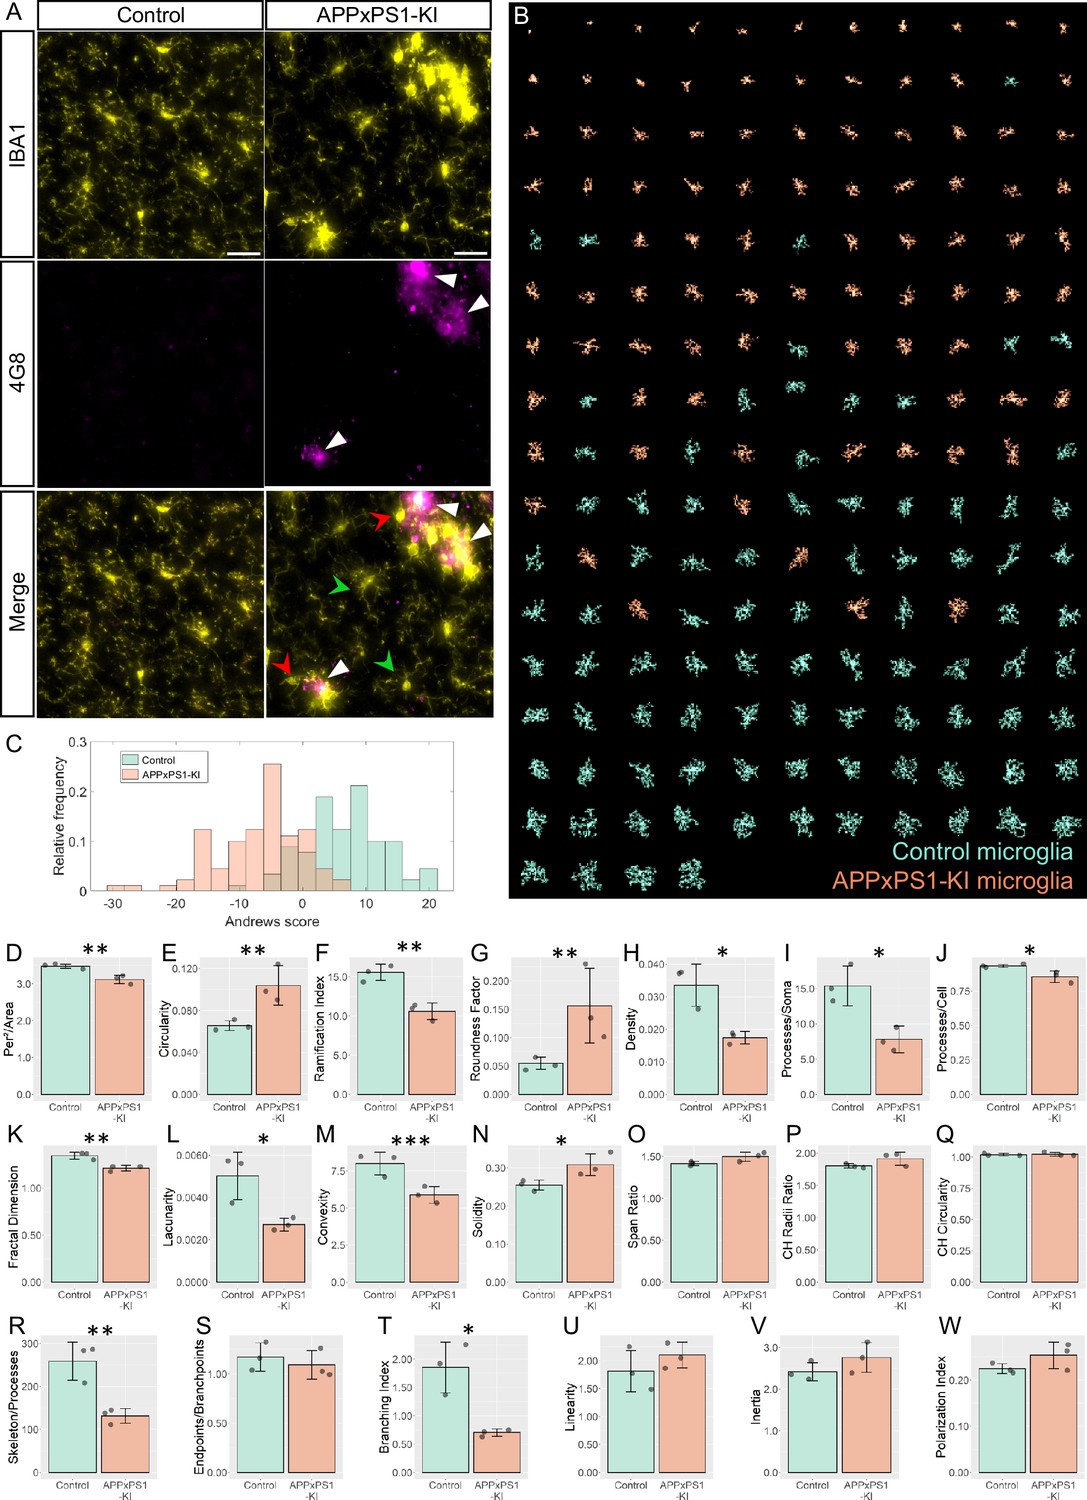
MorphoCellSorter identifies morphological alterations in the visual cortex of APPxPS1-KI mice.
(A) Z maximum projections of IBA1 (microglia) and 4G8 (Aβ plaques) stainings of control and APPxPS1-KI mice in the visual cortex. The white arrowheads point at Aβ plaques positive for 4G8, green arrowheads designate ramified microglia far from Aβ plaques, and red arrowheads point to highly morphologically altered microglia close to Aβ plaques. Scale bar: 20 µm. (B) MorphoCellSorter automated ranking. Control microglia are represented in green and APPxPS1-KI microglia in orange. (C) Distribution of the Andrews values at the maximum variance (Andrews scores) for control and APPxPS1-KI microglia. (D–W) Morphological indexes computed by MorphoCellSorter. The data shown are the mean ± standard deviation (std). Linear mixed models were applied when the application conditions were respected and Wilcoxon tests were performed otherwise (for the Span Ratio) (N=3 mice for each condition, nAPP-PS1xKI and nControl = 180). *p<0.05; **p<0.01; ***p<0.001.
-
Figure 5—source data 1
MorphocellSorter Data relative to experiments on the Alzheimer’s disease (AD) model.
- https://cdn.elifesciences.org/articles/101630/elife-101630-fig5-data1-v1.xlsx
-
Figure 5—source data 2
Data relative to the statistical analysis of the experiments related to the Alzheimer’s disease (AD) model.
- https://cdn.elifesciences.org/articles/101630/elife-101630-fig5-data2-v1.xlsx
Figure 5—figure supplement 1
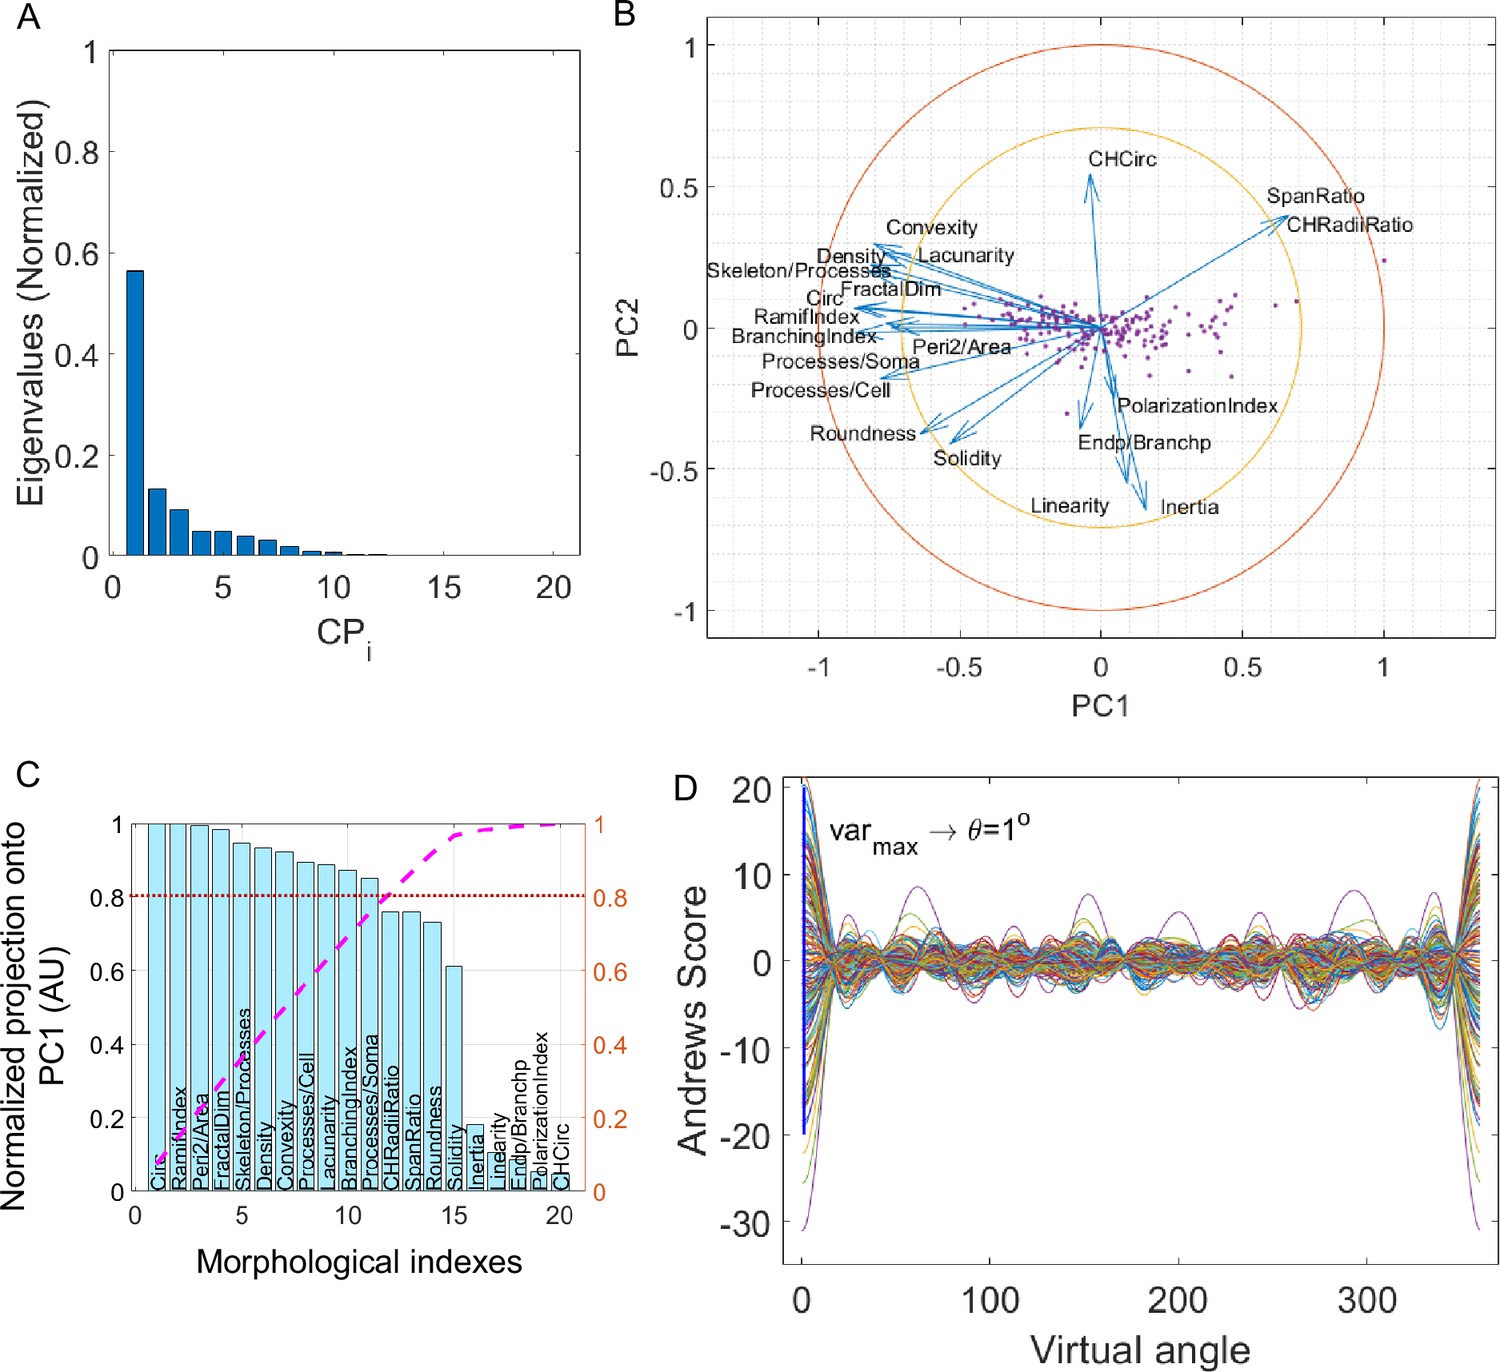
Elaboration of MorphoCellSorter ranking for the Alzheimer’s disease (AD) dataset.
(A) Cascade of normalized eigenvalues. (B) Correlation circle in the first principal component (PC1) and PC2 planes. (C) Parameters ranked according to their projection on PC1. Values are normalized by the highest projection value. To determine the number of morphological parameters selected, we selected a threshold of 0.8 (red line), and thus 11 kept parameters. (D) Andrews plots generated with the 11 parameters weighted according to their contribution onto PC1. Each curve represents one microglia in the high-dimensional space of the selected parameters’ projections onto PC1. The maximum variance between curves is obtained at 1°.
Figure 6 with 2 supplements

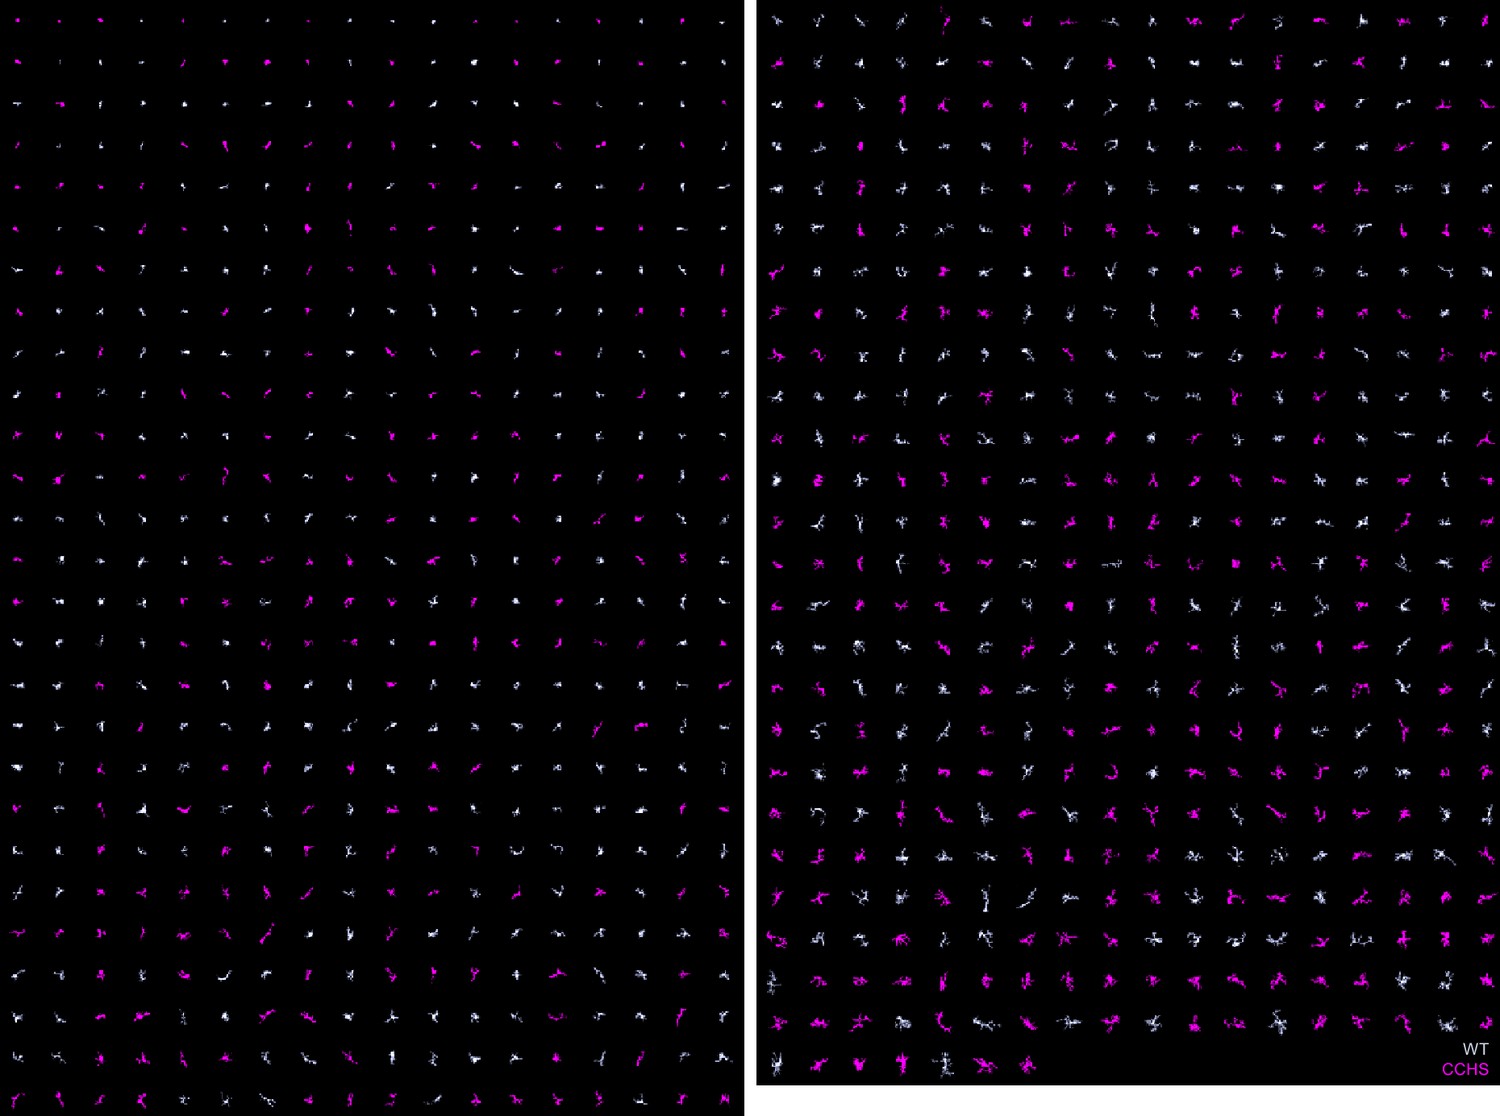
Accurate sorting of embryonic microglia reveals no morphological difference between central congenital hypoventilation syndrome (CCHS) and wild-type (WT) embryos’ microglia.
(A) IBA1 stainings in WT and CCHS embryos’ brainstems. (B) MorphoCellSorter automated ranking. WT microglia are displayed in light purple and mutated microglia are represented in pink. Only every 3 microglia composing the dataset are displayed for readability purposes. (C) Distribution of the Andrews scores for CCHS and WT microglia. (D–W) Morphological indexes computed by MorphoCellSorter. The data’s distribution is represented as well as the mean ± standard deviation (std). Linear mixed models were applied (NWT = 5, Nmutant = 4; nWT = 498 and nmutant = 444).
-
Figure 6—source data 1
MorphoCellSorter data relative to experiments on embryonic microglia.
- https://cdn.elifesciences.org/articles/101630/elife-101630-fig6-data1-v1.xlsx
-
Figure 6—source data 2
Data relative to the statistical analysis of the experiments related to embryonic microglia.
- https://cdn.elifesciences.org/articles/101630/elife-101630-fig6-data2-v1.xlsx
Figure 6—figure supplement 1
Elaboration of MorphoCellSorter ranking for the central congenital hypoventilation syndrome (CCHS) dataset.
(A) Cascade of normalized eigenvalues. (B) Correlation circle in the first principal component (PC1) and PC2 planes. (C) Parameters ranked according to their projection on PC1. Values are normalized by the highest projection value. To determine the number of morphological parameters selected, here we used a threshold of 0.8 (red line), and thus 12 kept parameters. (D) Andrews plots generated with the 12 parameters weighted according to their contribution onto PC1. Each curve represents one microglia in the high-dimensional space of the selected parameters. The maximum variance between curves is obtained at 359°.
Figure 6—figure supplement 2
MorphoCellSorter automated ranking of the central congenital hypoventilation syndrome (CCHS) dataset.
Wild-type (WT) microglia are displayed in light purple and mutated microglia are represented in pink.
Author response image 1
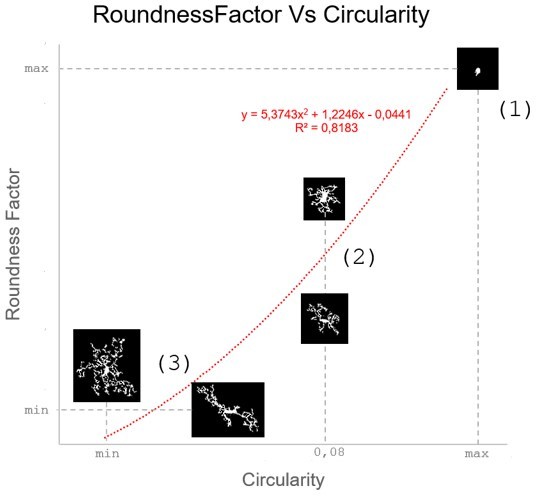
Correlation between Circularity and Roundness Factor in the Alzheimer disease dataset.
A second order polynomial correlation exists between the two parameters in our dataset. Indeed (1) a single maximum is shared between both parameters. However, Circularity and Roundness Factor are not entirely redundant, as examplified by (2) the possible variety of Roundness Factors for a given Circularity as well as (3) the very different morphology minima of these two parameters.
Tables
Table 1
Evaluation of MorphoCellSorter rankings on highly heterogeneous datasets of microglia.
The evaluation of the rankings is conducted by comparing the Spearman’s correlation coefficients. w: weeks, m: months, E: embryonic day, P: postnatal day, DIV: day in vitro, Ex: expert.
| Model | tMCAo fixed tissue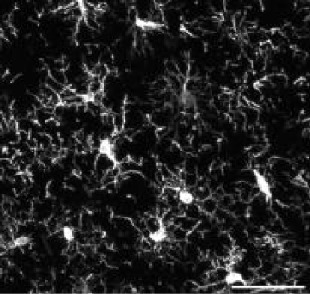 | pMCAo live tissue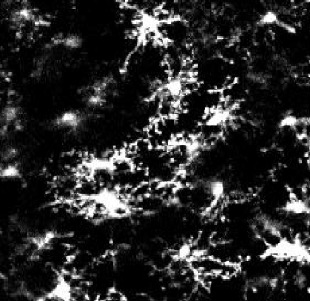 | AD model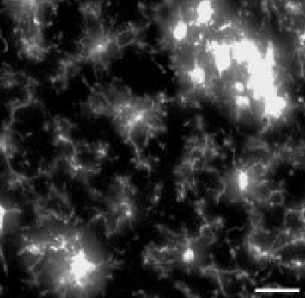 | Embryonic microglia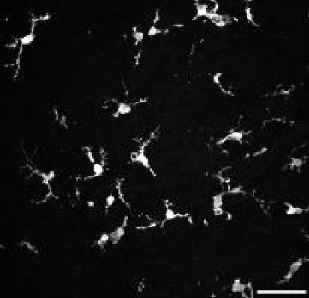 | Microglia in culture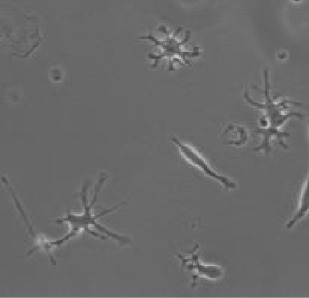 | ||||||
|---|---|---|---|---|---|---|---|---|---|---|---|
| Datasets’ characteristics | |||||||||||
| Animals | Male rat 7 w. | Male mice 8–12 w. | Female mice 5 m. | Mice embryos E18.5 | Mice pups P10 (DIV4-10) | ||||||
| Collected signal | IBA1 immuno-fluorescent staining | Endogenous fluorescence CX3CR1GFP/+ | IBA1 immuno-fluorescent staining | IBA1 immuno-fluorescent staining | Brightfield | ||||||
| Imaging technique | Confocal (40 X) | Two-photon (20 X) | Widefield (20 X) | Confocal (40 X) | BioStation (40 X) | ||||||
| Fixed/live tissue | Fixed tissue | Live tissue | Fixed tissue | Fixed tissue | Live tissue | ||||||
| Number of cells | n=347 | n=168 | n=180 | n=407 | n=96 | ||||||
| Evaluation of MorphoCellSorter rankings Correlation with manual rankings | |||||||||||
| Expert | Ex 1 | Ex 2 | Ex 1 | Ex 2 | Ex 1 | Ex 2 | Ex 1 | Ex 2 | Ex 1 | Ex 2 | |
| Thresholds | 0.2 | 0.965 | 0.958 | 0.945 | 0.945 | 0.952 | 0.934 | 0.914 | 0.885 | 0.854 | 0.749 |
| 0.3 | 0.964 | 0.954 | 0.944 | 9.946 | 0.953 | 0.942 | 0.914 | 0.885 | 0.854 | 0.749 | |
| 0.4 | 0.964 | 0.964 | 0.935 | 0.938 | 0.949 | 0.947 | 0.929 | 0.909 | 0.845 | 0.744 | |
| 0.5 | 0.96 | 0.972 | 0.938 | 0.939 | 0.943 | 0.945 | 0.927 | 0.907 | 0.877 | 0.837 | |
| 0.6 | 0.959 | 0.968 | 0.944 | 0.941 | 0.95 | 0.944 | 0.918 | 0.889 | 0.869 | 0.869 | |
| 0.7 | 0.954 | 0.969 | 0.943 | 0.938 | 0.947 | 0.947 | 0.926 | 0.914 | 0.865 | 0.859 | |
| 0.8 | 0.954 | 0.967 | 0.94 | 0.937 | 0.952 | 0.943 | 0.926 | 0.917 | 0.848 | 0.91 | |
| 0.9 | 0.95 | 0.959 | 0.929 | 0.929 | 0.95 | 0.944 | 0.922 | 0.92 | 0.851 | 0.91 | |
| 1 | 0.95 | 0.959 | 0.922 | 0.923 | 0.954 | 0.946 | 0.913 | 0.923 | 0.846 | 0.906 | |
| Ex 1 vs Ex 2 | 0.935 | 0.946 | 0.892 | 0.912 | 0.76 | ||||||
-
Table 1—source data 1
Data used to determine the optimal threshold.
EM: Embryonic microglia, MC: Microglia in culture.
- https://cdn.elifesciences.org/articles/101630/elife-101630-table1-data1-v1.xlsx
Additional files
Download links
A two-part list of links to download the article, or parts of the article, in various formats.
Downloads (link to download the article as PDF)
Open citations (links to open the citations from this article in various online reference manager services)
Cite this article (links to download the citations from this article in formats compatible with various reference manager tools)
MorphoCellSorter is an Andrews plot-based sorting approach to rank microglia according to their morphological features
eLife 13:RP101630.
https://doi.org/10.7554/eLife.101630.3


