Responses to membrane potential-modulating ionic solutions measured by magnetic resonance imaging of cultured cells and in vivo rat cortex
- Department of Electrical and Computer Engineering, Seoul National University, Republic of Korea
- Department of Physiology, Sungkyunkwan University School of Medicine, Republic of Korea
- Department of Biomedical Engineering, Sungkyunkwan University, Republic of Korea
- Department of Intelligent Precision Healthcare Convergence, Sungkyunkwan University, Republic of Korea
- National Cancer Center, Republic of Korea
Figures
Figure 1
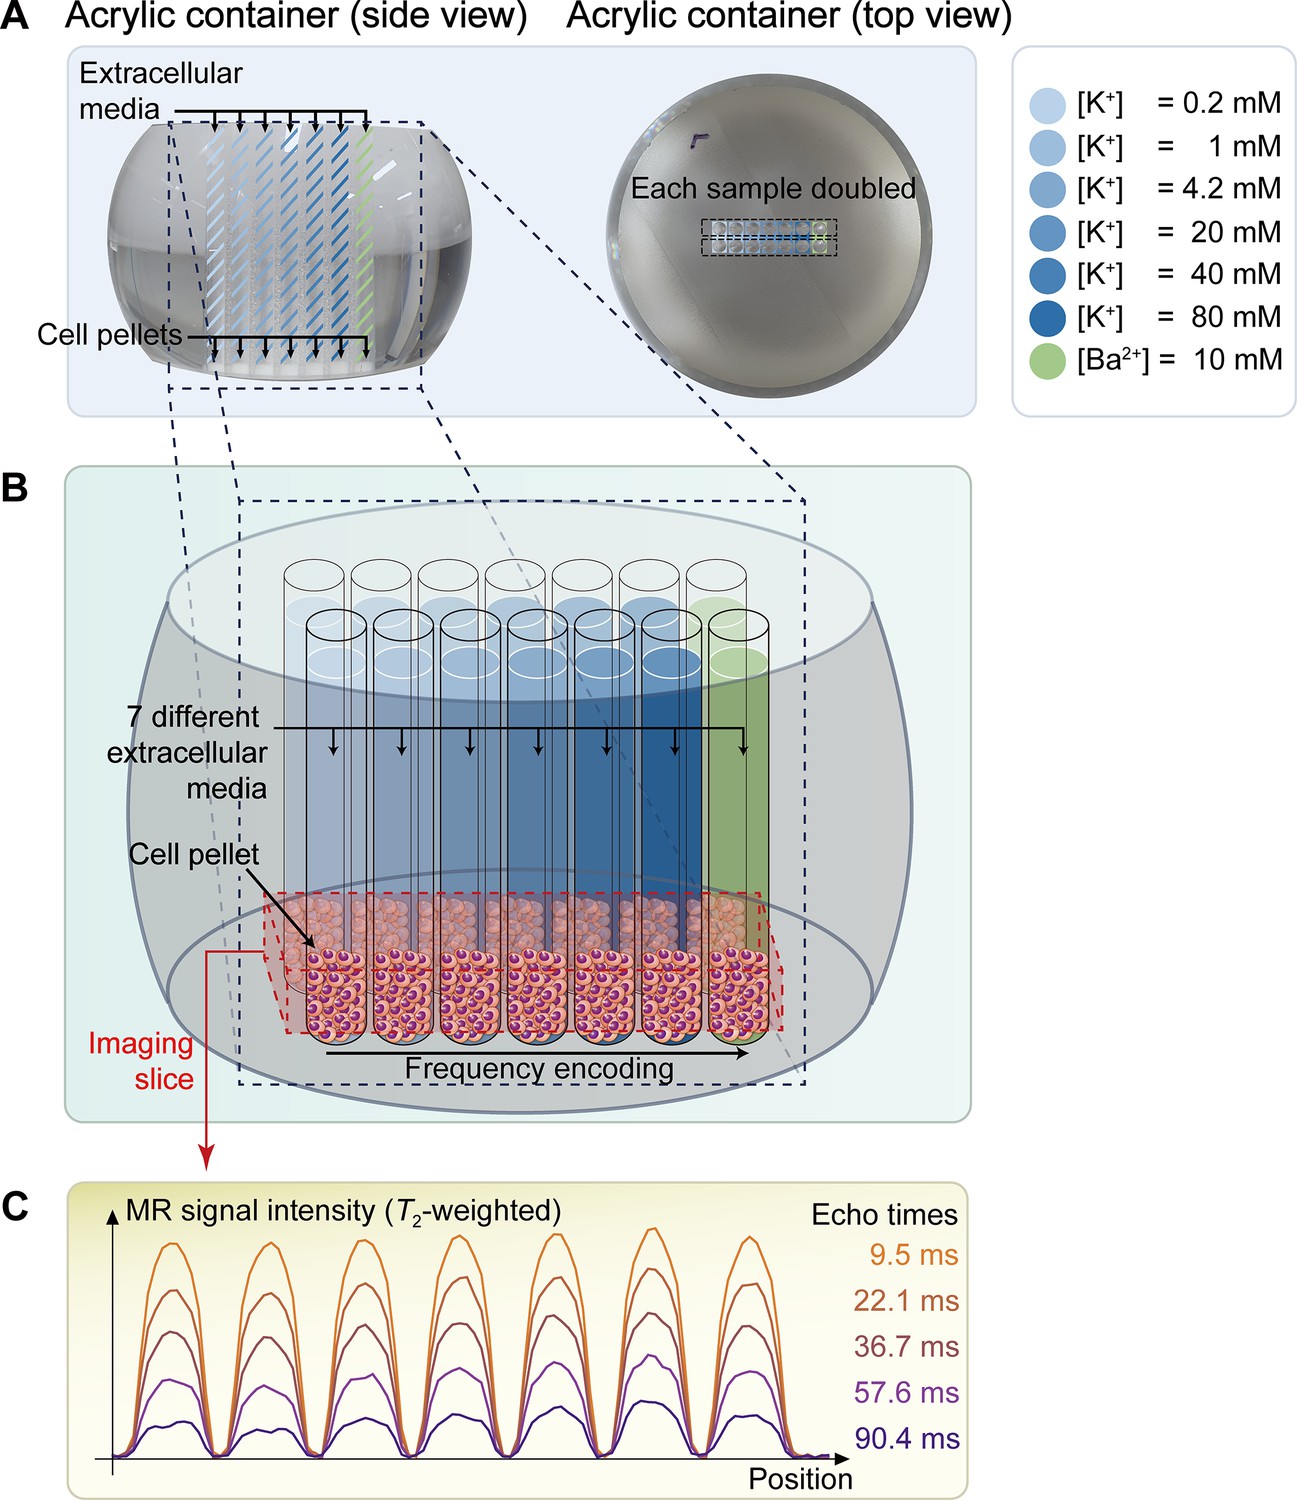
The schematic diagram of the in vitro experiment.
(A) The picture on the left displays a side view of a double-sided cut spherical acrylic container with fabricated wells filled with extracellular media and cell pellets. As depicted in the top-view picture on the right, fourteen wells (matrix = 2 × 7) were created on the acrylic container, allowing each of the seven samples with six different K+ concentrations ([K+]=0.2–80 mM) and one Ba2+ concentration ([Ba2+]=10 mM) to be doubled in the same column for improved signal-to-noise ratio (SNR) in MR signal acquisition. (B) The image illustrates the configuration after loading cells into the wells and pelleting them at the bottom of the wells. The imaging slice was positioned 0.5 mm below the pellet-media interface to acquire signals predominantly from the cell pellets. (C) Representative one-dimensional T2-weighted MR signals with 5 selected echo times out of a total of 50 acquired echo times.
Figure 2
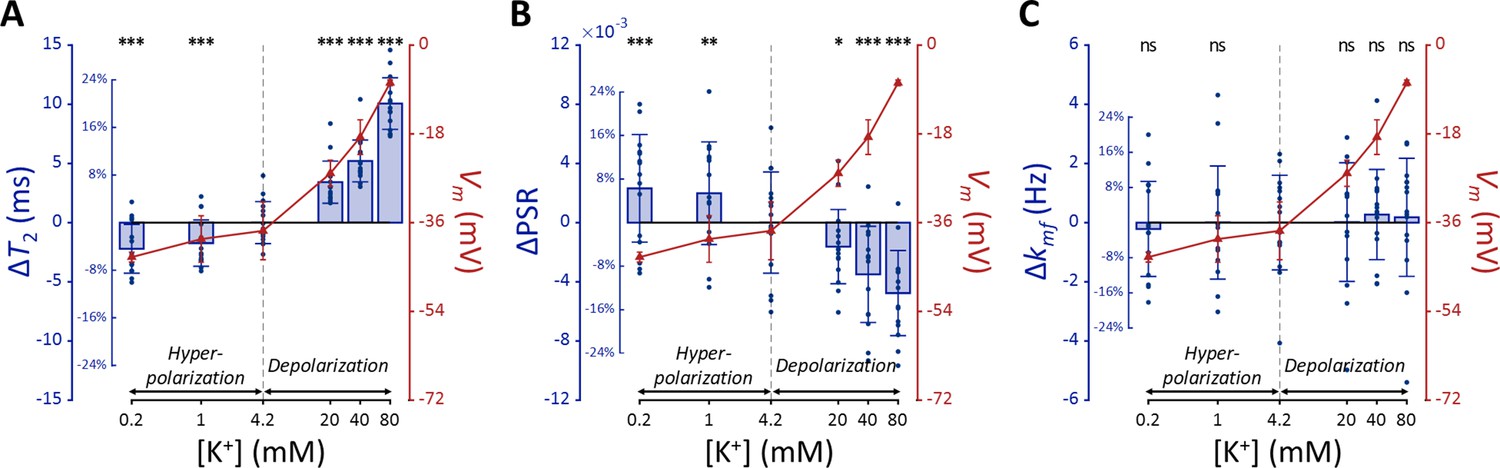
MR parameters and membrane potential (Vm) of SH-SY5Y cells versus extracellular K+ concentrations ([K+]).
Changes in (A) T2, (B) PSR, and (C) kmf are displayed with blue bars (n=15). Membrane potentials are plotted with red triangles (n=3). The abscissa is in logarithmic scale. Error bars denote standard deviation. Statistical significance of changes in MR parameters is marked with asterisks (ns: p>0.05, *: p<0.05, **: p<0.01, ***: p<0.001).
Figure 3
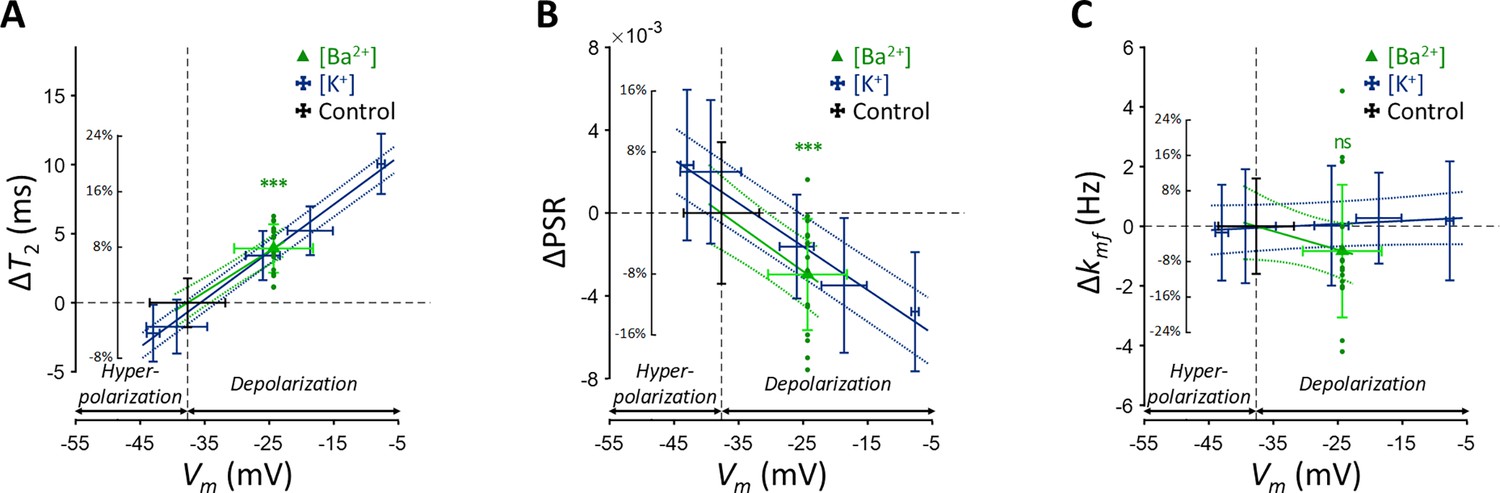
Changes in (A) T2, (B) PSR, and (C) kmf of SH-SY5Y cells across experimental conditions: [K+]=0.2–80 mM (blue cross) and [Ba2+]=10 mM (green triangle), compared to the control condition (black cross).
Data from fifteen experiments (n=15) are displayed. Linear regression lines for [K+] data (blue solid line) and [Ba2+] data (green solid line) are drawn along with dotted lines representing 95% confidence intervals. Error bars denote standard deviation. Statistical significance of changes in MR parameters with [Ba2+]=10 mM is marked with asterisks (ns: p>0.05, *: p<0.05, **: p<0.01, ***: p<0.001).
Figure 4
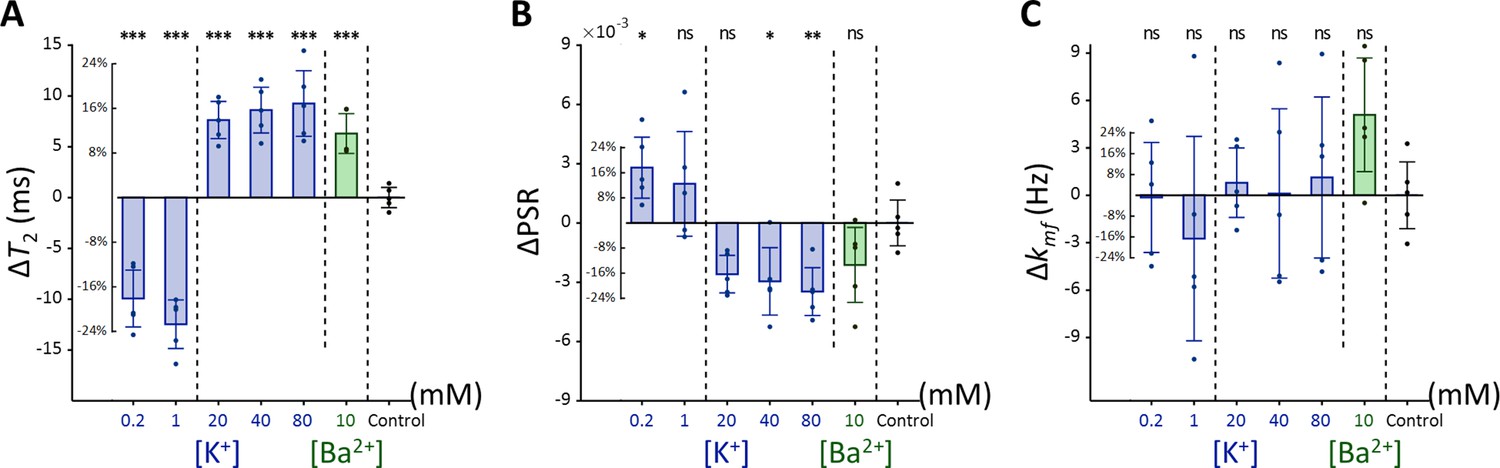
Changes in (A) T2, (B) PSR, and (C) kmf of Jurkat cells across experimental conditions: [K+]=0.2–80 mM (blue bar) and [Ba2+]=10 mM (green bar), compared to the control condition of [K+]=4.2 mM (n=5).
Error bars denote standard deviation. Statistical significance of changes in MR parameters is marked with asterisks (ns: p>0.05, *: p<0.05, **: p<0.01, ***: p<0.001).
Figure 5
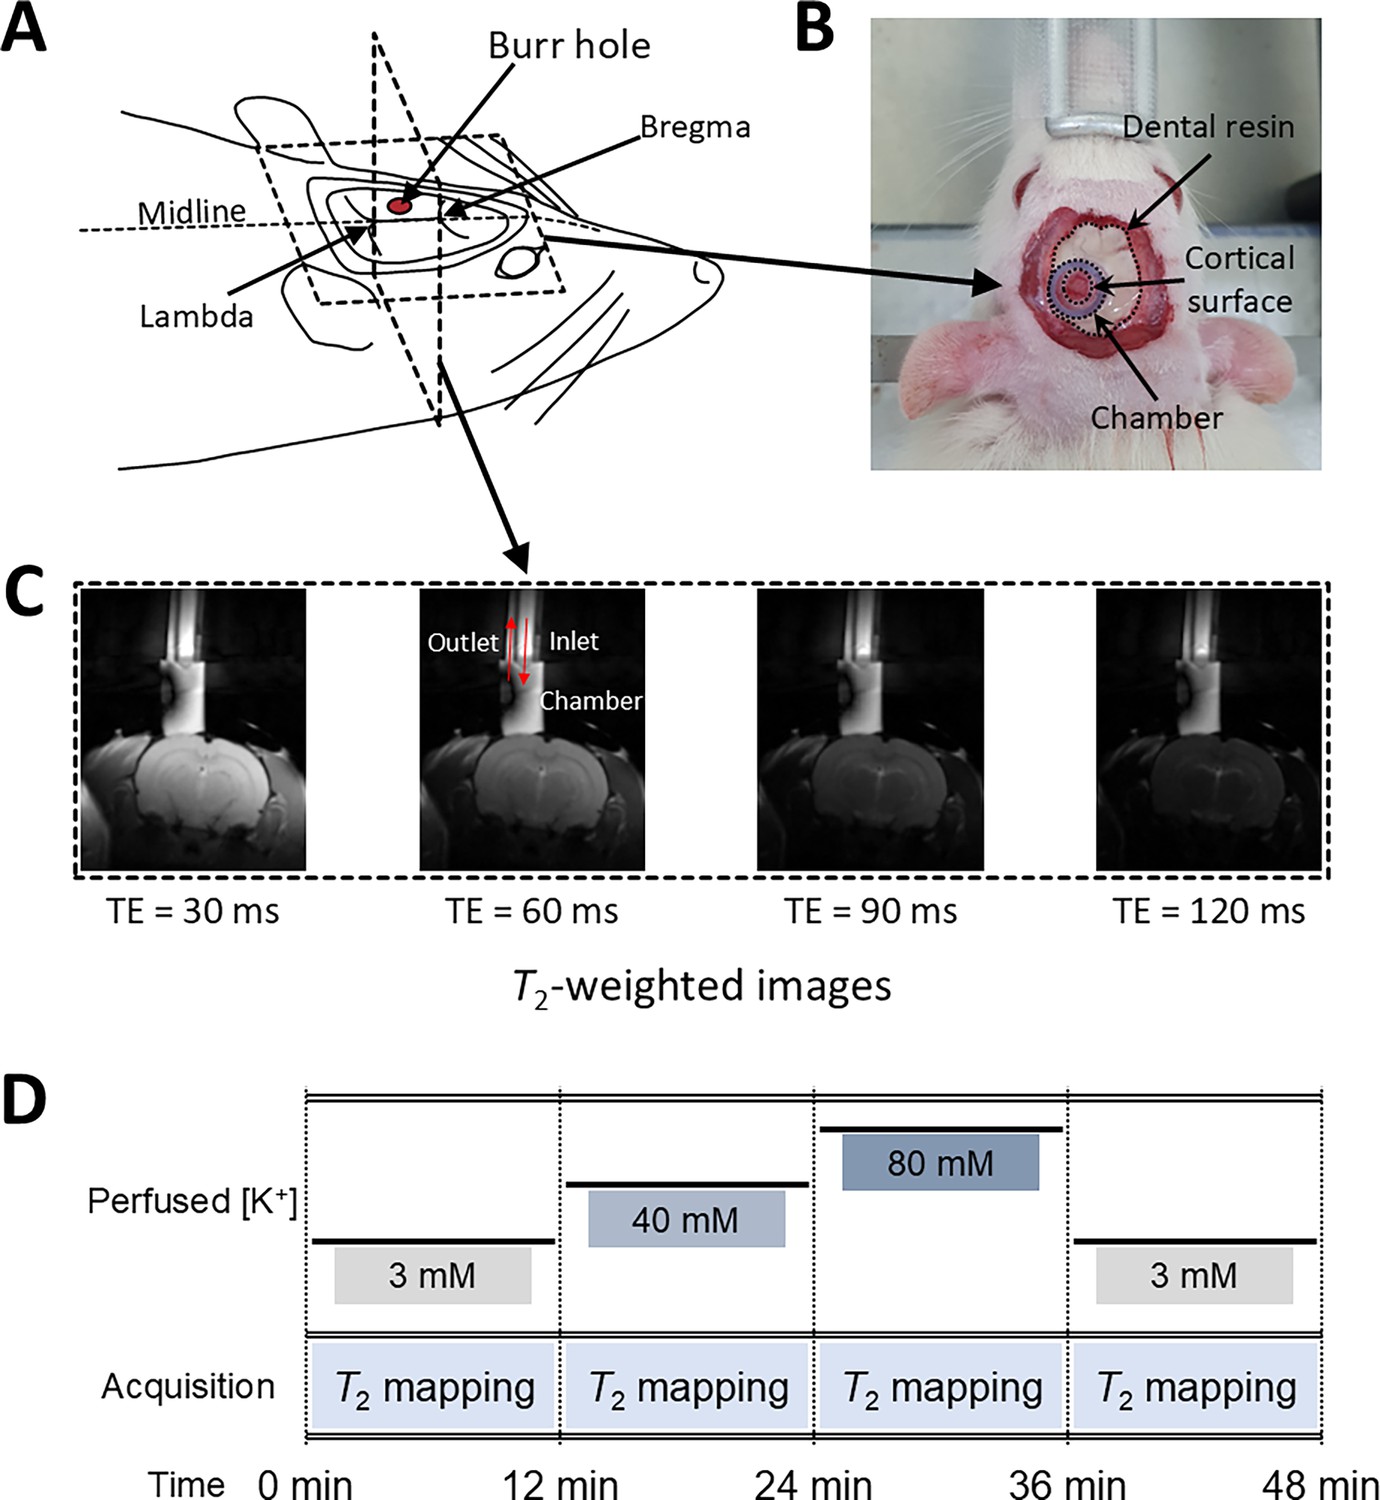
Experimental setup for in vivo manipulation of membrane potential.
(A) A schematic diagram of the rat head post-craniotomy, showing the burr hole centered at 2.5 mm anterior and 2.0 mm lateral to the lambda. (B) Photograph of the rat head with a cylindrical chamber fixed over the burr hole, filled with artificial cerebrospinal fluid. (C) A representative series of T2-weighted MR images for T2 mapping. The chamber was connected to inlet and outlet perfusion tubes. (D) The experimental paradigm of the in vivo rat MR imaging. Four conditions were sequentially applied: control, depolarization, further depolarization, and recovery. Each condition lasted 12 min during which T2 mapping was conducted.
Figure 6
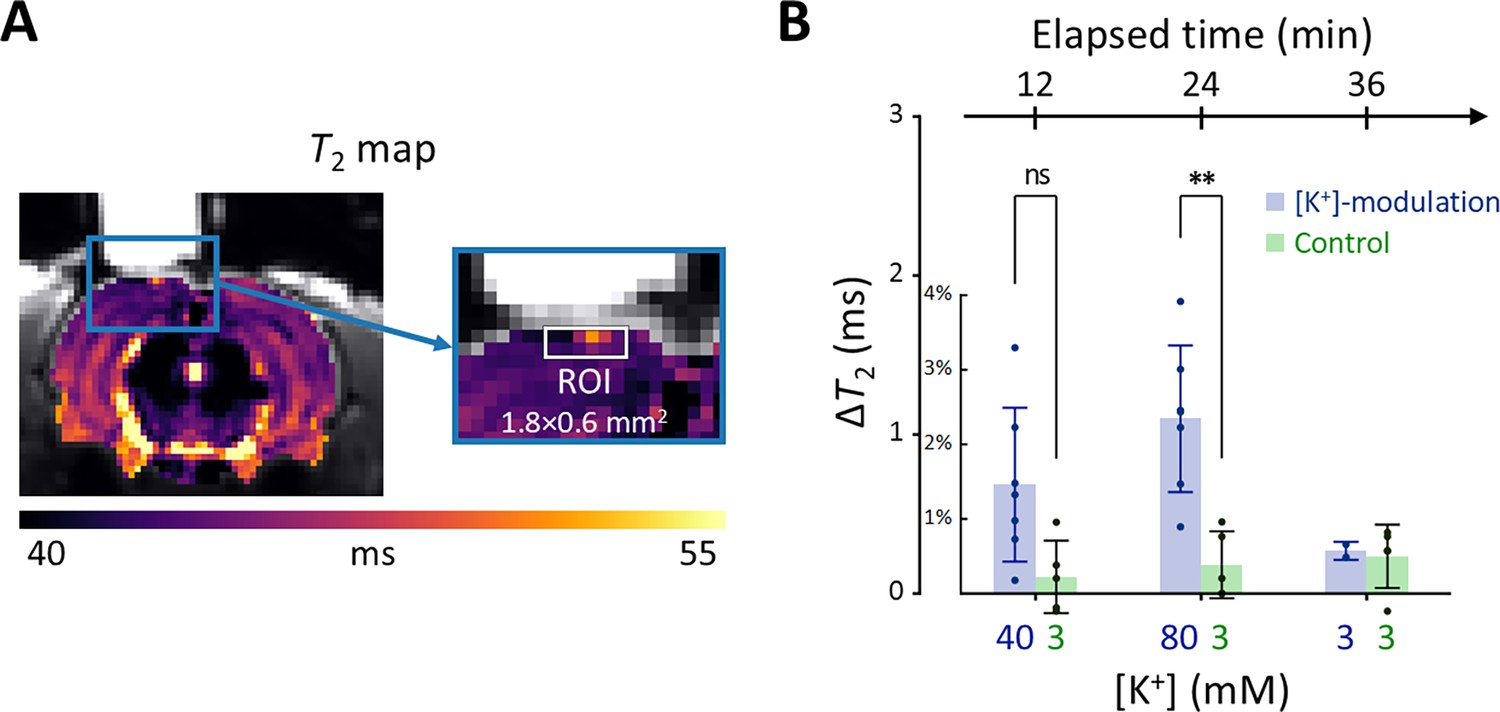
Results of the in vivo experiment results in rat models.
(A) A representative T2 map from a single rat with an enlarged image depicting the ROI for estimating average T2 in the exposed cortical area, marked by a white rectangle (width = 1.8 mm, depth = 0.6 mm). (B) The changes in T2 values within the ROI is plotted against elapsed time from the initial conditions. [K+] in the perfused artificial cerebrospinal fluid are indicated on the bottom abscissa. Results from the [K+]-modulation experiments are shown with blue bars, and those from the control experiments are shown with green bars. Statistical significance of the T2 changes is marked with asterisks (ns: p > 0.05, *: p < 0.05, **: p< 0.01).
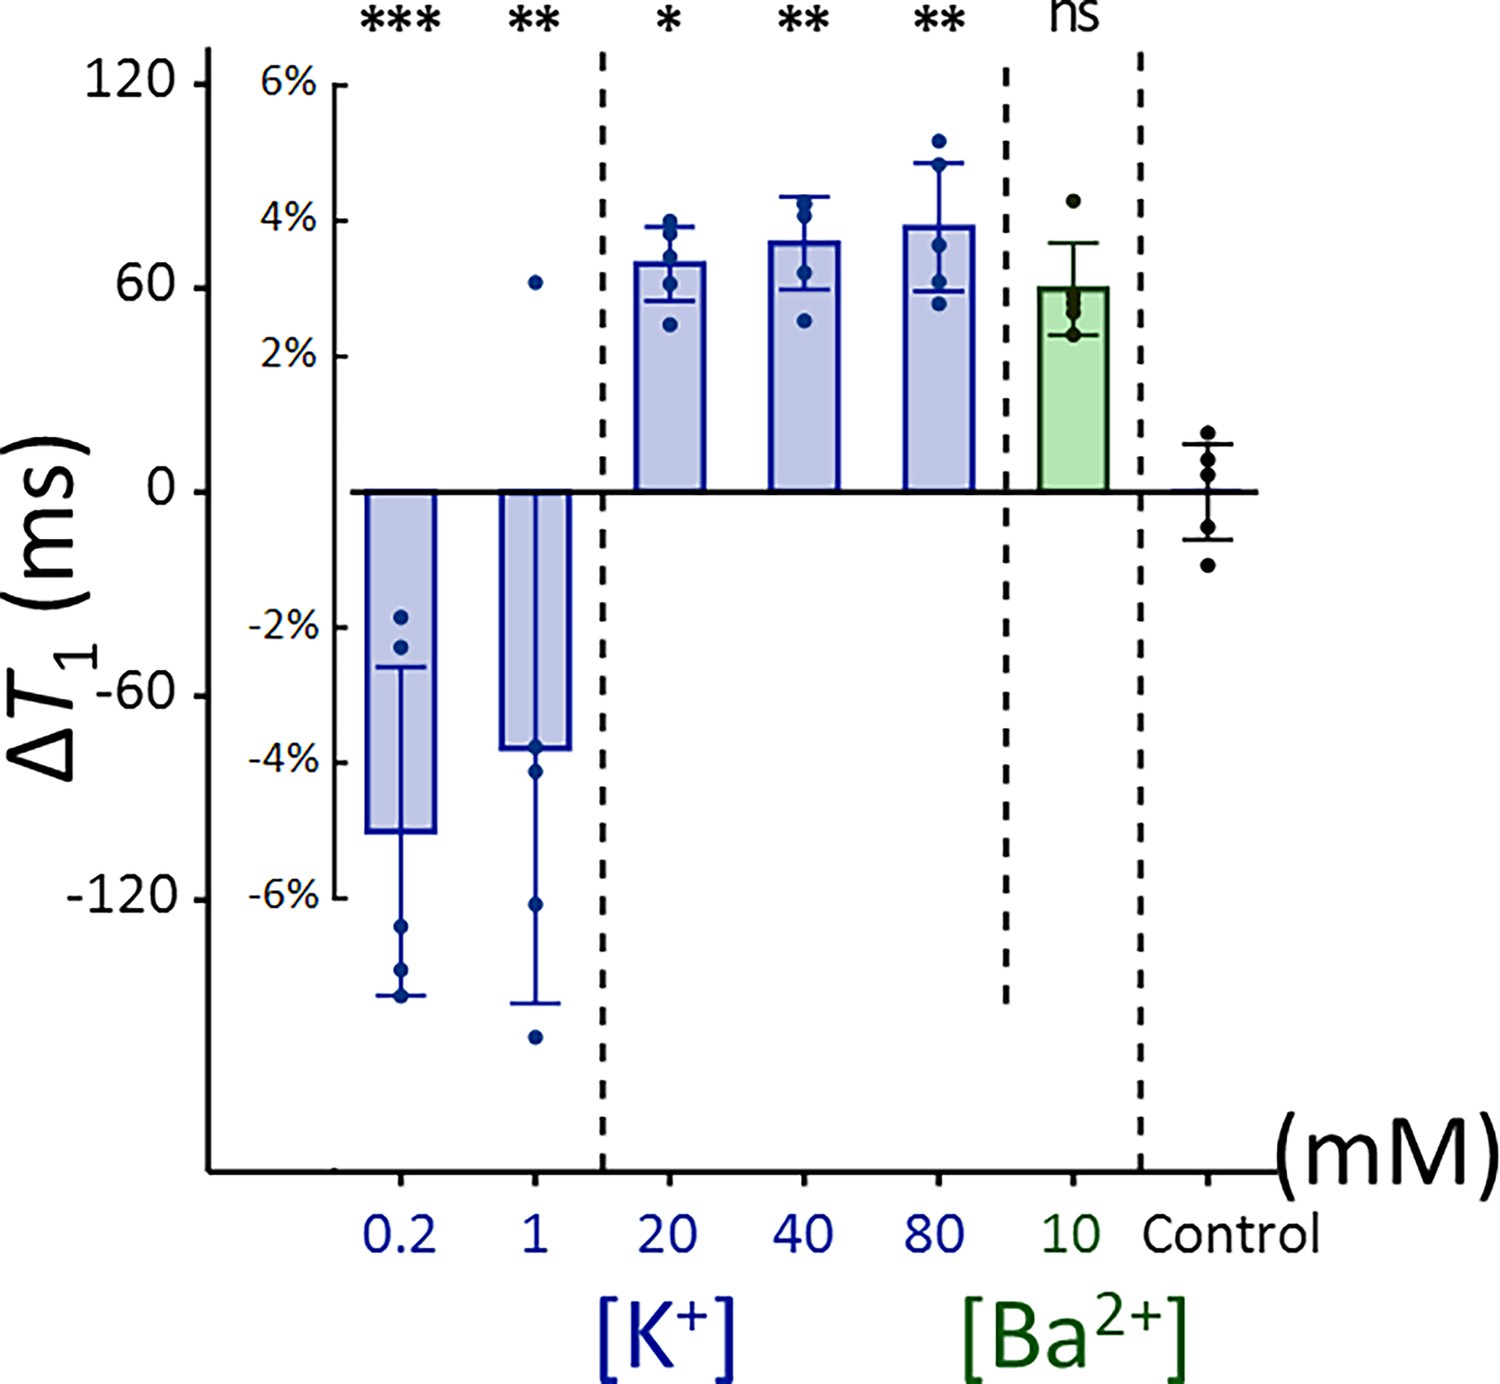
Appendix 2—figure 1
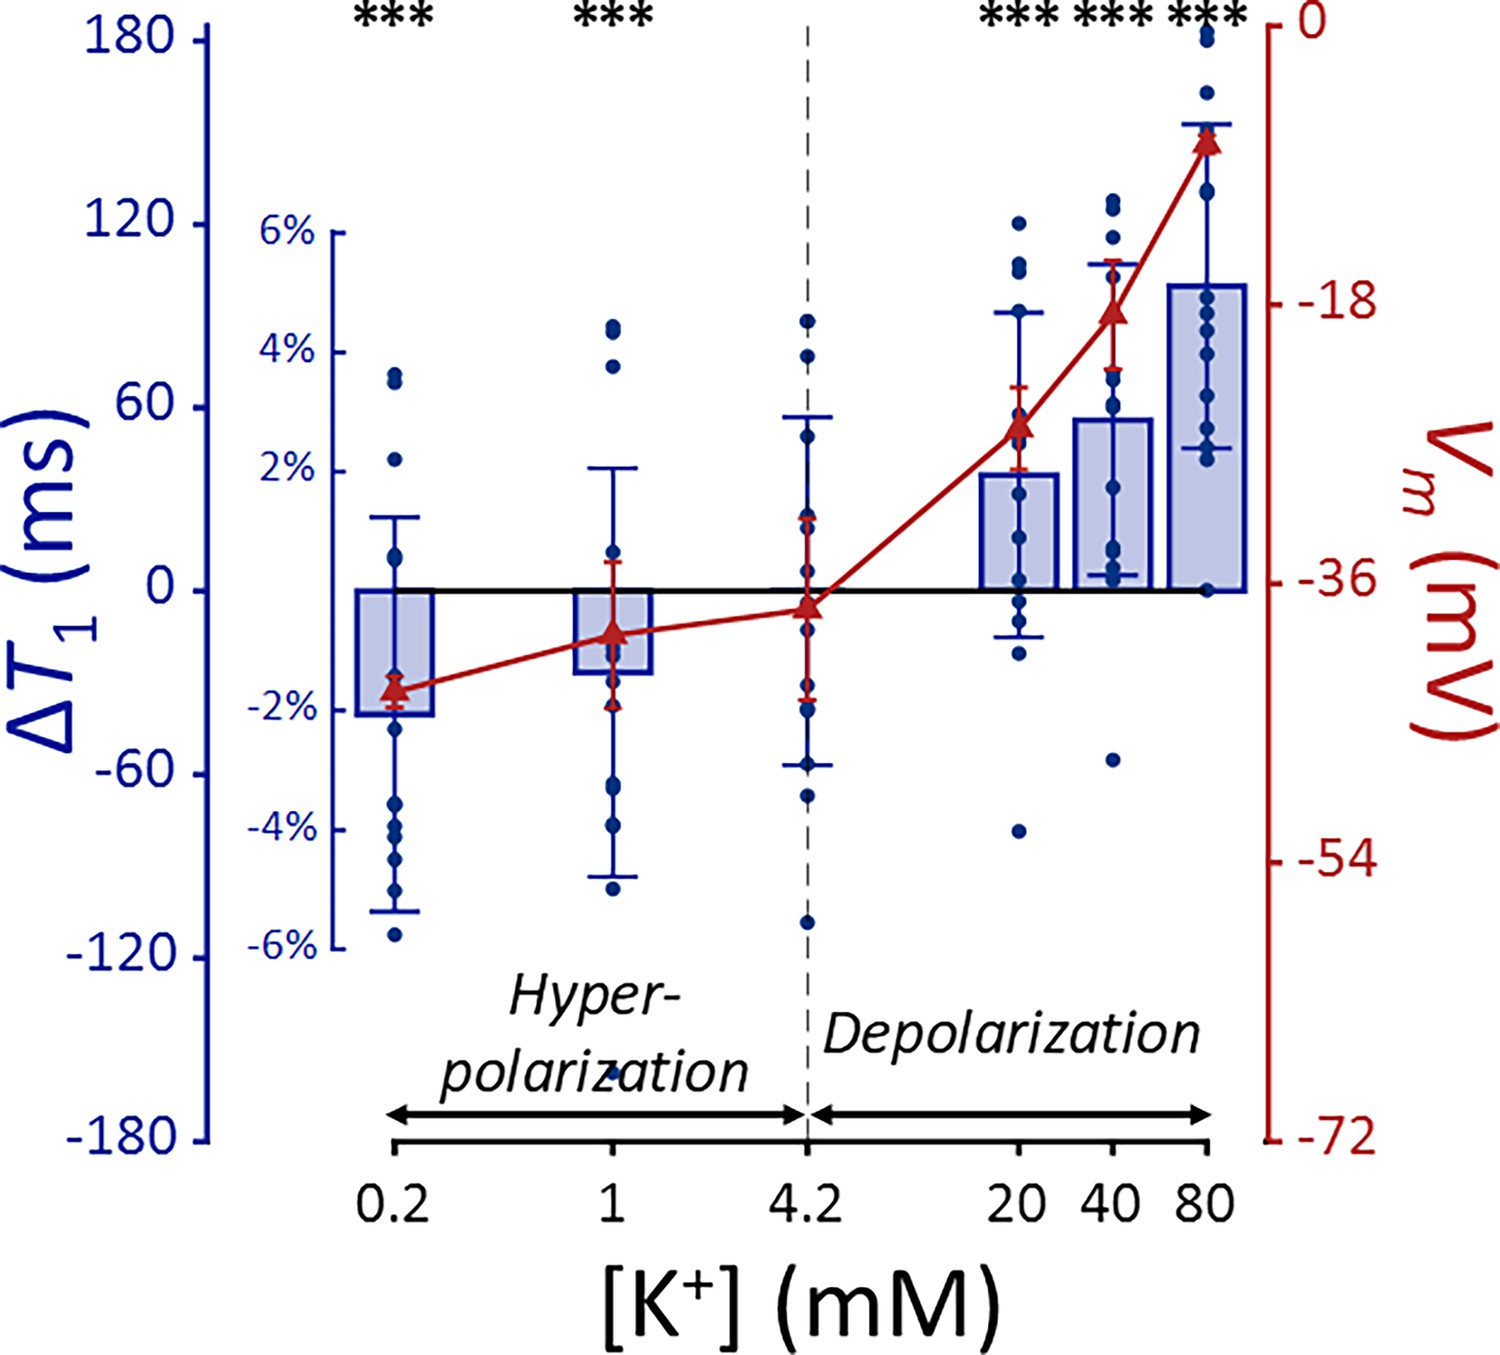
T1 and membrane potential (Vm) of SH-SY5Y cells versus extracellular K+ concentrations ([K+]).
Changes in T1 are displayed with blue bars (n = 15). Membrane potentials are plotted with red triangles (n = 3). The abscissa is in logarithmic scale. Error bars denote standard deviation. Statistical significance of changes in T1 is marked with asterisks (***: p < 0.001).
Appendix 2—figure 2
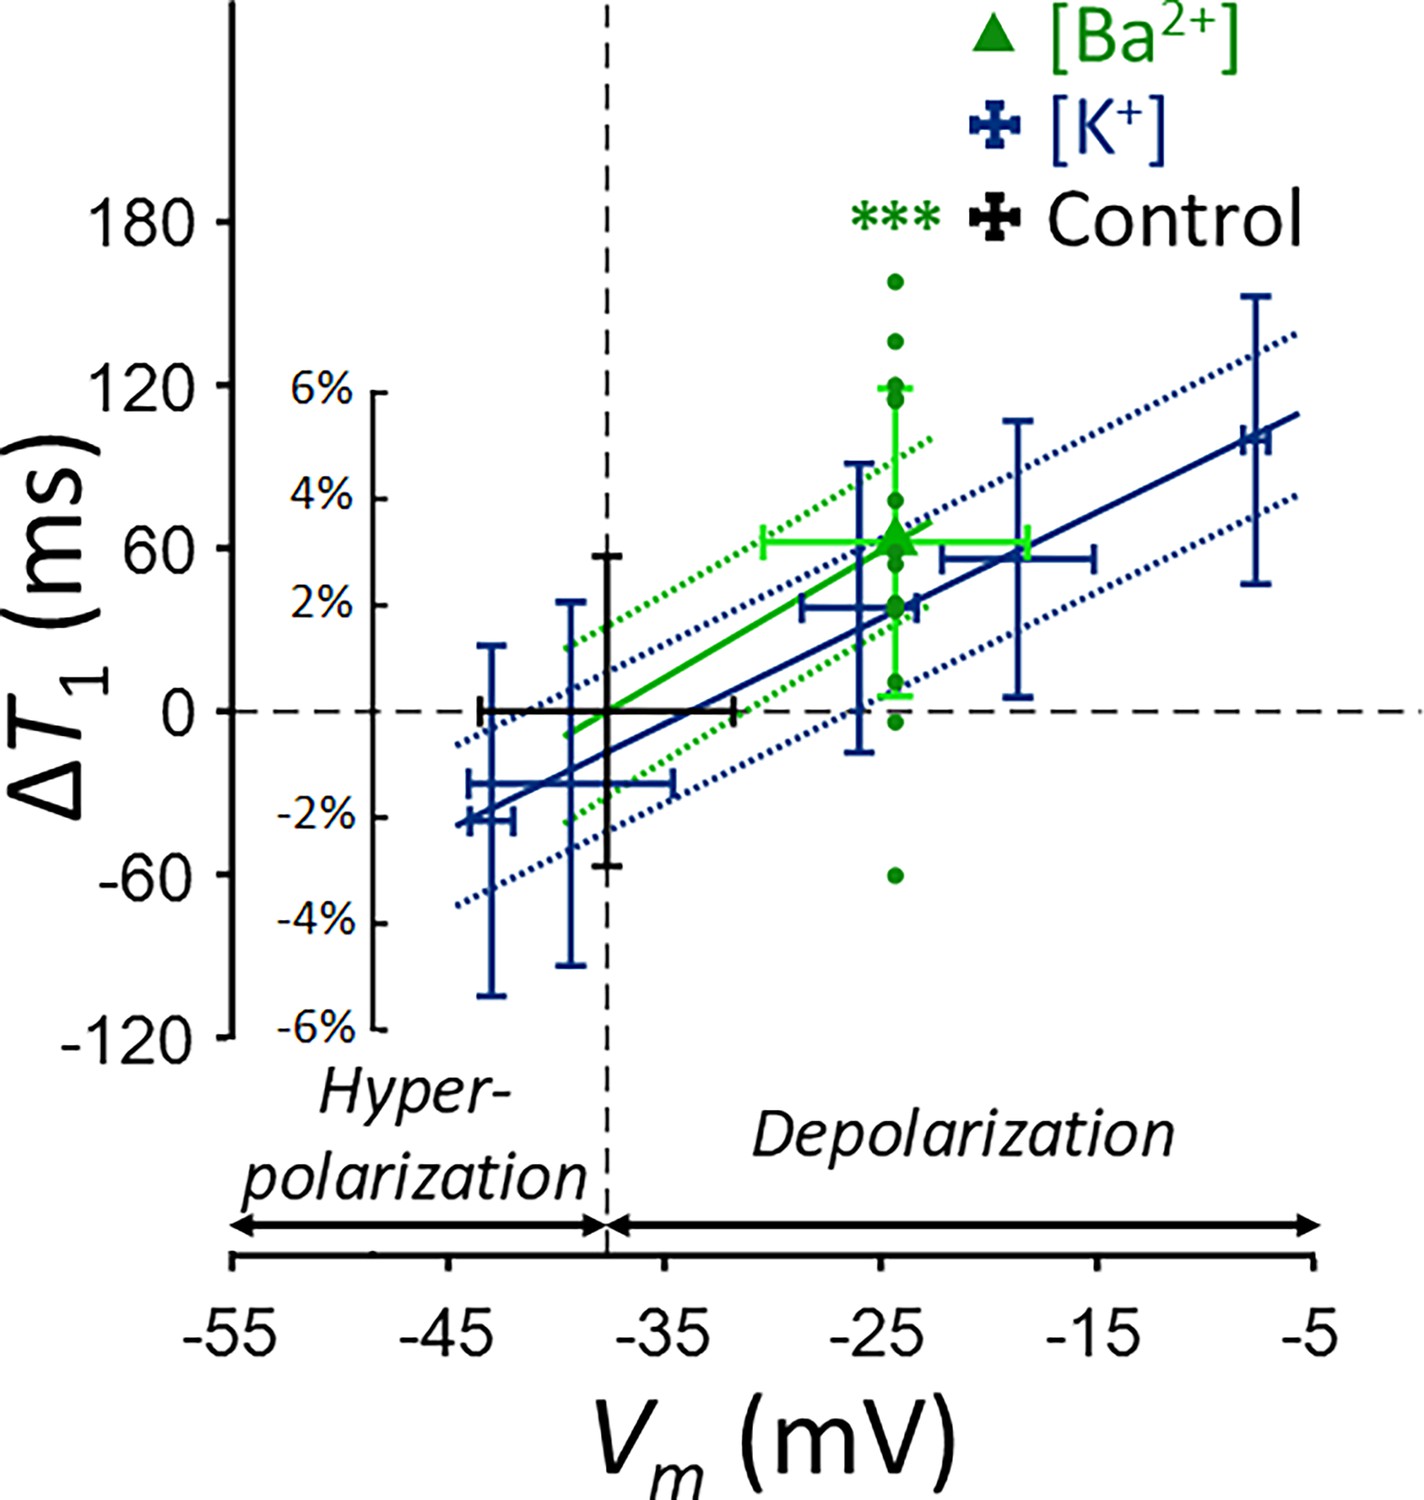
Changes in T1 of SH-SY5Y cells across experimental conditions: [K+] = 0.2–80 mM (blue cross) and [Ba2+] = 10 mM (green triangle), compared to the control condition (black cross).
Data from fifteen experiments (n = 15) are displayed. Linear regression lines for [K+] data (blue solid line) and [Ba2+] data (green solid line) are drawn along with 95% confidence intervals. Error bars denote standard deviation. Statistical significance of changes in T1 with [Ba2+] = 10 mM is marked with asterisks (***: p < 0.001).
Appendix 2—figure 3
Changes in T1 of Jurkat cells across experimental conditions: [K+] = 0.2–80 mM (blue bar) and [Ba2+] = 10 mM (green bar), compared to the control condition of [K+] = 4.2 mM (n = 5).
Error bars denote standard deviation. Statistical significance of changes in T1 is marked with asterisks (ns: p > 0.05, *: p < 0.05, **: p < 0.01, ***: p < 0.001).
Appendix 2—figure 4
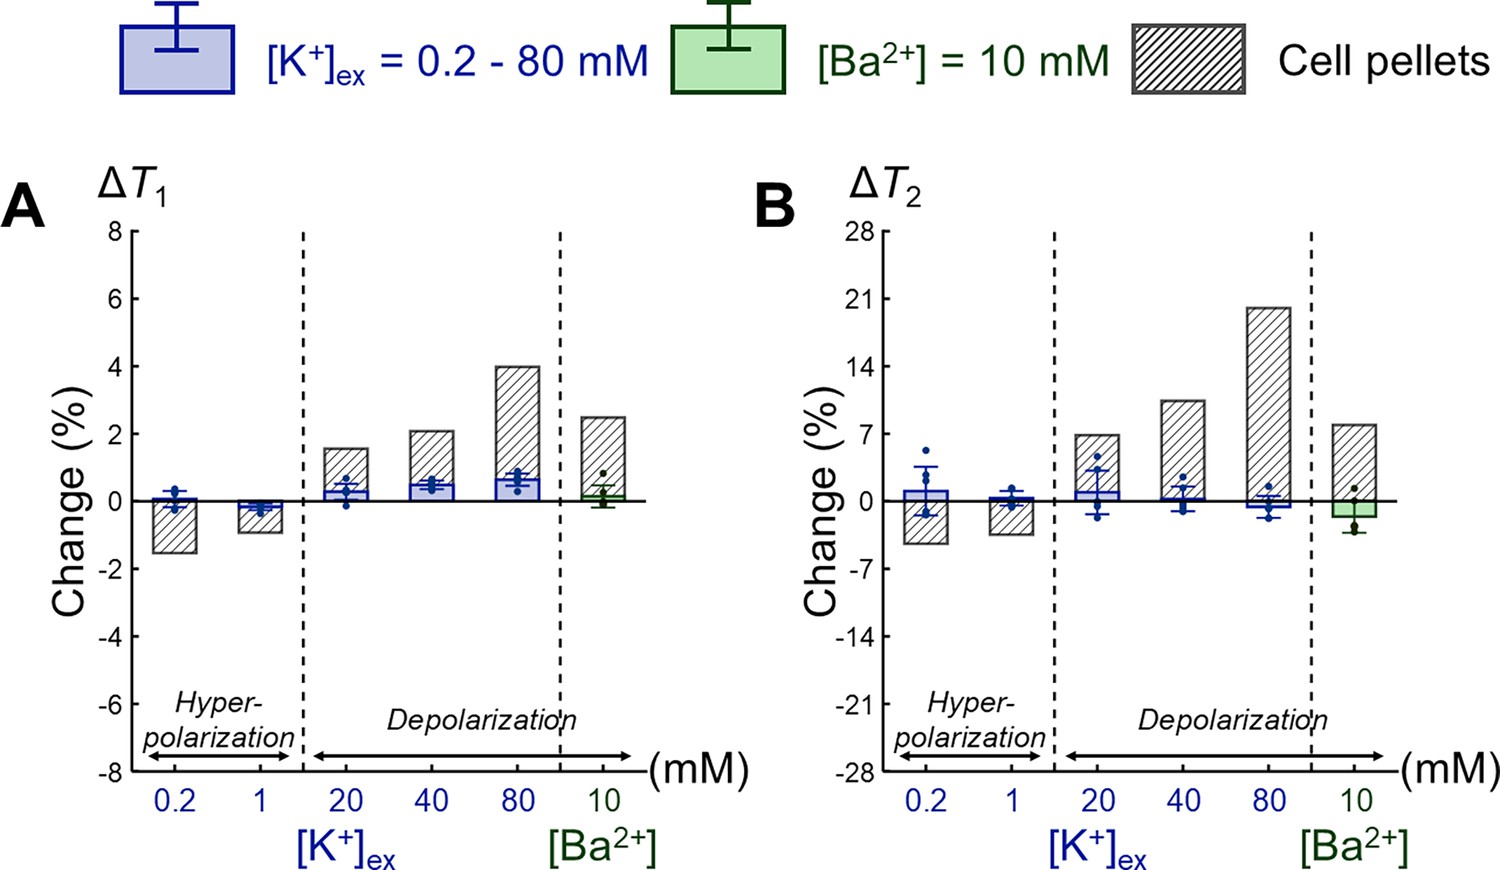
Comparison of changes in relaxation times between extracellular media and SH-SY5Y cell pellets.
Changes in (A) T1 and (B) T2 are expressed as percentage changes relative to the control condition of [K+] = 4.2 mM. The results for extracellular media are displayed as blue bars for the extracellular K+ concentrations ([K+]) and green bars for the Ba2+ concentration ([Ba2+]) (n = 6). For comparison, the results for SH-SY5Y cell pellets corresponding to each extracellular medium are plotted. Error bars denote standard deviation.
Appendix 3—figure 1
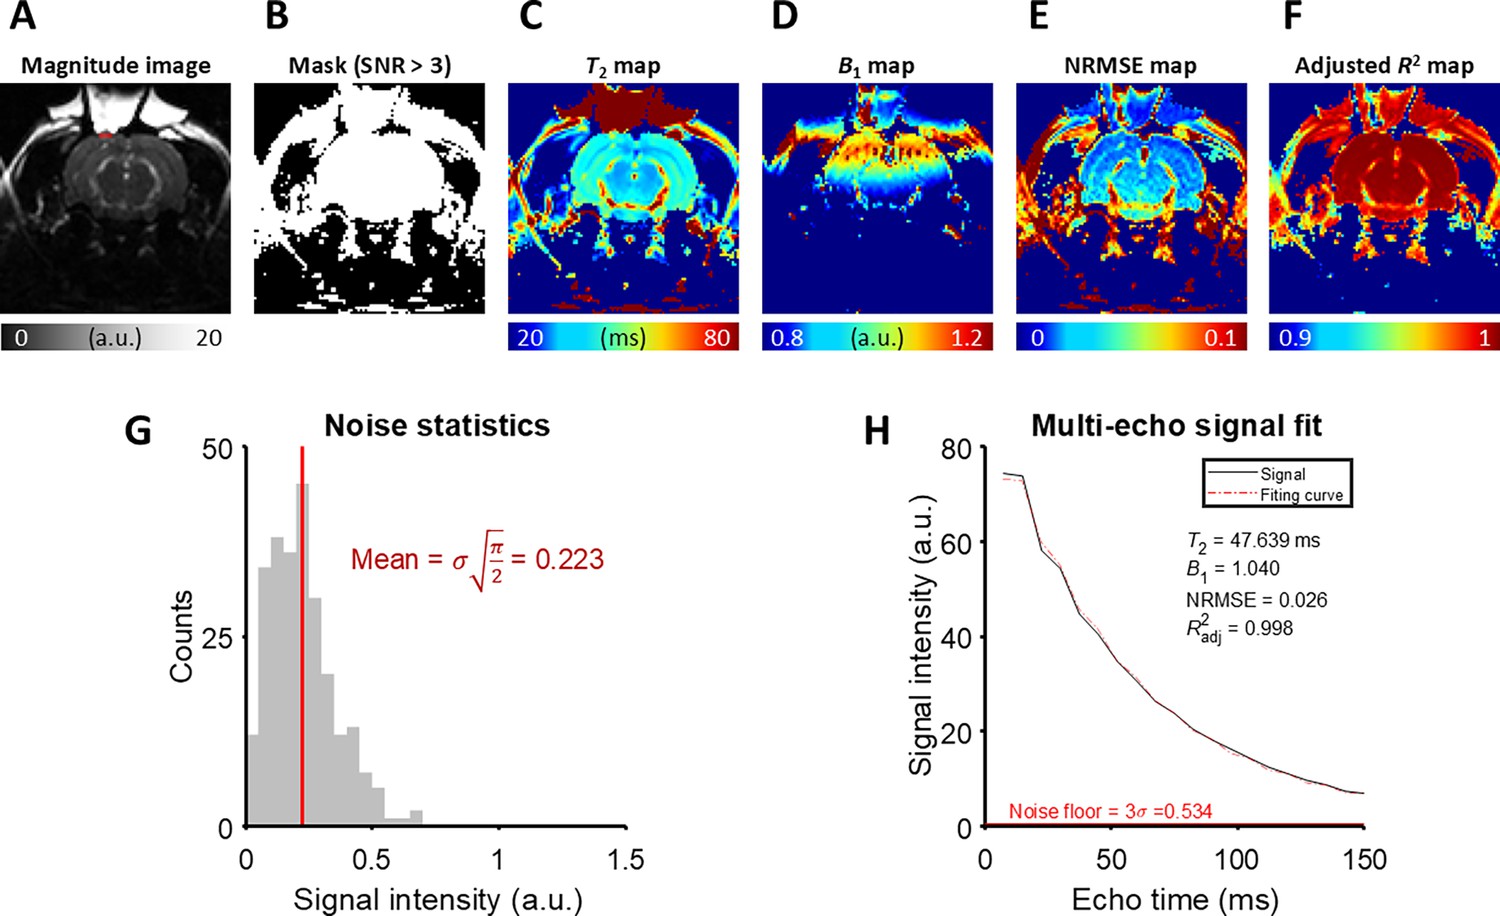
The detailed analysis of T2 fitting on an example MESE image from the in vivo rat experiment.
(A) A magnitude image at the last echo time. The ROI is marked with a red rectangle. (B) A mask generated by thresholding the magnitude image with SNR > 3. (C) T2 map, (D) B1 map, (E) NRMSE map, and (F) Adjusted R2 map produced by the fitting procedure. (G) The noise statistics of the background of the magnitude image. (H) The magnitude signal averaged over the ROI and its fitting curve.
Appendix 4—figure 1
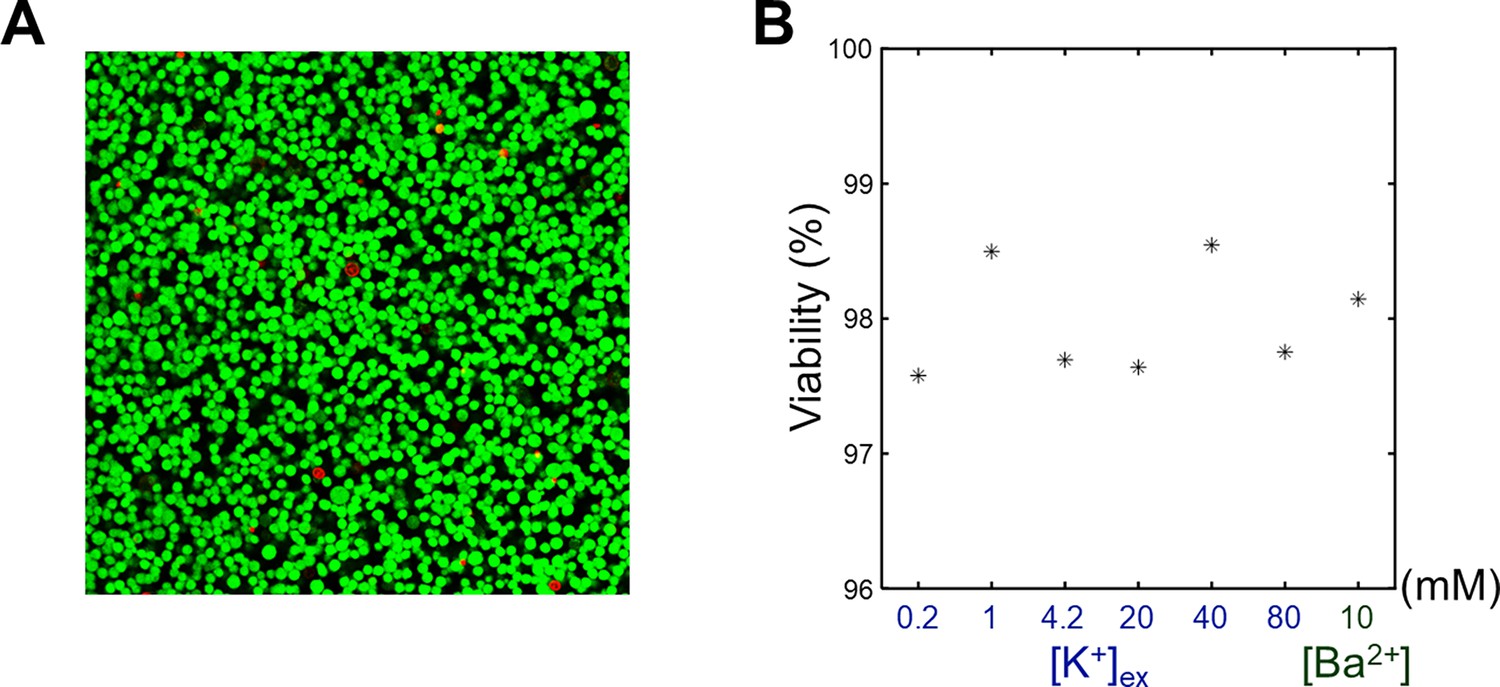
The viability assay of SH-SY5Y cells.
(A) A representative confocal microscopy image of an SH-SY5Y pellet. [K+] of extracellular medium was 4.2 mM. Live cells (green) were stained with calcein-AM, and dead cells (red) were stained with EthD-1. (B) The viabilities of SH-SY5Y cells versus the extracellular K+ concentrations ([K+]) and Ba2+ concentration ([Ba2+]).
Tables
Key resources table
| Reagent type (species) or resource | Designation | Source or reference | Identifiers | Additional information |
|---|---|---|---|---|
| Strain, strain background (Rattus norvegicus) | Wistar | Orient Bio | Cat #: CrlOri:WI; RRID:RGD_13508588 | |
| Cell line (Homo sapiens) | SH-SY5Y | American Type Cell Collection | Cat #: CRL-2266; RRID:CVCL_0019 | |
| Cell line (Homo sapiens) | Jurkat E6.1 | American Type Cell Collection | Cat #: TIB-152; RRID:CVCL_0367 |
Appendix 1—table 1
The scan parameters of the sequences used in the in vitro MR experiments.
The cell samples were scanned with two types of sequences, single-echo spin-echo (SESE) and inversion recovery multi-echo spin-echo (IR-MESE) sequences, on a 9.4 T MRI. T2 was estimated from the SESE sequence. T1, PSR, and kmf were estimated from the IR-MESE sequence, and its inversion times (TIs) were optimized using the theory of Cramér-Rao low bounds: TIs = 4, 4, 4, 4, 4, 4, 4, 4, 17.91, 18.18, 18.18, 18.2, 18.2, 18.21, 18.21, 18.24, 18.24, 18.24, 18.24, 18.24, 18.31, 18.31, 18.32, 18.46, 55.18, 55.26, 55.53, 55.98, 163.5, 164.83, 164.92, 164.93, 164.96, 165.25, 165.25, 165.62, 197.68, 1976.77, 2280.95, and 10076.4 ms. The recovery time or repetition time was set long enough to ensure full relaxation of nuclear magnetization.
| Sequence type | SESE | IR-MESE |
|---|---|---|
| Recovery time (ms) | N/A | 15000 |
| Repetition time (ms) | 15000 | N/A |
| Inversion time (ms) | N/A | 4–10,079.4 (40 steps) |
| Echo time (ms) | 9.5–290.5 (linear, 50 steps) | 9.5–152 (linear, 16 steps) |
| Resolution (mm) | 0.5 | |
| Slice thickness (mm) | 1 | |
| Estimated parameters | T2 | T1, PSR, and kmf |
Appendix 1—table 2
The scan parameters of the sequence used in the in vivo rat MR experiments.
The rats were scanned with a multi-echo spin-echo (MESE) sequence on a 7 T MRI.
| Sequence type | MESE |
|---|---|
| Repetition time (ms) | 1000 |
| Inversion time (ms) | N/A |
| Echo time (ms) | 7.5–150 (linear, 20 steps) |
| Resolution (mm2) | 0.3×0.3 |
| FOV (mm2) | 28.8×28.8 |
| Slice thickness (mm) | 2 |
| Estimated parameters | T2 |
Appendix 1—table 3
The composition of the extracellular media used to modulate membrane potential in vitro.
The sodium chloride concentrations were adjusted to maintain the same osmolarity across all media. Besides the inorganic salts listed in this table, all media commonly contained HEPES = 20 mM; glucose = 4.5 g/l; EGTA = 10 μM; pH = 7.2.
| Medium type | KCl (mM) | BaCl2 (mM) | NaCl (mM) |
|---|---|---|---|
| Baseline | 4.2 |  | 145.8 |
| Low [K+] | 0.2 | 149.8 | |
| 1 | 149 | ||
| High [K+] | 20 | 130 | |
| 40 | 110 | ||
| 80 | 70 | ||
| [Ba2+] | 4.2 | 10 | 130.8 |
Additional files
-
MDAR checklist
- https://cdn.elifesciences.org/articles/101642/elife-101642-mdarchecklist1-v1.docx
-
Source data 1
This source data was used for generating the figures in this article.
- https://cdn.elifesciences.org/articles/101642/elife-101642-data1-v1.xlsx
Download links
A two-part list of links to download the article, or parts of the article, in various formats.
Downloads (link to download the article as PDF)
Open citations (links to open the citations from this article in various online reference manager services)
Cite this article (links to download the citations from this article in formats compatible with various reference manager tools)
Responses to membrane potential-modulating ionic solutions measured by magnetic resonance imaging of cultured cells and in vivo rat cortex
eLife 13:RP101642.
https://doi.org/10.7554/eLife.101642.3


