TPR is required for cytoplasmic chromatin fragment formation during senescence
- MRC Human Genetics Unit, Institute of Genetics and Cancer, University of Edinburgh, United Kingdom
- Centre for Regenerative Medicine, Institute for Regeneration and Repair, University of Edinburgh, United Kingdom
- Institute of Biomedicine and Biotechnology of Cantabria (CSIC-Universidad de Cantabria), Spain
- Institute of Human Genetics, UMR9002, CNRS – Université de Montpellier, France
Figures
Figure 1 with 1 supplement
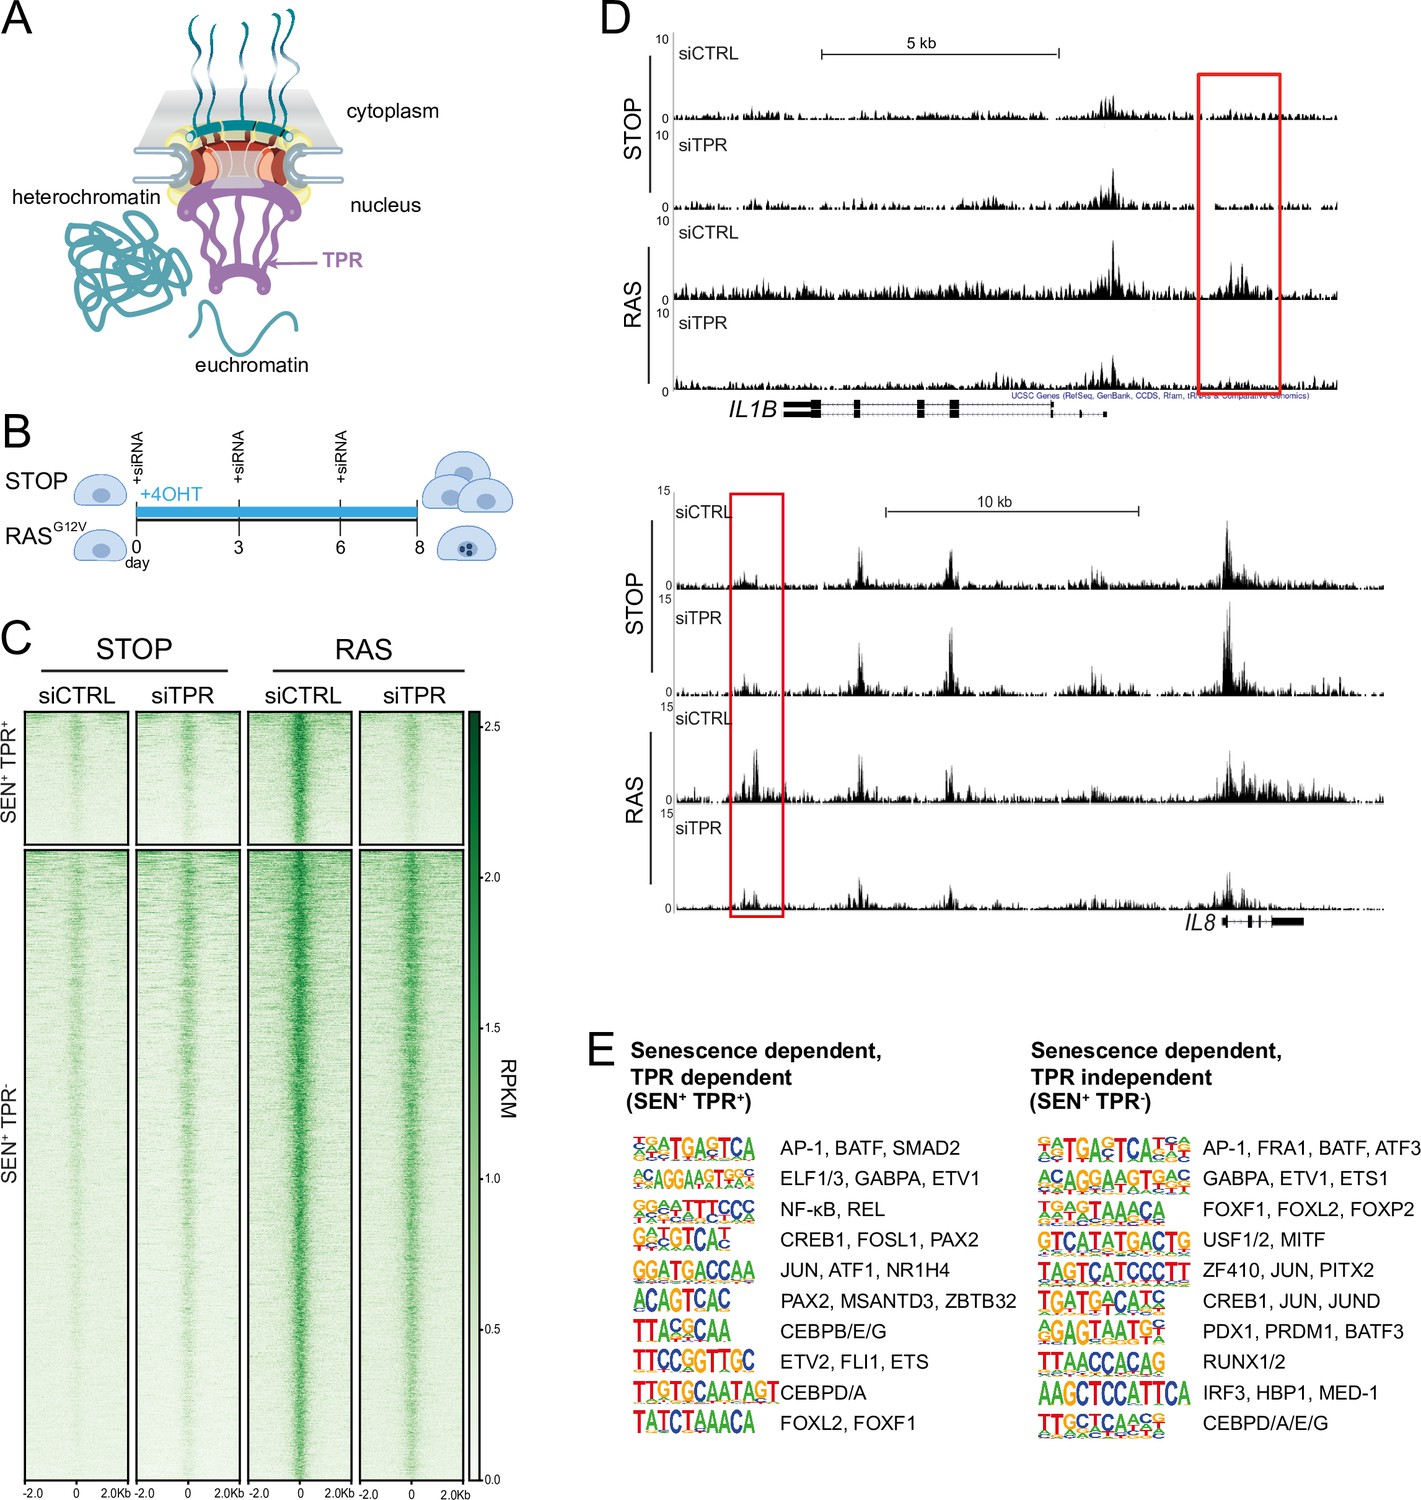
Senescence-specific accessible chromatin sites dependent on TPR are near senescence-associated secretory phenotype (SASP) genes and are enriched in binding sites for SASP-related transcription factors.
(A) Model of the nuclear pore showing the location of TPR in the nuclear basket and heterochromatin exclusion at the pore. (B) Schematic of experimental protocol for senescence induction in IMR90 cells. After 8 days of treatment with 4-hydroxytamoxifen (4-OHT), the control (STOP) line continues to proliferate while the RAS line becomes senescent due to induction of RASG12V expression. (C) Heatmap showing ATAC-seq signal in control (STOP) and OIS (RAS) cells 8 days after treatment with 4-OHT and transfection with either control (CTRL) or TPR siRNAs. SEN+ indicates signal specific to senescent cells and TPR+ indicates dependence on TPR. Intensity scale represents reads per kilobase per million mapped reads (RPKM). (D) Track views of ATAC-seq data from STOP and RAS cells treated with CTRL or TPR siRNAs at IL1B (top) and IL8 (bottom) gene loci. (E) HOMER motif analysis of the senescence and TPR-dependent ATAC-seq peaks (SEN+ TPR+) and the peaks that are dependent on senescence but not TPR (SEN+ TPR-). The top 10 motifs are shown for each category of peaks. For both analyses all motifs have a p-value<10–13.
Figure 1—figure supplement 1
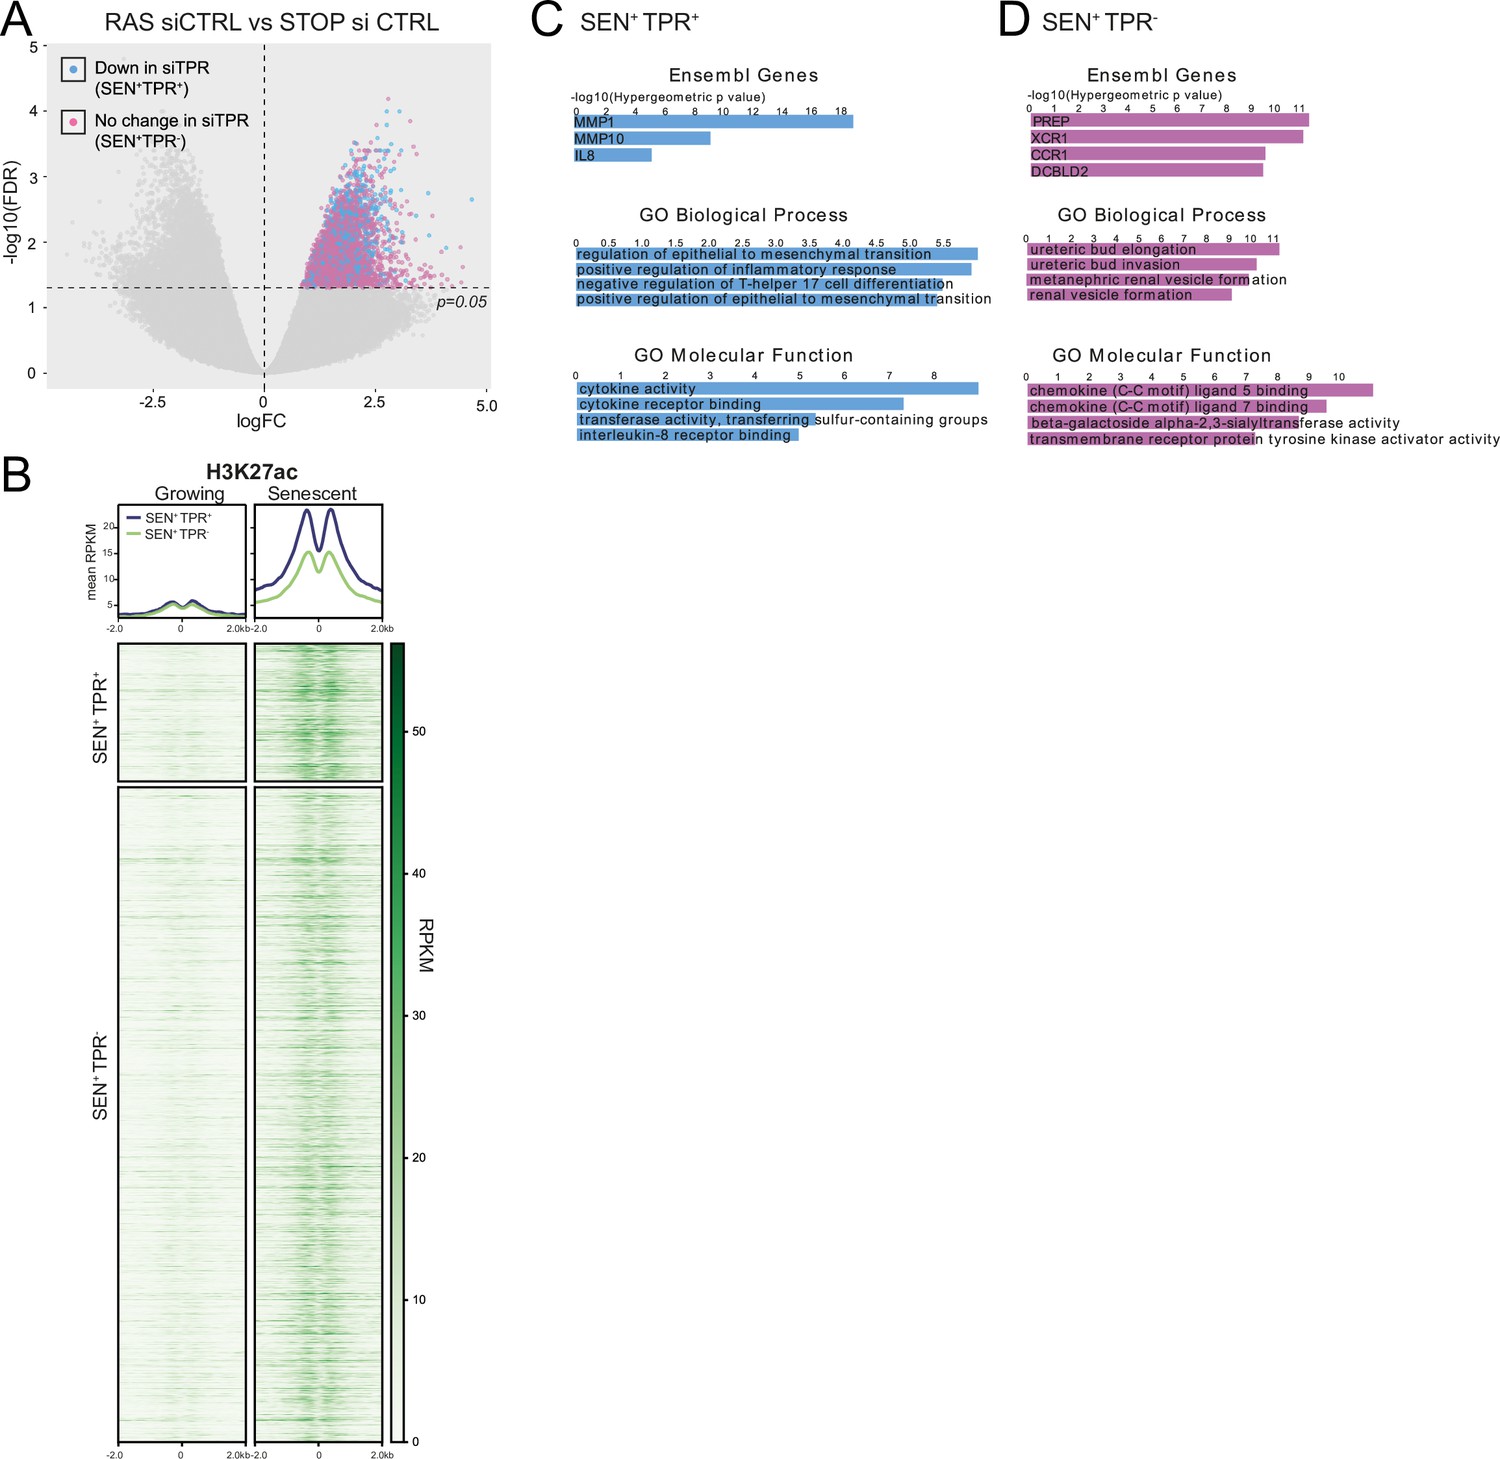
TPR-dependent senescence-specific accessible chromatin peaks are enriched in H3K27ac and associated with genes relevant to inflammation.
Related to Figure 1. (A) Volcano plot of differential accessibility analysis of day 8 (d8) ATAC-seq peaks in RAS siCTRL vs STOP siCTRL. The horizontal dashed line indicates an adjusted p-value (FDR) of 0.05. Peaks with a significant increase in accessibility in senescent cells (SEN+) are coloured blue if their accessibility decreases on siTPR treatment (SEN+ TPR+), or pink if their accessibility does not change on siTPR treatment (SEN+ TPR-). (B) Heatmap of H3K27 acetylation (H3K27ac) ChIP-seq data from growing and senescent IMR90 cells (Parry et al., 2018) for the TPR-dependent (TPR+) and TPR-independent (TPR-) peaks defined in Figure 1C. (C) Top ranking results of gene ontology analysis of genes close to SEN+TPR+ peaks using the Genomic Regions Enrichment of Annotations Tool (GREAT) package (McLean et al., 2010). (D) As in (C) but for genes close to SEN+ TPR- peaks.
Figure 2 with 1 supplement
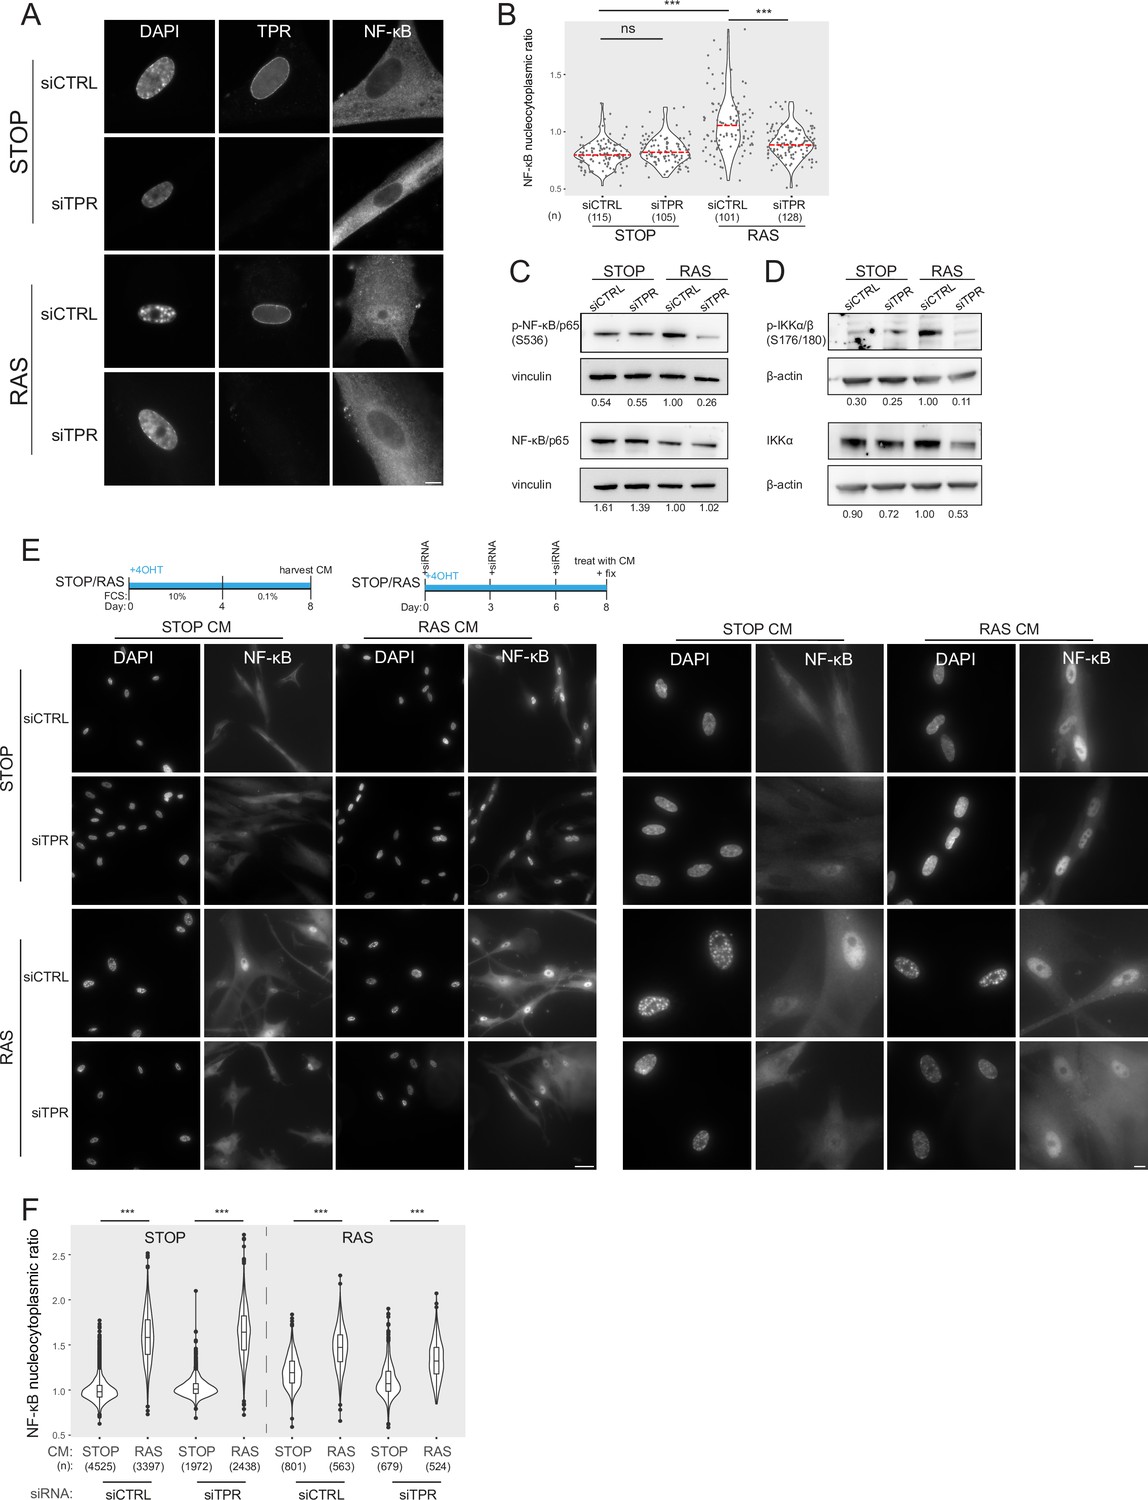
Prolonged loss of TPR during senescence blocks NF-κB activation.
(A) TPR and NF-κB immunostaining in control (STOP) and oncogene-induced senescence (OIS) (RAS) cells after 4-hydroxytamoxifen (4-OHT) and siRNA (control and TPR) treatment for 8 days. Scale bar: 10 μm. (B) Quantification of NF-κB nucleocytoplasmic ratios in experiment described in (A). Kruskal-Wallis testing was used to determine statistical significance followed by Dunn’s post hoc testing. n.s. p>0.05, ***<0.001. (n) indicates the number of cells analysed for each sample. Data from a biological replicate are in Figure 2—figure supplement 1A. Statistical data are in Figure 2—source data 1. (C) Immunoblots of extracts from control (STOP) and OIS (RAS) cells after 4-OHT and siRNA treatment for 8 days for phosphorylated (pS536) and total NF-κB with vinculin as a loading control. Numbers below indicate the ratio of band intensity for NF-κBpS536 or NF-κB and the vinculin loading control with the ratio for RAS siCTRL normalised to 1.00. (D) As in (C) but for phosphorylated (pS176/180) IKKα/β and total IKKα and with β-actin as a loading control. Data from biological replicates of (C) and (D) are in Figure 2—figure supplement 1B and C. (E) Above: Schematic of controlled media experiment to investigate whether TPR loss causes a general defect in NF-κB transport. STOP and RAS cells were grown for 8 days and treated with 4-OHT and siRNAs. On day 8 (d8) they were treated for 45 min with conditioned media (CM) taken from either STOP or RAS cells grown in 4-OHT-containing media for 8 days. Below left: NF-κB immunostaining in STOP or RAS cells treated with CM harvested from STOP (left) or RAS (right) cells. Scale bar: 50 μm. Below right: Same experiment with images shown at greater magnification. Scale bar: 10 μm. (F) Quantification of NF-κB nucleocytoplasmic ratios for experiment shown in (E). Data from a biological replicate are in Figure 2—figure supplement 1D. Statistical data are in Figure 2—source data 1.
-
Figure 2—source data 1
Quantification of NF-κB nucleocytoplasmic ratios and statistical analysis for data in Figure 2B and F, and for biological replicates in Figure 2—figure supplement 1A and D.
Median NF-κB nucleocytoplasmic ratios (n/c) and number of cells analysed for day 8 (d8) STOP or RAS cells subject to knockdown with control (CTRL) or TPR siRNAs, and for experiments where these cells were treated with conditioned media (CM) from either STOP or RAS cells. Kruskal-Wallis testing was used to determine statistical significance for each replicate (p-value in parentheses) followed by Dunn’s post hoc testing. p-values after Benjamini and Hochberg correction.
- https://cdn.elifesciences.org/articles/101702/elife-101702-fig2-data1-v3.docx
-
Figure 2—source data 2
Uncropped and labelled gels for Figure 2.
- https://cdn.elifesciences.org/articles/101702/elife-101702-fig2-data2-v3.pdf
-
Figure 2—source data 3
Raw unedited gels for Figure 2.
- https://cdn.elifesciences.org/articles/101702/elife-101702-fig2-data3-v3.zip
Figure 2—figure supplement 1
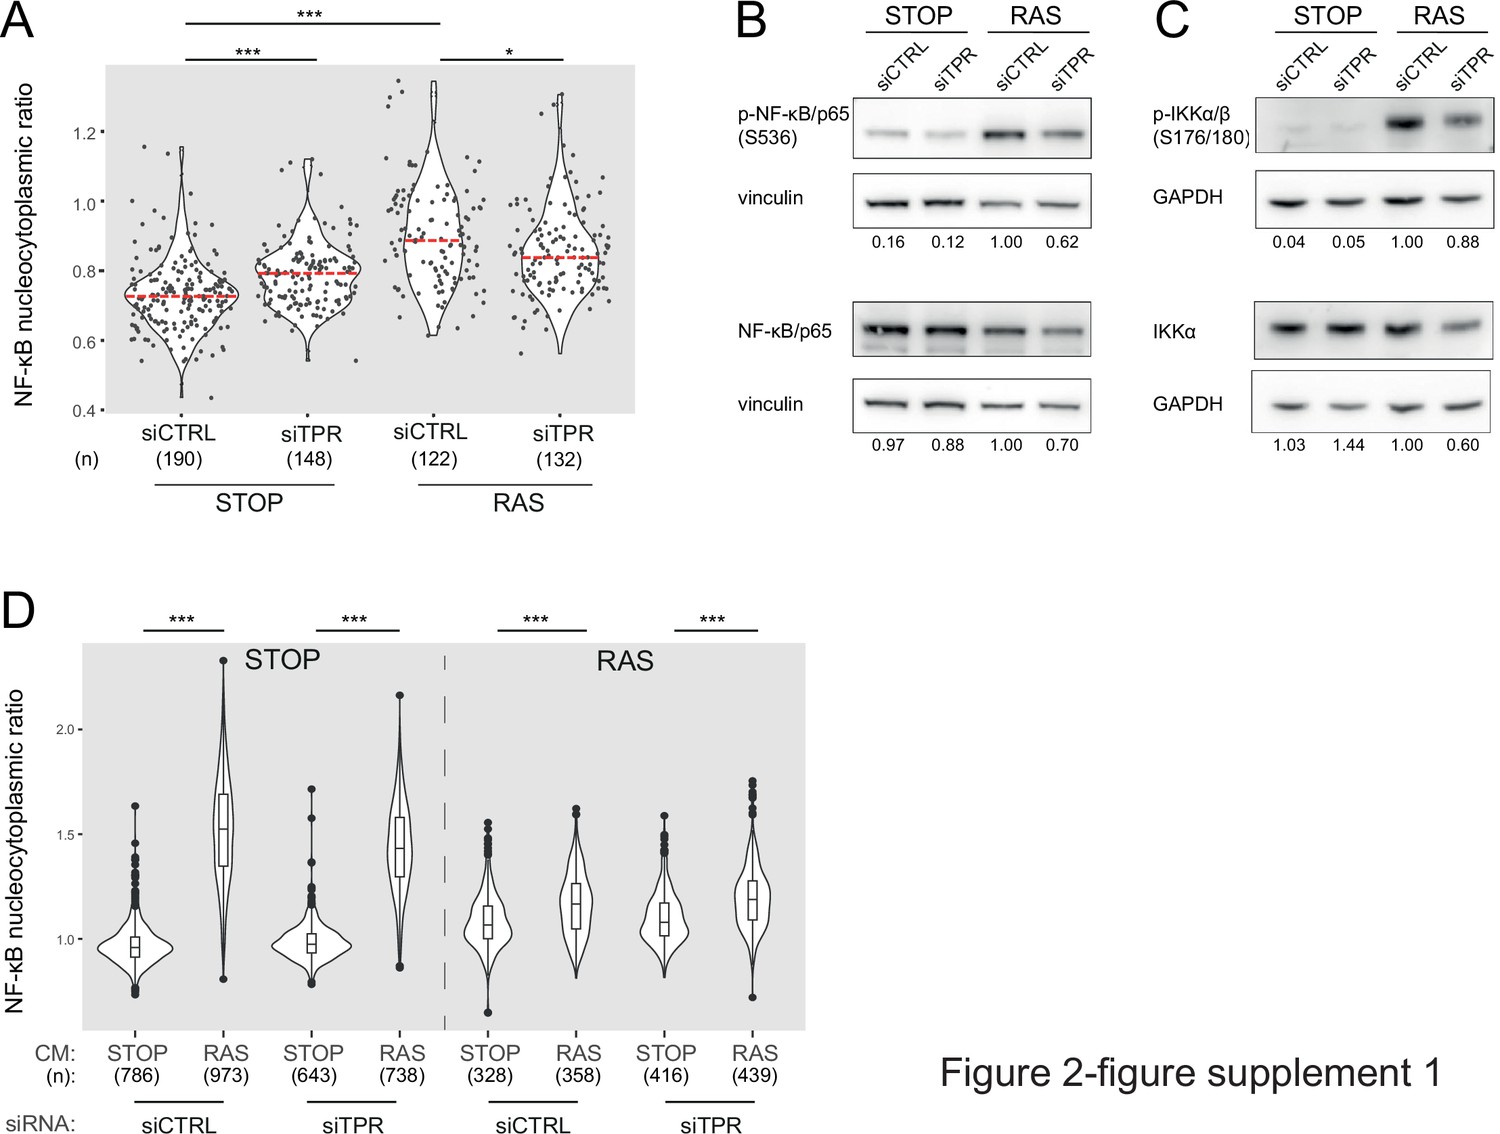
TPR depletion blocks NF-κB activation during senescence.
Related to Figure 2. (A) Quantification of NF-κB nucleocytoplasmic ratios by immunofluorescence in STOP and RAS cells after 4-hydroxytamoxifen (4-OHT) and siRNA treatment for 8 days. Kruskal-Wallis testing was used to determine statistical significance followed by Dunn’s post hoc testing. n.s. p>0.05, ***<0.001. (n) indicates the number of cells analysed for each sample. Data are from a biological replicate of the experiment shown in Figure 2B. Statistical data are in Figure 2—source data 1. (B) Immunoblots in extracts from control (STOP) and OIS (RAS) cells after 4-OHT and siRNA (control and TPR) treatment for 8 days for phosphorylated (pS536) and total NF-κB with vinculin as a loading control. Numbers below indicate the ratio of band intensity for NF-κBpS536 or NF-κB and the vinculin loading control with the ratio for RAS siCTRL normalised to 1.00. Biological replicate of data in Figure 2C. (C) As in (B) but for phosphorylated (pS176/180) IKKα/β and total IKKα and with GAPDH as a loading control. Biological replicate of data in Figure 2D. (D) Quantification of NF-κB nucleocytoplasmic ratios in d8 STOP and RAS treated for 45 min with conditioned media (CM) from either STOP or RAS cells grown in 4-OHT-containing media for 8 days. Data are from a biological replicate of experiment in Figure 2F. Statistical data are in Figure 2—source data 1.
-
Figure 2—figure supplement 1—source data 1
Uncropped and labelled gels for Figure 2—figure supplement 1.
- https://cdn.elifesciences.org/articles/101702/elife-101702-fig2-figsupp1-data1-v3.zip
-
Figure 2—figure supplement 1—source data 2
Raw unedited gels for Figure 2—figure supplement 1.
- https://cdn.elifesciences.org/articles/101702/elife-101702-fig2-figsupp1-data2-v3.zip
Figure 3 with 2 supplements
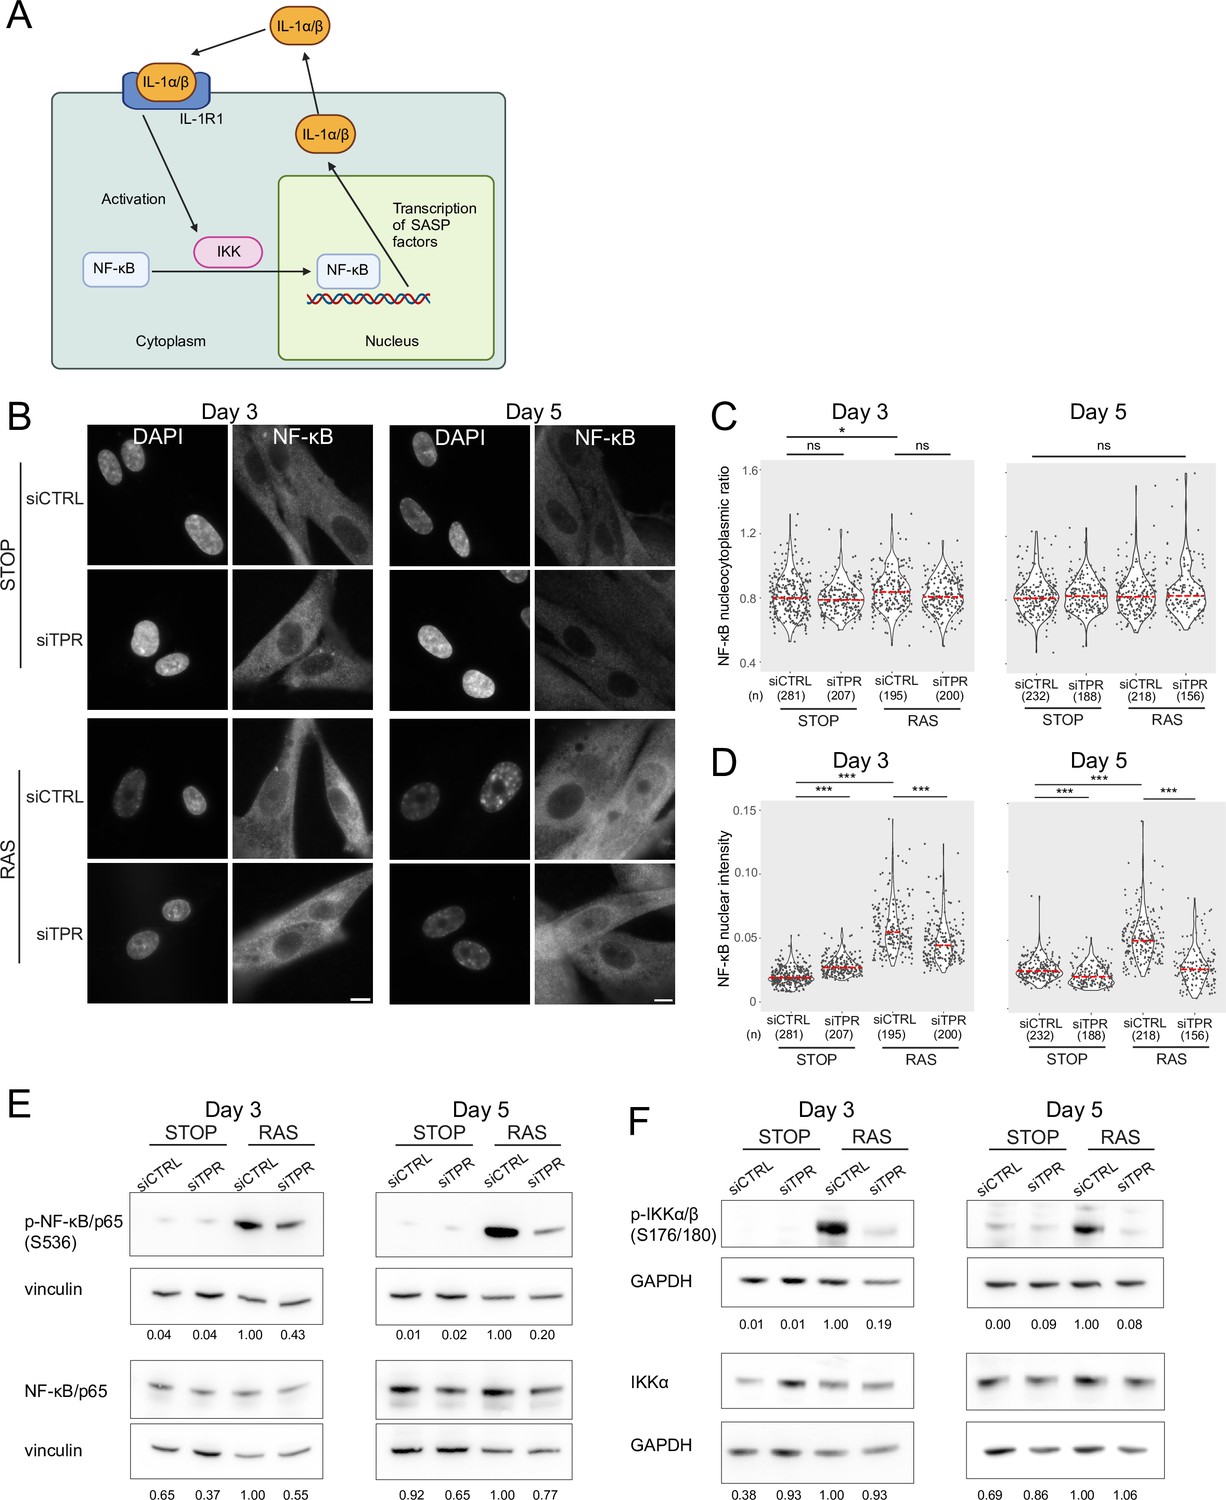
Decreased NF-κB activation upon TPR knockdown precedes the senescence-associated secretory phenotype (SASP).
(A) Schematic showing positive feedback loop in SASP signalling. Secreted IL-1α and IL-1β bind IL-1R1 at the cell membrane, leading to increased NF-κB activation and increased IL-1α and IL-1β secretion. (B) NF-κB immunostaining in control (STOP) and oncogene-induced senescence (OIS) (RAS) cells after 4-hydroxytamoxifen (4-OHT) and siRNA treatment for either 3 or 5 days. Scale bar: 10 μm. (C and D) Quantification of (C) nucleocytoplasmic ratios of NF-κB or (D) NF-κB nuclear intensity from experiment shown in (B). (n) indicates the number of cells analysed for each sample. Kruskal-Wallis testing was used to determine statistical significance followed by Dunn’s post hoc testing. n.s. p>0.05, *<0.05, ***<0.001. (E) Immunoblots for phosphorylated (pS536) and total NF-κB (p65) in STOP and RAS cells treated with 4-OHT for 3 or 5 days and with control (CTRL) or TPR siRNAs. Vinculin was used as a loading control. Numbers below indicate the ratio of band intensity for NF-κBpS536 or NF-κB and the vinculin loading control with the ratio for RAS siCTRL normalised to 1.00. (F) As in (E) but blotting to detect phosphorylated (pS176/180) IKKα/β and total IKKα. GAPDH was used as a loading control. Data from a biological replicate of the data in (A–E) are in Figure 3—figure supplement 1. Statistical data are in Figure 3—source data 1.
-
Figure 3—source data 1
Quantification of NF-κB nucleocytoplasmic ratios, nuclear intensity, and statistical analysis for data in Figure 3C and D and for biological replicates in Figure 3—figure supplement 1A and B.
Median NF-κB nucleocytoplasmic ratios (n/c) and number of cells analysed for day 3 (d3) and d5 STOP or RAS cells subject to knockdown with control (CTRL) or TPR siRNAs. Kruskal-Wallis testing was used to determine statistical significance (p-value in parentheses) followed by Dunn’s post hoc testing. p-Values after Benjamini and Hochberg correction. NA: Kruskal-Wallis test showed no significant differences so it is not appropriate to carry out pairwise testing.
- https://cdn.elifesciences.org/articles/101702/elife-101702-fig3-data1-v3.docx
-
Figure 3—source data 2
Uncropped and labelled gels for Figure 3.
- https://cdn.elifesciences.org/articles/101702/elife-101702-fig3-data2-v3.zip
-
Figure 3—source data 3
Raw unedited gels for Figure 3.
- https://cdn.elifesciences.org/articles/101702/elife-101702-fig3-data3-v3.zip
Figure 3—figure supplement 1
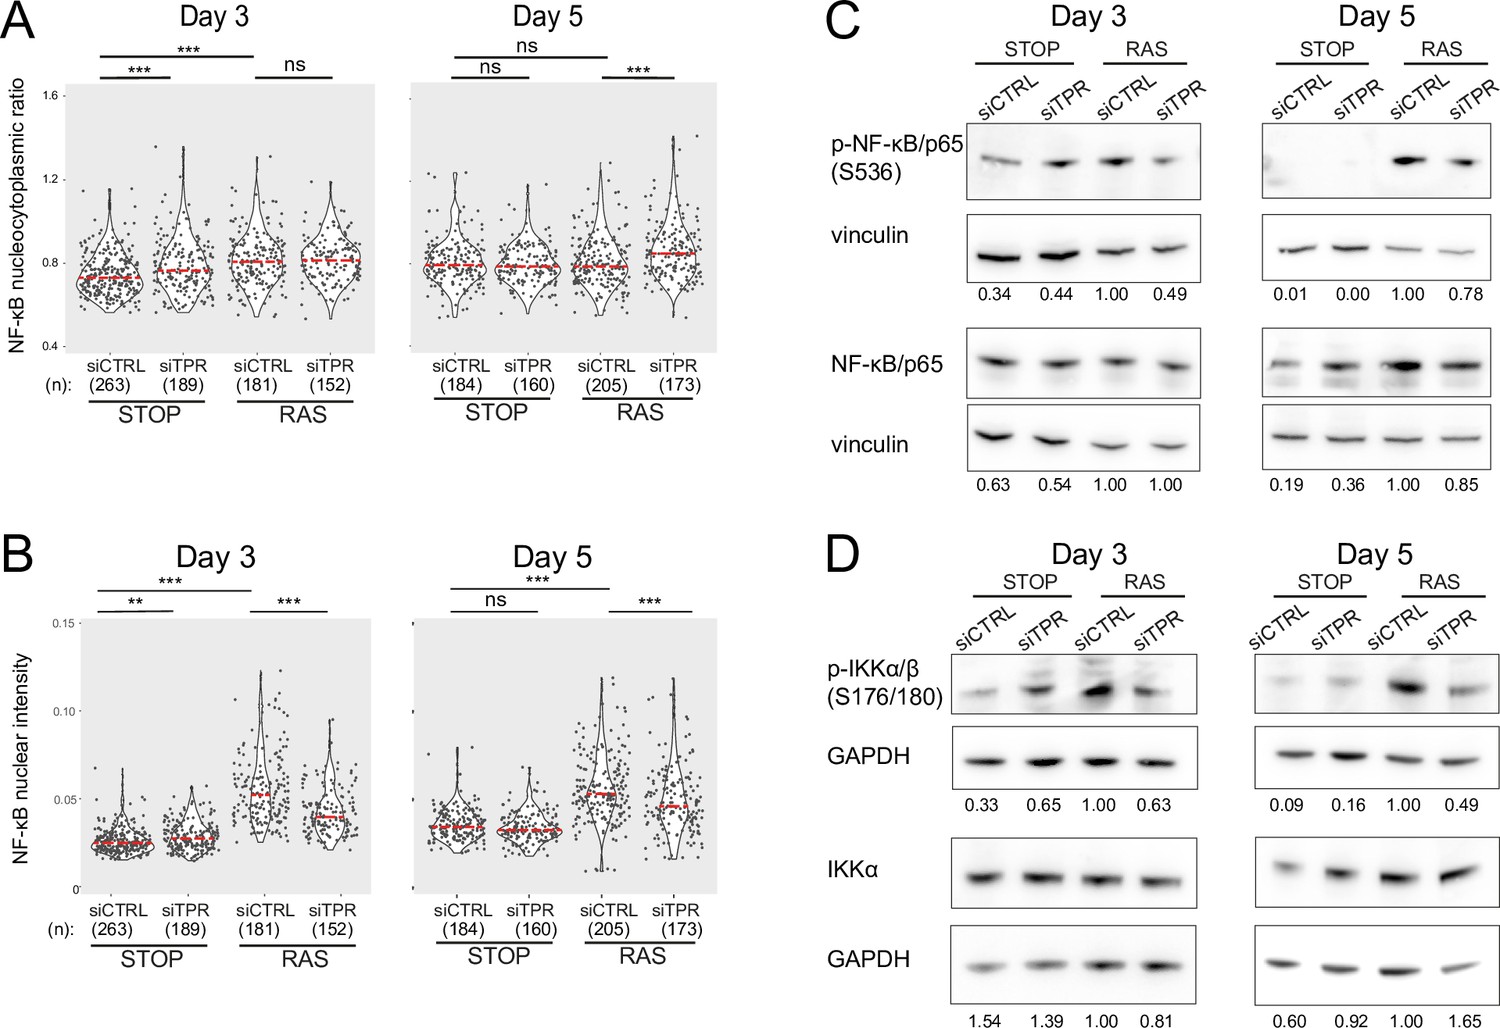
Decreased NF-κB activation upon TPR knockdown at days 3 and 5.
Related to Figure 3. (A and B) Quantification of (A) nucleocytoplasmic ratios of NF-κB or (B) nuclear NF-κB intensity from a biological replicate of the experiment shown in Figure 3B–D. (n) indicates the number of cells analysed for each sample. Kruskal-Wallis testing was used to determine statistical significance followed by Dunn’s post hoc testing. n.s. p>0.05, *<0.05, ***<0.001. Statistical data are in Figure 3—source data 1. (C) Immunoblots for phosphorylated (pS536) and total NF-κB (p65) in STOP and RAS cells treated with 4-hydroxytamoxifen (4-OHT) for 3 or 5 days and with control (CTRL) or TPR siRNAs. Vinculin was used as a loading control. Numbers below indicate the ratio of band intensity for NF-κBpS536 or NF-κB and the vinculin loading control with the ratio for RAS siCTRL normalised to 1.00. Biological replicate of data in Figure 3E. (D) As in (C) but blotting to detect phosphorylated (pS176/180) IKKα/β and total IKKα. GAPDH was used as a loading control. Biological replicate of data in Figure 3F.
-
Figure 3—figure supplement 1—source data 1
Uncropped and labelled gels for Figure 2—figure supplement 1.
- https://cdn.elifesciences.org/articles/101702/elife-101702-fig3-figsupp1-data1-v3.zip
-
Figure 3—figure supplement 1—source data 2
Raw unedited gels for Figure 2—figure supplement 1.
- https://cdn.elifesciences.org/articles/101702/elife-101702-fig3-figsupp1-data2-v3.zip
Figure 3—figure supplement 2
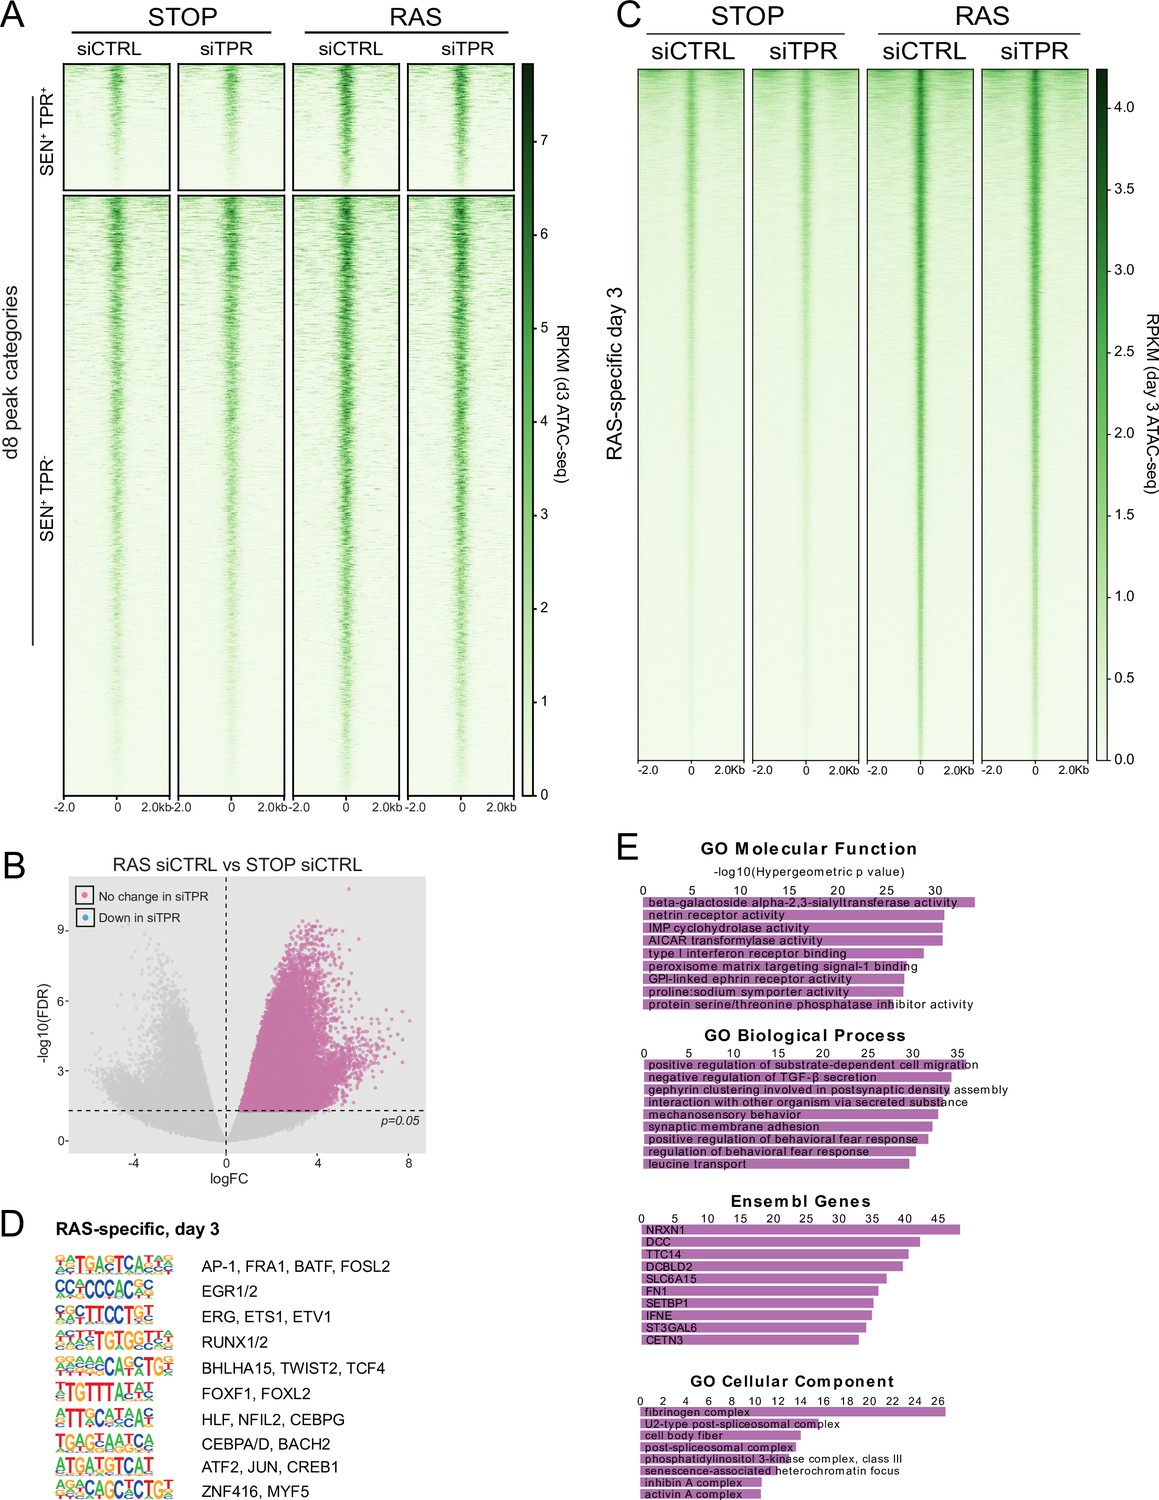
TPR knockdown does not affect chromatin accessibility at day 3 (d3).
(A) Heatmap showing ATAC-seq signal in control (STOP) and oncogene-induced senescence (OIS) (RAS) cells 3 days after 4-hydroxytamoxifen (4-OHT) treatment and transfected with either CTRL or TPR siRNAs. Peak categories are those defined from the d8 ATAC-seq data in Figure 1C. Intensity scale represents reads per kilobase per million mapped reads (RPKM). (B) Volcano plot of differential accessibility analysis of d3 ATAC-seq peaks in RAS siCTRL vs STOP siCTRL. The horizontal dashed line indicates an adjusted p-value (FDR) of 0.05. Peaks with a significant increase in accessibility in RAS cells are coloured pink if their accessibility does not change on siTPR treatment. Any peaks that did change would have been coloured blue as in Figure 1—figure supplement 1A. (C) Heatmap showing ATAC-seq signal in control (STOP) and OIS (RAS) cells 3 days after 4-OHT treatment and transfected with either CTRL or TPR siRNAs. Peaks that gain accessibility in RAS cells are shown. Intensity scale represents RPKM. (D) HOMER motif analysis of the d3 RAS-specific ATAC-seq peaks. The top 10 motifs are shown for each category of peaks. All motifs have a p-value<10–197. (E) Top ranking results of gene ontology analysis of genes close to d3 RAS-specific peaks using the Genomic Regions Enrichment of Annotations Tool (GREAT) package (McLean et al., 2010).
Figure 4 with 1 supplement
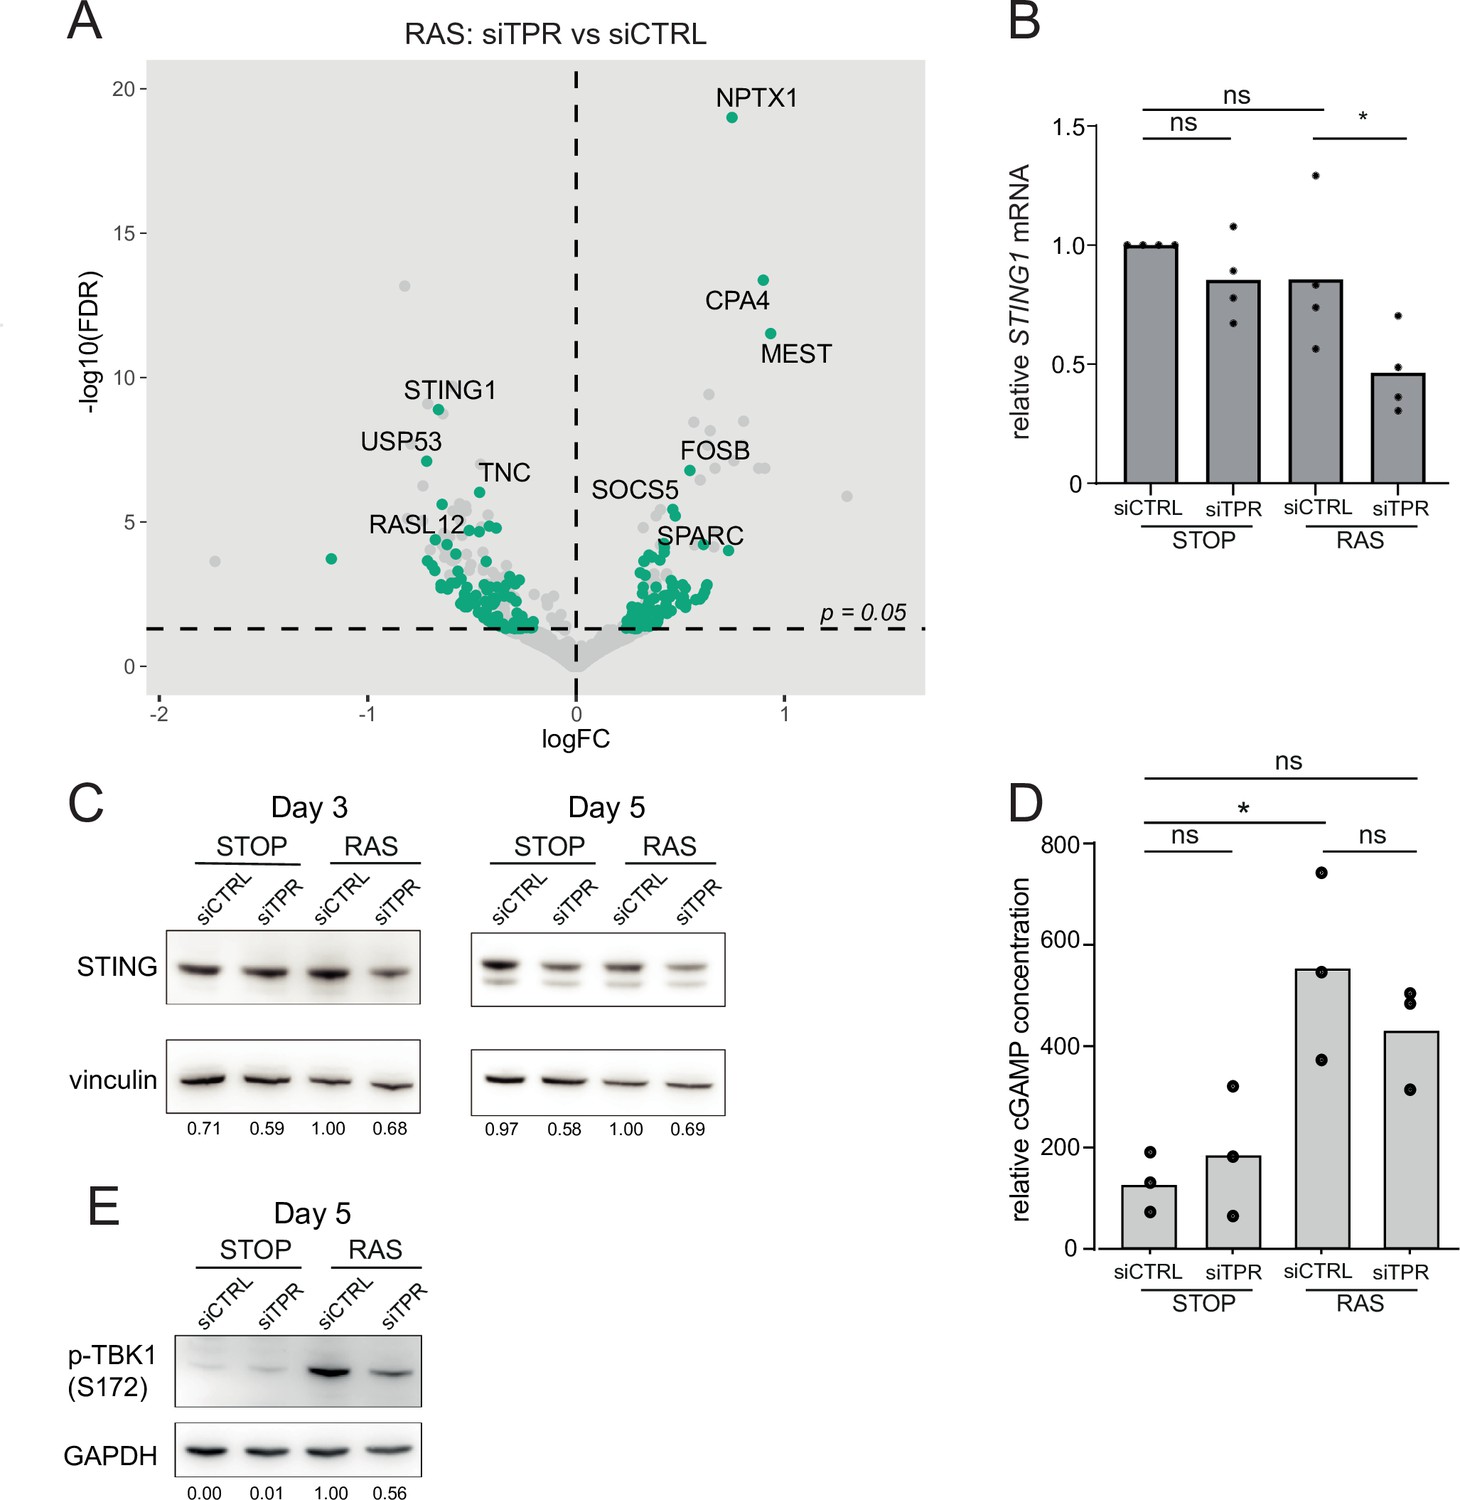
Decreased STING expression and TBK1 activation upon TPR knockdown during early stages of oncogene-induced senescence (OIS).
(A) Volcano plot of differential expression analysis of RNA isolated from RAS cells at day 3 (d3) of OIS and treated with siTPR vs siCTRL. Genes showing a significant change in expression in RAS, but not in STOP cells are indicated in green and the 10 most significant of these are labelled. Horizontal dashed line indicates an adjusted p-value (FDR) of 0.05. Axes are truncated for clarity so the change in TPR expression is not shown. (B) RT-qPCR for STING1 mRNA in RNA prepared from STOP and RAS cells treated with 4-hydroxytamoxifen (4-OHT) for 3 days and with control (siCTRL) and TPR siRNAs. Expression is relative to STOP cells treated with siCTRL and normalised to levels of GAPDH mRNA. Individual data points are the mean of three technical replicates for each of four biological replicates. Statistical data are in Figure 4—source data 1. (C) Immunoblots detecting STING in STOP and RAS cells treated with 4-OHT for 3 or 5 days and with control (siCTRL) or TPR siRNAs. Vinculin was used as a loading control. Numbers below indicate the ratio of band intensity for STING and the vinculin loading control with the ratio for RAS siCTRL normalised to 1.00. (D) ELISA for 2’3’-cGAMP in STOP and RAS cells treated with 4-OHT for 5 days and with control (siCTRL) or TPR siRNAs. cGAMP concentration was normalised to total protein concentration calculated using BCA assay. Statistical data are in Figure 4—source data 1. *p<0.05. (E) As in (C) but detecting phosphorylated TBK1 (pS172) in STOP and RAS cells at d5 of OIS. GAPDH was used as a loading control. Data from biological replicates for (C) and (E) are in Figure 4—figure supplement 1C and D.
-
Figure 4—source data 1
Statistical analysis for STING1 qPCR data in Figure 4B and for cGAMP ELISA data in Figure 4D.
One-way ANOVA was used to determine statistical significance followed by Šídák’s multiple comparisons test.
- https://cdn.elifesciences.org/articles/101702/elife-101702-fig4-data1-v3.docx
-
Figure 4—source data 2
Uncropped and labelled gels for Figure 4.
- https://cdn.elifesciences.org/articles/101702/elife-101702-fig4-data2-v3.zip
Figure 4—figure supplement 1
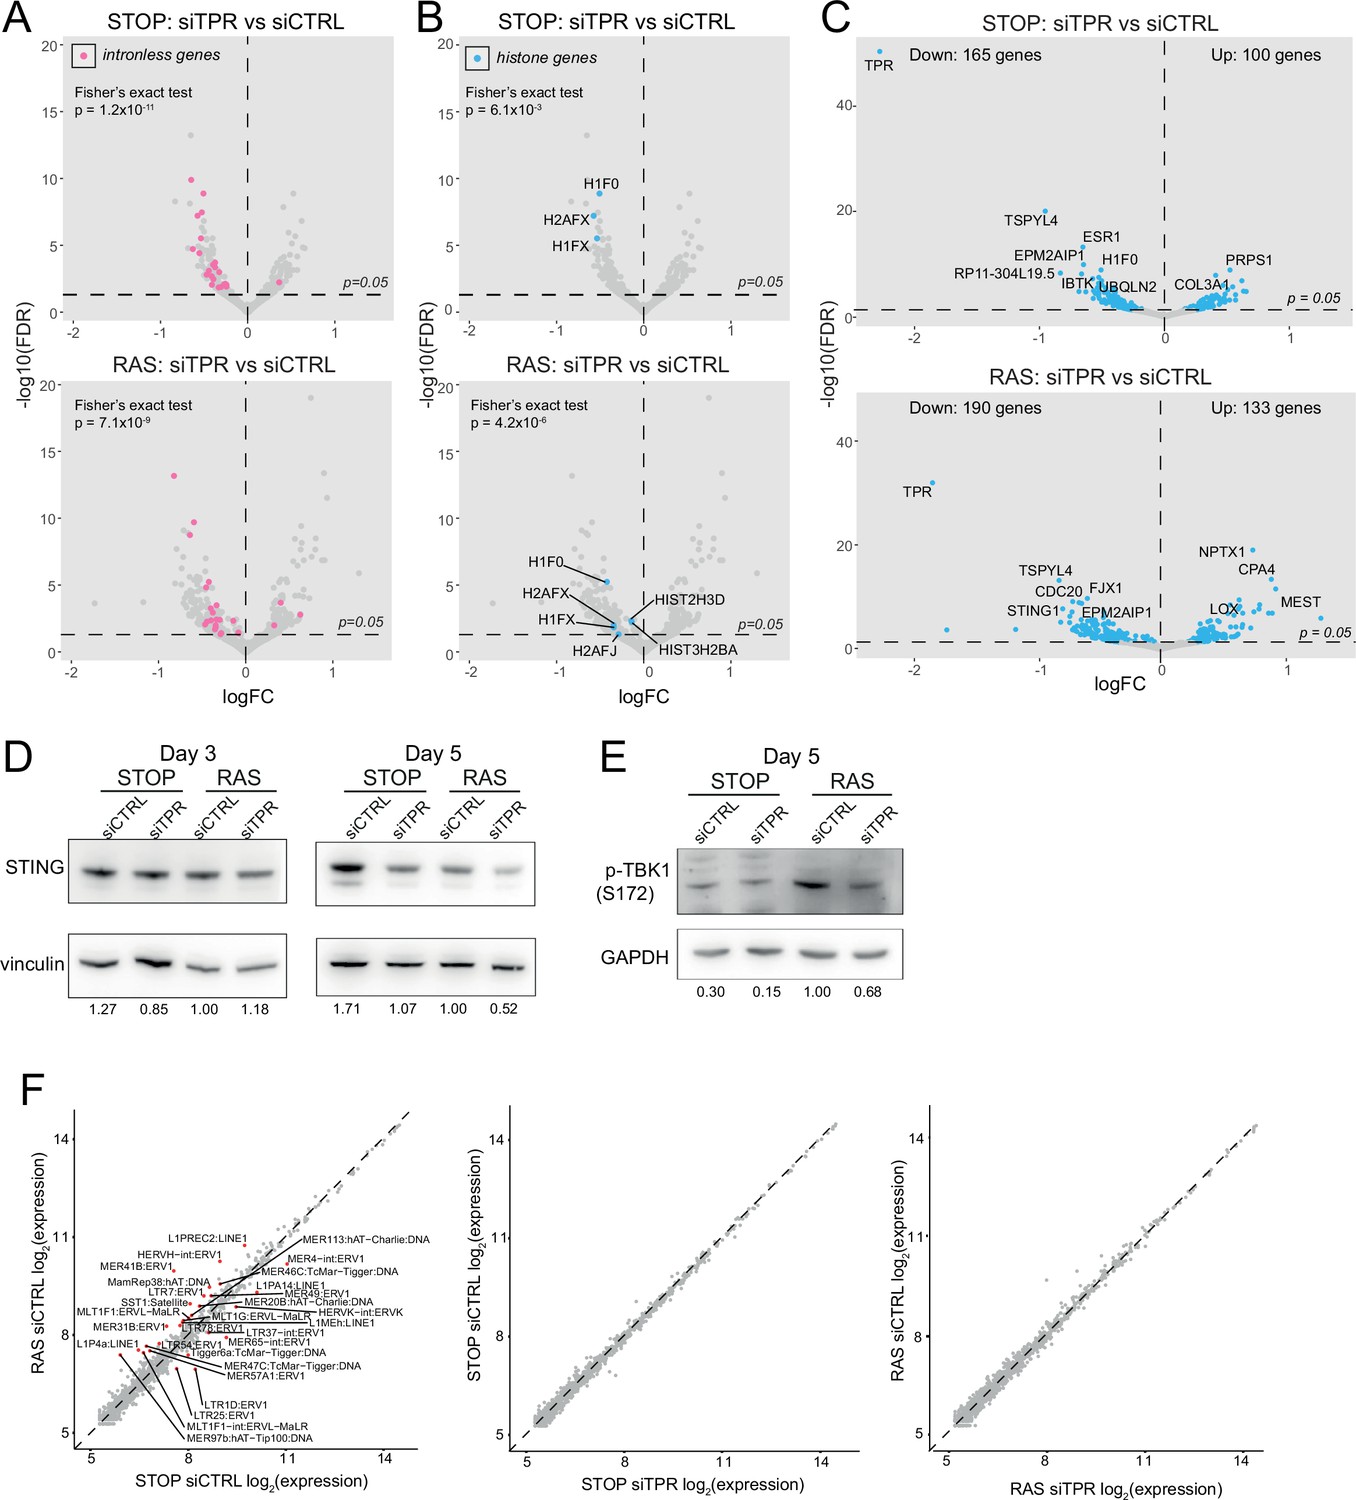
Decreased abundance of mRNAs for intronless genes and for STING1 in RAS cells upon TPR knockdown at day 3 (d3).
Related to Figure 4. (A) Volcano plots of differential expression analysis of d3 STOP (top) and RAS (bottom) cells treated with TPR vs CTRL siRNAs with intronless genes coloured pink. Horizontal dashed line indicates an adjusted p-value (FDR) of 0.05. Axes are truncated for clarity so change in expression for TPR is not shown. Fisher’s exact test (p) was carried out to determine whether the number of downregulated intronless genes was greater than expected by chance. (B) As in (A) but with histone genes labelled in blue. (C) Volcano plot showing differential expression analysis comparing siTPR vs siCTRL in d3 STOP (top) or RAS (bottom) cells. Blue dots indicate differentially expressed genes and the dashed horizontal line indicates an adjusted p-value of 0.05. The 10 genes with the most significant p-values are labelled. (D) Immunoblots detecting STING in STOP and RAS cells treated with 4-hydroxytamoxifen (4-OHT) for 3 or 5 days and with control (siCTRL) or TPR siRNAs. Vinculin was used as a loading control. Numbers below indicate the ratio of band intensity for STING and the vinculin loading control with the ratio for RAS siCTRL normalised to 1.00. Biological replicate of the data in Figure 4C. (E) As in (D) but detecting phosphorylated TBK1 (pS172) in STOP and RAS cells at d5 of oncogene-induced senescence (OIS). GAPDH was used as a loading control. Biological replicate of the data in Figure 4D. (F) Log-transformed RNA sequencing (RNA-seq) counts for RNAs transcribed from transposable elements comparing (left) RAS vs STOP cells at d3 and treated with control siRNAs; (middle) d3 STOP cells treated with control vs TPR siRNAs; (right) d3 RAS cells treated with control vs TPR siRNAs. Transposable elements with absolute fold changes>1.5 and adjusted p-values<0.05 are highlighted in red and labelled.
-
Figure 4—figure supplement 1—source data 1
Uncropped and labelled gels for Figure 4—figure supplement 1.
- https://cdn.elifesciences.org/articles/101702/elife-101702-fig4-figsupp1-data1-v3.zip
Figure 5
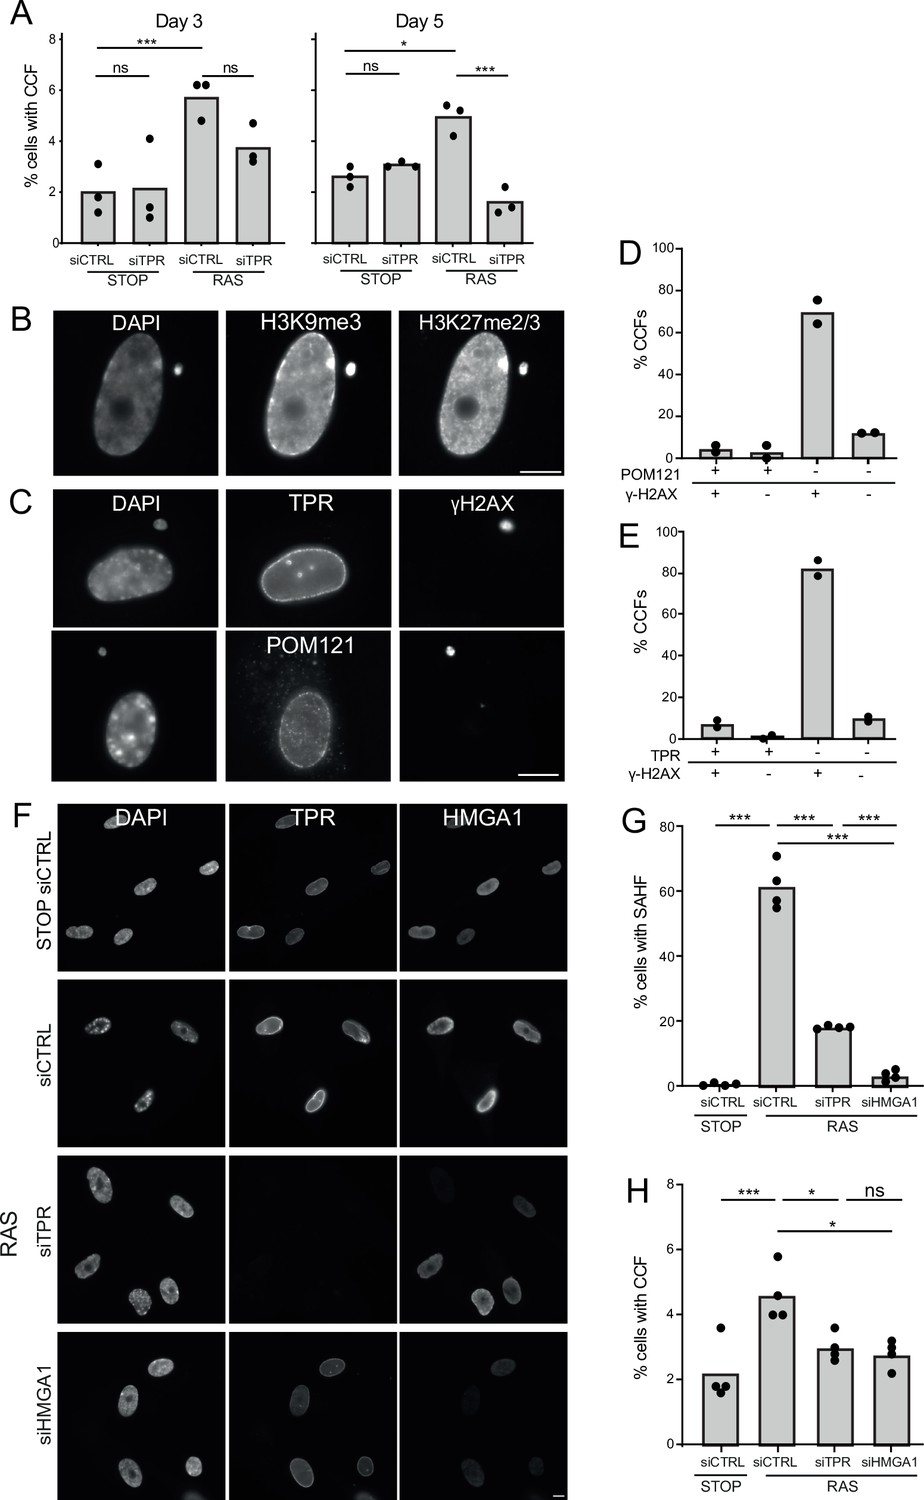
TPR and HMGA1 are required for the induction of cytoplasmic chromatin fragments (CCFs) during the early phase of oncogene-induced senescence (OIS).
(A) Mean percentage of cells containing CCFs in STOP and RAS cells at day 3 (d3) or d5 of OIS and treated with either control (siCTRL) or TPR siRNAs. Data points are for three biological replicates. Data were fitted to a generalised linear model before carrying out pairwise comparisons between samples. n.s. p>0.05, *<0.05, ***<0.001. (B) Immunostaining for H3K9me3 and H3K27me2/3 in a DAPI-stained d5 RAS cell with a CCF. Scale bar: 10 μm. (C) As in (B) but in d5 RAS cells containing CCFs and staining for γH2AX and either TPR (top) or POM121 (bottom). Scale bar: 10 μm. (D) Mean percentage of CCFs that show +ve or -ve staining for POM121 or γ-H2AX in d5 RAS cells. Data are from two biological replicates (n=49 and 67 CCFs). (E) Mean percentage of CCFs that show +ve or -ve staining for TPR or γ-H2AX in d5 RAS cells. Data are from two biological replicates (n=56 and 36 CCFs). (F) TPR and HMGA1 immunostaining in control (STOP) and OIS (RAS) cells after 4-hydroxytamoxifen (4-OHT) and siRNA (control, TPR and HMGA1) treatment for 5 days. Scale bar: 10 µm. (G) Mean percentage of cells containing senescence-associated heterochromatic foci (SAHF) in STOP and RAS cells at d5 of OIS and treated with either control (siCTRL), TPR, or HMGA1 siRNAs. Data points are for four biological replicates. Data were fitted to a generalised linear model before carrying out pairwise comparisons between samples. *** p<0.001. (H) Mean percentage of cells containing CCFs in cells treated as in (G). Data points are for four biological replicates. Data were fitted to a generalised linear model before carrying out pairwise comparisons between samples. n.s. p>0.05, *<0.05, ***<0.001. Statistical data from (A–G) are in Figure 5—source data 1.
-
Figure 5—source data 1
Statistical analysis for cytoplasmic chromatin fragments (CCF) and senescence-associated heterochromatic foci (SAHF) data in Figure 5A, G, and H.
Data were fitted to a generalised linear model before carrying out pairwise comparisons between samples. 500 cells were assessed per sample for each replicate of each experiment.
- https://cdn.elifesciences.org/articles/101702/elife-101702-fig5-data1-v3.docx
Author response image 1
Author response image 2

Tables
Appendix 1—key resources table
| Reagent type (species) or resource | Designation | Source or reference | Identifiers | Additional information |
|---|---|---|---|---|
| Cell line (Homo sapiens) | IMR90 STOP cells | Acosta et al., 2013 | Generated in the J-C Acosta lab | |
| Cell line (Homo sapiens) | IMR90 RAS cells | Acosta et al., 2013 | Generated in the J-C Acosta lab | |
| Antibody | anti-β-actin−HRP (mouse monoclonal) | Sigma-Aldrich | A3854 | WB (1:80000) |
| Antibody | anti-GAPDH (mouse monoclonal) | Abcam | ab125247, RRID:AB 11129118 | WB (1:5000) |
| Antibody | anti-phospho-Histone H2AX (Ser139) (mouse monoclonal) | Merck | 05–636 | IF (1:1000) |
| Antibody | anti-H3K27me2/me3 (mouse monoclonal) | Active Motif | #39536 RRID:AB_2793247 | IF (1:1000) |
| Antibody | anti-H3K9me3 (rabbit polyclonal) | Abcam | ab8898 RRID:AB_306848 | IF (1:2000) |
| Antibody | anti-IKKα (rabbit polyclonal) | Cell Signaling Technology | #2682 RRID:AB_331626 | WB (1:1000) |
| Antibody | anti phospho-IKKα/β (Ser176/180) (rabbit monoclonal) | Cell Signaling Technology | #2697 RRID:AB_2079382 | WB (1:1000) |
| Antibody | anti-NF-κB p65 (mouse monoclonal) | Santa Cruz | sc-8008 RRID:AB_628017 | WB (1:1000), IF (1:100) |
| Antibody | anti-NF-κB p65 (rabbit recombinant monoclonal) | Cell Signaling Technology | #8242 RRID:AB_10859369 | IF (1:500) |
| Antibody | anti-phospho- NF-κB p65 (Ser536) (rabbit recombinant monoclonal) | Cell Signaling Technology | #3033 RRID:AB_331284 | WB (1:500) |
| Antibody | anti-POM121 (rabbit polyclonal) | Genetex | GTX102128 RRID:AB_10732546 | IF (1:500) |
| Antibody | anti-STING (rabbit monoclonal) | Cell Signaling Technology | #13647 RRID:AB_2732796 | WB (1:2000) |
| Antibody | anti-phosphoTBK1 (Ser172) (rabbit monoclonal) | Cell Signaling Technology | #5483 RRID:AB_10693472 | WB (1:1000) |
| Antibody | anti-TPR (rabbit polyclonal) | Abcam | ab84516 | IF (1:500) |
| Antibody | anti-vinculin (rabbit polyclonal) | Abcam | ab91459 RRID:AB_2050446 | WB (1:5000) |
| Antibody | anti-rabbit IgG (H+L) secondary, Alexa Fluor 488 (goat polyclonal) | Invitrogen | A11034 | IF (1:1000) |
| Antibody | anti-mouse IgG (H+L) secondary, Alexa Fluor 568 (donkey polyclonal) | Invitrogen | A10037 | IF (1:1000) |
| Antibody | anti-rabbit IgG, HRP-linked (goat polyclonal) | Cell Signaling Technology | #7074 RRID:AB_2099233 | WB (1:2000) |
| Antibody | anti-mouse IgG, HRP-linked (horse polyclonal) | Cell Signaling Technology | #7076 RRID:AB_330924 | WB (1:2000) |
| Sequence-based reagent | siCTRL | Dharmacon | D-001810-10-59 | ON-TARGETplus siRNA pool |
| Sequence-based reagent | siTPR | Dharmacon | L-010548–00 | ON-TARGETplus siRNA pool |
| Sequence-based reagent | siHMGA1 | Dharmacon | L-004597–00 | ON-TARGETplus siRNA pool |
| Sequence-based reagent | STING1_Fwd | Dou et al., 2017 | RT-qPCR primer | ATATCTGCGGCTGATCCTGC |
| Sequence-based reagent | STING1_Rev | Dou et al., 2017 | RT-qPCR primer | TTGTAAGTTCGAATCCGGGC |
| Sequence-based reagent | GAPDH_Fwd | Dou et al., 2017 | RT-qPCR primer | CAGCCTCAAGATCATCAGCA |
| Sequence-based reagent | GAPDH_Rev | Dou et al., 2017 | RT-qPCR primer | TGTGGTCATGAGTCCTTCCA |
| Commercial assay or kit | Pierce BCA protein analysis kit | Thermo Fisher | 23225 | Methods: Immunoblotting |
| Commercial assay or kit | SuperSignal West Femto maximum sensitivity substrate kit | Thermo Fisher | 10095983 | Methods: Immunoblotting |
| Commercial assay or kit | 2’3’-cGAMP ELISA kit | Cayman Chemical | 501700 | Methods: 2’3’-cGAMP ELISA |
| Commercial assay or kit | RNeasy mini kit | Qiagen | 74104 | Methods: RT-qPCR and RNA seq library preparation |
| Commercial assay or kit | NEBNext Ultra II Directional RNA library prep kit | New England Biolabs | E7760 | Methods: RNA seq library preparation |
| Commercial assay or kit | NEBNext Poly(A) mRNA Magnetic Isolation Module | New England Biolabs | E7490 | Methods: RNA seq library preparation |
| Chemical compound, drug | 4-hydroxytamoxifen | Sigma | H7904 | |
| Other | H3K27ac ChIP-seq | Parry et al., 2018 | NCBI GEO: GSE103590 | See Figure 1—figure supplement 1 |
| Other | ATAC-seq | This paper | NCBI GEO: GSE264390 | See Methods |
| Other | RNA-seq | This paper | NCBI GEO: GSE264387 | See Methods |
| Software, algorithm | CellProfiler | Stirling et al., 2021 | RRID:SCR_007358 | |
| Software, algorithm | Micromanager | https://micromanager.org | Version 1.4 | |
| Software, algorithm | FastQC | RRID:SCR_014583 | ||
| Software, algorithm | cutadapt | Martin, 2011 | RRID:SCR_011841 | |
| Software, algorithm | bowtie2 | Langmead and Salzberg, 2012 | RRID:SCR_016368 | |
| Software, algorithm | MACS2 | Zhang et al., 2008; https://pypi.org/project/MACS2/ | ||
| Software, algorithm | HOMER | Heinz et al., 2010 | RRID:SCR_010881 | |
| Software, algorithm | edgeR | Robinson et al., 2010 | RRID:SCR_012802 | |
| Software, algorithm | limma | Ritchie et al., 2015 | RRID:SCR_010943 | |
| Software, algorithm | deepTools | Ramírez et al., 2016 | RRID:SCR_016366 | |
| Software, algorithm | GREAT | McLean et al., 2010 | RRID:SCR_005807 | |
| Software, algorithm | HISAT2 | Kim et al., 2019 | RRID:SCR_015530 | |
| Software, algorithm | GATK | Van der Auwera and O’Connor, 2020 | RRID:SCR_015530 | |
| Software, algorithm | subread | Liao et al., 2014 | RRID:SCR_009803 | |
| Software, algorithm | DeSeq2 | Love et al., 2014 | RRID:SCR_015687 | |
| Software, algorithm | clusterProfiler | Wu et al., 2021 | RRID:SCR_016884 | |
| Software, algorithm | ggplot2 | Wickham, 2016 | RRID:SCR_014601 | |
| Software, algorithm | TEtranscripts | Jin et al., 2015 | RRID:SCR_023208 |
Additional files
-
Supplementary file 1
Supplementary file 1a, b, and c are tables summarising data in the manuscript.
(a) Table summarising day 8 ATAC-seq changes in peak accessibility. Number of ATAC-peaks with significant changes generated from comparisons between samples using the limma package with an adjusted p-value cut-off of 0.05. Peaks significantly upregulated in RAS siCTRL compared to STOP siCTRL (SEN+) were further divided into TPR-dependent (SEN+TPR+) and TPR-independent (SEN+TPR-) as shown. (b) Table indicating the proximity of senescence-associated secretory phenotype (SASP) gene promoters to TPR-dependent, senescence-dependent ATAC-seq peaks. Distance (in bp) between TPR+SEN+ ATAC-seq peaks from the transcription start site (TSS) of genes involved in positive regulation of the inflammatory response, cytokine activity, and cytokine receptors. (c) Table summarising day 3 ATAC-seq changes in peak accessibility. Number of peaks with significant changes generated from comparisons between samples using the limma package with an adjusted p-value cut-off of 0.05.
- https://cdn.elifesciences.org/articles/101702/elife-101702-supp1-v3.docx
-
MDAR checklist
- https://cdn.elifesciences.org/articles/101702/elife-101702-mdarchecklist1-v3.docx
Download links
A two-part list of links to download the article, or parts of the article, in various formats.
Downloads (link to download the article as PDF)
Open citations (links to open the citations from this article in various online reference manager services)
Cite this article (links to download the citations from this article in formats compatible with various reference manager tools)
TPR is required for cytoplasmic chromatin fragment formation during senescence
eLife 13:e101702.
https://doi.org/10.7554/eLife.101702


