Activity-dependent synapse elimination requires caspase-3 activation
- Janelia Research Campus, Howard Hughes Medical Institute, United States
Figures
Figure 1 with 4 supplements
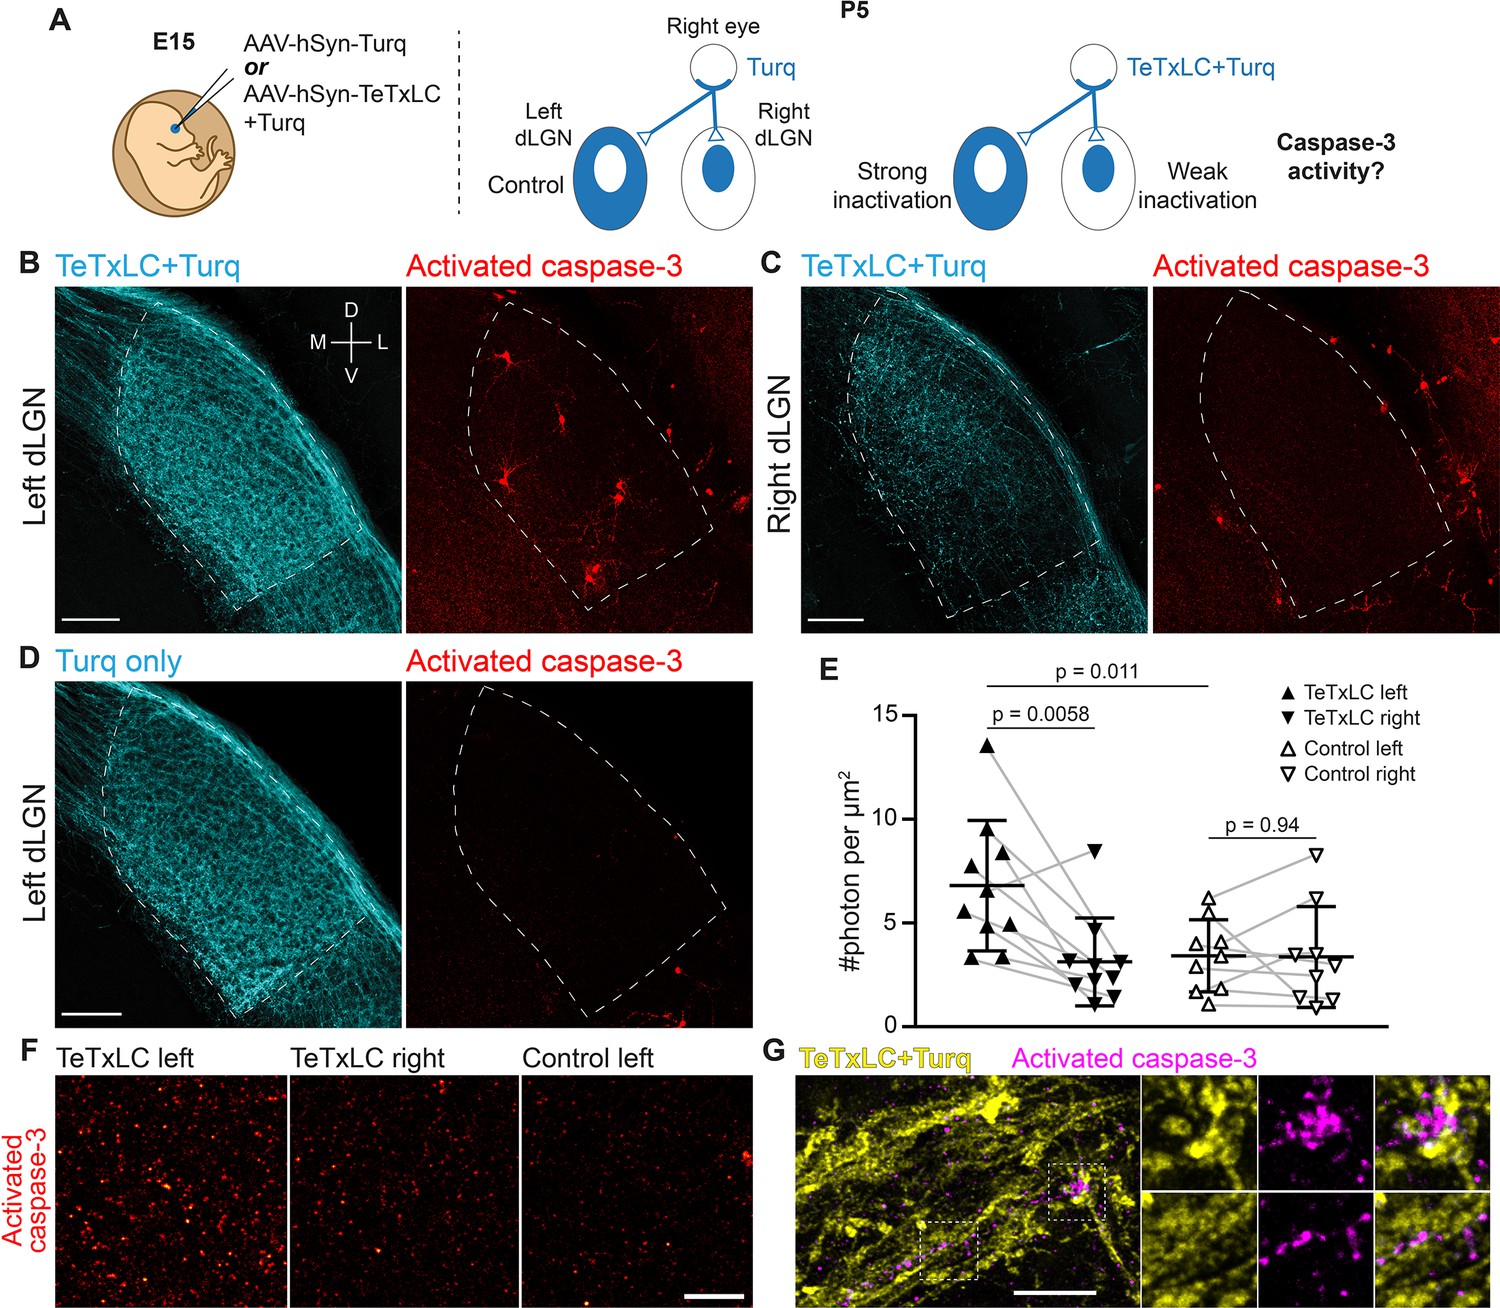
Inactivation of retinogeniculate synapses induces caspase-3 activity.
(A) Schematics of experimental setup. Adeno-associated viruses (AAVs) expressing tetanus toxin light chain (TeTxLC) and/or mTurquoise2 (Turq) were injected into the right eye of E15 mice (left). By P5, retinogeniculate synapses in dorsal lateral geniculate nuclei (dLGN) were inactivated to varying extents depending on injection and side (right). (B–D) Confocal images of Turq (left panels) and activated caspase-3 (right panels) in left dLGN (B) and right dLGN (C) of a TeTxLC-injected P5 animal and in left dLGN of a control P5 animal (D). Dotted lines delineate dLGN boundaries. Only signals within dLGNs were analyzed. Images from the same fluorescent channel were adjusted to the same contrast. The compass in (B) marks tissue orientation. Scale bars: 100 μm. D, dorsal; V, ventral; M, medial; L, lateral. (E) Quantification of caspase-3 activity in indicated dLGNs. Activated caspase-3 signals in each dLGN (highlighted areas in B–D) were summed and normalized to dLGN area. Each point represents the result from one dLGN. Data from two dLGNs of the same animal were paired for analysis (gray lines). n=10 for TeTxLC-injected animals and n=9 for control animals. Mean and standard deviation (S.D.) are shown. p-values were calculated from two-tailed t-tests (paired when applicable). (F) Example images showing punctate caspase-3 activities in ventral-medial regions of indicated dLGNs. Images were adjusted to the same contrast. Scale bar: 20 μm. (G) High-resolution images of dLGN showing TeTxLC-expressing RGC axons (yellow) and activated caspase-3 (magenta). Two regions of interest (dotted squares) are magnified to illustrate that caspase-3 activity was found juxtaposing TeTxLC-expressing axon terminals but not within them. Scale bar: 5 μm.
Figure 1—figure supplement 1
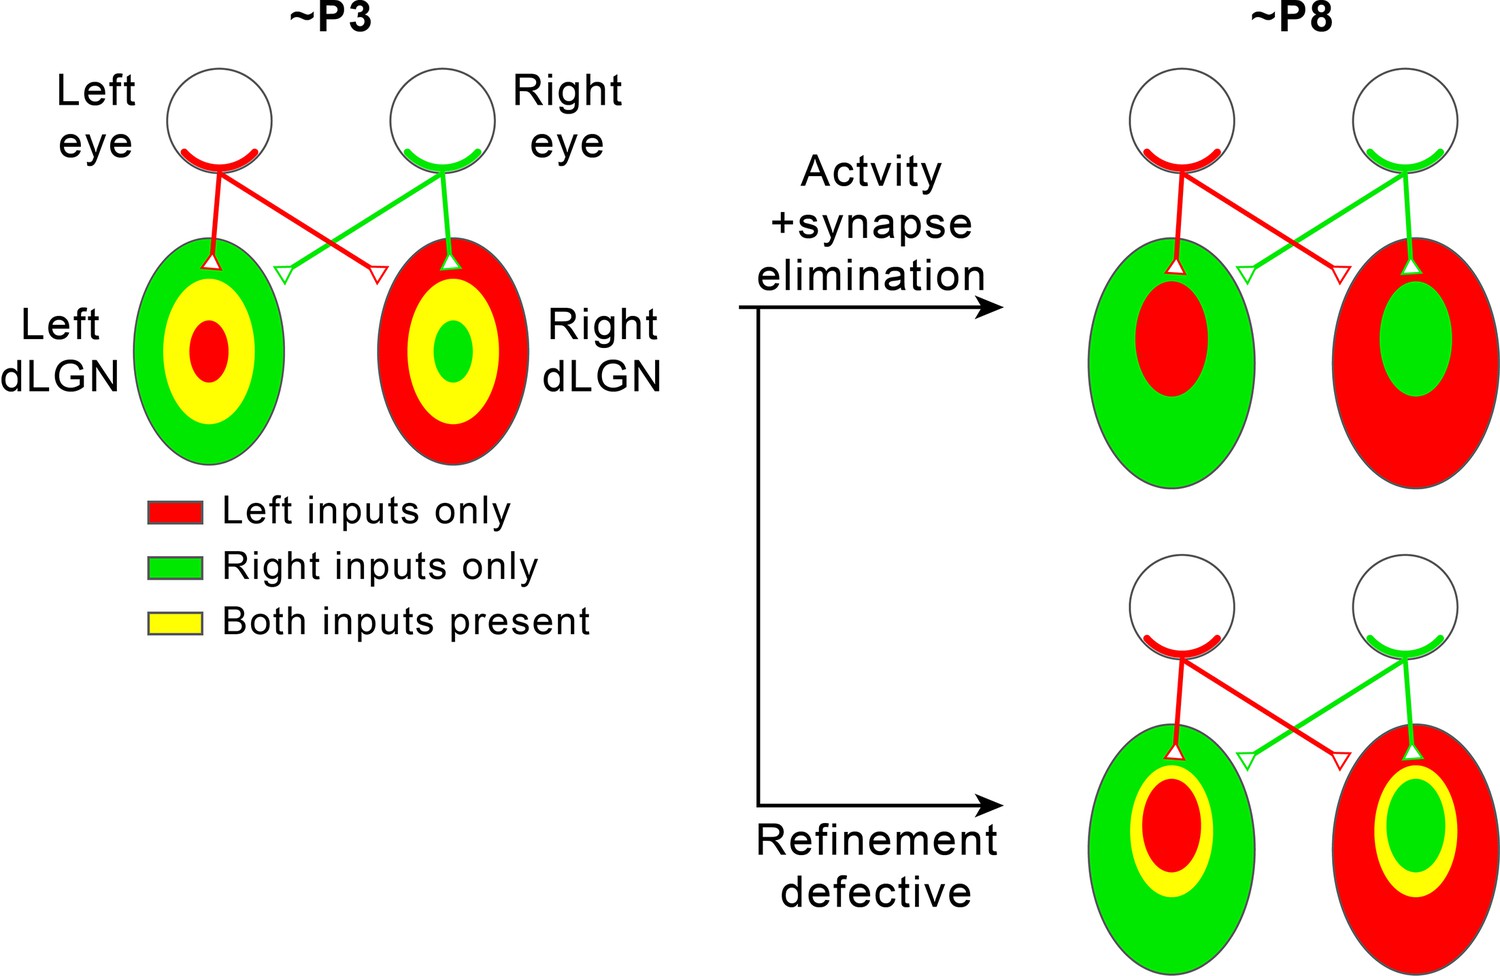
Segregation of eye-specific territories in the mouse retinogeniculate pathway.
In the mouse retinogeniculate pathway, retinal ganglion cells (RGCs) in the retina of each eye innervate relay neurons in both the contralateral (opposite side as the originating RGC) dorsal lateral geniculate nucleus (dLGN) and the ipsilateral (same side from the originating RGC) dLGN to form retinogeniculate synapses (upper right). Within each dLGN, the majority of retinogeniculate synapses receive inputs from the contralateral eye, while the minority receive inputs from the ipsilateral eye (upper right). At the age of P3, regions in each dLGN receiving inputs from each of the two eyes overlap significantly (left). Through a process that requires synapse elimination and spontaneous RGC activity, these regions are refined into non-overlapping eye-specific territories by the age of P8 (upper right). If the refinement process is defective because neural activity or synapse elimination is disrupted, eye-specific territories fail to completely segregate, and regions innervated by the two eyes remain overlapping (lower right).
Figure 1—figure supplement 2
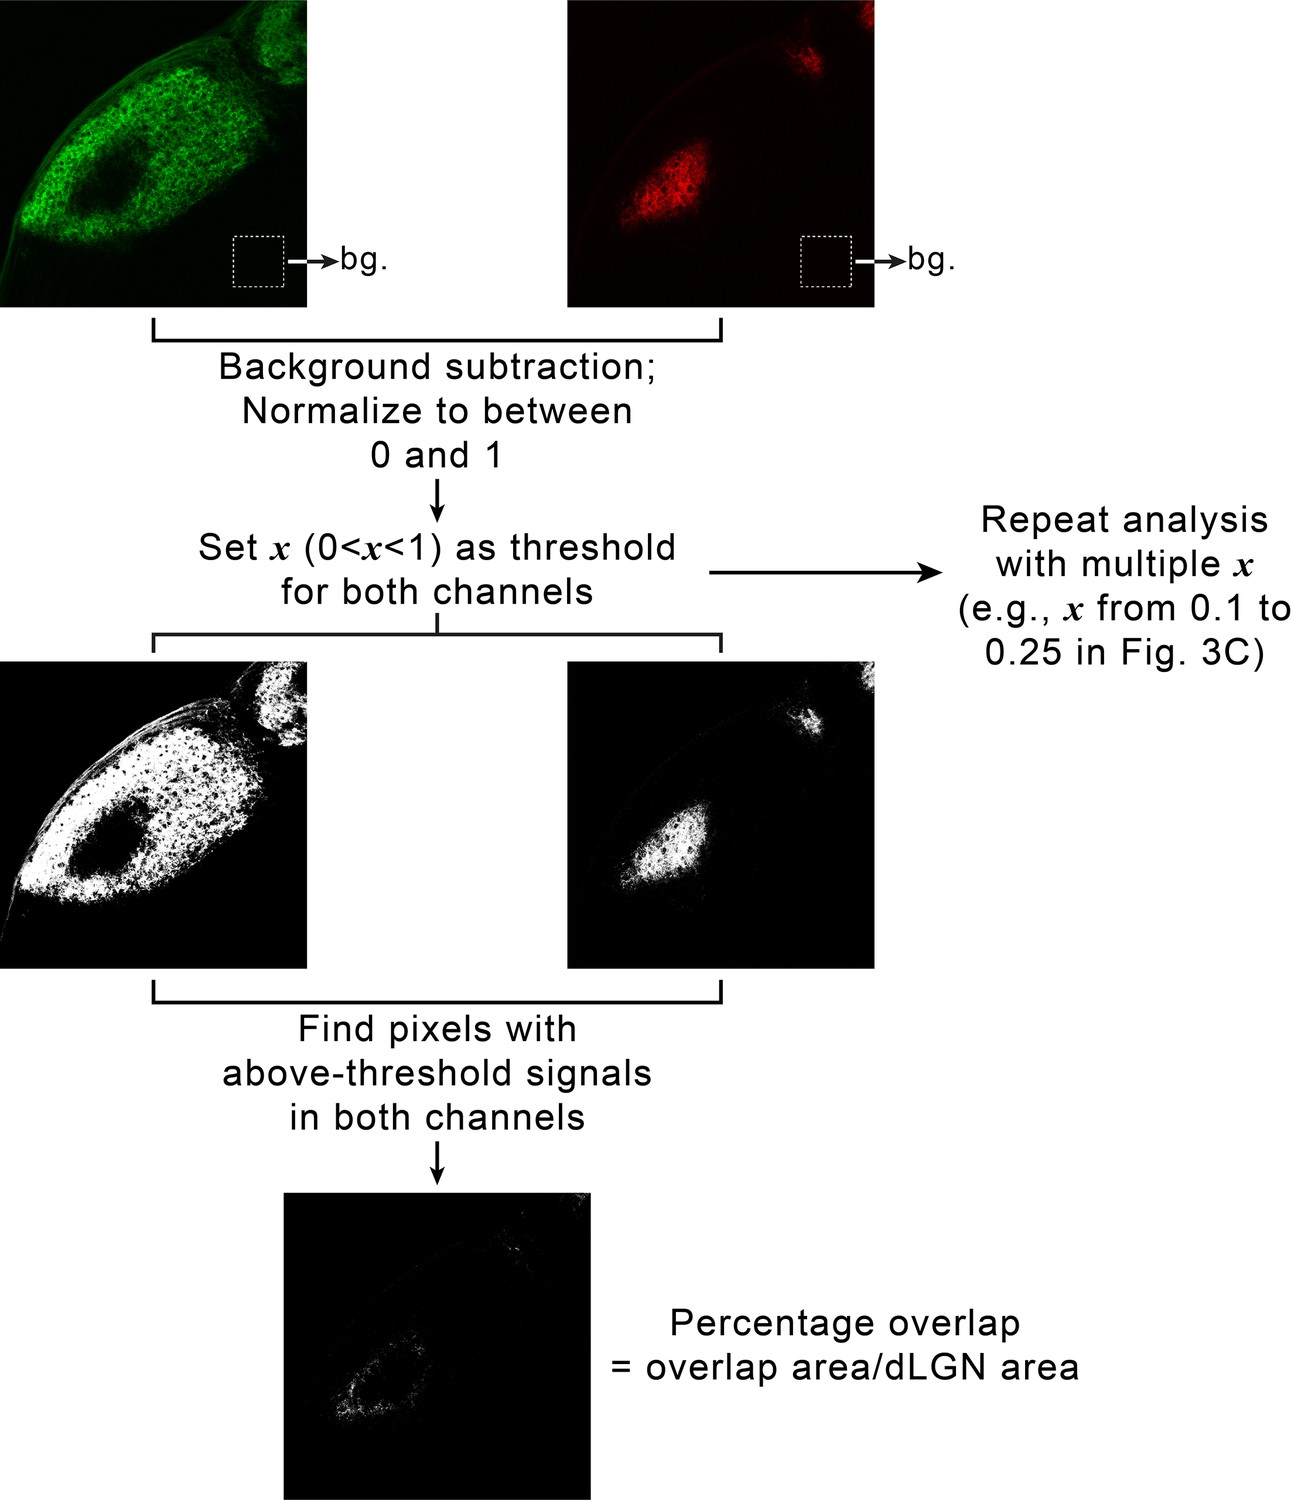
Quantifying eye-specific segregation with multi-threshold overlap analysis.
For each dorsal lateral geniculate nuclei (dLGN), retinal ganglion cell (RGC) inputs from the two eyes were imaged using separate fluorescence channels. A small area in the thalamus outside of each dLGN was chosen, and average signal intensity in each channel within that area was calculated and used as background (upper panel). For each channel, background was subtracted, and signals were normalized to between 0 and 1. To calculate overlap between eye-specific territories, a threshold, x, was chosen between 0 and 1 and applied to both channels (middle panel). The overlap between eye-specific territories were defined as the set of pixels with above-threshold signals in both channels. Percentage overlap was then calculated as the ratio between the area of the dLGN where eye-specific territories overlapped and the total area of the dLGN (lower panel). To avoid introducing biases by artificially selecting one threshold, we repeated the analysis with a set of increasingly stringent thresholds (e.g. from 0.1 to 0.25 in Figure 3C and D).
Figure 1—figure supplement 3
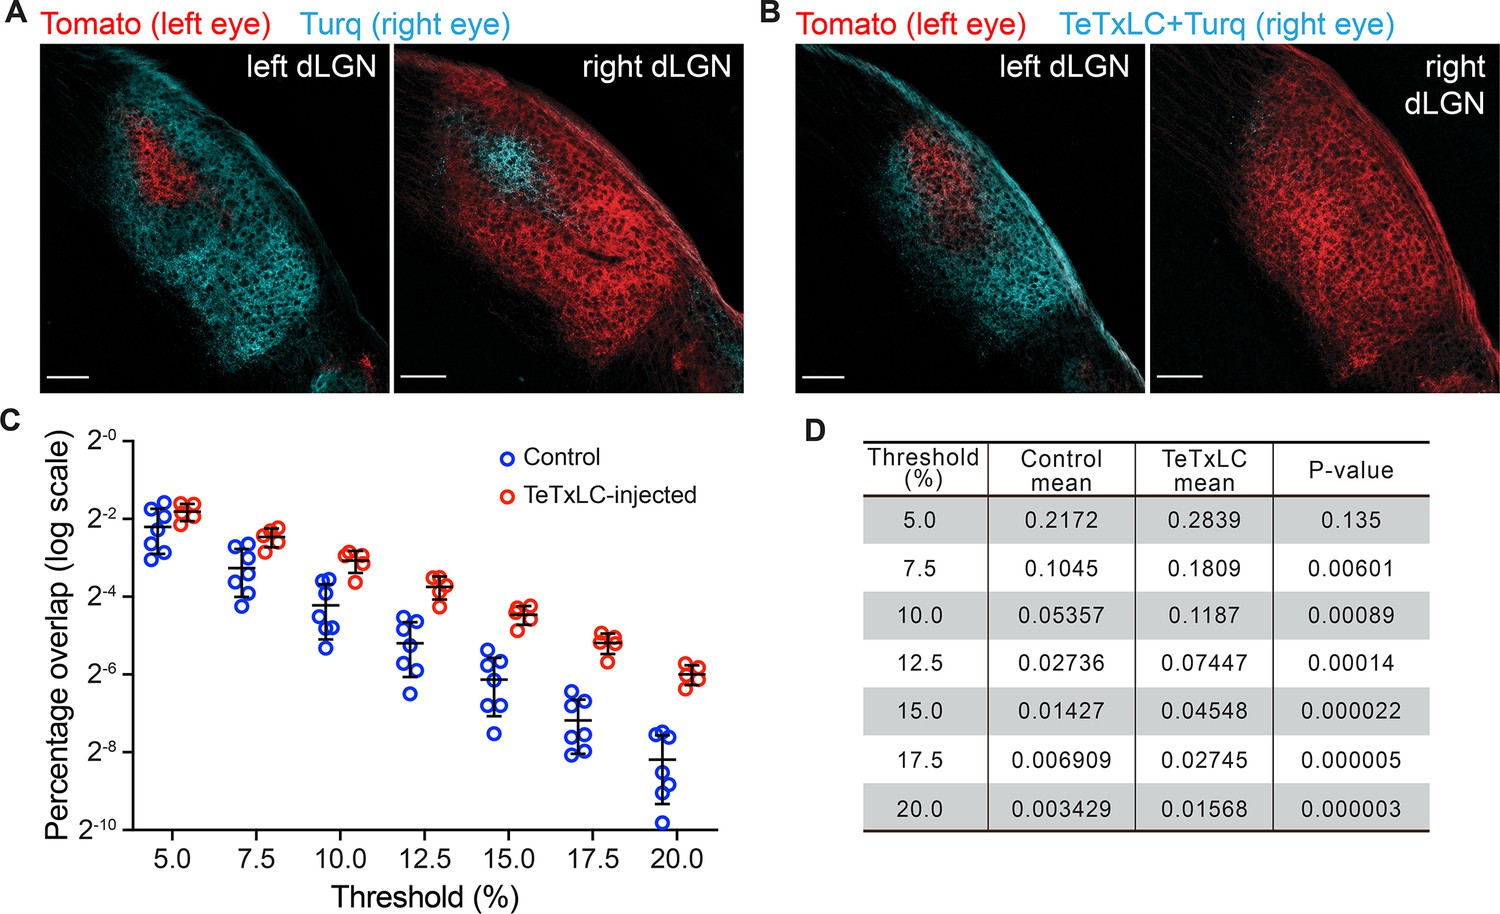
Mono-ocular blockage of retinal ganglion cell (RGC) activity with tetanus toxin light chain (TeTxLC) disrupts eye-specific segregation.
(A and B) Confocal images of P8 dorsal lateral geniculate nucleus (dLGNs) in animals receiving either control injections (A) or TeTxLC injections in the right eye (B). RGC inputs were labeled with tdTomato (red, input from left eyes) or mTurquoise2 (cyan, input from right eyes) to visualize eye-specific territories. The territory of right eye inputs (cyan) contracted relative to that of left eye inputs (red) in TeTxLC-injected animals. Scale bars: 100 μm. (C) Quantification of overlap between eye-specific territories in dLGNs of control and TeTxLC-injected animals. Analysis was done at multiple thresholds to avoid biases introduced with threshold selection. Percentage overlap is displayed on a log scale. n=7 for control animals and 5 for TeTxLC-injected animals. Mean and S.D. are shown. (D) Statistics of the multi-threshold analysis showing the percentage overlap in the two groups of animals at each threshold. p-values for the difference between control and TeTxLC-injected animals were calculated from two-tailed t-tests. Note that the statistical significance increased with more stringent thresholds. We did not implement multiple comparison corrections as values at different thresholds are derived from the same dataset and are not independent.
Figure 1—figure supplement 4
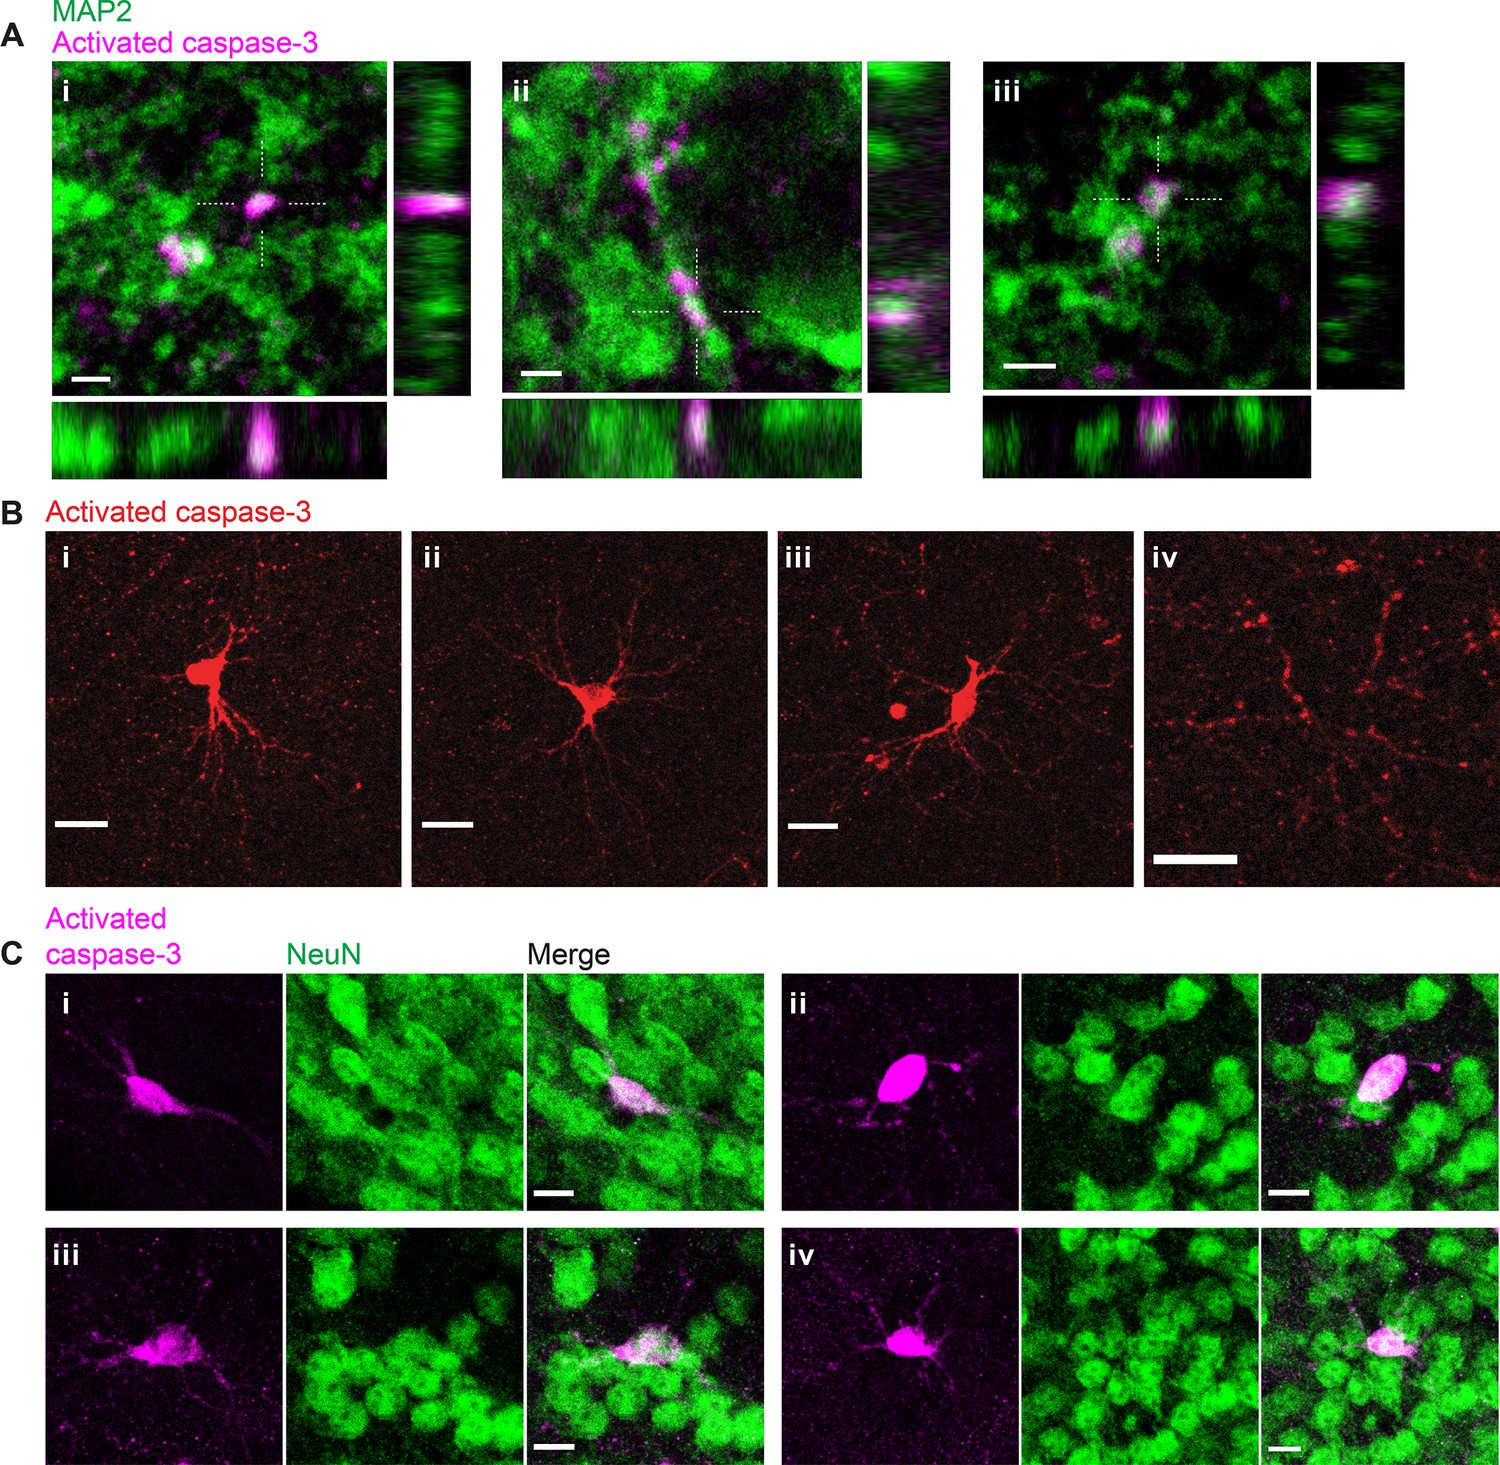
Inactivation of retinogeniculate synapses induces postsynaptic caspase-3 activity in dendritic compartments of dorsal lateral geniculate nuclei (dLGN) relay neurons.
(A) High-resolution images of three representative field-of-views (i-iii) in P5 tetanus toxin light chain (TeTxLC)-expressing dLGNs showing co-localization of punctate caspase-3 activity (magenta) and a dendritic marker, MAP2 (green). Dotted crosses mark x and y positions where the x-z and y-z cross-sections were generated. Scale bars: 2 μm. (B) Example images showing caspase-3 activity in entire neurons (i-iii) or in multiple dendritic branches (but not in the soma) of a neuron (iv) in P5 TeTxLC-expressing dLGNs. The neurons positive for active caspase-3 (i-iii) have relatively large and round somas and multipolar dendritic arbors that are characteristic of dLGN relay neurons. Scale bars: 20 μm. (C) Example images of four representative neurons (i–iv) in P5 TeTxLC-expressing dLGNs that are positive for active caspase-3 (magenta) and a neuronal nuclear marker, NeuN (green). Scale bars: 10 μm.
Figure 2 with 1 supplement
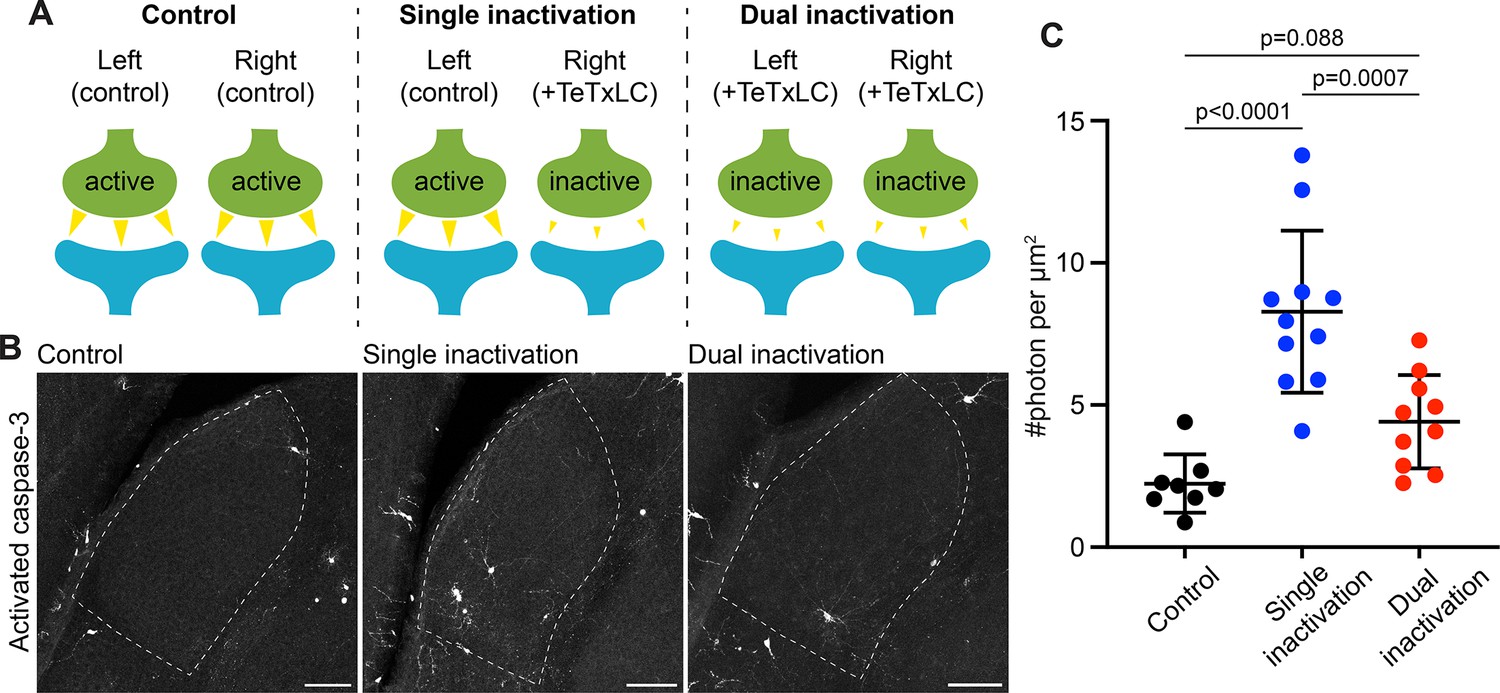
Caspase-3 activation at weak synapses requires the presence of strong synapses.
(A) Schematics illustrating experimental conditions. No synapses are inactivated in the control (left); only synapses from right eyes are inactivated in single inactivation condition (middle); synapses from both right and left eyes are inactivated in dual inactivation condition (right). (B) Confocal images of P5 left side dorsal lateral geniculate nucleus (dLGNs) in the three conditions showing caspase-3 activity in the dLGN. Dotted lines mark dLGN boundaries. Scale bars: 100 μm. (C) Quantification of dLGN caspase-3 activity in the indicated conditions. Caspase-3 activity in each dLGN were summed and normalized to the dLGN area. For the single inactivation condition, values were from left dLGNs only. For the other two conditions, values from both dLGNs were averaged. n=8 animals for control, n=11 animals for single inactivation, and n=10 animals for dual inactivation. Mean and S.D. are shown. P-values were calculated from Tukey’s multiple comparison tests.
Figure 2—figure supplement 1
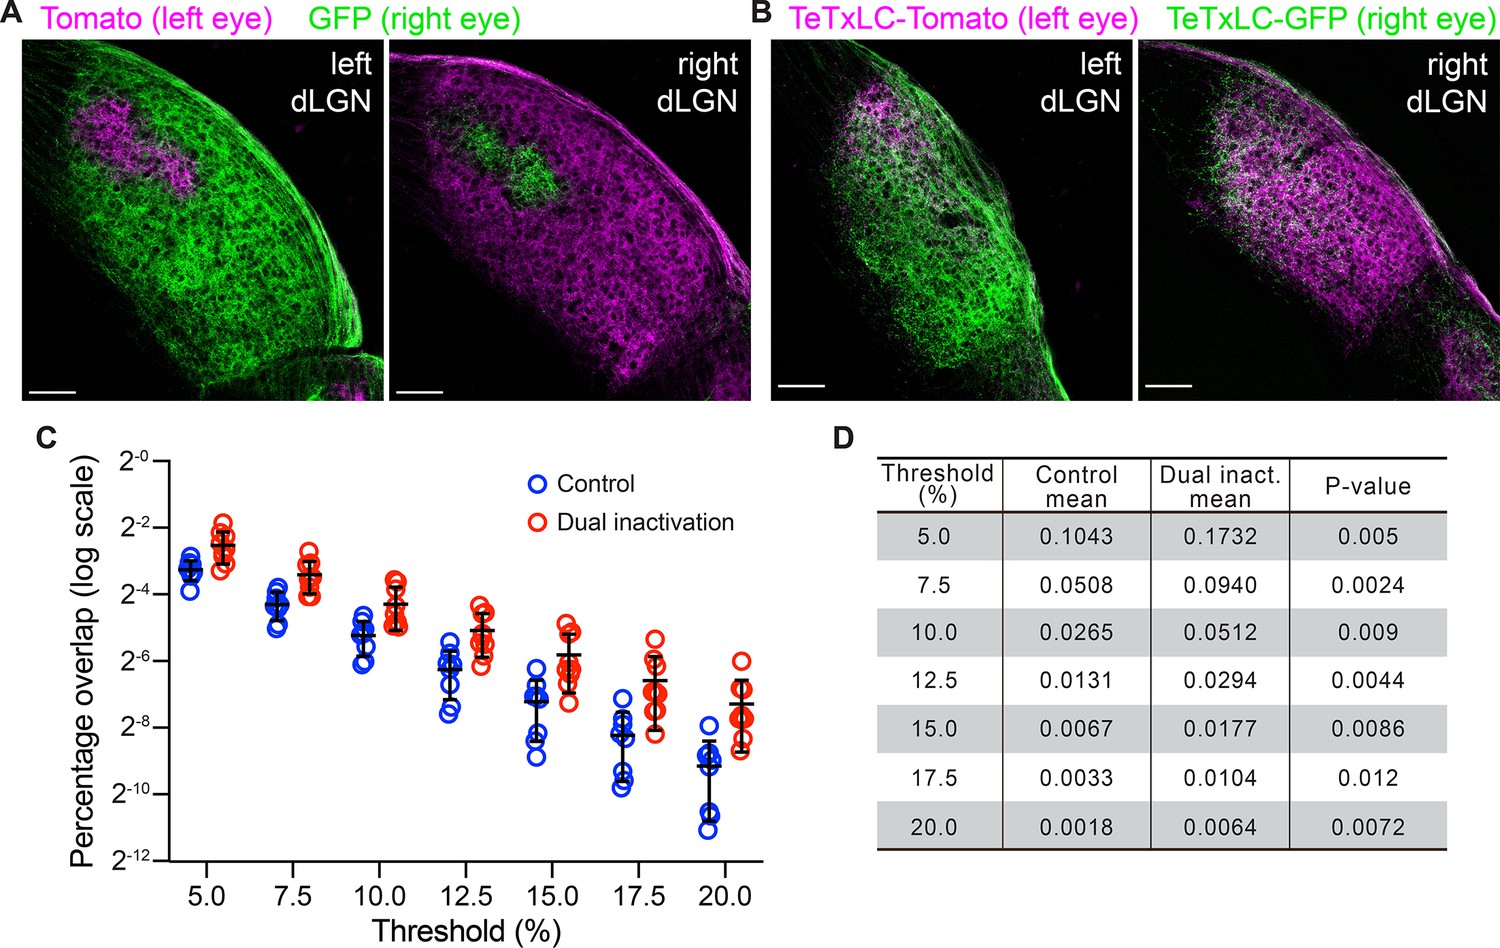
Bi-ocular blockage of retinal ganglion cell (RGC) activity with tetanus toxin light chain (TeTxLC) disrupts eye-specific segregation.
(A and B) Confocal images of P10 dorsal lateral geniculate nucleus (dLGNs) of animals receiving control injections in both eyes (A) or TeTxLC injections in both eyes (B). Eye-specific territories were labeled with tdTomato (magenta, RGC inputs from the left eye) or eGFP (green, RGC inputs from the right eye). Scale bars: 100 μm. (C) Quantification of overlap between eye-specific territories in dLGNs of animals receiving control or TeTxLC injections in both eyes. n=8 for control animals and n=9 for dually TeTxLC-injected animals. Mean and S.D. are shown. (D) Statistics of the overlap analysis at multiple thresholds. p-values were calculated from two-tailed t-tests. We did not implement multiple comparison corrections as values at different thresholds are derived from the same dataset and are not independent.
Figure 3 with 2 supplements
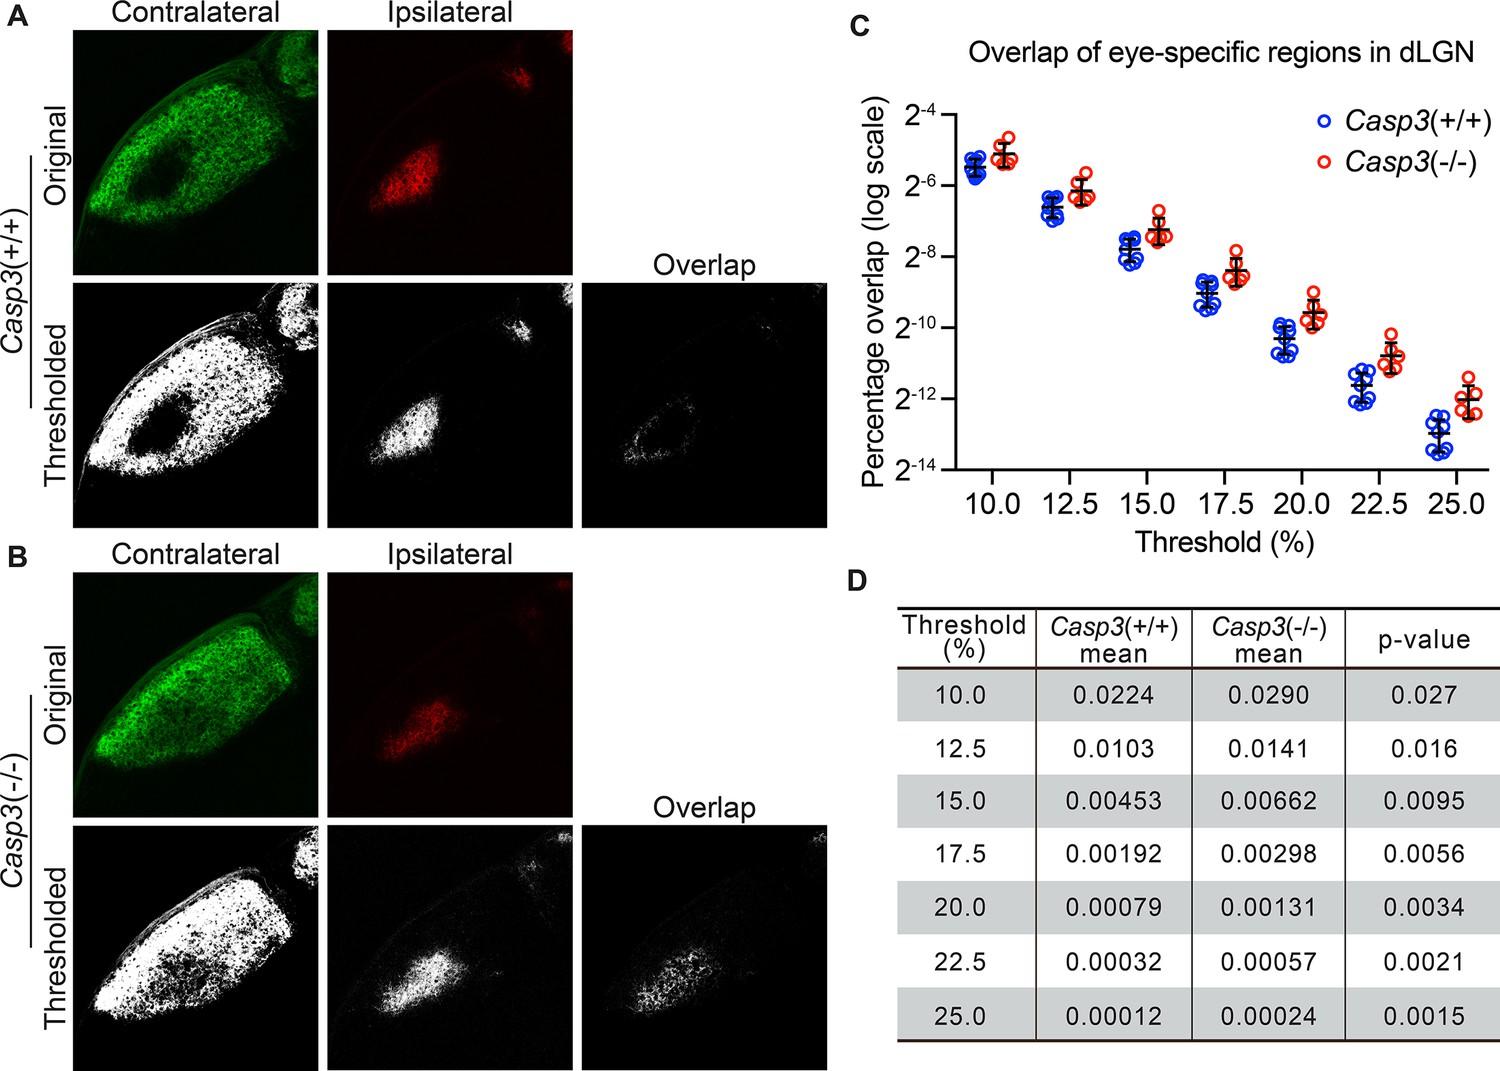
Caspase-3 is required for segregation of eye-specific territories.
(A–B) Representative confocal images of retinogeniculate inputs in the dorsal lateral geniculate nuclei (dLGN) of P10 wild-type (A) and Casp3-/- (B) mice. Contralateral inputs are labeled with AlexaFluor488 (AF488) conjugated cholera toxin subunit B (CTB) and ipsilateral inputs with AF594-CTB. Original images were thresholded into 0-or-1 images using the Otsu method (Suzuki et al., 2001), and the overlap between thresholded contralateral and ipsilateral inputs is shown. (C) Percentage overlap between eye-specific territories in wild-type and Casp3-/- mice under a series of increasing signal cutoff thresholds. Note that the percentage overlap is plotted on a log scale. Each circle represents one animal. Mean and S.D. are shown. n=9 for wild-type mice and n=6 for Casp3-/- mice. (D) Mean percentage overlap values in wild-type and Casp3-/- mice and p-values of two-tailed t-tests between the two genotypes are listed for each cutoff threshold.
Figure 3—figure supplement 1
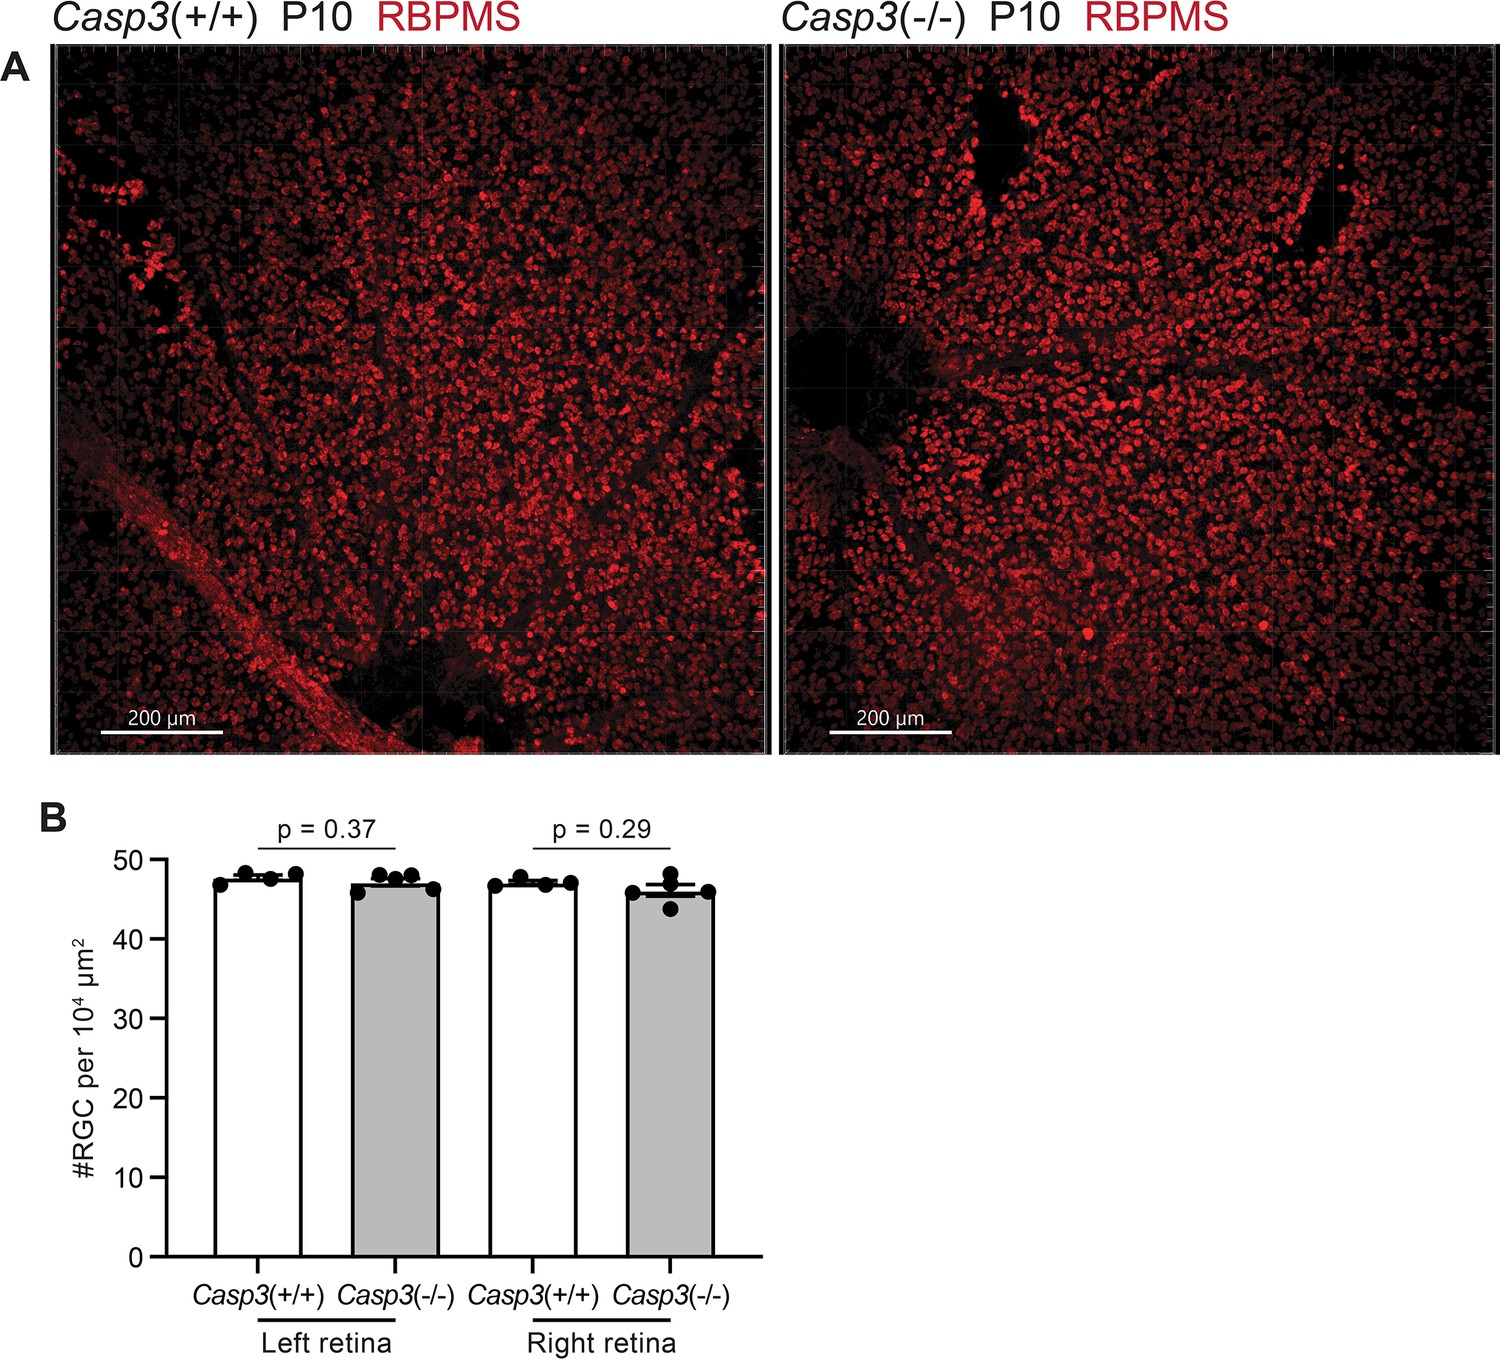
Caspase-3 deficiency does not alter retinal ganglion cell (RGC) density in the retina.
(A) Images of whole-mount retinae from P10 Casp3+/+ (left) and Casp3-/- (right) animals. RGCs were labeled in red by immunostaining against an RGC-specific marker, RBPMS (RNA-binding protein with multiple splicing) (Rossi et al., 2001). The dark regions on the bottom of the left panel and on the left of the right panel are optic discs. Scale bars: 200 μm. (B) Quantification of RGC densities in retinae of P10 Casp3+/+ and Casp3-/- animals. Each point represents one retina. Left and right retinae were analyzed separately. n=4 animals for Casp3+/+ mice and n=5 animals for Casp3-/- mice. Mean and S.D. are shown. p-values were calculated from unpaired two-tailed t-tests.
Figure 3—figure supplement 2
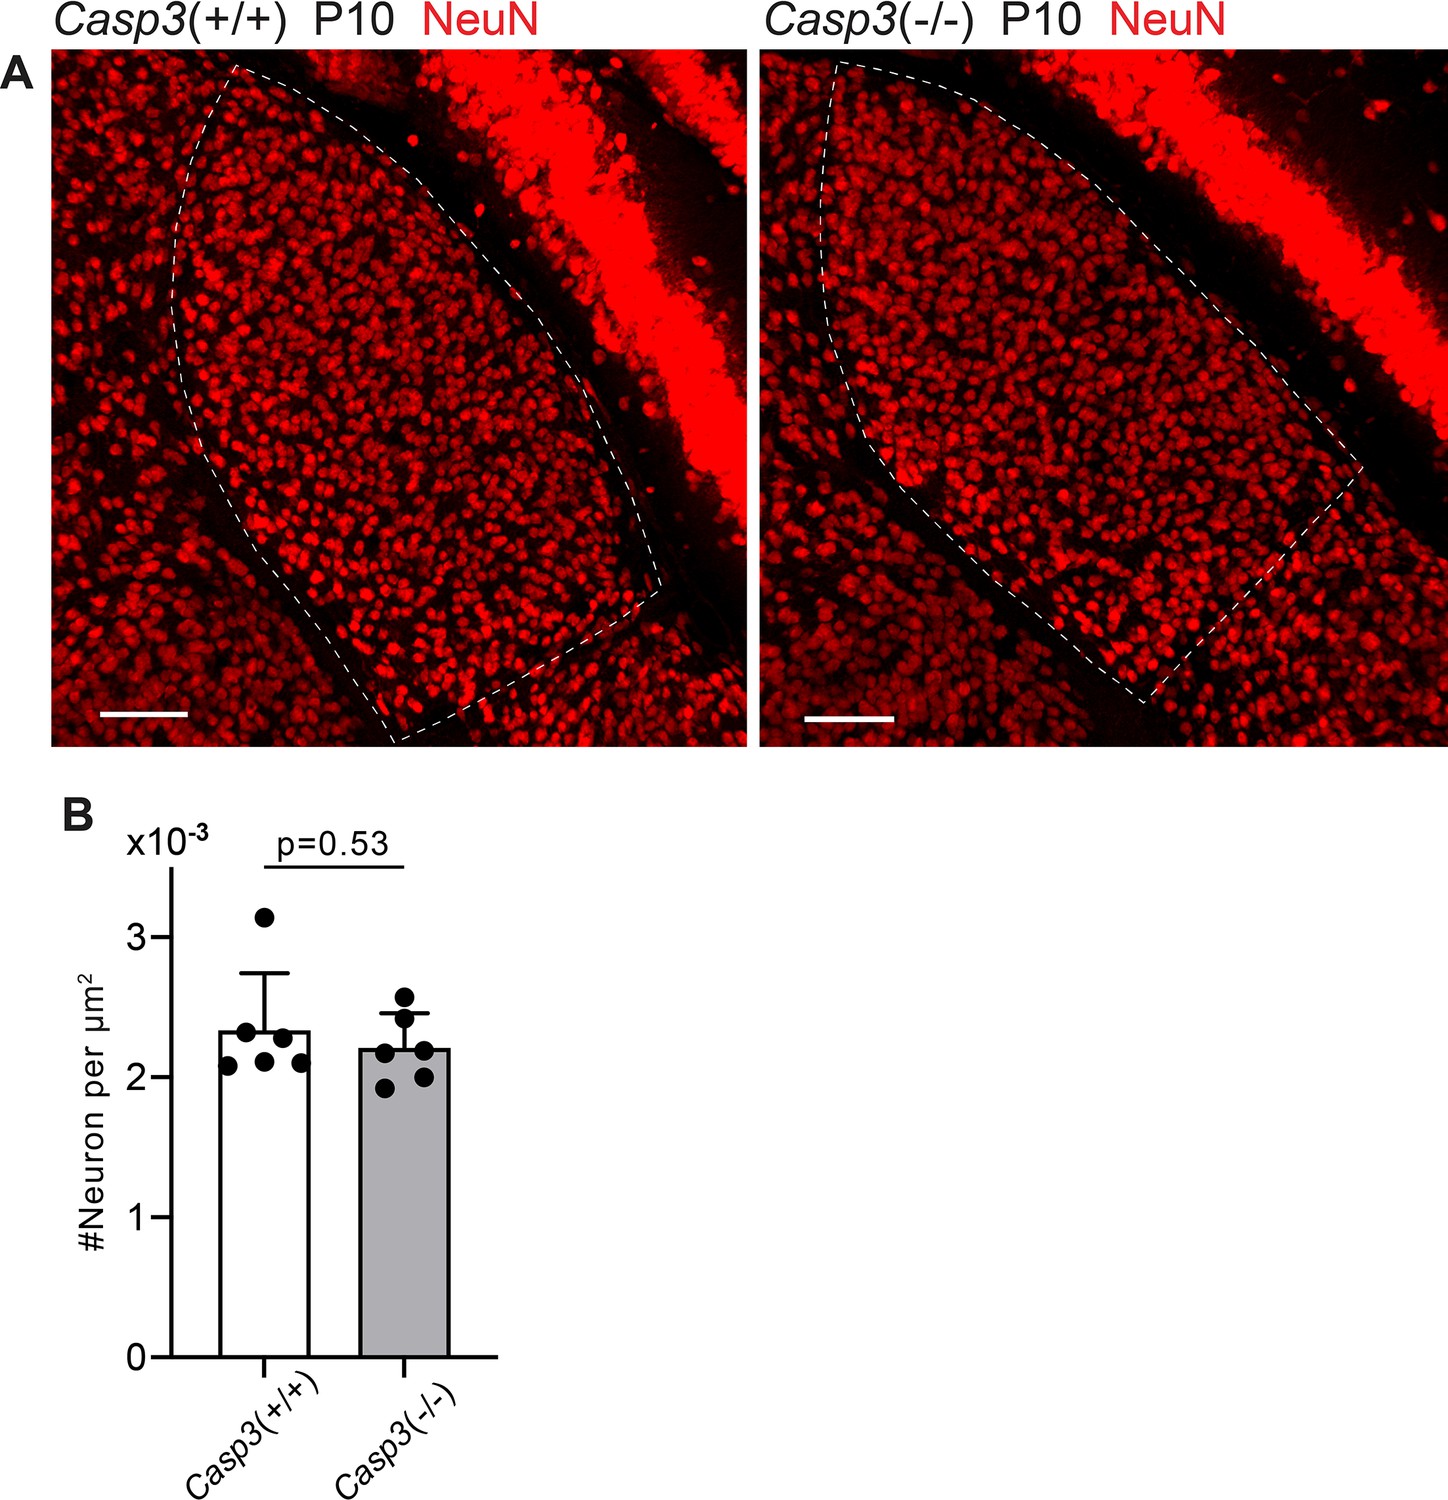
Caspase-3 deficiency does not alter relay neuron density in the dorsal lateral geniculate nuclei (dLGN).
(A) Images of dLGNs of P10 Casp3+/+ (left) and Casp3-/- (right) animals. Dashed lines mark the dLGN boundaries. Relay neurons were labeled by immunostaining against NeuN. Scale bars: 100 μm. (B) Quantification of dLGN relay neuron densities in P10 Casp3+/+ and Casp3-/- mice. Each point represents one animal. n=6 animals for Casp3+/+ mice and n=6 animals for Casp3-/- mice. Mean and S.D. are shown. p-values were calculated from unpaired two-tailed t-tests.
Figure 4 with 2 supplements
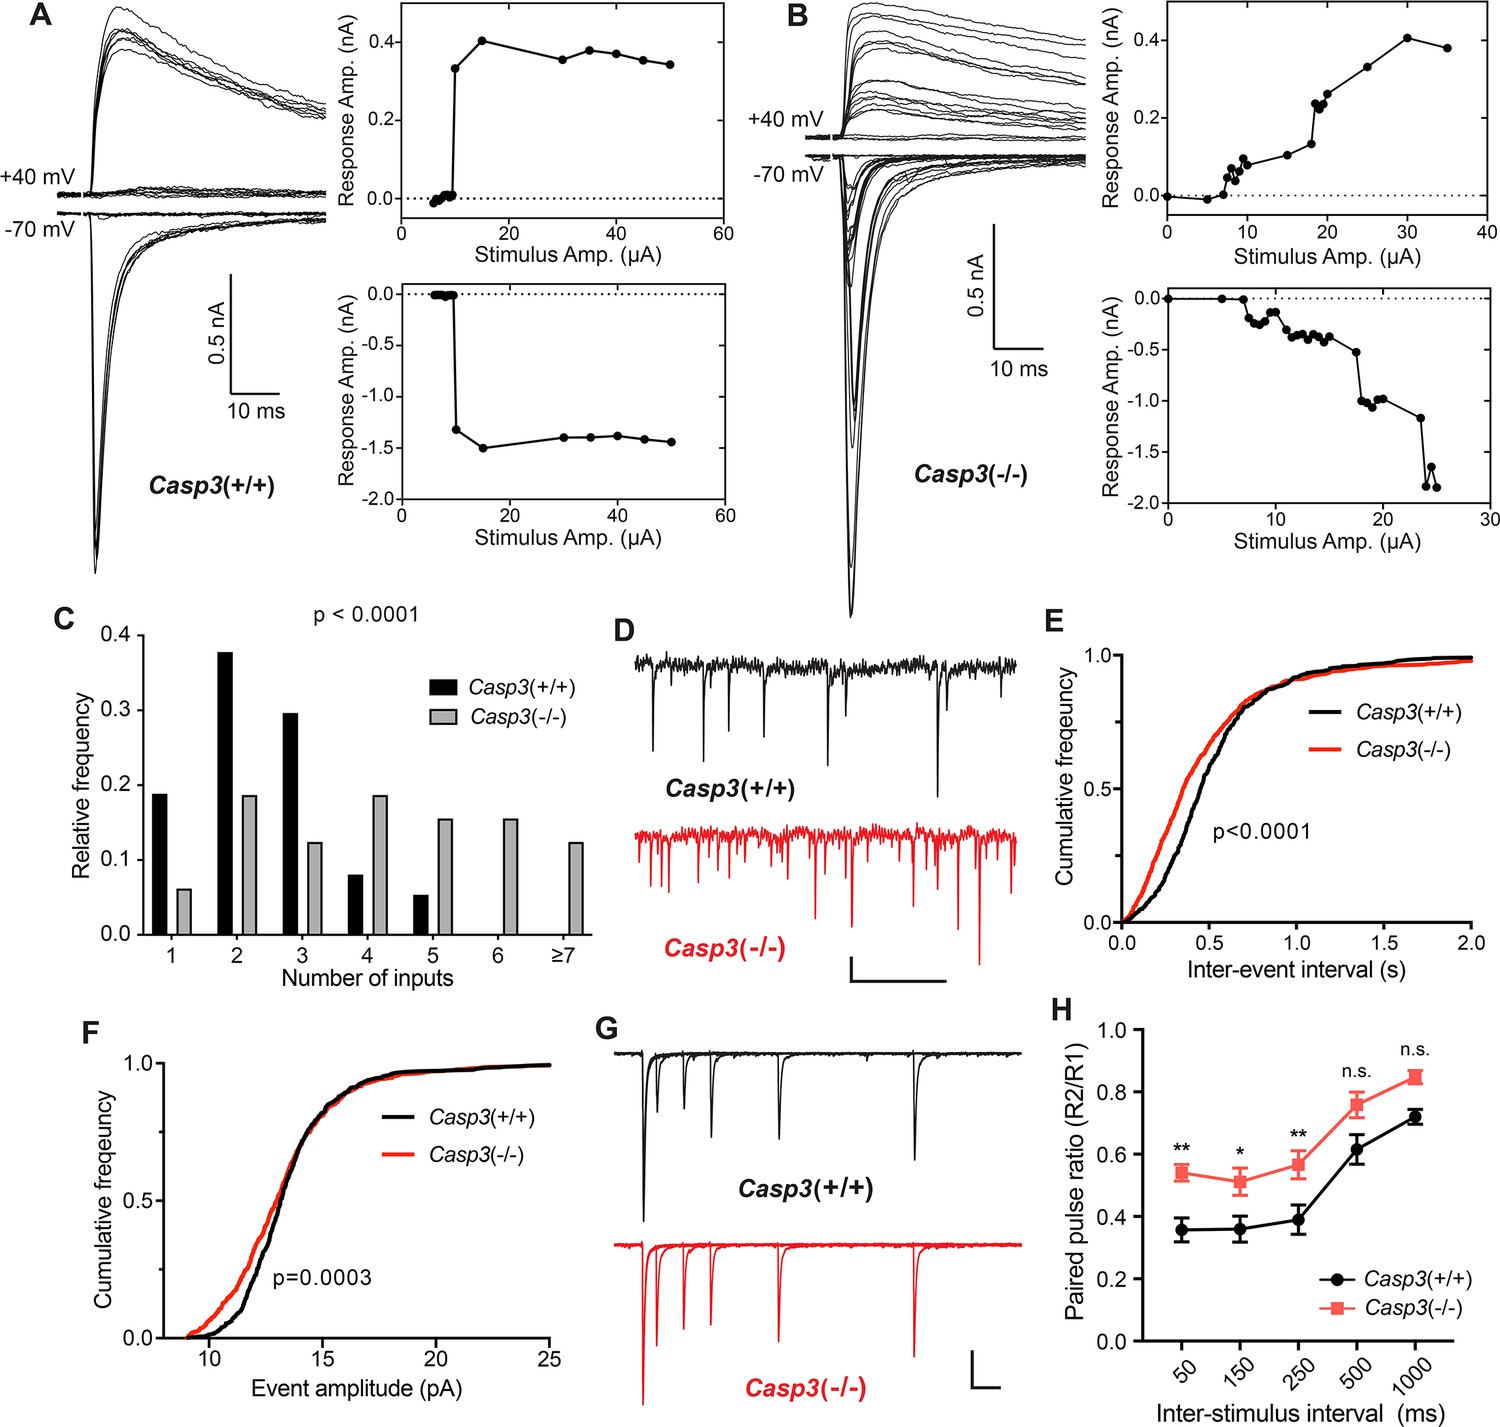
Caspase 3 is required for retinogeniculate circuit refinement.
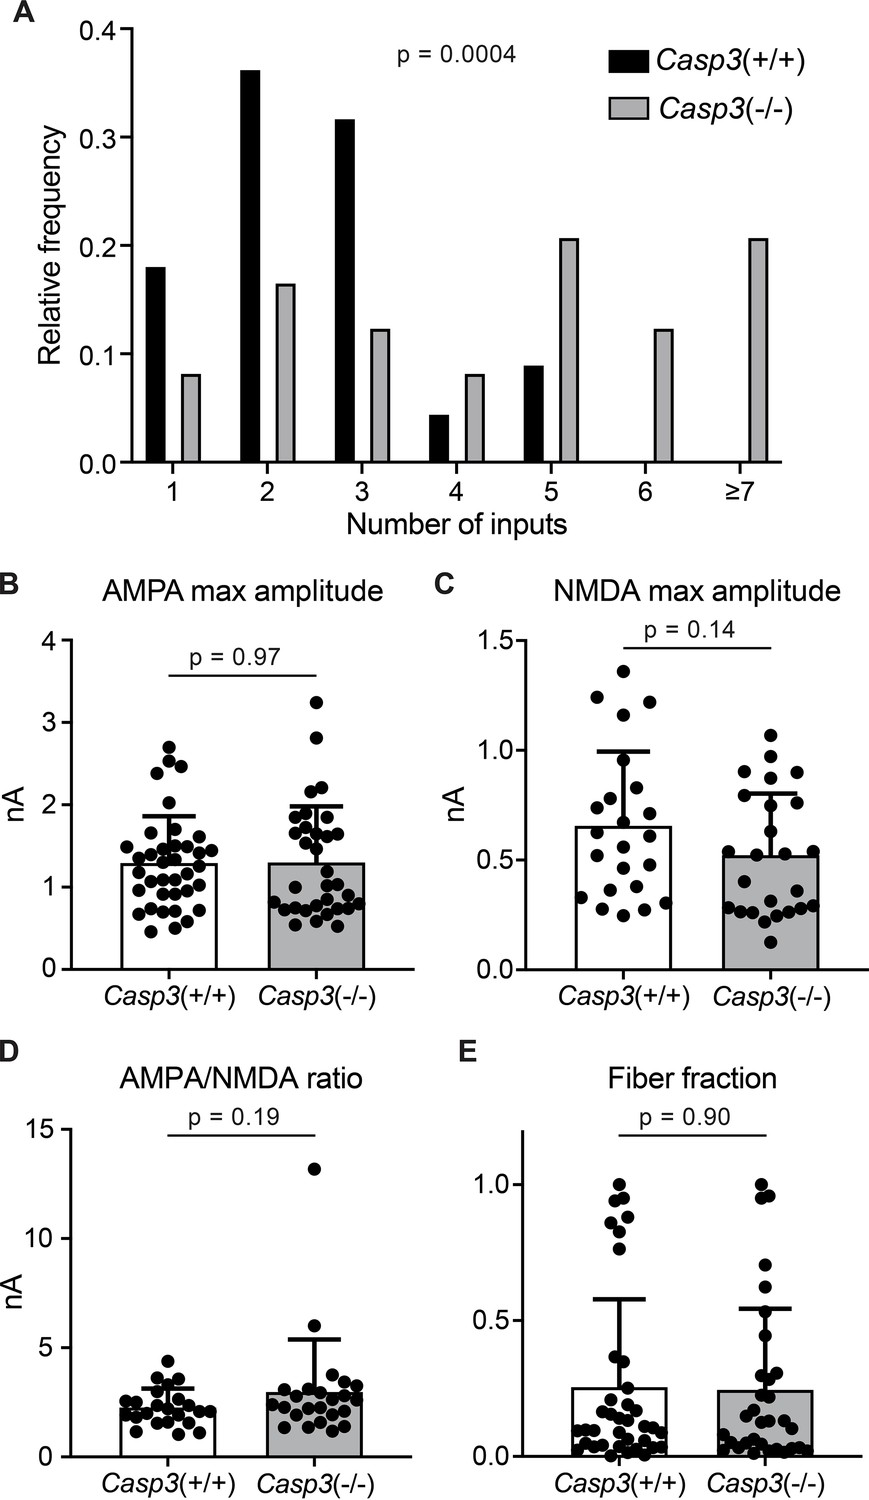
(A–B) Example recordings of dorsal lateral geniculate nuclei (dLGN) relay neuron responses in P30 wild-type (A) and Casp3-/- (B) mice. Excitatory postsynaptic currents (EPSCs) were evoked by increasing stimulation currents in the optic tract. Both AMPAR-mediated inward current at –70 mV membrane potential and AMPAR and NMDAR-mediated outward current at +40 mV membrane potential are shown. Peak response amplitudes at each stimulation intensity are plotted to the right of recording traces. Scale bars represent 0.5 nA and 10 ms. (C) Distribution of retinal ganglion cell (RGC) input numbers on individual dLGN relay neurons in wild-type and Casp3-/- mice. The number of RGC inputs was inferred by manually counting the number of steps in AMPAR-mediated EPSC response curves (lower right in A and B) while blind to the genotypes. p-value was calculated from two-tailed t-test. n=37 cells from 22 wild-type mice and n=32 cells from 16 Casp3-/- mice. (D) Example recordings of mEPSC measurements from wild-type and Casp3-/- mice. Scale bars represent 0.5 s (horizontal) and 5 pA (vertical). (E–F) Cumulative distribution curves of inter-mEPSC intervals (E) and mEPSC amplitudes (F) in wild-type and Casp3-/- mice. p-values were calculated from Kolmogorov-Smirnov tests. n=16 cells from 4 wild-type mice and n=17 cells from 4 Casp3-/- mice. (G) Example recordings from paired-pulse measurements at –70 mV membrane potential in wild-type and Casp3-/- mice. Traces from experiments with 50, 150, 250, 500, and 1000 ms inter-stimulus intervals are overlayed. Stimulus artifacts were removed from the traces for clarity. Scale bars represent 100 ms (horizontal) and 0.3 nA (vertical). (H) Paired-pulse ratio (calculated as amplitude of the second response over that of the first response) in wild-type and Casp3-/- mice at various inter-stimulus intervals. Mean and standard error of the mean (SEM) are shown. p-values were calculated from Bonferroni’s multiple comparison test. p=0.0067 for 50 ms interval, p=0.0369 for 150 ms interval, and p=0.0097 for 250 ms interval. n=16 cells from seven wild-type mice and n=13 cells from 4 Casp3-/- mice.
Figure 4—figure supplement 1
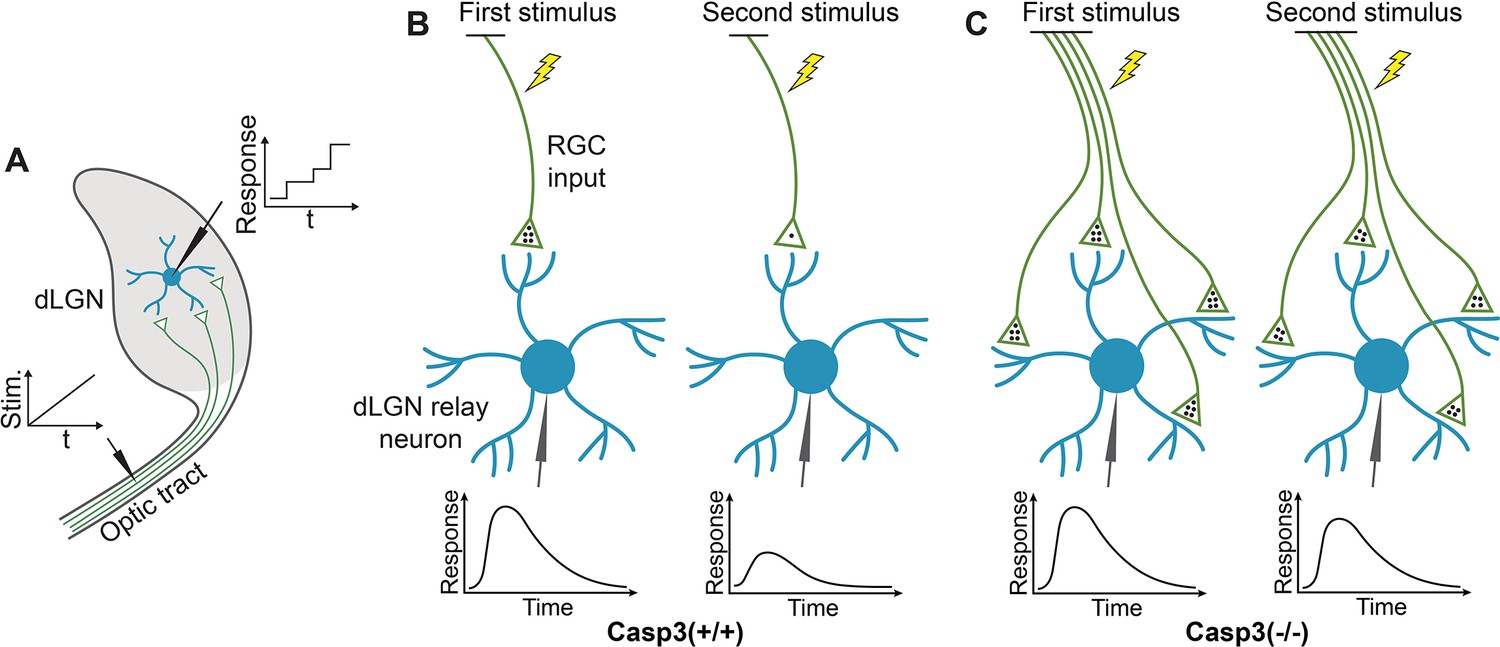
Measuring electrophysiological properties of retinogeniculate synapses.
(A) Inferring the number of retinal ganglion cell (RGC) inputs of dorsal lateral geniculate nuclei (dLGN) relay neurons by measuring stimulation-response curves. To measure relay neuron responses, we prepared acute brain slices from a tilted parasagittal plane in P30 mice (Kuida et al., 1996). These slice preparations preserved a long segment of the optic tract and a high level of connectivity between RGC axons and dLGN relay neurons (Kuida et al., 1996). We placed a stimulating electrode on the optic tract and patch-clamped individual dLGN relay neurons with a recording electrode. We stimulated the optic tract with a series of gradually increasing currents and recorded excitatory postsynaptic currents (EPSCs) in relay neurons. At low stimulation intensity, no RGC axons were activated. As the stimulus increased, more and more RGC axons were recruited. As different RGC axons have different excitation thresholds, RGC axons were excited one at a time. Whenever a stimulus activated an RGC axon that did not respond to lower stimuli, a step increase in the relay neuron response was detected, and the increment corresponded to the EPSC evoked by the newly recruited RGC axon. We can, therefore, infer the number of RGC inputs innervating the relay neuron being recorded by counting the number of steps in the response curve of that relay neuron. t: time. Stim.: stimulation intensity. (B–C) Inferring the number of release sites from RGC inputs by measuring paired-pulse response ratio (PPR). We stimulated the optic tract with two stimuli separated by a short interval and recorded EPSCs in dLGN relay neurons. The stimulus intensity was chosen to evoke maximum response in the relay neuron. In wild-type mice (B), the first stimulus triggers the release of a significant fraction of the readily releasable pool (RRP) of neurotransmitters (black dots), evoking a strong response (left). At the time of the second stimulus, the RRP does not have sufficient time to recover and remains depleted, resulting in a weaker second response (right). PPR can be calculated from this experiment by dividing the peak amplitude of the second response with that of the first. PPR is small in wild-type animals. In caspase-3 deficient mice (C), if the number of release sites is increased compared to wild-type animals, the RRP should be larger (left), and a smaller fraction of the RRP is released during the first stimulus, leaving more neurotransmitters available for the second stimulus (right), thereby enhancing the second response and PPR. Note that in this model, we made two assumptions. The first assumption is that the average size of the RRP in one release site is similar in Casp3+/+ and Casp3-/- mice, which is supported by the comparable fiber fractions (FFs) in the two groups of animals (see Figure 4—figure supplement 2E). The second assumption is that the number of neurotransmitters released during the first stimulus is similar in Casp3+/+ and Casp3-/- mice (4 dots in the illustration), which is supported by the comparable maximum EPSCs in the two groups of animals (see Figure 4—figure supplement 2B–C).
Figure 4—figure supplement 2
Additional analyses of electrophysiological properties of retinogeniculate synapses in Casp3+/+ and Casp3-/- mice.
(A) Distribution of retinal ganglion cell (RGC) input numbers of individual dorsal lateral geniculate nuclei (dLGN) relay neurons in wild-type and Casp3-/- mice measured by counting the number of steps in NMDAR-mediated excitatory postsynaptic current (EPSC) response curves (upper right in Figure 4A and B) while blind to genotypes. p-value was calculated from two-tailed t-test. n=22 cells for wild-type mice and n=24 cells for Casp3-/- mice. (B–C) Quantification of maximum amplitudes of AMPAR- (B) and NMDAR-mediated (C) EPSCs in wild-type and Casp3-/- dLGN relay neurons. (D) Quantification of the ratio between maximum amplitudes of AMPAR- and NDMAR-mediated EPSCs in wild-type and Casp3-/- dLGN relay neurons. (E) Quantification of fiber fractions in wild-type and Casp3-/- dLGN relay neurons. When stimulation on the optic tract is gradually increased, there will be a lowest stimulation intensity at which a non-zero response is first recorded in the relay neuron (see Figure 4—figure supplement 1 for illustration and Figure 4 for example data). This first response is presumed to be evoked by the activation of a single RGC axon fiber. Fiber fraction is defined as the ratio between this single-fiber response and the maximum response and ranges from 0 to 1. Only the AMPAR-mediated response is used to calculate fiber fractions. In (B–E), mean and S.D. are shown. In (A–E), p-values were calculated from two-tailed t-tests. In (A), (C), and (D), n=22 cells for wild-type mice and n=24 cells for Casp3-/- mice. In (B) and (E), n=37 cells for wild-type mice and n=32 cells for Casp3-/- mice.
Figure 5 with 3 supplements
Microglia-mediated synapse elimination depends on caspase-3.
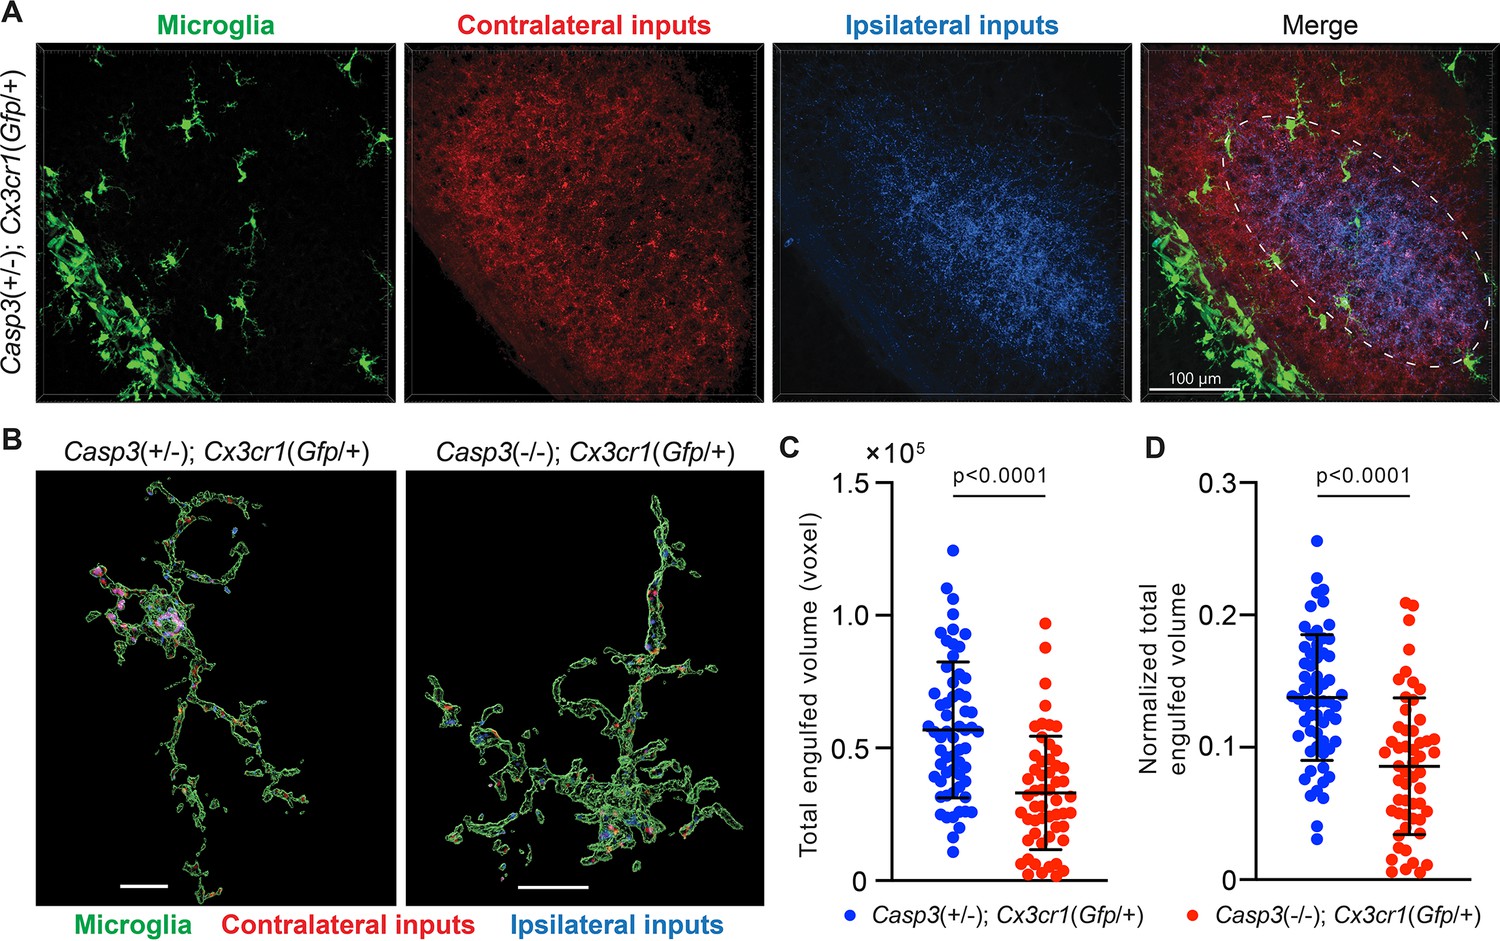
(A) Representative 3D-reconstructed images of a P5 Casp3+/-; Cx3cr1Gfp/+ mouse dorsal lateral geniculate nuclei (dLGN) with microglia displayed in green, contralateral retinal ganglion cell (RGC) axon terminals in red, and ipsilateral RGC terminals in blue. In the merged image, the region from which microglia are selected for analysis is indicated with the dashed line. All microglia within this region were analyzed. The scale bar represents 100 μm. (B) Representative surface rendering of microglia (green) from P5 dLGNs of Casp3+/-; Cx3cr1Gfp/+ and Casp3-/-; Cx3cr1Gfp/+ mice. Intracellular contralateral (red) and ipsilateral (blue) RGC axon terminals are shown. Microglia from caspase-3 deficient mice engulf visibly less synaptic material. Scale bars represent 10 μm. (C) Total volume of engulfed synaptic material in individual microglia from Casp3+/-; Cx3cr1Gfp/+ and Casp3-/-; Cx3cr1Gfp/+ mice. (D) Total volume of engulfed synaptic material in each microglia (from C) is normalized to the volume of that microglia. In (C–D), each point represents one microglia. Mean and S.D. are shown. p-values were calculated from unpaired two-tailed t-tests. n=61 microglia from 8 Casp3+/-; Cx3cr1Gfp/+ mice and n=54 microglia from 5 Casp3-/-; Cx3cr1Gfp/+ mice.
Figure 5—figure supplement 1
Caspase-3 deficiency does not cause microglia activation.
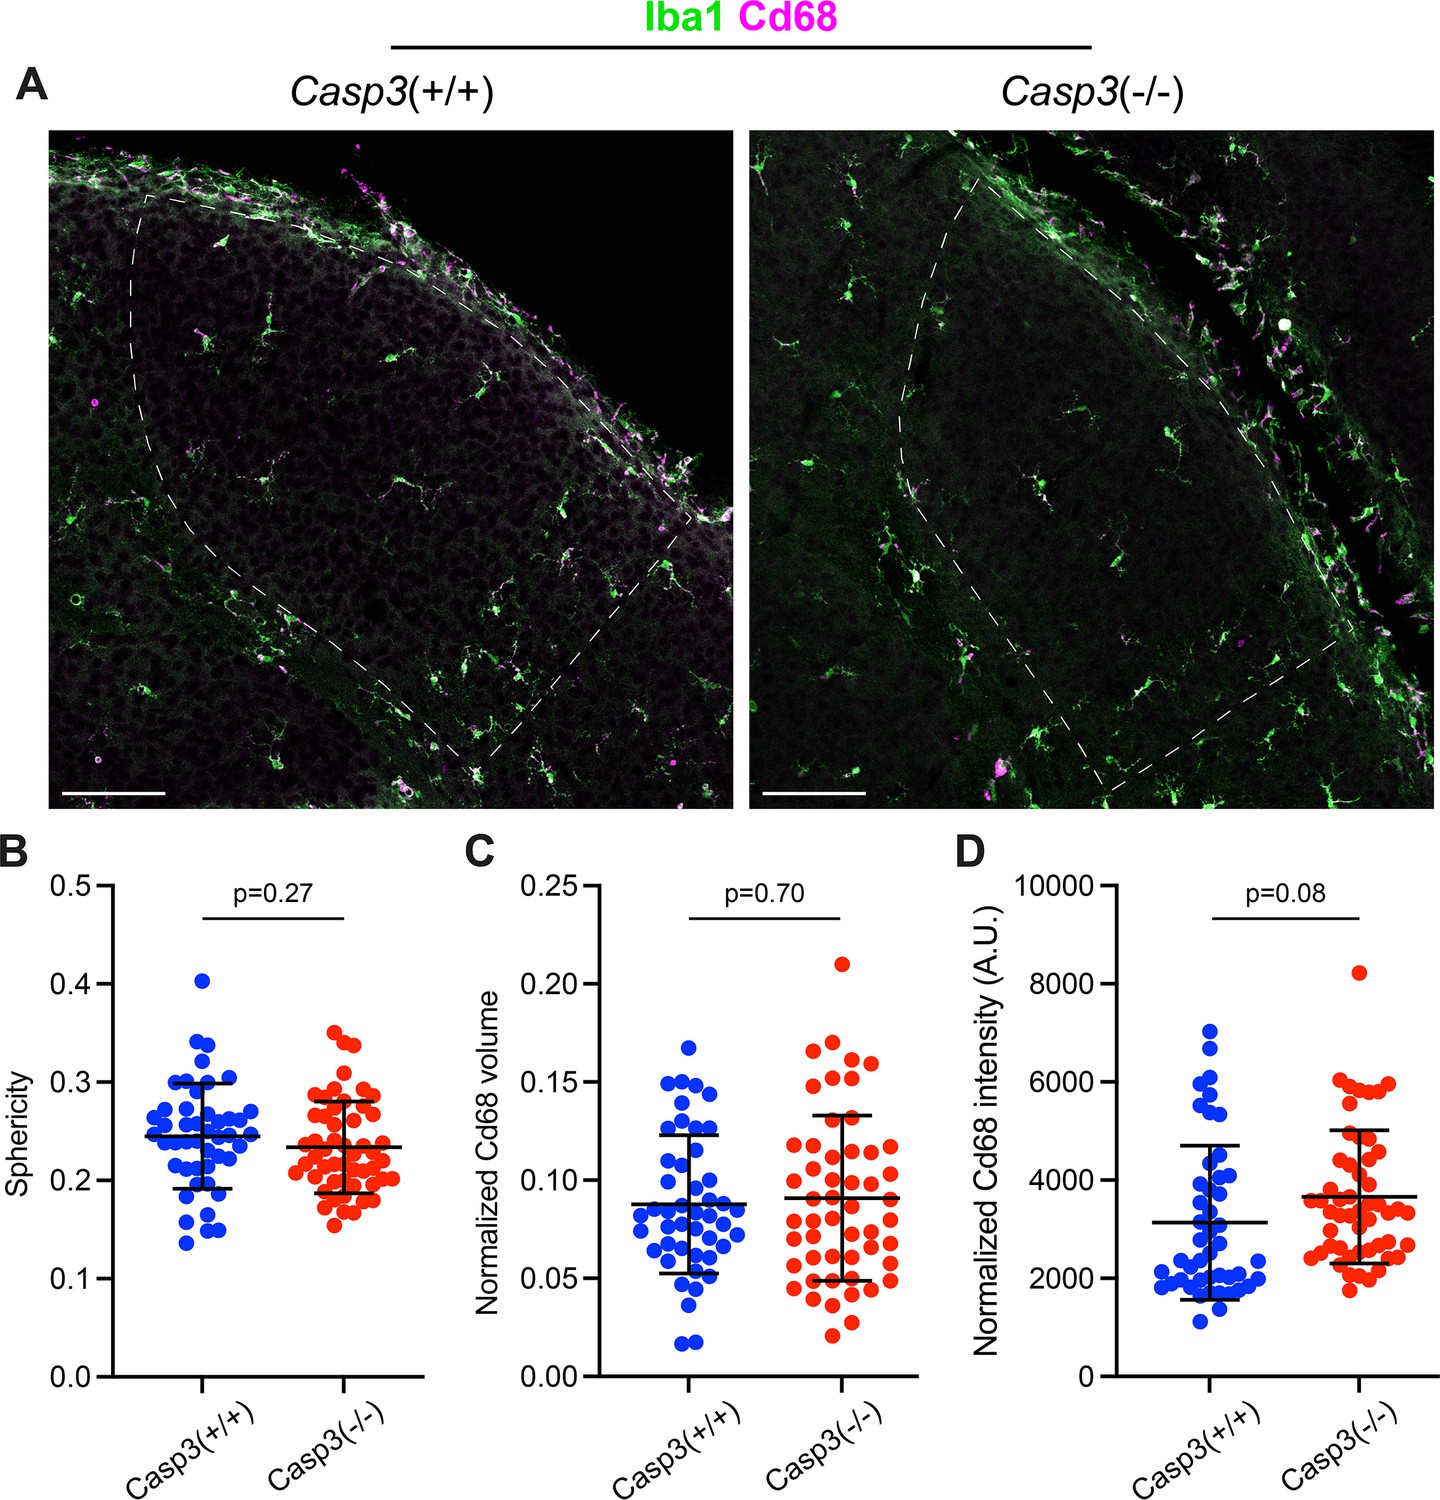
(A) Representative images of P5 dorsal lateral geniculate nuclei (dLGNs) in a Casp3+/+ mouse (left) and a Casp3-/- mouse (right) showing Iba1 (green, a marker for microglia cell body) and Cd68 (magenta, a marker for microglia activation) staining. The dLGN areas are highlighted with dotted lines. Scale bars represent 100 μm. (B) Quantification of microglia morphology in Casp3+/+ and Casp3-/- mice using the sphericity metric. A sphericity of 1 corresponds to a perfect sphere. The smaller the sphericity is, the more ramified the cell is. (C–D) Quantification of microglia activation by normalizing the total volume of Cd68 signal (C) or the total intensity of Cd68 signal (D) in each microglia to the volume of that microglia. By both morphology and Cd68 signal, microglia in Casp3-/- mice show no evidence of activation. In (B–D), each data point represents one microglia, and mean and S.D. are shown. n=46 microglia from 4 Casp3+/+ mice and n=52 microglia from 4 Casp3-/- mice. p-values were calculated from two-tailed unpaired t-tests.
Figure 5—figure supplement 2
Additional analyses of microglia-mediated engulfment of synaptic material.
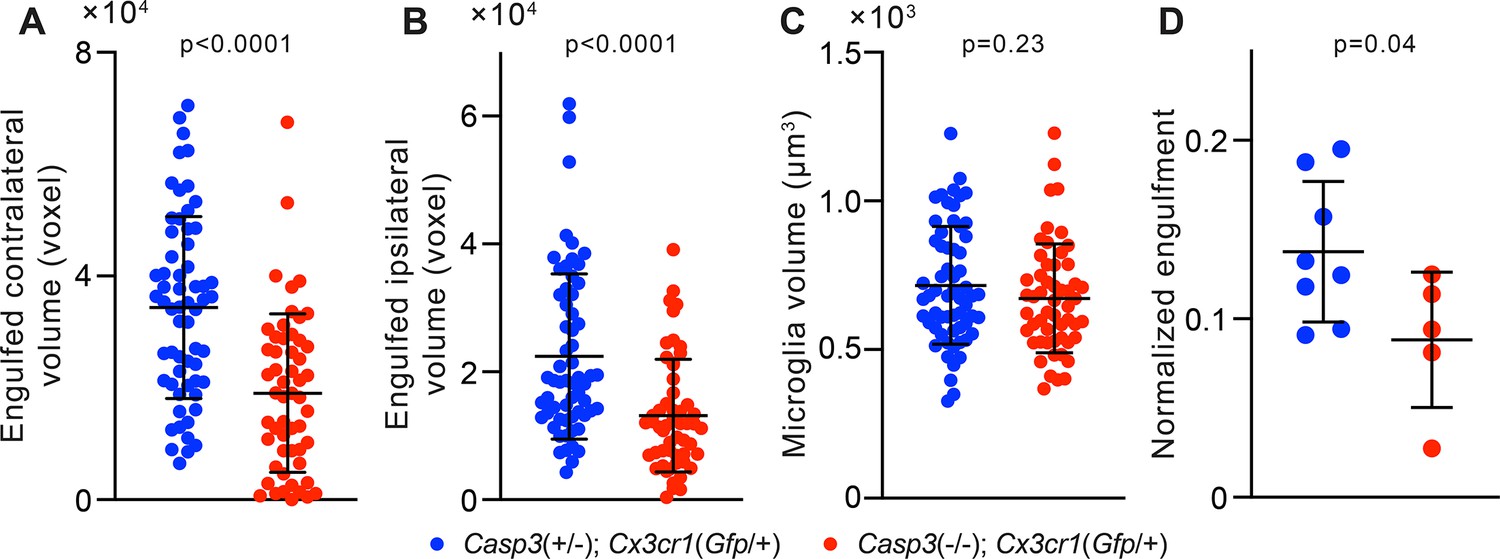
(A–B) Volume of contralateral (A) and ipsilateral (B) retinal ganglion cell (RGC) axon terminals engulfed by individual microglia in the P5 dorsal lateral geniculate nuclei (dLGN) of Casp3+/-; Cx3cr1Gfp/+ and Casp3-/-; Cx3cr1Gfp/+ mice. (C) Volume of individual microglia in the same animals as in (A–B). (D) Normalized engulfment values as in Figure 5D but averaged by animal. In (A–C), each point represents one microglia. In (D), normalized engulfment values for all microglia in each mouse were averaged and reported as one data point. Mean and S.D. are shown. p-values were calculated from unpaired two-tailed t-tests. n=61 microglia from 8 Casp3+/-; Cx3cr1Gfp/+ mice and n=54 microglia from 5 Casp3-/-; Cx3cr1Gfp/+ mice.
Figure 5—figure supplement 3
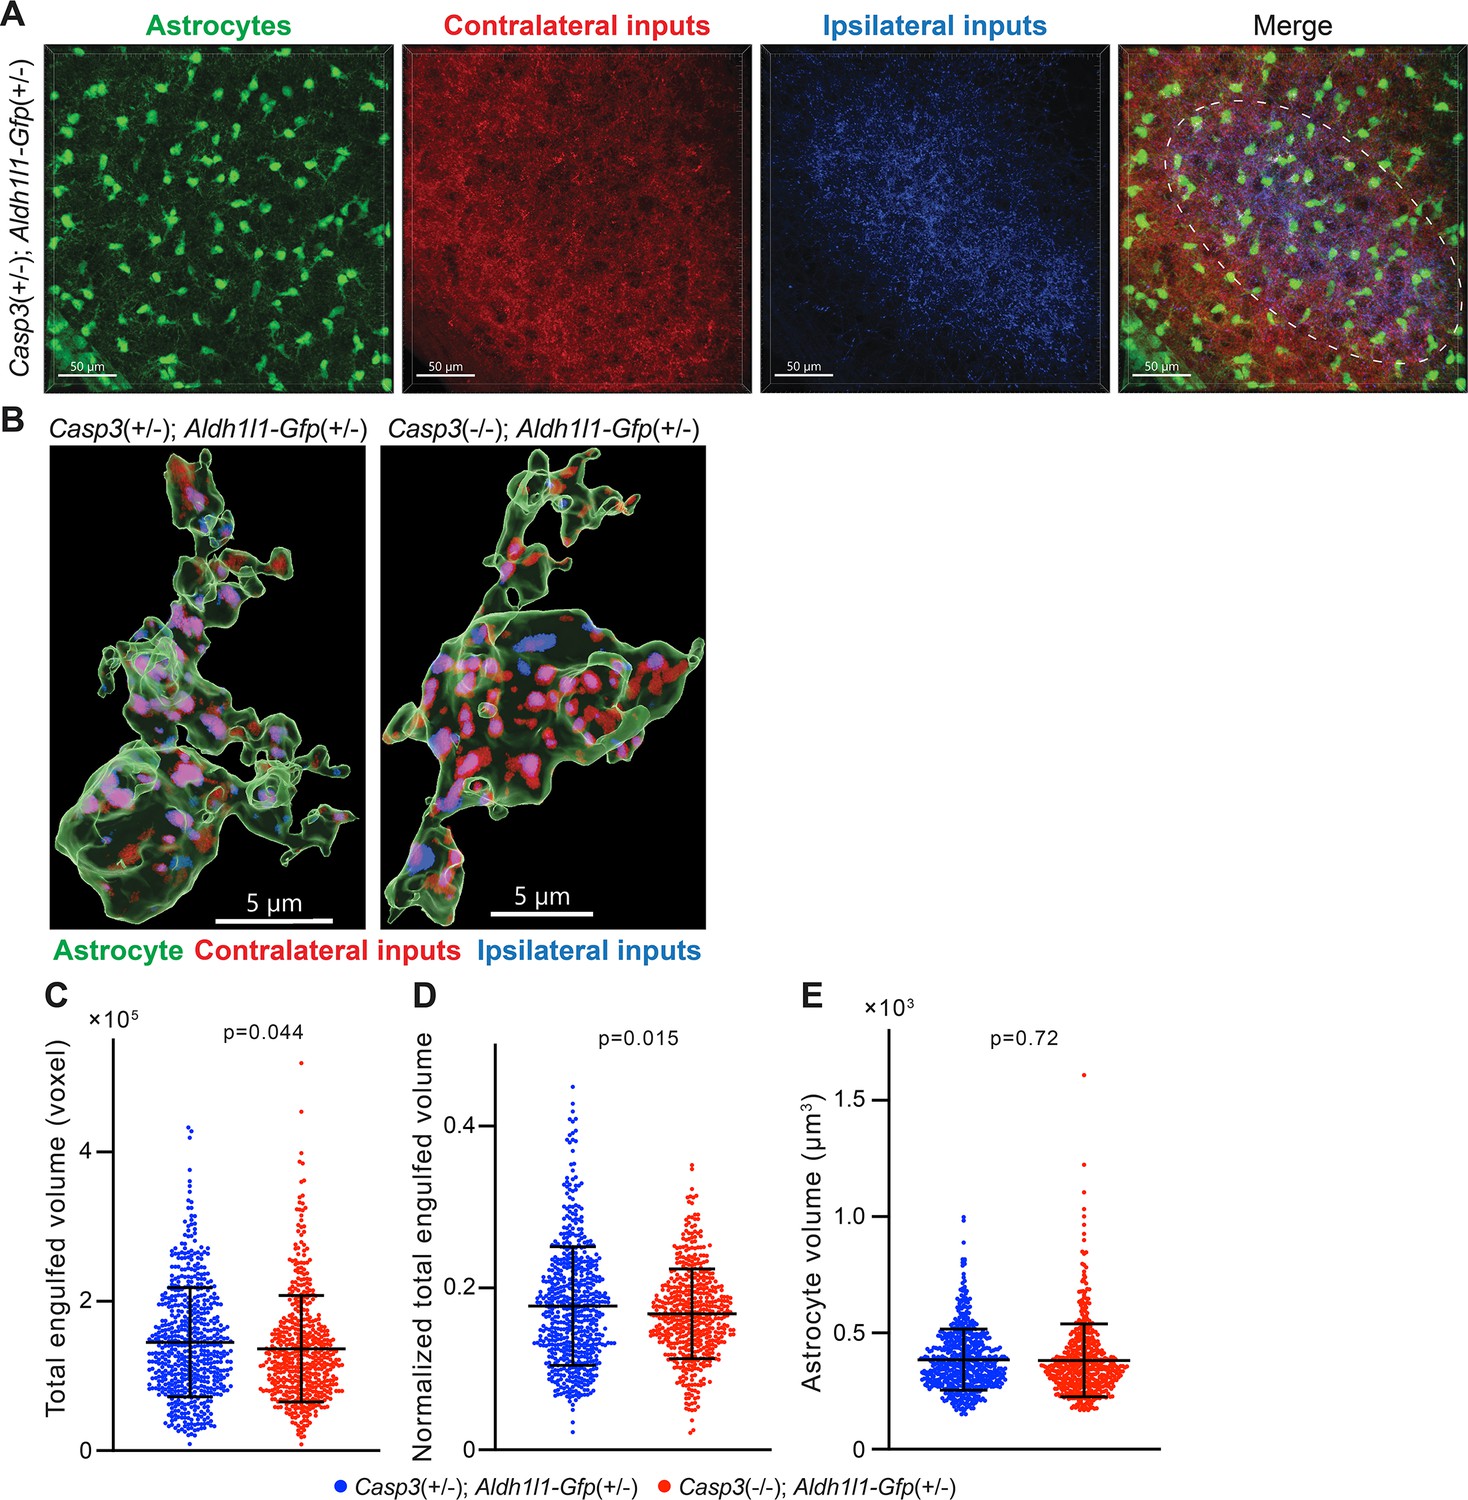
Astrocyte-mediated synapse elimination does not appear to depend on caspase-3.
(A) Representative 3D-reconstructed images of a P5 Casp3+/-; Aldh1l1-Gfp+/- mouse dorsal lateral geniculate nuclei (dLGN) with astrocytes displayed in green, contralateral retinal ganglion cell (RGC) axon terminals in red, and ipsilateral RGC terminals in blue. The region from which astrocytes are selected for analysis is indicated with the dashed line in the merged image. Scale bars represent 50 μm. (B) Representative surface rendering of astrocytes (green) from P5 dLGNs of Casp3+/-; Aldh1l1-Gfp+/- and Casp3-/-; Aldh1l1-Gfp+/- mice. Intracellular contralateral (red) and ipsilateral (blue) RGC axon terminals are shown. Only cell bodies and the base of processes were segmented. We made this segmentation choice because we observed that fine astrocytic processes are largely devoid of engulfed material. Scale bars represent 5 μm. (C) Total volume of engulfed synaptic material in individual astrocytes from Casp3+/-; Aldh1l1-Gfp+/- and Casp3-/-; Aldh1l1-Gfp+/- mice. (D) Total volume of engulfed synaptic material in each astrocyte (from C) is normalized to the volume of that astrocytes. (E) Volume of individual astrocytes from the two groups of mice. In (C–E), each point represents one astrocyte. Mean and S.D. are shown. p-values were calculated from unpaired two-tailed t-tests. n=595 astrocytes from 8 Casp3+/-; Aldh1l1-Gfp+/- mice and n=517 astrocytes from 6 Casp3-/-; Aldh1l1-Gfp+/- mice.
Figure 6 with 1 supplement
Removal of weak synapses by microglia requires caspase-3 activity.
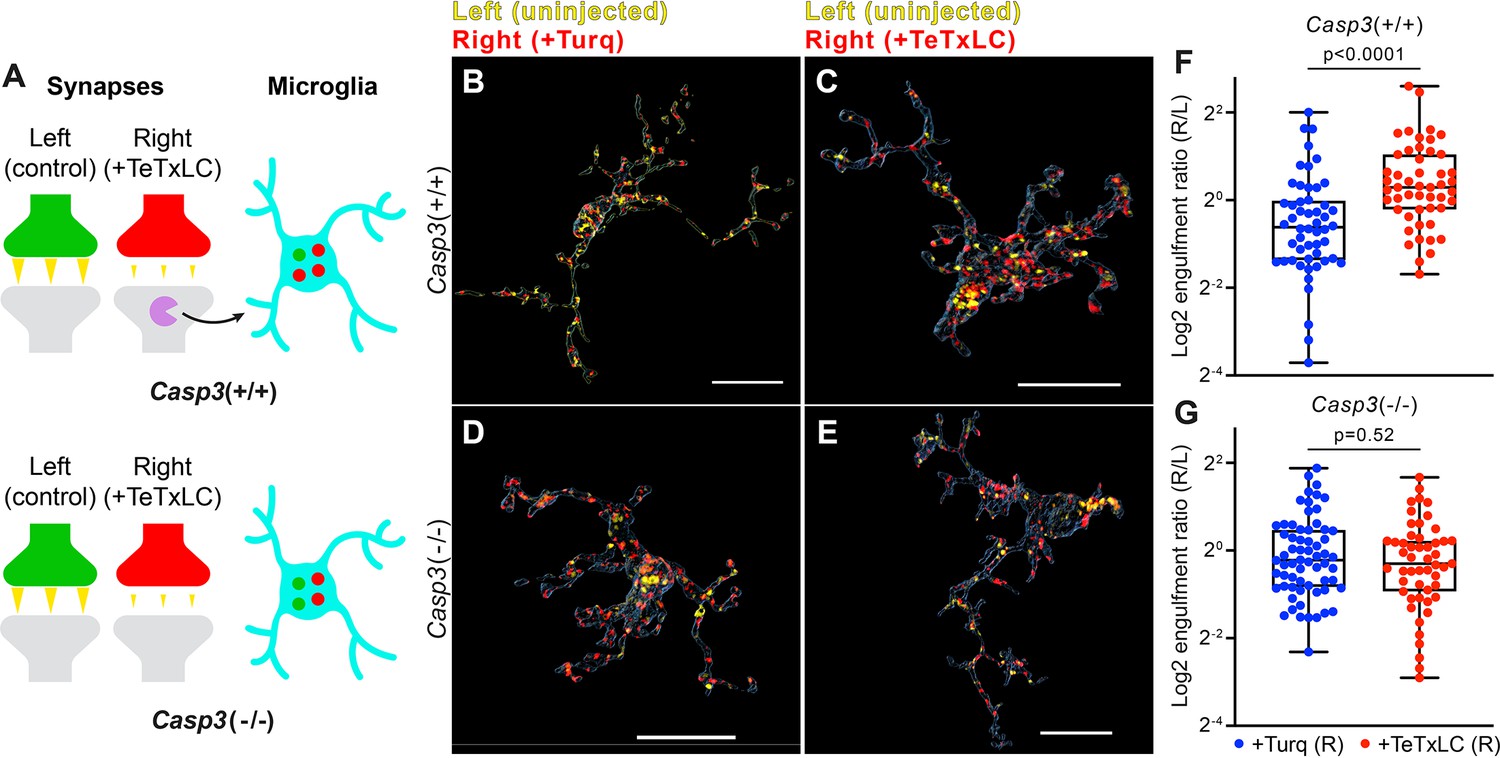
(A) Schematics illustrating the experimental rationale. In wild-type mice (upper panel), inactivating retinogeniculate synapses from the right eye activates caspase-3 (magenta) and recruits microglia to preferentially engulf right eye-originated synapses (red) over left eye-originated synapses (green). If caspase-3 activation is blocked (lower panel), engulfment of inactive synapses should be attenuated. (B–E) Surface rendering of representative microglia from P5 left dorsal lateral geniculate nuclei (dLGN) of Casp3+/+ (B–C) or Casp3-/- (D–E) mice injected with adeno-associated virus (AAV) that provided mTurquoise2 (B and D) or tetanus toxin light chain (TeTxLC) (C and E) in the right eye at E15. Microglia were labeled by immunostaining against Iba1. Retinal ganglion cell (RGC) axon terminals from the left eye are shown in yellow and terminals from the right eye in red. Scale bars represent 15 μm. (F–G) Ratio between volumes of right-eye and left-eye-originated synaptic material engulfed by microglia from Casp3+/+ (F) or Casp3-/- (G) mice injected with AAV that carried the gene for mTurquoise2 (blue) or TeTxLC (red). Each dot represents one microglia. Engulfment ratios are displayed on a log scale. 0, 25, 50, 75, and 100 percentiles are shown. p-values were calculated from unpaired two-tailed Mann-Whitney tests. n=52 microglia from 7 Turq-injected Casp3+/+ mice, n=50 microglia from 8 TeTxLC-injected Casp3+/+ mice, n=64 microglia from 5 Turq-injected Casp3-/- mice, and n=51 microglia from 6 TeTxLC-injected Casp3-/- mice.
Figure 6—figure supplement 1
Additional analysis on activity-dependent microglia-mediated engulfment of synapses.
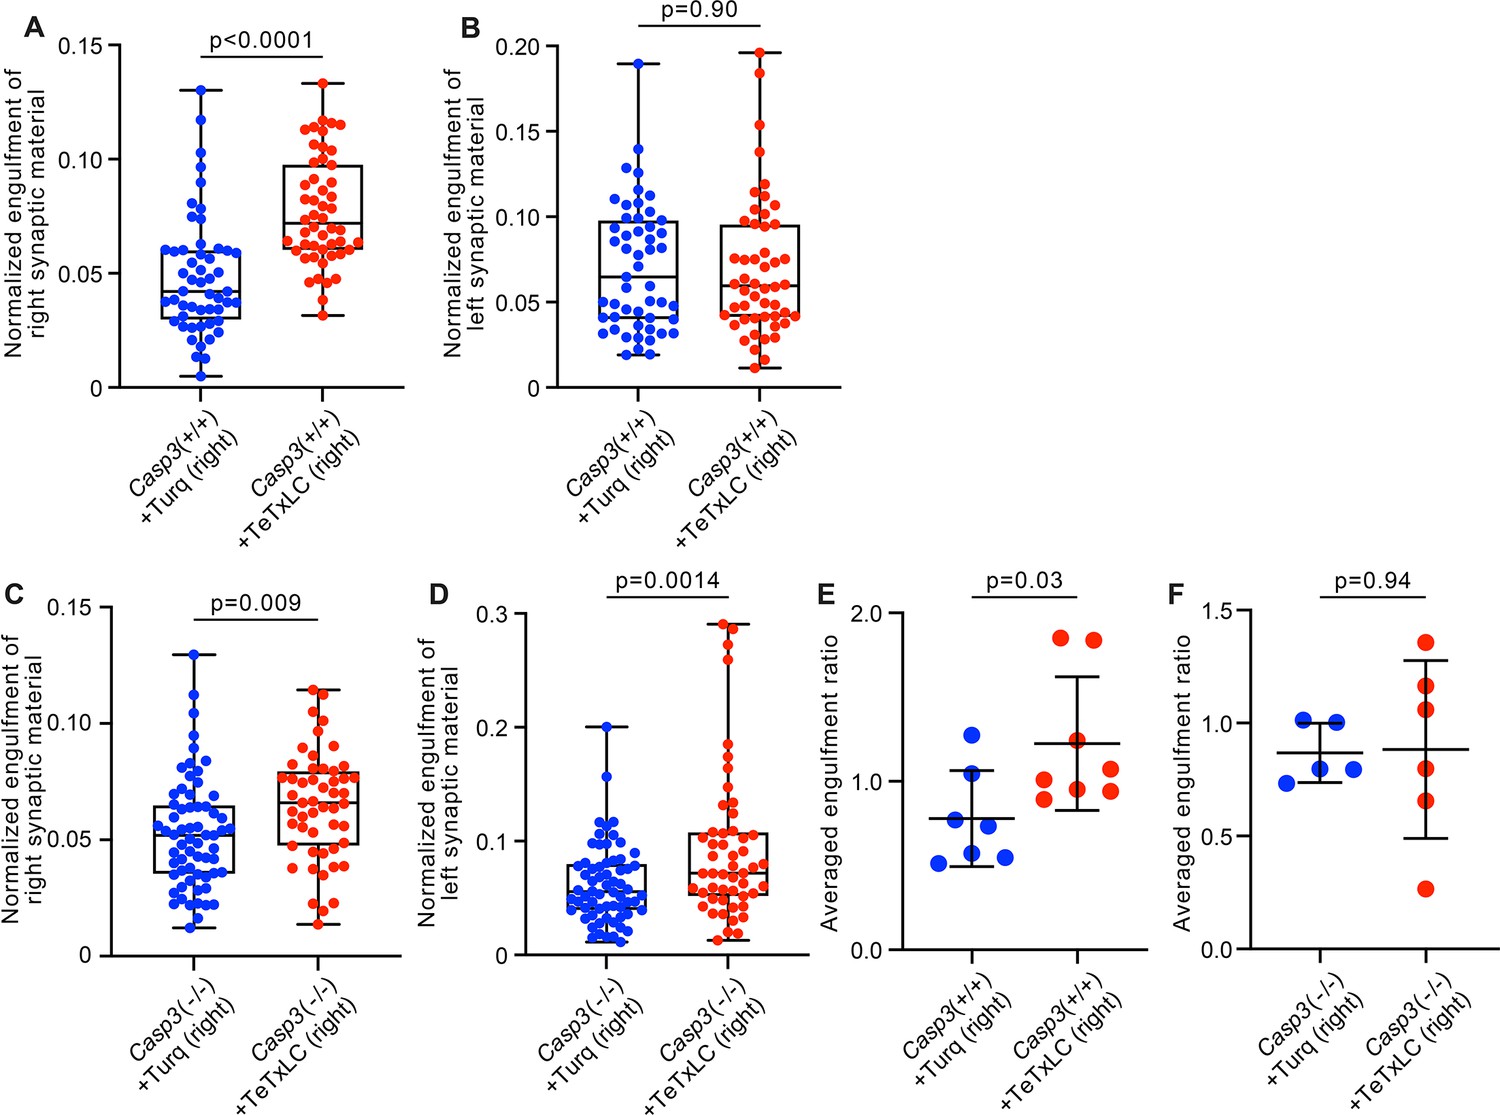
(A–D) Volumes of synaptic material originating from right (A and C) or left (B and D) eyes engulfed by individual microglia from the left dorsal lateral geniculate nuclei (dLGN) of Casp3+/+ (A–B) or Casp3-/- (C–D) mice injected with adeno-associated-virus (AAV) expressing mTurquoise2 (blue) or tetanus toxin light chain (TeTxLC) (red) in right eye were normalized to microglial volume and plotted. In Casp3+/+ mice, inactivating right eye-originated retinogeniculate synapses specifically enhanced microglia-mediated engulfment of retinal ganglion cell (RGC) axon terminals from right eyes (A) but not left eyes (B), resulting in significantly higher engulfment ratios (Figure 6F). In Casp3-/- mice, inactivating right eye-originated synapses resulted in no significant change in engulfment ratios (Figure 6G), even though engulfment of RGC terminals from both eyes was elevated (C and D). (E–F) Engulfment ratios as reported in Figure 6F–G but averaged by animal. In (A–D), each point represents one microglia. 0, 25, 50, 75, and 100 percentiles are shown. In (E–F), engulfment ratios for all microglia in each animal were averaged and reported as one data point. p-values were calculated from unpaired two-tailed t-tests. n=52 microglia from 7 Turq-injected Casp3+/+ mice, n=50 microglia from 8 TeTxLC-injected Casp3+/+ mice, n=64 microglia from 5 Turq-injected Casp3-/- mice, and n=51 microglia from 6 TeTxLC-injected Casp3-/- mice. Notes on interpretation of C and D: In Casp3-/- brains injected with TeTxLC, microglia in dLGNs tended to increase in volume and have thicker processes. We, therefore, suspect the non-specific upregulation of synapse engulfment in TeTxLC-injected Casp3-/- mice is a consequence of microglial activation rather than synapse inactivation. This microglial activation is likely a side effect of intraocular surgeries. We noticed that Casp3-/- brains tended to have weak structural integrity. It is possible that repetitive intraocular injections caused damage in the retinogeniculate pathway of Casp3-/- mice and activated microglia. Nevertheless, by calculating right-to-left engulfment ratios, substrate preference of microglia in TeTxLC-injected Casp3-/- mice can be deduced.
Figure 7 with 5 supplements
Caspase-3 deficiency protects against Aβ-induced synapse loss.
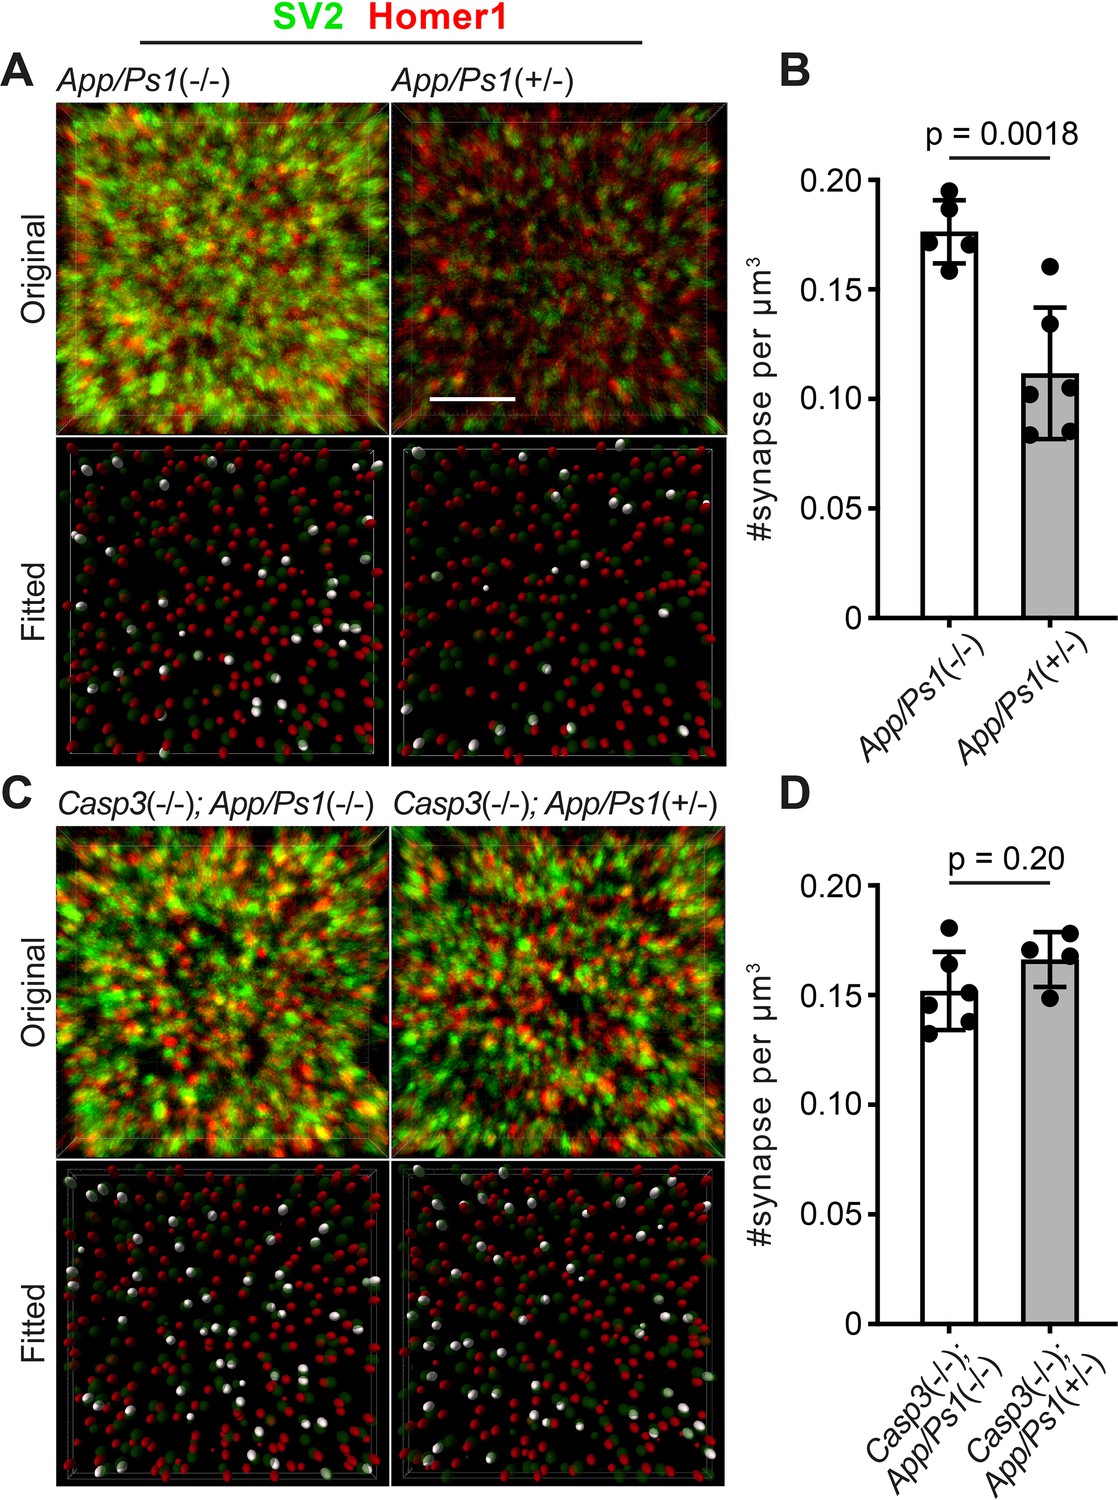
(A and C) Representative 3D-reconstructed images (3 μm in z) showing presynaptic (SV2, in green) and postsynaptic (Homer1, in red) signals in dentate gyrus of female 6-mo-old amyloid precursor protein (APP)/PS1 mice on caspase-3 wild-type (A) and deficient (C) backgrounds. Ellipsoids were fitted to the original images (upper panels) to isolate pre- (green) and post-synaptic (red) puncta (lower panels). Homer1 ellipsoids found with 300 nm of a SV2 ellipsoid are highlighted in white in the fitted images. Original images are adjusted to the same contrast. For the fitted images, only ellipsoids from the upper half of the z-stack are shown. Scale bar represents 4 μm. (B and D) Quantification of synapse density in APP/PS1 mice on caspase-3 wild-type (B) and deficient (D) backgrounds. Mean and S.D. are shown. p-values were calculated from unpaired two-tailed t-tests. n=5 for App/Ps1-/- mice, n=6 for App/Ps1+/- mice, n=6 for Casp3-/-; App/Ps1-/- mice, and n=4 for Casp3-/-; App/Ps1+/- mice.
Figure 7—figure supplement 1
Amyloid deposition amyloid precursor protein (APP)/PS1 mouse lines.
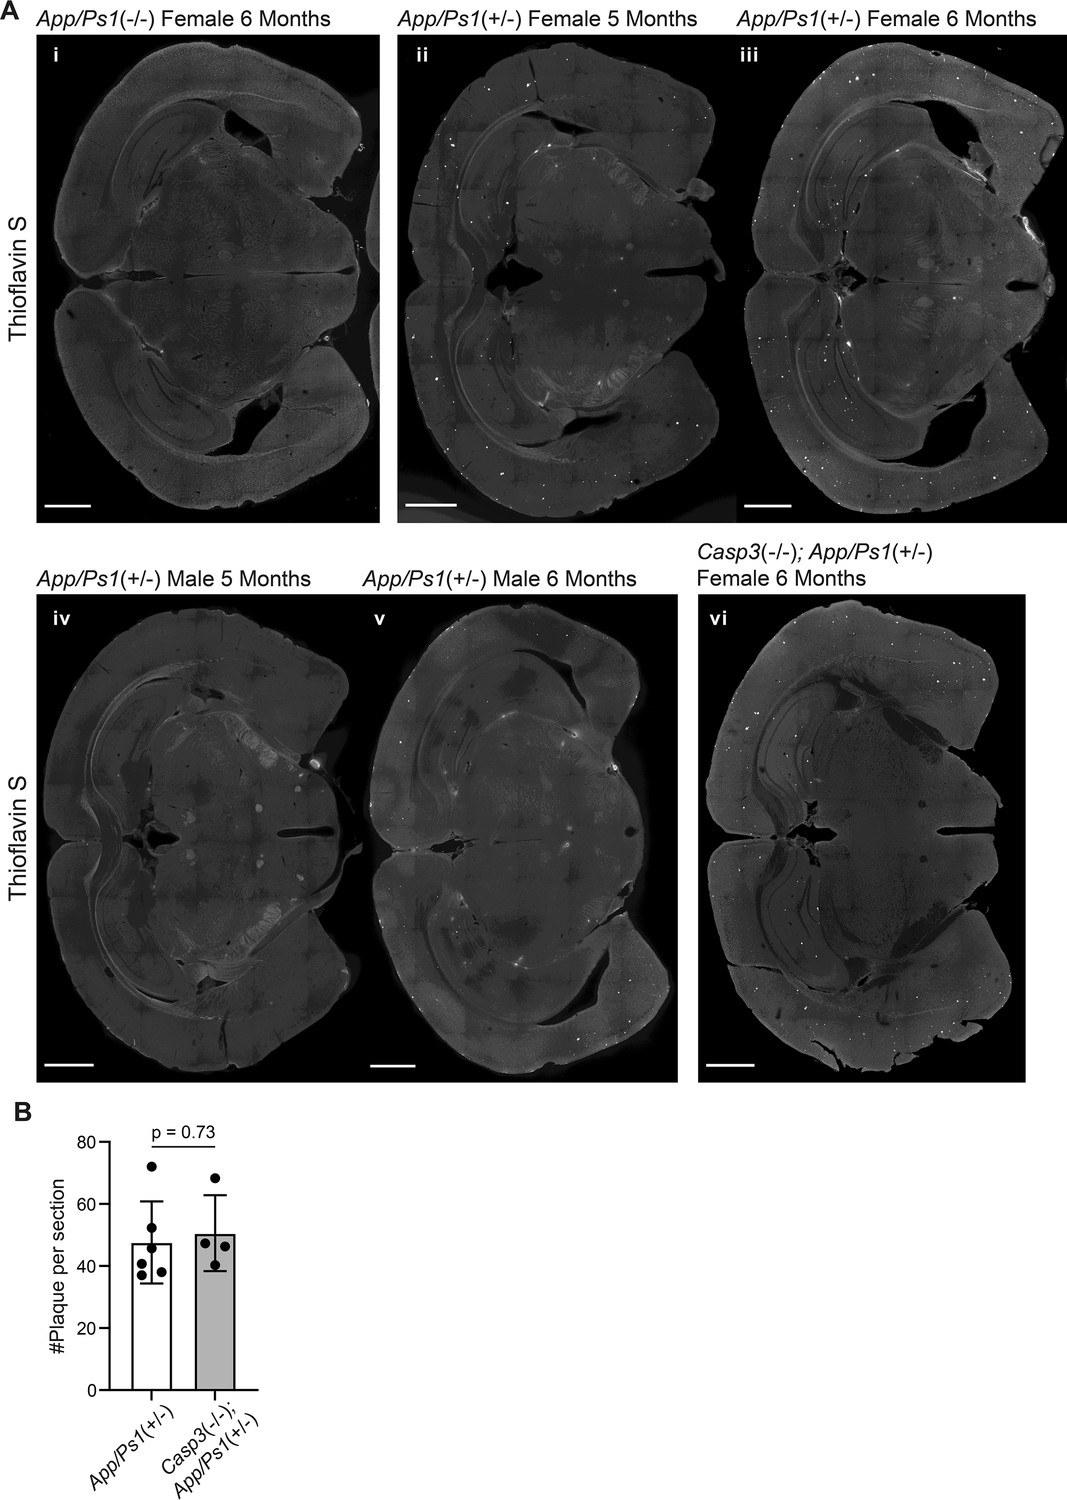
(A) Images of coronal brain sections of a female App/Ps1-/- mouse at 6 mo (i), female App/Ps1+/- mice at 5 mo (ii) or 6 mo (iii), male App/Ps1+/- mice at 5 mo (iv) or 6 mo (v), and a female Casp3-/-; App/Ps1+/- mouse at 6 mo (vi), stained with Thioflavin S to reveal Aβ plaques (bright spots in hippocampus and cortex). Scale bars represent 1 mm. (B) Quantification of the number of plaques per section in female 6-mo-old App/Ps1+/- and Casp3-/-; App/Ps1+/- mice. Mean and S.D. are shown. p-values were calculated with unpaired two-tailed t-tests. n=6 for App/Ps1+/- mice and n=4 for Casp3-/-; App/Ps1+/- mice.
Figure 7—figure supplement 2
Selection of field of interest for synapse loss analysis.
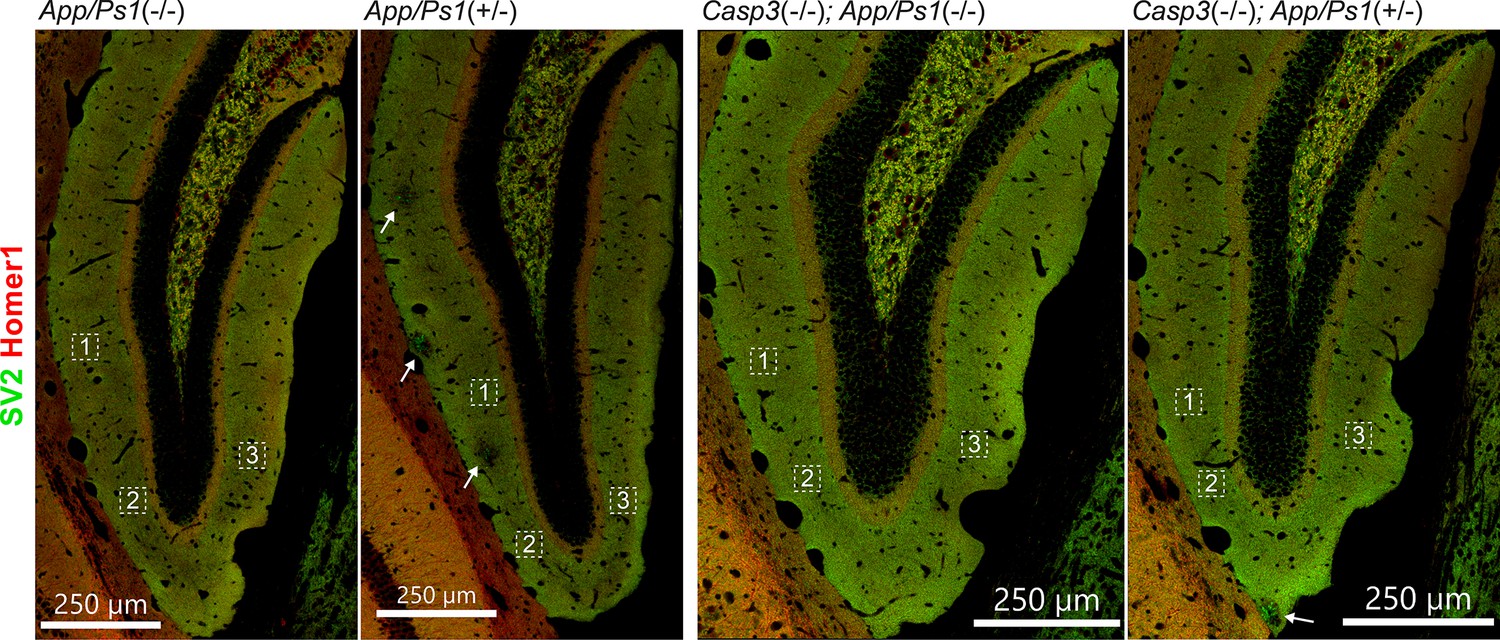
To quantify synapse density, three regions of interest from each dentate gyrus on either side of the brain were chosen for each animal (total of 6 regions per animal). Regions of interest in one dentate gyrus of one animal from each genotype group are highlighted with dotted squares in the overviews above. High-resolution images of SV2 (in green) and Homer1 (in red) stains were acquired for each region of interest and used for analysis. In sections from animals overexpressing mutant amyloid precursor protein (APP) and PS1, we avoided choosing regions of interest from areas surrounding amyloid plaques (highlighted with arrows).
Figure 7—figure supplement 3
Additional analysis of synapse density in amyloid precursor protein (APP)/PS1 mouse lines.
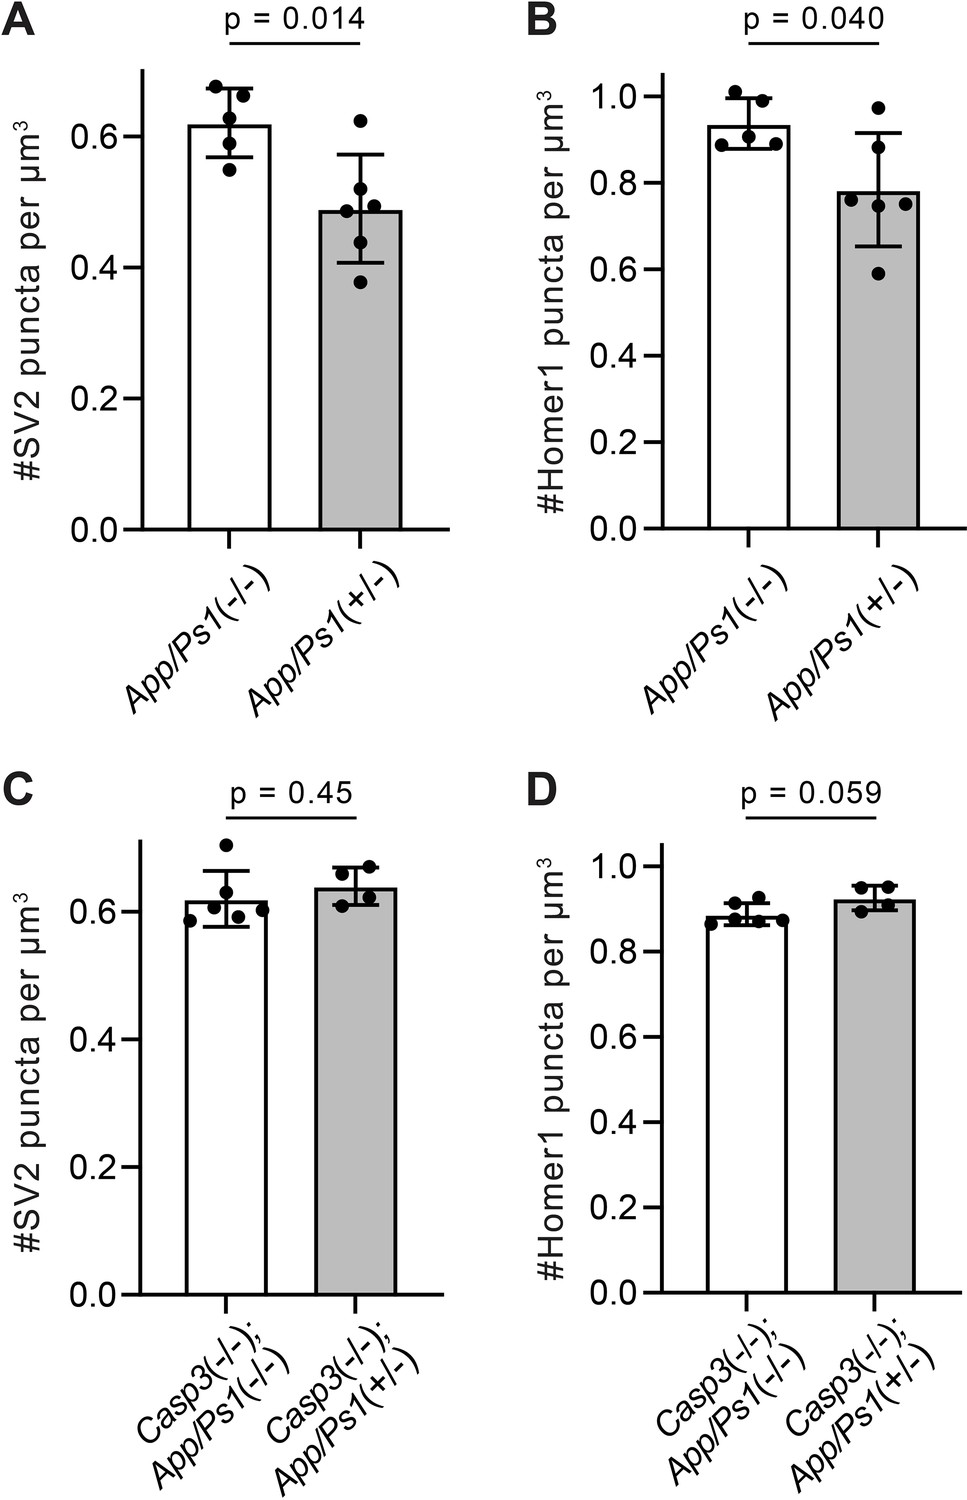
(A–D) Quantification of presynaptic (A and C) and postsynaptic (B and D) puncta densities in the dentate gyrus of APP/PS1 mice in the caspase-3 wild-type (A and B) or deficient (C and D) background. Mean and S.D. are shown. p-values were calculated from unpaired two-tailed t-tests. n=5 for App/Ps1-/- mice, n=6 for App/Ps1+/- mice, n=6 for Casp3-/-; App/Ps1-/- mice, and n=4 for Casp3-/-; App/Ps1+/- mice.
Figure 7—figure supplement 4
Microgliosis in amyloid precursor protein (APP)/PS1 mouse lines.
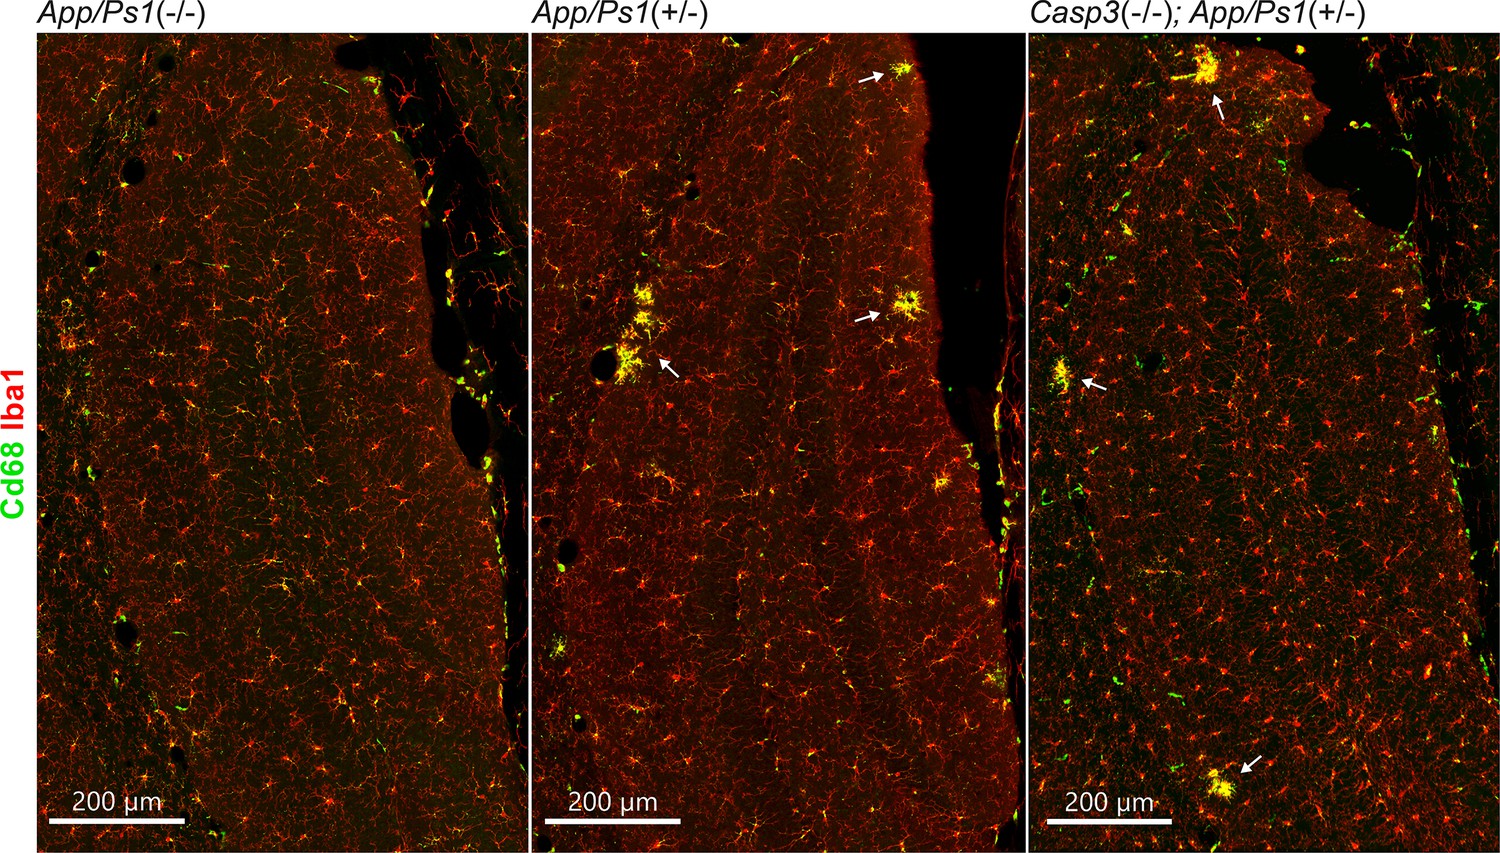
Coronal sections from 6-mo-old female App/Ps1-/- (left), App/Ps1+/- (middle), and Casp3-/-; App/Ps1+/- (right) mice were stained for Iba1 (red, to detect microglia) and Cd68 (green, as a microglia activation marker). Dentate gyrus regions are shown in the overviews above. Clusters of reactive microglia surrounding amyloid plaques are highlighted with arrows.
Figure 7—figure supplement 5
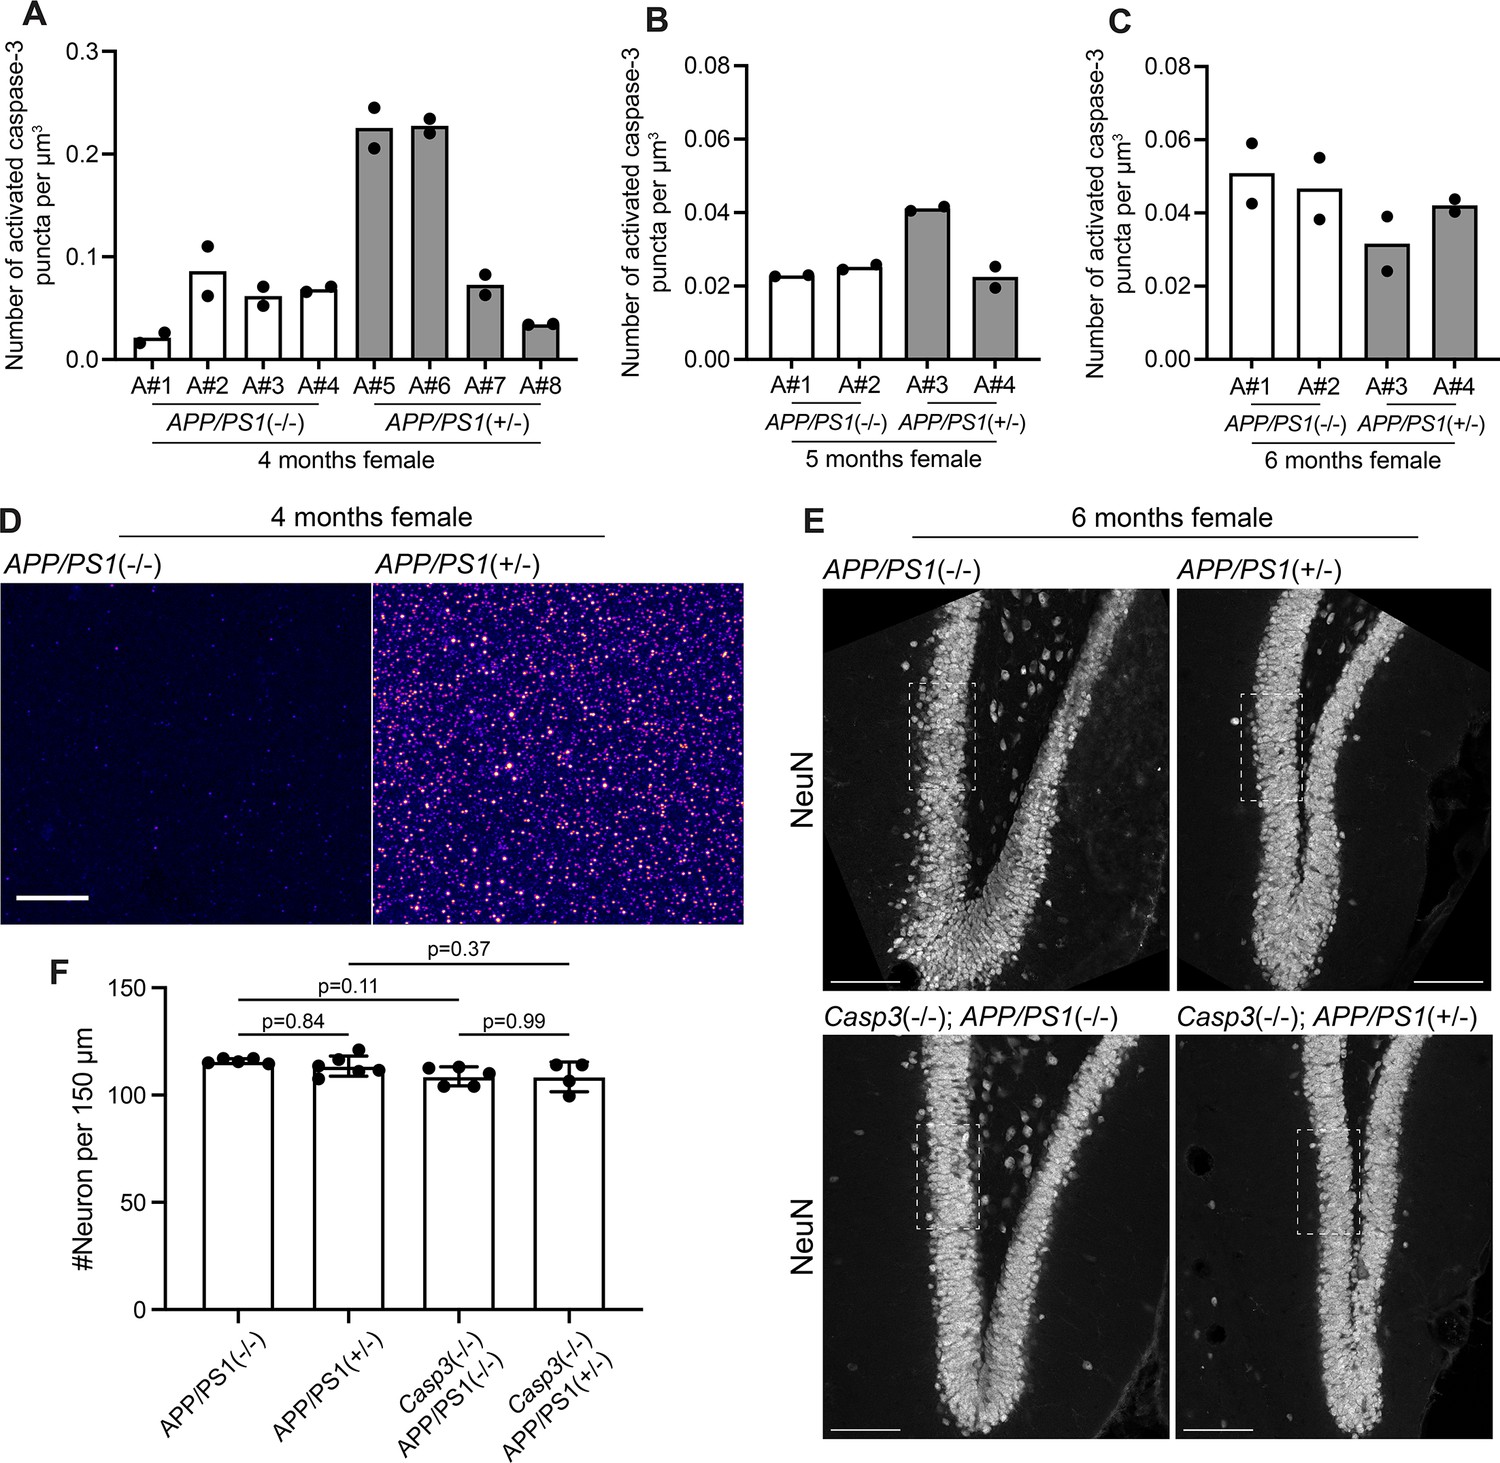
Aβ-induced caspase-3 activity in amyloid precursor protein (APP)/PS1 mice.
(A–C) Density of activated caspase-3 puncta in the dentate gyrus of 4-mo-old (A), 5-mo-old (B), and 6-mo-old (C) female App/Ps1-/- and App/Ps1+/- mice. Each column represents one animal, and each dot represents quantification from one dentate gyrus (either from left side or right side). Two out of four 4-mo-old App/Ps1+/- mice showed robust upregulation of caspase-3 activity in the dentate gyrus (A). No upregulation of caspase-3 activity was observed in 5-mo-old or 6-mo-old mice. (D) Images showing elevated caspase-3 activity in the molecular layer of the dentate gyrus of a 4-mo-old female App/Ps1+/- mouse (A#5 in A). Images were set to the same intensity contrast. Upregulated caspase-3 activity remained in a punctate pattern and no apoptotic cell was observed. Scale bar represents 10 μm. (E) Representative images of the dentate gyrus in 6-mo-old female App/Ps1-/-, App/Ps1+/-, Casp3-/-; App/Ps1-/-, and Casp3-/-; App/Ps1+/- mice that were stained with an anti-NeuN antibody to visualize neurons. The fields of interest used to quantify neuron density are highlighted with dotted rectangles. Scale bars represent 100 μm. (F) Neuron density in the granule cell layer of the dentate gyrus in the four groups of mice shown in (E). Neither caspase-3 deficiency nor APP/PS1 overexpression caused significant changes in neuron density. Mean and S.D. are shown. p-values were calculated from Tukey’s multiple comparisons test. n=5 for App/Ps1-/- mice, n=6 for App/Ps1+/- mice, n=5 for Casp3-/-; App/Ps1-/- mice, and n=4 for Casp3-/-; App/Ps1+/- mice.
Additional files
-
MDAR checklist
- https://cdn.elifesciences.org/articles/101779/elife-101779-mdarchecklist1-v1.pdf
-
Source data 1
CSV files containing raw quantification values plotted in all main figures and figure supplements.
- https://cdn.elifesciences.org/articles/101779/elife-101779-data1-v1.zip
-
Source code 1
Computer codes.
- https://cdn.elifesciences.org/articles/101779/elife-101779-code1-v1.zip
Download links
A two-part list of links to download the article, or parts of the article, in various formats.
Downloads (link to download the article as PDF)
Open citations (links to open the citations from this article in various online reference manager services)
Cite this article (links to download the citations from this article in formats compatible with various reference manager tools)
Activity-dependent synapse elimination requires caspase-3 activation
eLife 13:RP101779.
https://doi.org/10.7554/eLife.101779.3


