Structure and conformational states of the bovine mitochondrial ATP synthase by cryo-EM
- The Hospital for Sick Children Research Institute, Canada
- The University of Toronto, Canada
- Janelia Research Campus, Howard Hughes Medical Institute, United States
- MRC Mitochondrial Biology Unit, United Kingdom
Figures
Figure 1 with 3 supplements
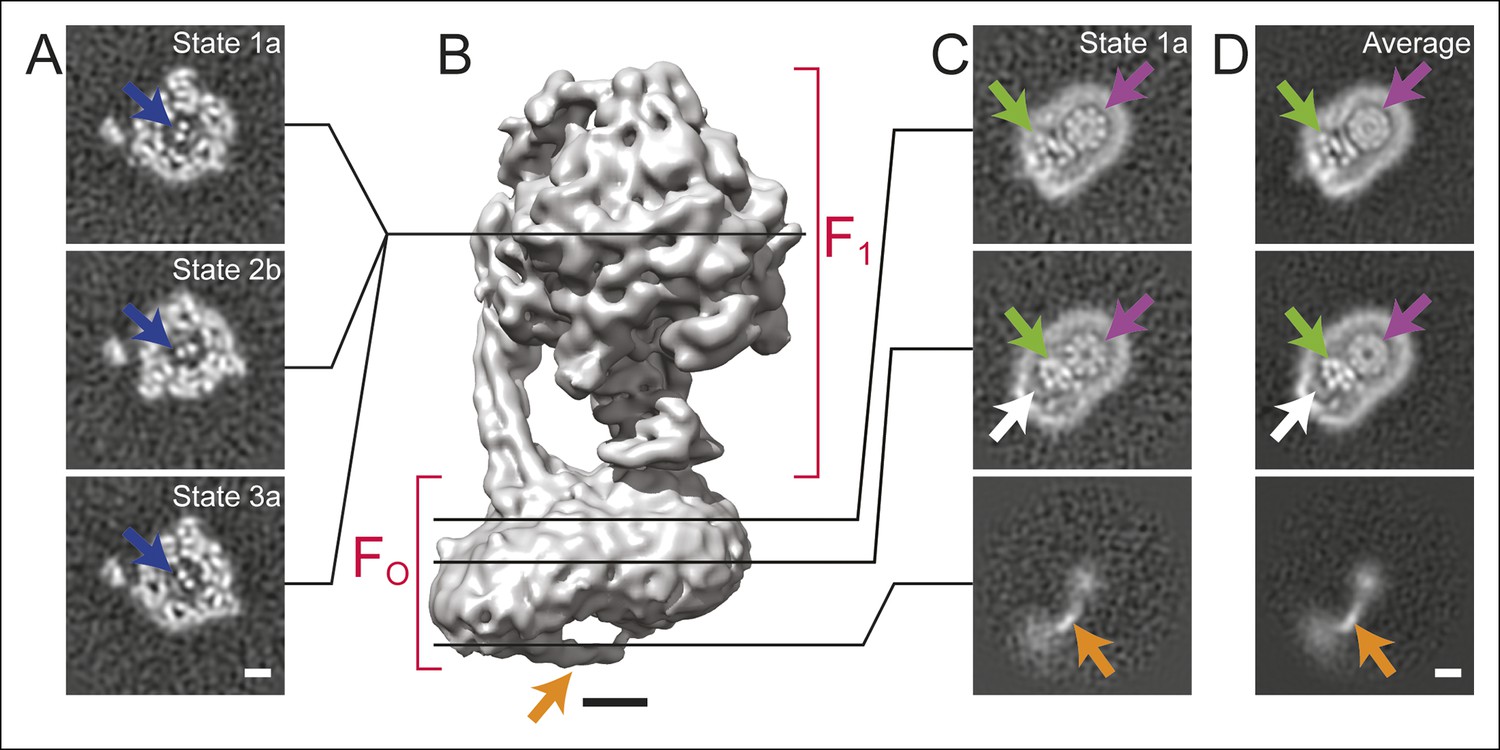
Cross-sections through maps.
(A) Cross-sections through the F1 regions of the different maps show that states 1, 2, and 3 are related by ∼120° rotations of the γ subunit within the α3β3 hexamer (blue arrows). (B) Surface rendering of a map (State 1a) shows the bent FO region with a tubular feature that extends from the rotor-distal portion to the c8-ring (orange arrow). (C) Cross-sections through the FO region show α-helices from the a, b and A6L subunits (green arrows), a low density region in the rotor-distal portion (white arrow), the tubular extension from the rotor-distal portion to the rotor (orange arrows), and the c-ring (purple arrows). (D) Averaging the FO regions from the seven different maps shows all of the features mentioned above with an improved signal-to-noise ratio for some features. Scale bars, 25 Å.
Figure 1—figure supplement 1
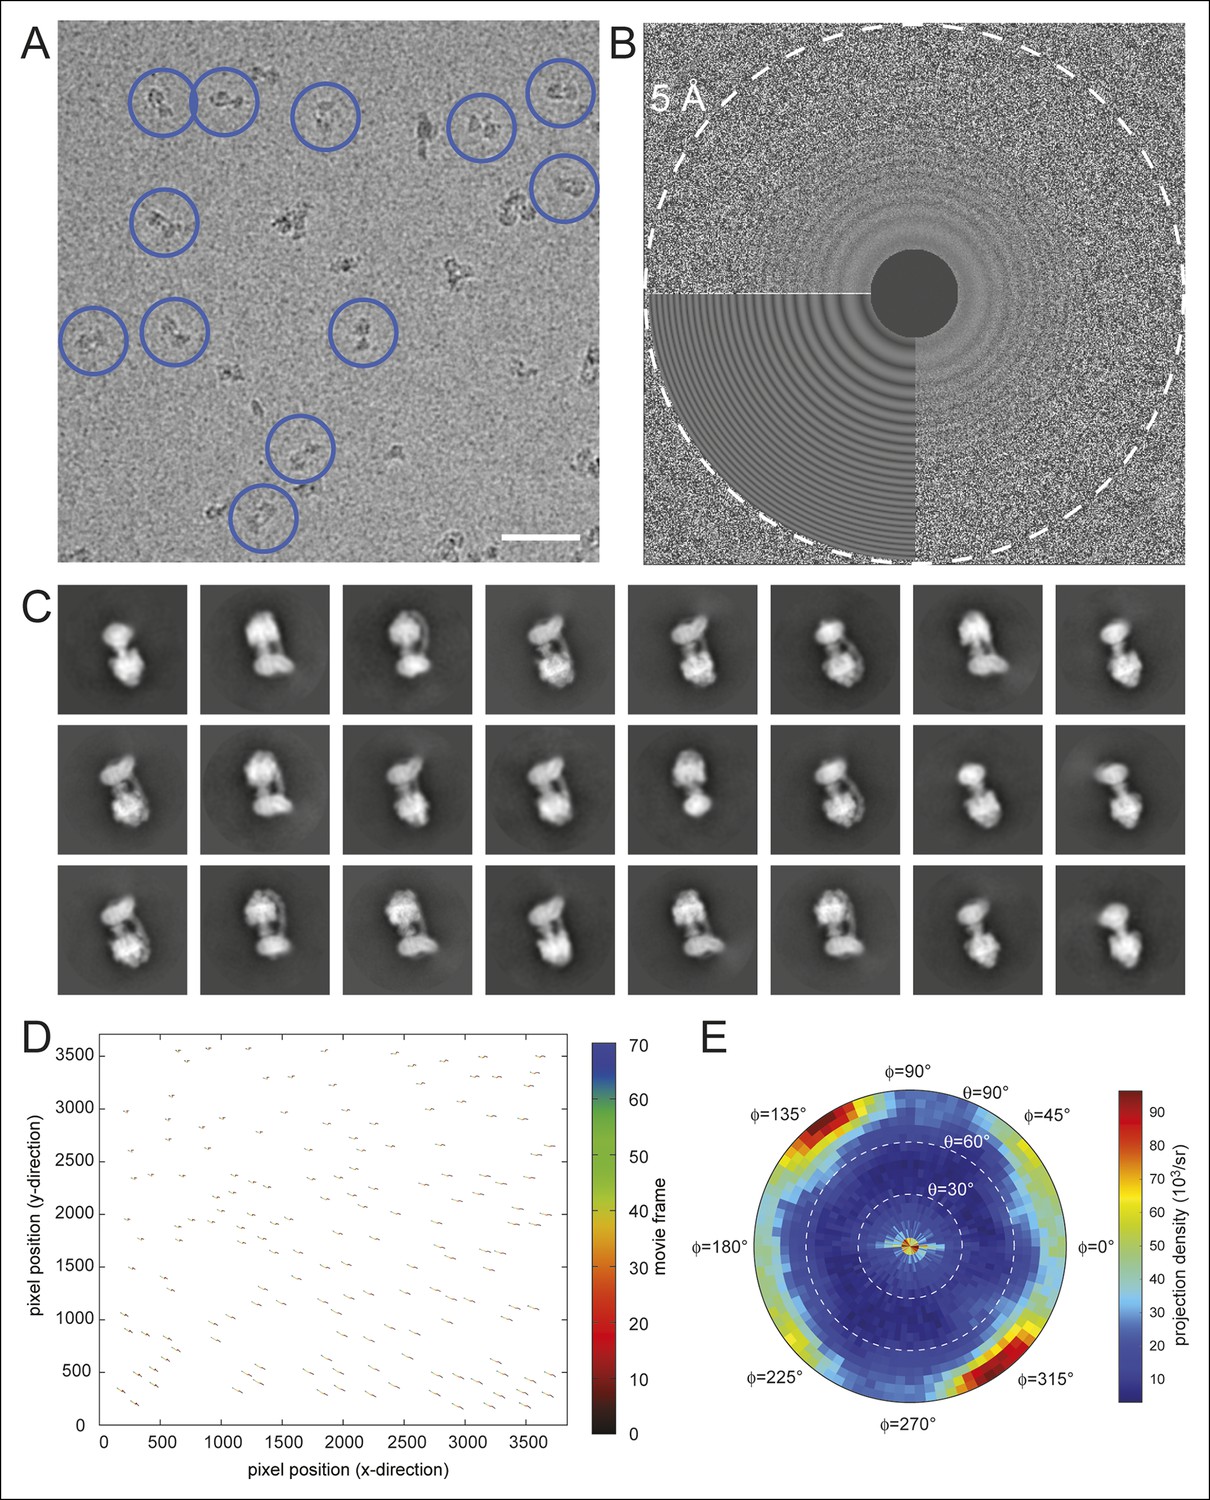
Electron microscopy and model construction.
(A) A sample micrograph with representative ATP synthase particles circled in blue. Scale bar, 500 Å. (B) A sample micrograph power spectrum with the modeled power spectrum from CTFFIND4 in the lower left quadrant. (C) Representative averages from 2D classes selected for 3D analysis. (D) An example of individual particle trajectories (exaggerated by a factor of 5) from alignparts_lmbfgs used for local drift correction. (E) The distribution of Euler angles assigned to particles going into the 3D maps shows preferred orientations but contains sufficient particle views to produce maps with isotropic resolution.
Figure 1—figure supplement 2

The seven observed states of the bovine mitochondrial ATP synthase.
Two views are shown for each of the seven conformations identified for the enzyme. All of the known structural features and the newly observed protuberance from the rotor-distal portion of the FO region are seen in each map. The bend in the FO region is indicated by the dashed line in the top left map. Scale bar, 25 Å.
Figure 1—figure supplement 3
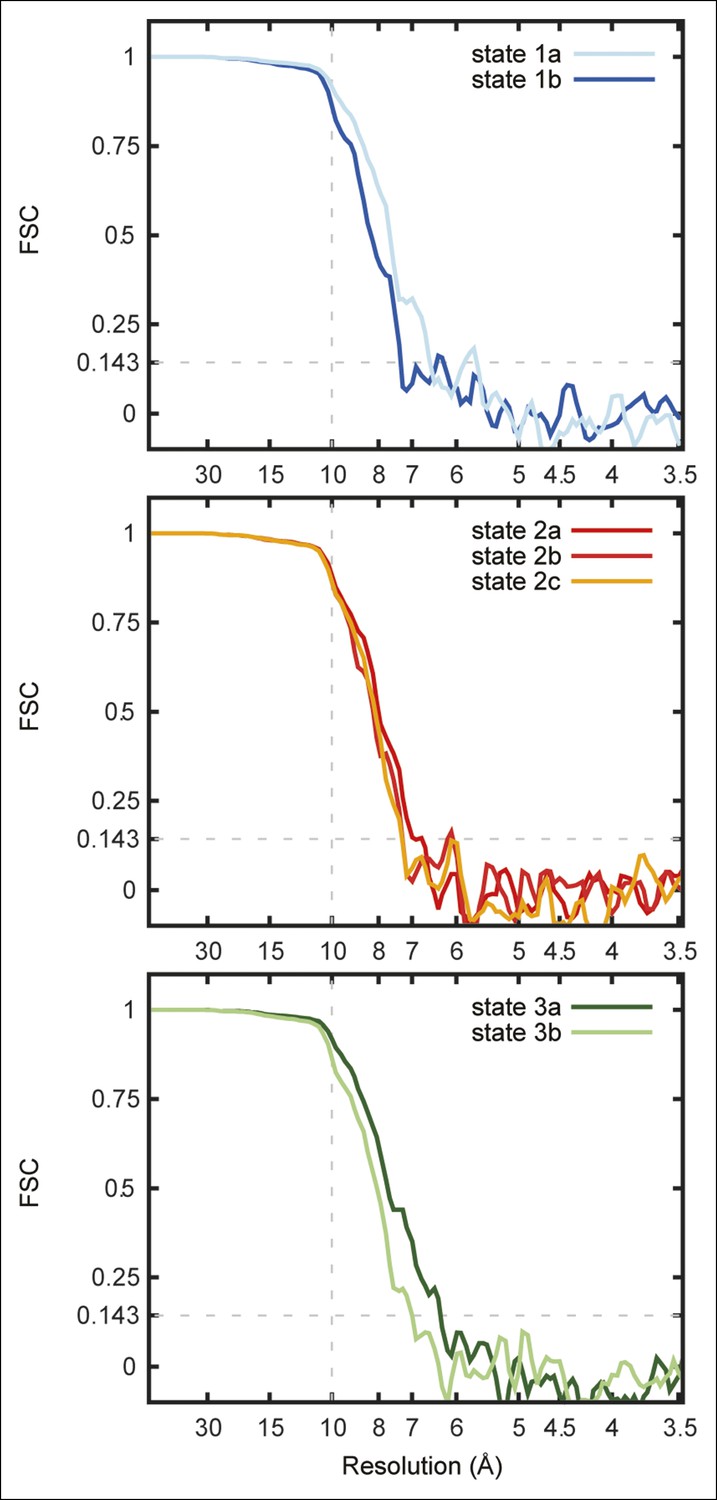
Fourier shell correlation curves for the seven maps.
FSC curves are shown for state 1a and 1b (A), state 2a, 2b, and 2c (B), and state 3a and 3b (C).
Figure 2 with 1 supplement
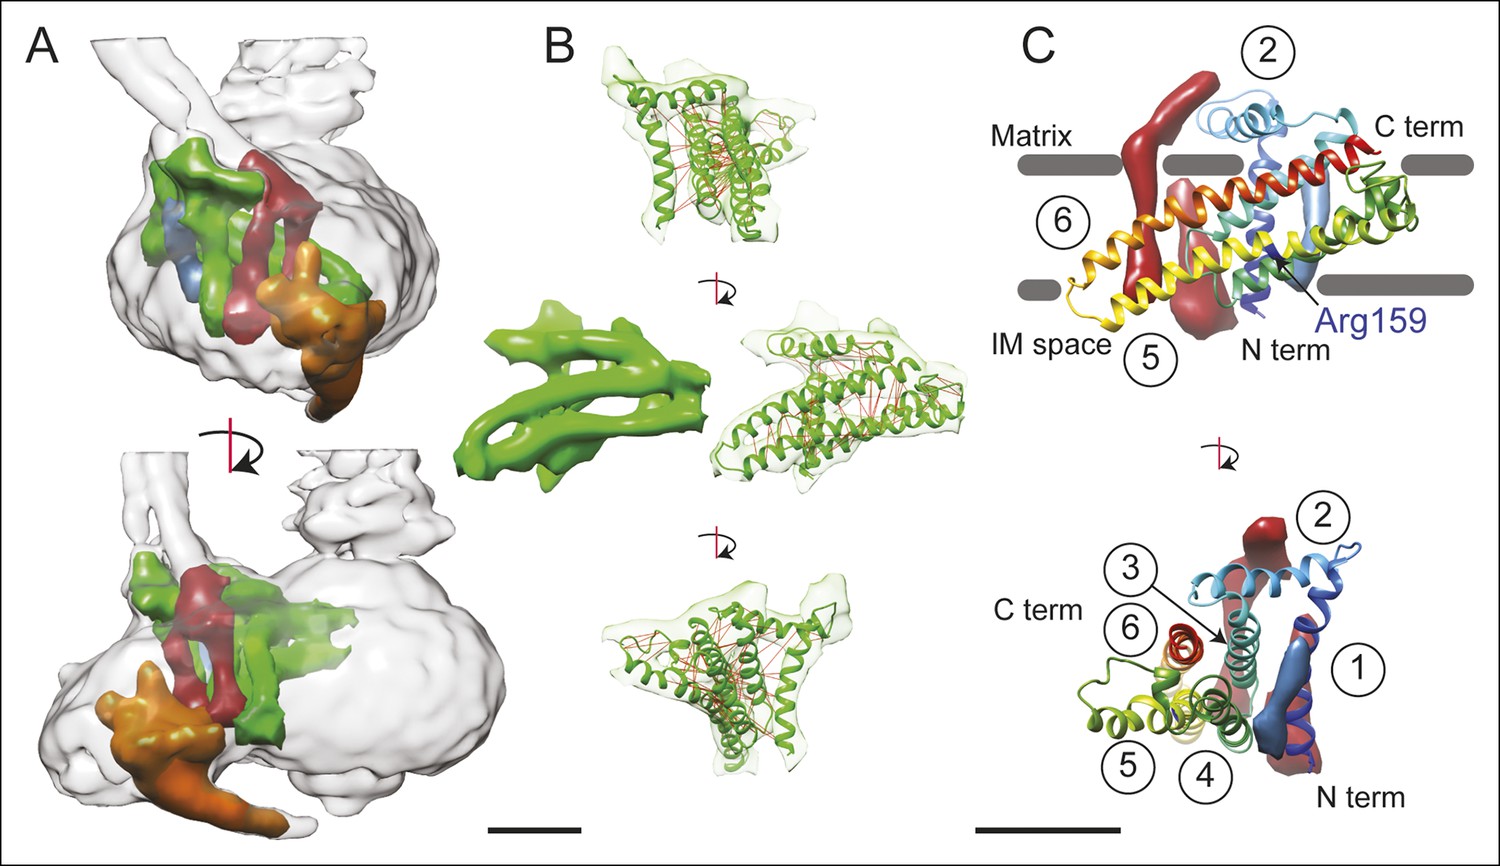
3D structure of the FO region.
(A) In the FO region of the complex, density was segmented for the a subunit (green), the b subunit (red), the A6L subunit (blue), and the structure thought to arise from subunits e and g (orange). (B) The a subunit sequence could be placed unambiguously into the cryo-EM density (green) by including constraints for residues predicted to be near to each other due to evolutionary covariance (red lines). (C) The a subunit (coloured with a gradient from blue to red to denote directionality from the N to C terminus) possesses six α-helices, numbered 1–6. Trans-membrane α-helices from subunits b and A6L are shown as volumes (red and blue, respectively). Five of the α-helices of subunit a are membrane-inserted while helix #2 runs along the matrix surface of the FO region. The N terminus of the a subunit is on the inter-membrane space side of the subunit while the C terminus is on the matrix side. The highly conserved residue Arg159 is on the elongated and highly tilted α-helix #5. Scale bar, 25 Å.
Figure 2—figure supplement 1
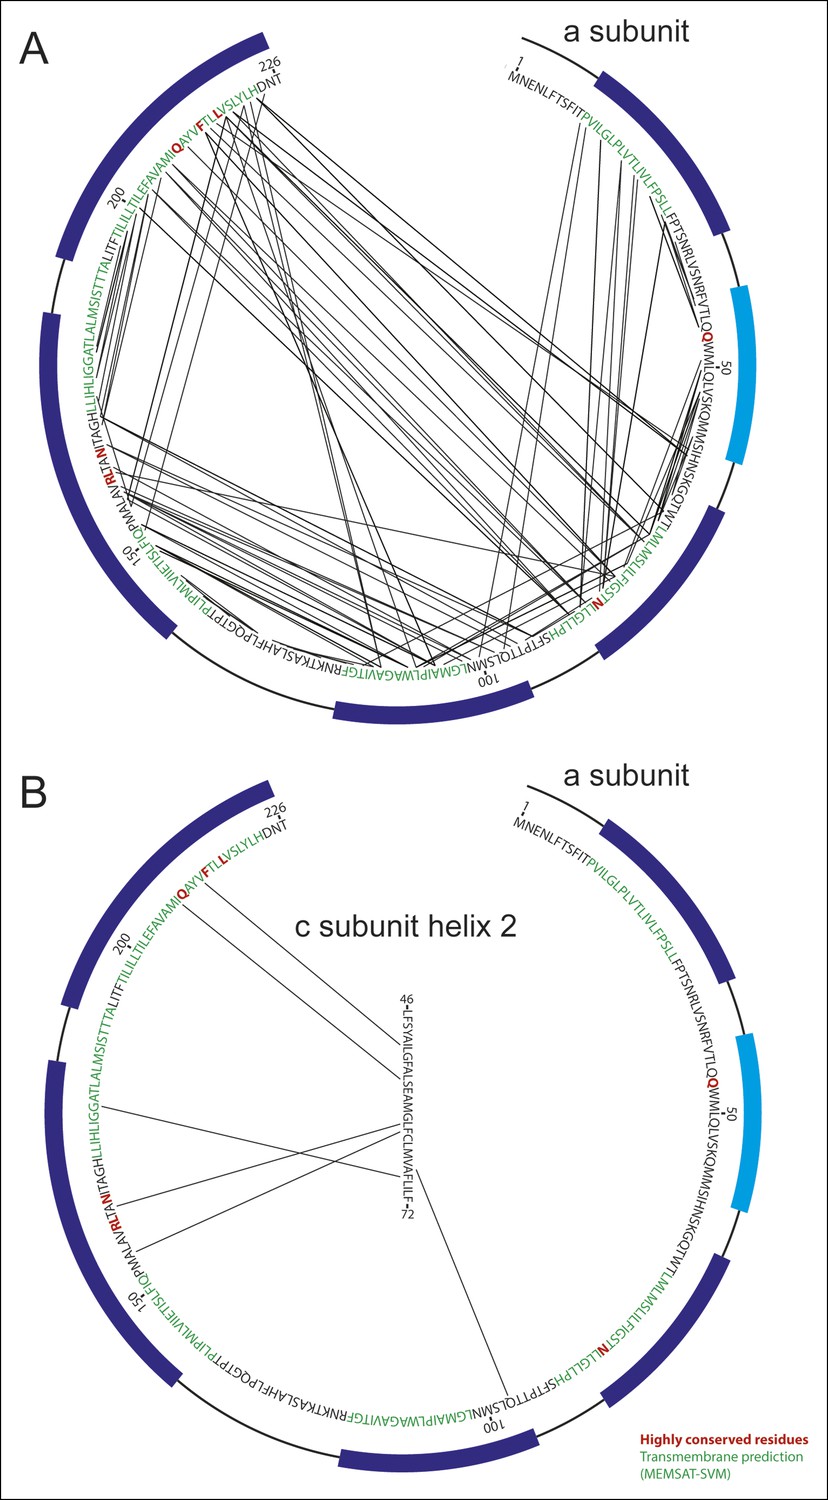
Analysis of evolutionary covariance of residues.
(A) The top 90 predicted couplings between residues of the a subunit are indicated, along with trans-membrane helices predicted by the MEMSAT-SVM algorithm (52), shown in green, and highly conserved residues, shown in red. Residues modeled as membrane-inserted α-helices based on the cryo-EM density are indicated with dark blue rectangles outside of the sequence and residues modeled as a soluble α-helix based on the cryo-EM density is indicated with a light blue rectangle. (B) The top six predicted couplings between residues of the a subunit and residues on the outer surface of the c-ring are indicated.
Figure 3 with 1 supplement
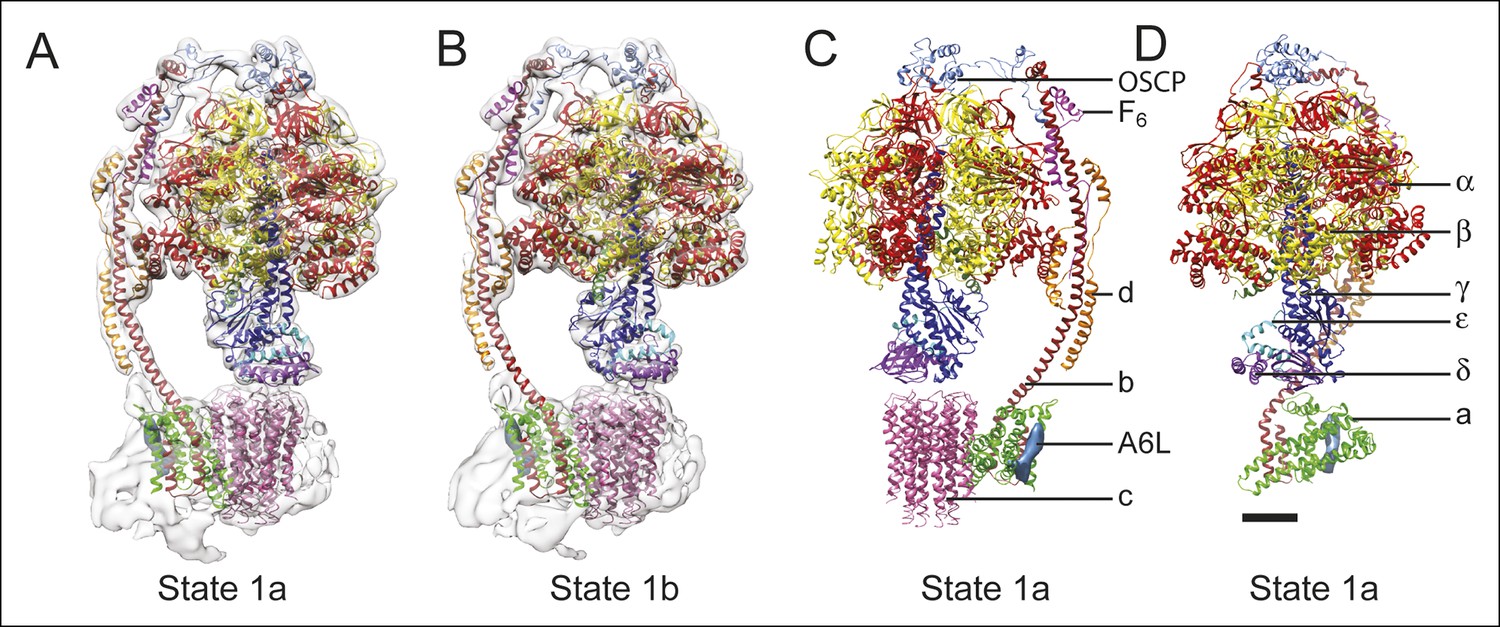
Docking of atomic models into the cryo-EM maps.
Fitting of all available atomic models into the density map is shown for state 1a (A) and state 1b (B). State 1a is also shown in a different orientation and without the density map (C) and with the c8-ring removed for clarity (D). The apparent gap between the c8-ring and γ and δ subunits is filled with amino acid side chains and is the same as was seen in the crystal structure of the F1-c8 complex (Watt et al., 2010). Scale bar, 25 Å.
Figure 3—figure supplement 1
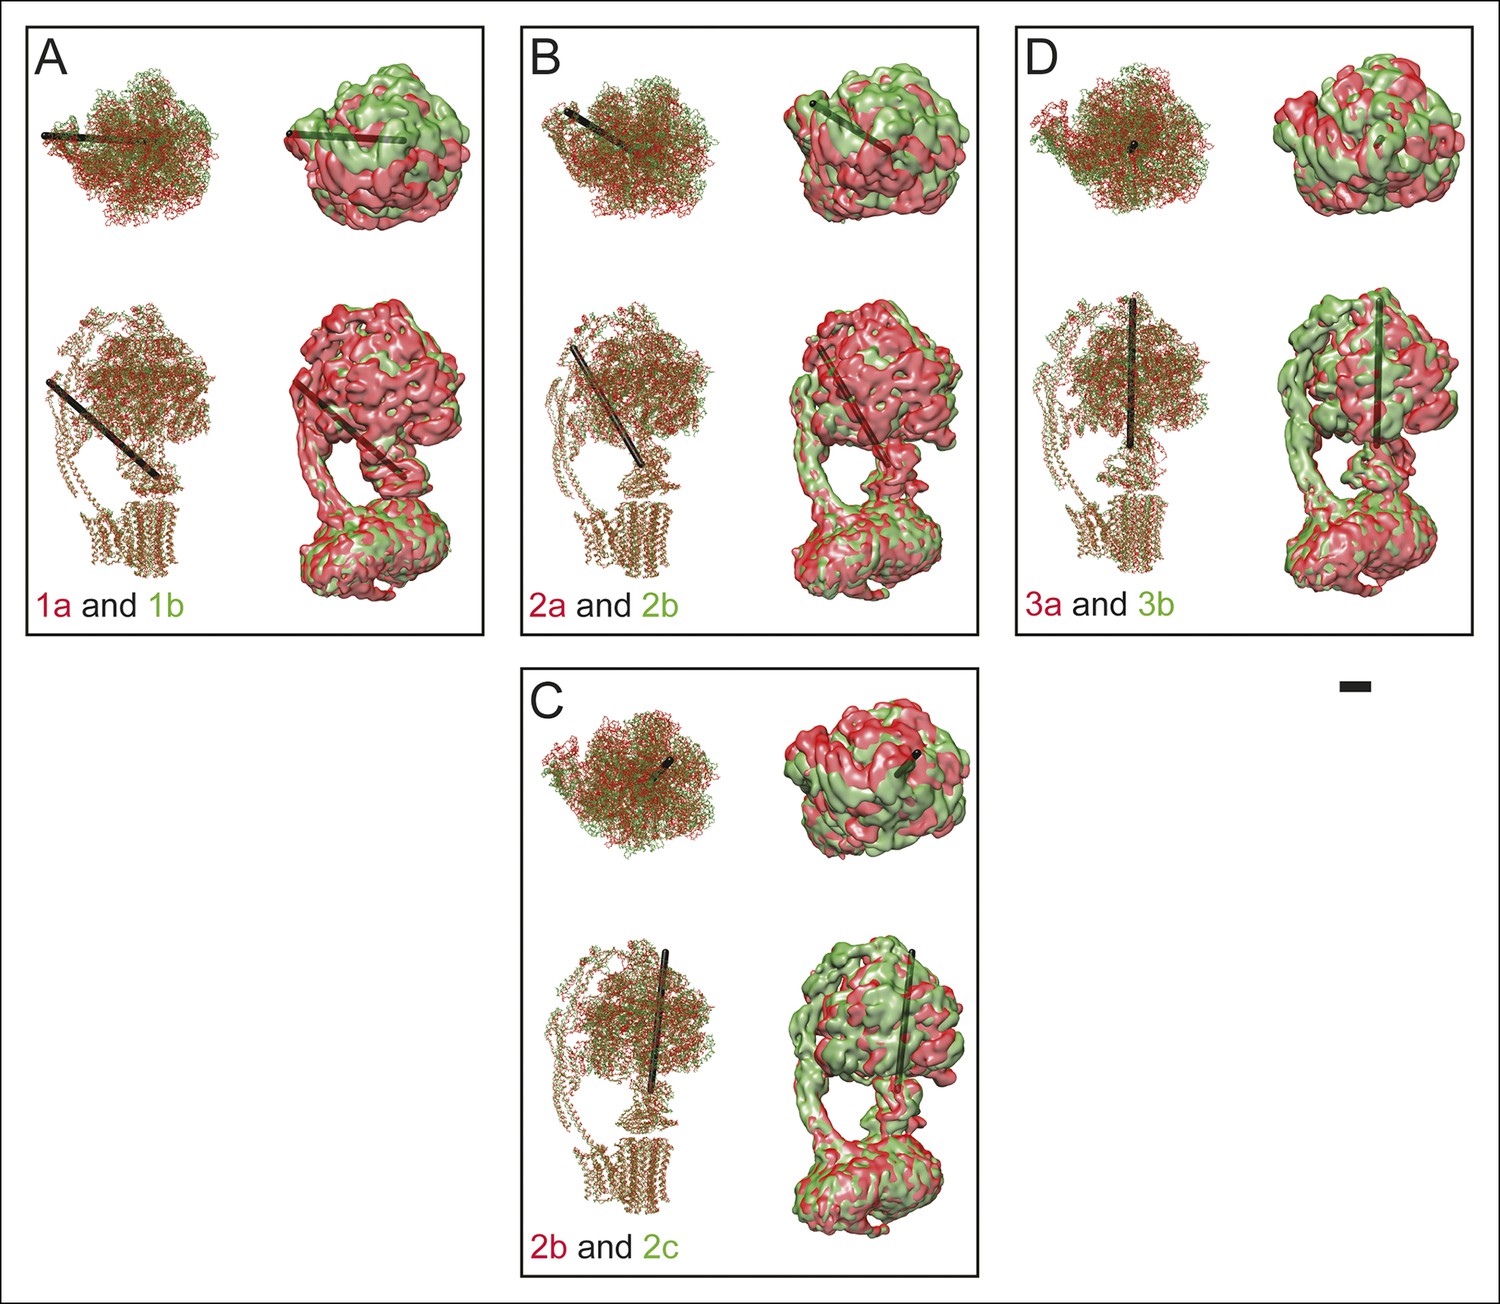
Differences between sub-states.
The differences between sub-states can be seen by overlaying maps and models for state 1a (red) and 1b (green) (A), 2a (red) and 2b (green) (B), 2b (red) and 2c (green) (C), and 3a (red) and 3b (green) (D). These differences can be represented approximately as a rigid body rotation of the 33 hexamer by 10 (state 1a to 1b), 11 (state 2a to 2b), 12 (state 2b to 1c), and 16 (state 3a to 3b). The axes of these rotations are shown as black rods. This movement is most easily seen in Videos 4 and 5. Scale bar, 25 Å.
Figure 4

Model for proton translocation.
(A and B) The a subunit (green), along with the membrane-intrinsic α-helices of the b subunit (red), form two clusters that could be the half channels needed for trans-membrane proton translocation. (C and D) The map segment corresponding to the c8-ring is shown for state 2a (pink) and state 2c (purple). The difference in rotational position of the c-ring is consistent with the Brownian fluctuations predicted for the generation of a net rotation. Scale bar, 25 Å.
Videos
Video 1
Slices through the seven cryo-EM maps.
Cross-sections are shown moving from the F1 region towards the FO region for states 1a, 1b, 2a, 2b, 2c, 3a, and 3b.
Video 2
Fold of the a subunit.
The density corresponding to the a subunit (green), membrane-inserted portion of the b subunit (red), and A6L subunit (blue) are shown, in addition to a ribbon diagram for the a subunit (green) and the top 90 constraints from analysis of covarying residues in the a subunit sequence (red lines). 6% of the constraints could not be satisfied, which is consistent with the false positive rate from known structures (Marks et al., 2011). Scale bar, 25 Å.
Video 3
Conformation changes during the rotary cycle.
Linear interpolation is shown between one of each of the main states identified by 3D classification (state 1a, 2a, and 3a) showing the large conformation changes that occur during rotation. Scale bar, 25 Å. [please view movie as loop]
Video 4
Conformational differences between the different ATP synthase maps.
Differences between conformations detected by 3D classification are illustrated by linear interpolation between state 1a and 1b, showing bending of the peripheral stalk near the OSCP and F6 subunits (A), state 2a and 2b showing a similar bending of the peripheral stalk near the OSCP and F6 subunits (B), state 2b and 2c showing bending of the peripheral stalk near the membrane region (C), and state 3a and 3b showing a similar bending of the peripheral stalk near the membrane region (D). Scale bar, 25 Å. [please view movie as loop]
Video 5
Conformational differences between the different ATP synthase maps.
The same interpolations as shown in Video 4, except viewed from the F1 region towards the FO region. Scale bar, 25 Å. [please view movie as loop]
Video 6
Brownian ratcheting.
The different rotational positions of the c8-ring between the sub-states are illustrated by interpolating between states 2a and 2c. The conserved residue Arg159 is shown as a blue sphere. The movement is consistent with the Brownian ratcheting predicted during proton translocation in rotary ATPases. Glu58 residues are shown moving from the proton-locked conformation (Pogoryelov et al., 2009) to an open conformation (Pogoryelov et al., 2010; Symersky et al., 2012) when they are close to the conserved Arg159 residue. Scale bar, 25 Å. [please view movie as loop]
Download links
A two-part list of links to download the article, or parts of the article, in various formats.
Downloads (link to download the article as PDF)
Open citations (links to open the citations from this article in various online reference manager services)
Cite this article (links to download the citations from this article in formats compatible with various reference manager tools)
Structure and conformational states of the bovine mitochondrial ATP synthase by cryo-EM
eLife 4:e10180.
https://doi.org/10.7554/eLife.10180


