C-C chemokine receptor 4 deficiency exacerbates early atherosclerosis in mice
- Laboratory of Medical Pharmaceutics, Kobe Pharmaceutical University, Japan
- Division of Cardiovascular Medicine, Department of Internal Medicine, Kobe University Graduate School of Medicine, Japan
- Division of Chemotherapy, Faculty of Pharmacy, Kindai University, Japan
Figures
Figure 1
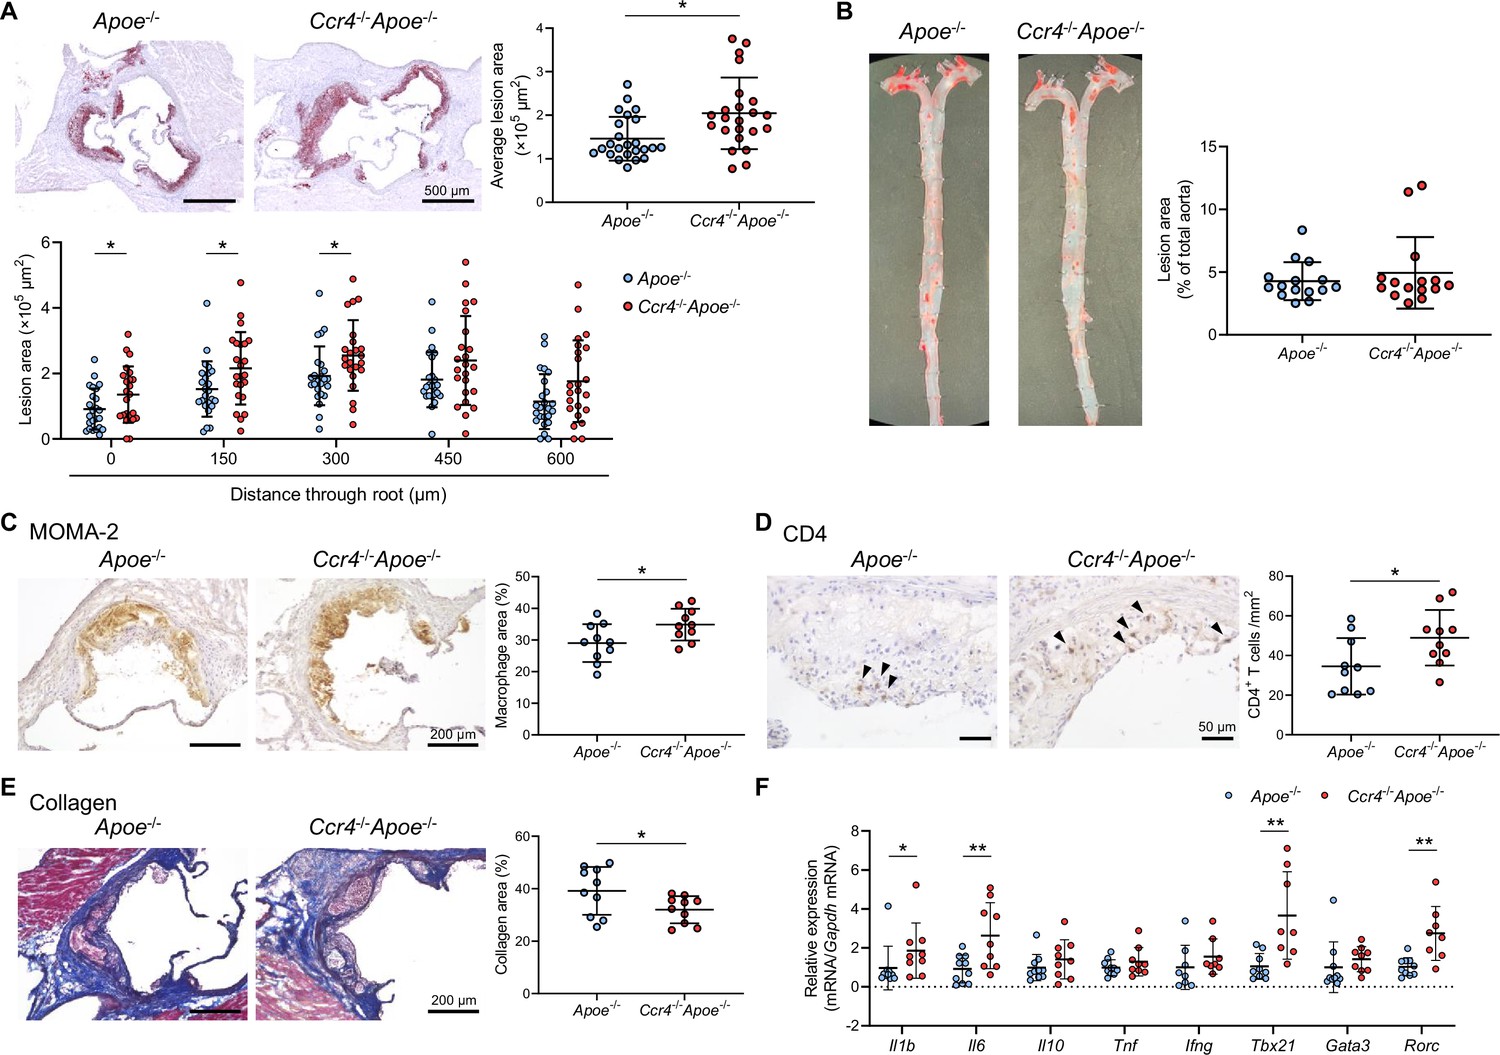
C-C chemokine receptor 4 (CCR4) deficiency accelerates the development of early atherosclerotic lesions characterized by an inflammatory plaque phenotype.
(A) Representative photomicrographs of Oil Red O staining and quantitative analysis of atherosclerotic lesion area at five different levels and the average area in the aortic sinus of 18-week-old apolipoprotein E-deficient (Apoe-/-) mice (n=24) or CCR4-deficient mice on an Apoe-/- background (Ccr4-/-Apoe-/-; n=23). (B) Representative photomicrographs of Oil Red O staining and quantitative analysis of atherosclerotic lesion area in the aorta of 18-week-old Apoe-/- (n=15) or Ccr4-/-Apoe-/- mice (n=15). (C–E) Representative sections and quantitative analyses of MOMA-2+ macrophages (C), CD4+ T cells (D), and collagen (E) in the aortic sinus. Arrowheads indicate the CD4+ T cells. n=10 per group. (F) mRNA expression of pro- or anti-inflammatory cytokines and helper T cell-associated transcription factors in aorta. The expression levels of the target genes were normalized so that the mean values in Apoe-/- mice were set to 1. n=8–10 per group. Eighteen-week-old Apoe-/- or Ccr4-/-Apoe-/- mice were used for all experiments. Black bars represent 50, 200, or 500 μm as described. Data points represent individual animals. Horizontal bars represent means. Error bars indicate s.d. *p<0.05, **p<0.01; Mann–Whitney U-test: (A) and (F) l1b; two-tailed Student’s t-test: (C–F) Il6, Tbx21, and Rorc.
-
Figure 1—source data 1
Raw numerical values for Figure 1 plots.
- https://cdn.elifesciences.org/articles/101830/elife-101830-fig1-data1-v1.xlsx
Figure 2 with 4 supplements
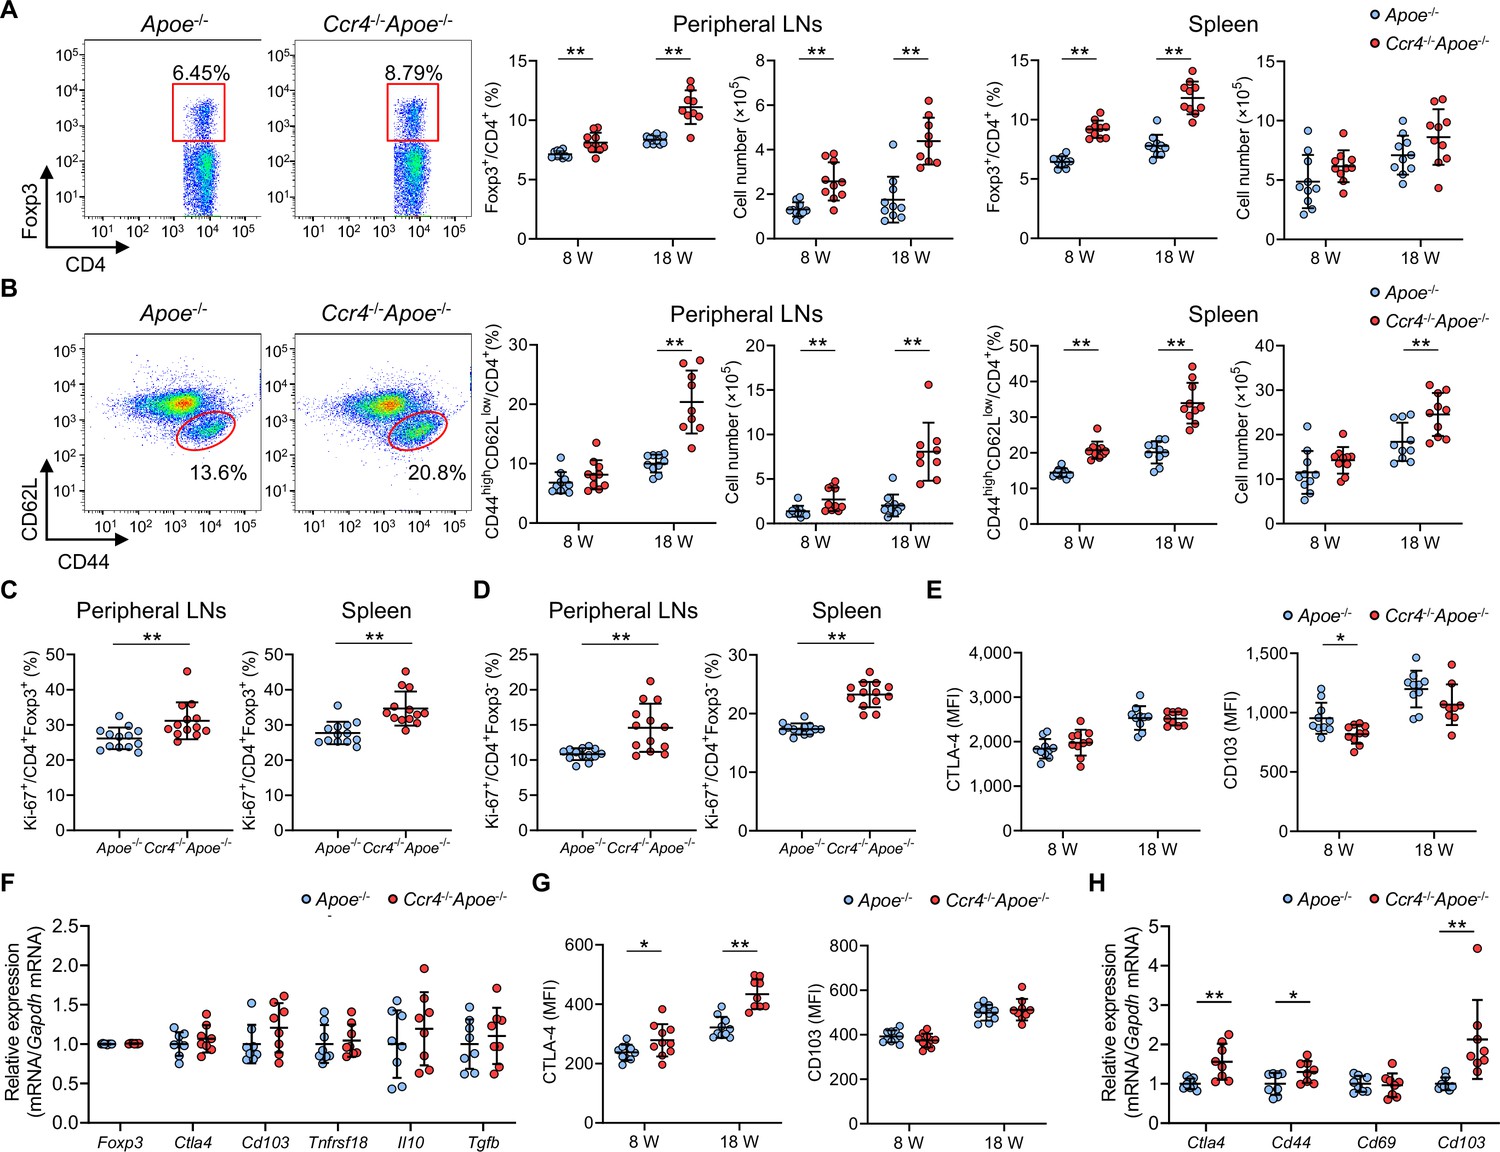
C-C chemokine receptor 4 (CCR4) deficiency augments effector T cell immune responses in peripheral lymphoid tissues.
(A, B) Representative flow cytometric analysis of CD4+ forkhead box P3 (Foxp3)+ regulatory T cells (Tregs) (A) and CD4+CD44highCD62Llow effector memory T cells (B) in the spleen of 8-week-old apolipoprotein E-deficient (Apoe-/-) mice or CCR4-deficient mice on an Apoe-/- background (Ccr4-/-Apoe-/-). The graphs represent the total numbers and proportions of CD4+Foxp3+ Tregs (A) and CD4+CD44highCD62Llow effector memory T cells (B) in the peripheral lymph nodes (LNs) and spleen of 8- or 18- week-old Apoe-/- or Ccr4-/-Apoe-/- mice. n=9–10 per group. (C, D) The graphs represent the proportions of Ki-67-positive cells among CD4+Foxp3+ Tregs (C) and CD4+Foxp3- non-Tregs (D) in the peripheral LNs and spleen of 8-week-old Apoe-/- or Ccr4-/-Apoe-/- mice, as assessed by flow cytometry. n=13 per group. (E) Expression levels of activation-associated molecules cytotoxic T lymphocyte-associated antigen-4 (CTLA-4) and CD103 were analyzed by gating on CD4+Foxp3+ Tregs in the peripheral LNs of 8- or 18-week-old Apoe-/- or Ccr4-/-Apoe-/- mice. n=9–10 per group. (F) mRNA expression of Treg-associated markers in splenic Tregs from 8-week-old Apoe-/- or Ccr4-/-Apoe-/- mice. n=8 per group. (G) Expression levels of activation-associated molecules CTLA-4 and CD103 were analyzed by gating on CD4+Foxp3- non-Tregs in the peripheral LNs of 8- or 18-week-old Apoe-/- or Ccr4-/-Apoe-/- mice. n=9–10 per group. (H) mRNA expression of activation-associated molecules in splenic non-Tregs from 8-week-old Apoe-/- or Ccr4-/-Apoe-/- mice. n=8 per group. The expression levels of the target genes were normalized so that the mean values in Apoe-/- mice were set to 1 (F, H). Data points represent individual animals. Horizontal bars represent means. Error bars indicate s.d. *p<0.05, **p<0.01; Mann–Whitney U-test: (A) second (8w) from the left, (B) second (8w) and third (8w) from the left, (C, left, and H) Cd44 and Cd103; two-tailed Student’s t-test: (A) first, second (18w), and third from the left, (B) first, second (18w), third (18w), and fourth from the left, (C, right, D, E, G, and H) Ctla4. MFI, mean fluorescence intensity.
-
Figure 2—source data 1
Raw numerical values for Figure 2 plots.
- https://cdn.elifesciences.org/articles/101830/elife-101830-fig2-data1-v1.xlsx
Figure 2—figure supplement 1
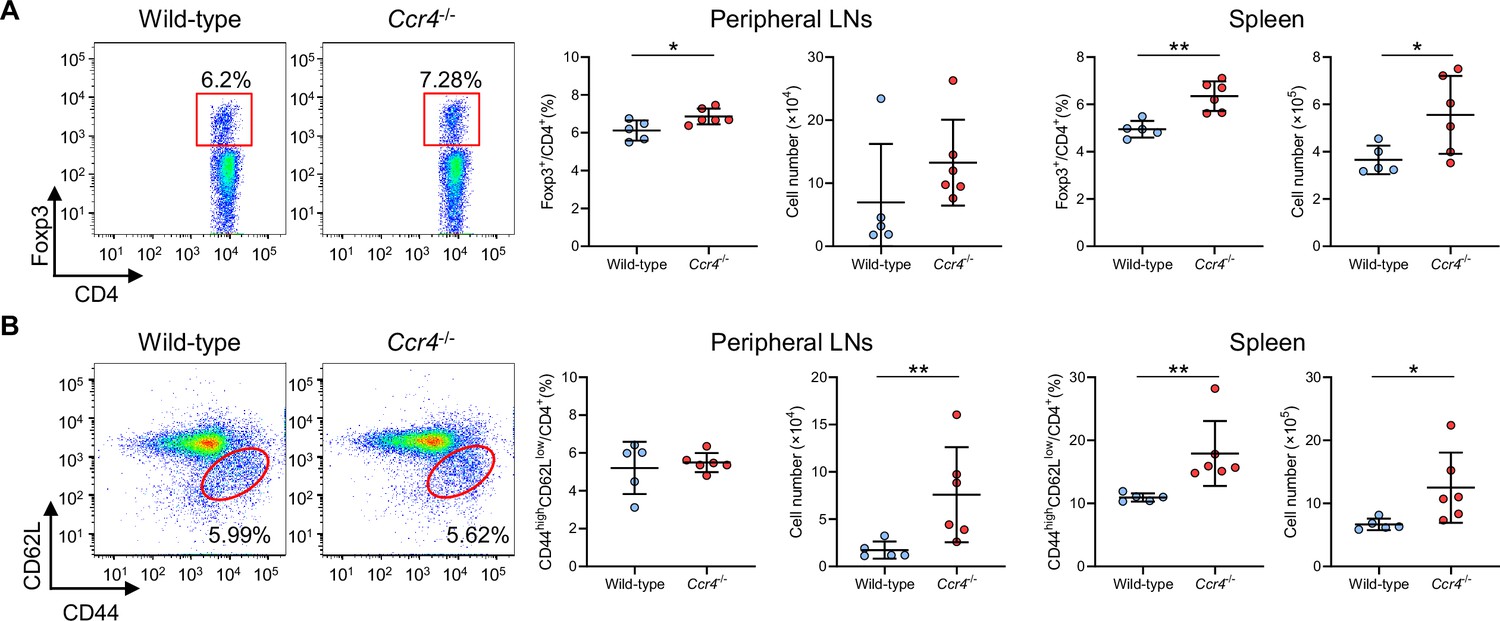
CCR4 deficiency expands peripheral Tregs and effector memory T cells in the peripheral lymphoid tissues of normocholesterolemic mice.
Representative flow cytometric analysis of CD4+Foxp3+ Tregs (A) and CD4+CD44highCD62Llow effector memory T cells (B) in the peripheral lymph nodes (LNs) and spleen of 8-week-old wild-type or Ccr4-/- mice. The graphs represent the total numbers and proportions of CD4+Foxp3+ Tregs (A) and CD4+CD44highCD62Llow effector memory T cells (B) in the peripheral LNs and spleen. n=5–6 per group. Data points represent individual animals. Horizontal bars represent means. Error bars indicate s.d. *p<0.05, **p<0.01; Mann–Whitney U-test: (B) second and third from the left; two-tailed Student’s t-test: (A, B) fourth from the left.
-
Figure 2—figure supplement 1—source data 1
Raw numerical values for Figure 2—figure supplement 1 plots.
- https://cdn.elifesciences.org/articles/101830/elife-101830-fig2-figsupp1-data1-v1.xlsx
Figure 2—figure supplement 2
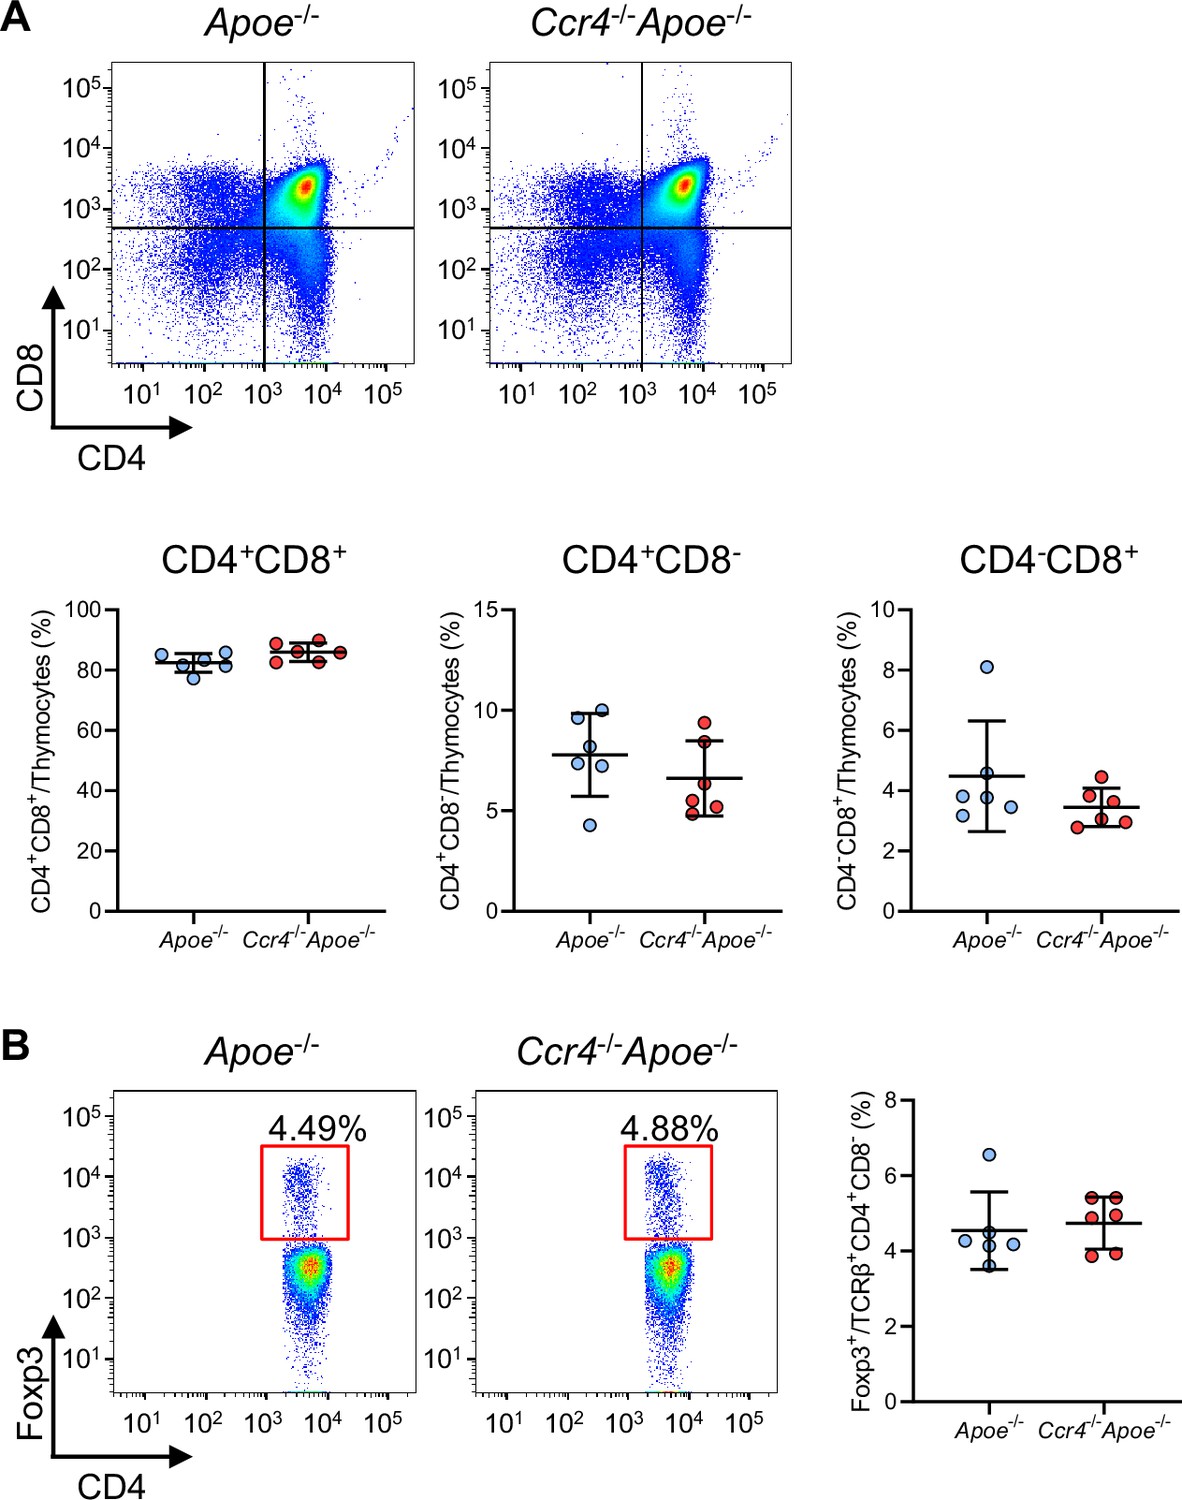
CCR4 deficiency does not affect T cell development in the thymus.
Lymphoid cells from the thymus of 4-week-old Apoe-/- or Ccr4-/-Apoe-/- mice were prepared. (A) Representative flow cytometric analysis of CD4 and CD8 expression in thymocytes. The graphs represent the numbers and proportions of CD4/CD8 double-positive (CD4+CD8+), CD4 single-positive (CD4+), and CD8 single-positive (CD8+) T cells among thymocytes. (B) Representative flow cytometric analysis of Foxp3 expression among the TCR-β+CD4+CD8- population. The graph represents the proportion of Foxp3+ Tregs among the TCR-β+CD4+CD8- population. n=6 per group. Data points represent individual animals. Horizontal bars represent means. Error bars indicate s.d.
-
Figure 2—figure supplement 2—source data 1
Raw numerical values for Figure 2—figure supplement 2 plots.
- https://cdn.elifesciences.org/articles/101830/elife-101830-fig2-figsupp2-data1-v1.xlsx
Figure 2—figure supplement 3

CCR4 deficiency has a minor effect on the proportions of other immune cells in the spleen.
Proportions of splenic CD8+ T cells, B220+ B cells, CD11b+Ly6G+ neutrophils, CD11b+Ly6Chigh monocytes, NK cells, NKT cells, and CD11c+MHC-II+ DCs, and the expression of CD80 and CD86 on CD11c+MHC-II+ DCs in 8-week-old Apoe-/- or Ccr4-/-Apoe-/- mice were determined by flow cytometry. n=5 per group. Data are representative of two independent experiments. Data points represent individual animals. Horizontal bars represent means. Error bars indicate s.d. **p<0.01; two-tailed Student’s t-test. MFI, mean fluorescence intensity.
-
Figure 2—figure supplement 3—source data 1
Raw numerical valuse for Figure 2—figure supplement 3 plots.
- https://cdn.elifesciences.org/articles/101830/elife-101830-fig2-figsupp3-data1-v1.xlsx
Figure 2—figure supplement 4
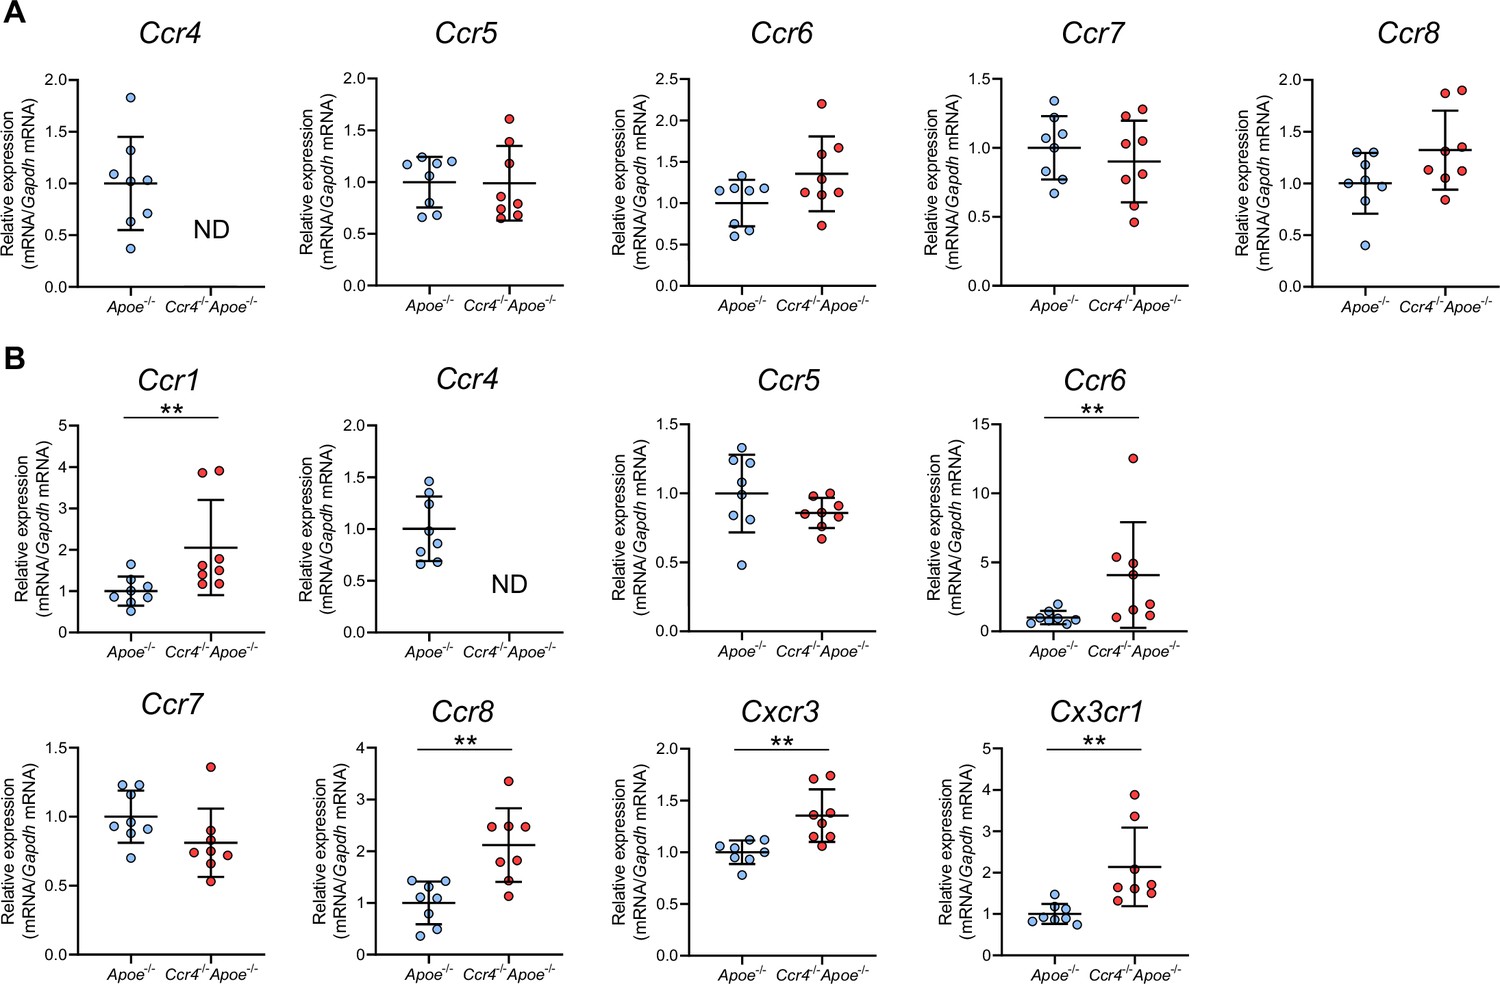
The effect of CCR4 deficiency on the expression of various chemokine receptors in splenic Tregs and non-Tregs.
mRNA expression of chemokine receptors in splenic Tregs (A) and non-Tregs (B) from 8-week-old Apoe-/- or Ccr4-/-Apoe-/- mice. The expression levels of the target genes were normalized so that the mean values in Apoe-/- mice were set to 1. n=8 per group. Data points represent individual animals. Horizontal bars represent means. Error bars indicate s.d. **p<0.01; Mann–Whitney U-test: (B) top first and third from the left and bottom third from the left; two-tailed Student’s t-test: (B) bottom first and second from the left. ND, not detected.
-
Figure 2—figure supplement 4—source data 1
Raw numerical values for Figure 2—figure supplement 4 plots.
- https://cdn.elifesciences.org/articles/101830/elife-101830-fig2-figsupp4-data1-v1.xlsx
Figure 3
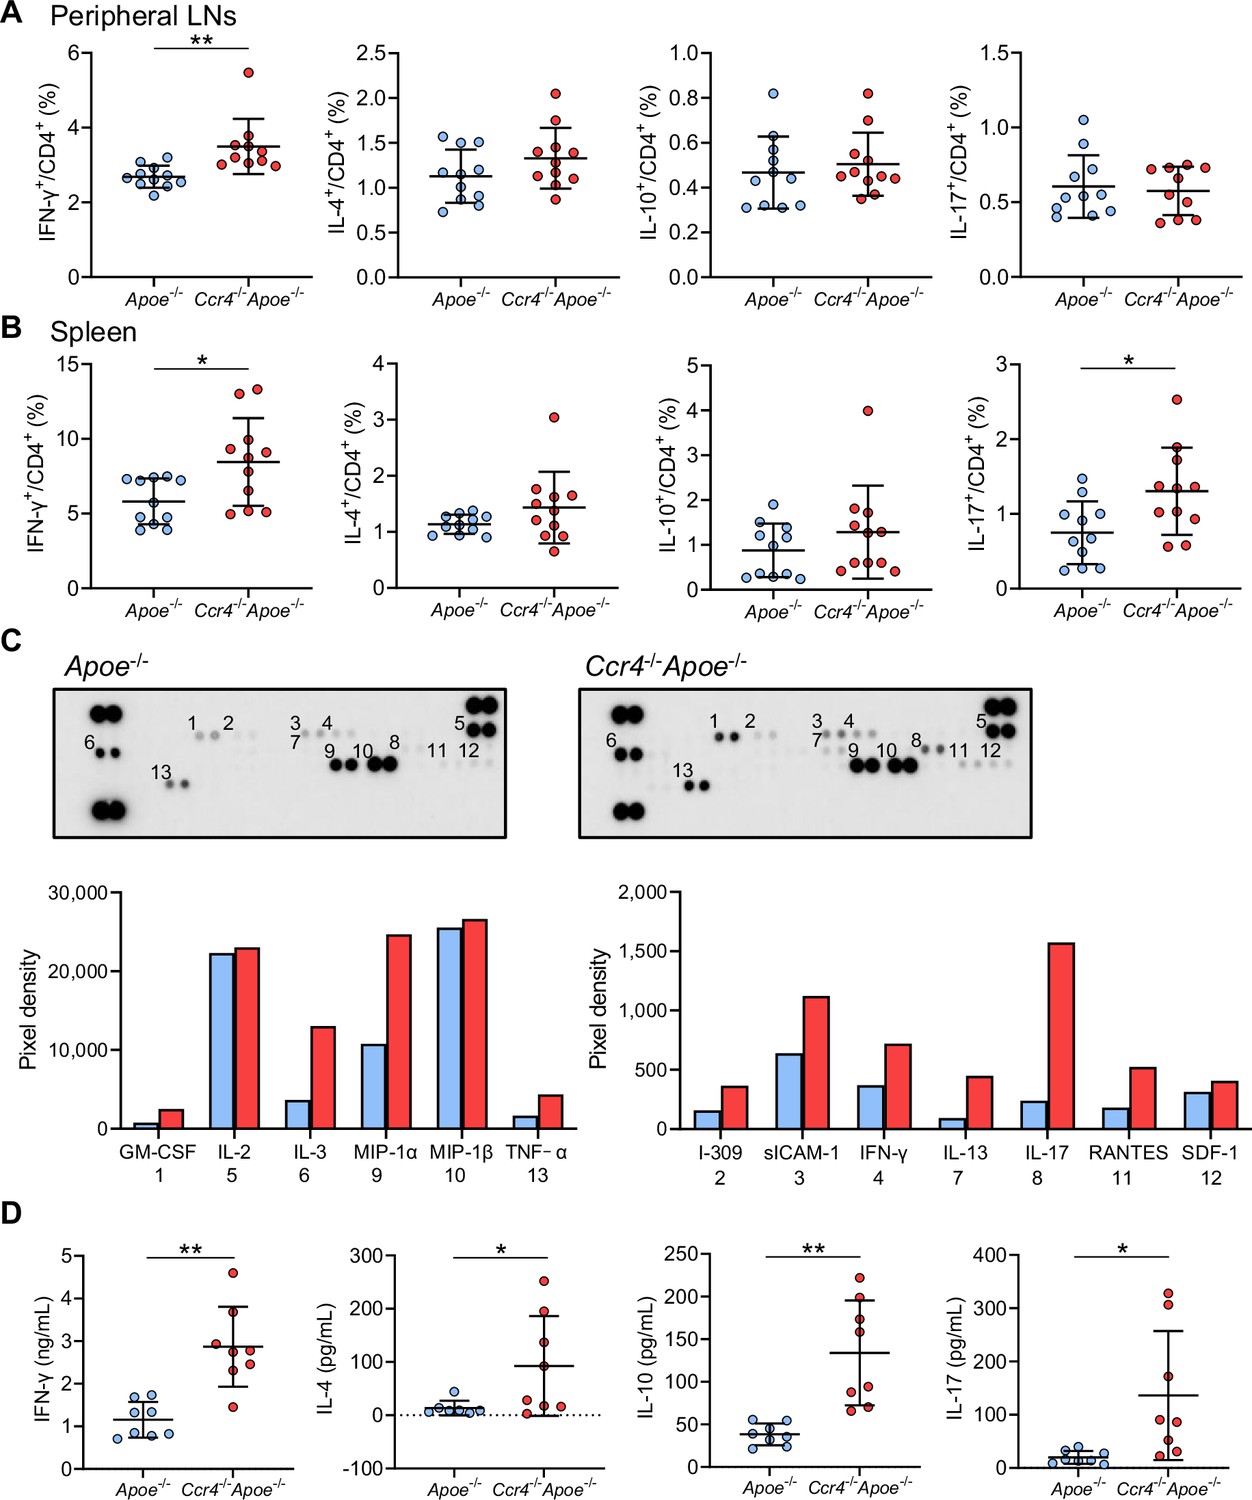
C-C chemokine receptor 4 (CCR4) deficiency promotes proinflammatory CD4+ T cell immune responses in peripheral lymphoid tissues.
(A, B) The graphs represent the frequencies of interferon (IFN)-γ+, interleukin (IL)–4+, IL-10+, and IL-17+ CD4+ T cells in the peripheral lymph nodes (LNs) (A) and spleen (B) of 8-week-old apolipoprotein E-deficient (Apoe-/-) mice or CCR4-deficient mice on an Apoe-/- background (Ccr4-/-Apoe-/-). n=10–11 per group. (C, D) Purified splenic CD4+ T cells from 8-week-old Apoe-/- or Ccr4-/-Apoe-/- mice were stimulated with plate-bound anti-CD3 and soluble anti-CD28 antibodies in vitro. The levels of various cytokines and chemokines in pooled cell supernatants from eight mice in each group were determined semiquantitatively by a cytokine array kit (C). Data are representative of two independent experiments. Cytokine concentrations in the cell supernatants were measured by ELISA (D). n=8 per group. Data points represent individual animals. Horizontal bars represent means. Error bars indicate s.d. *p<0.05, **p<0.01; Mann–Whitney U-test: (A, B) first from the left, and (D) second from the left; two-tailed Student’s t-test: (B) fourth from the left and (D) first, third, and fourth from the left.
-
Figure 3—source data 1
Raw numerical values for Figure 3 plots.
- https://cdn.elifesciences.org/articles/101830/elife-101830-fig3-data1-v1.xlsx
Figure 4 with 2 supplements
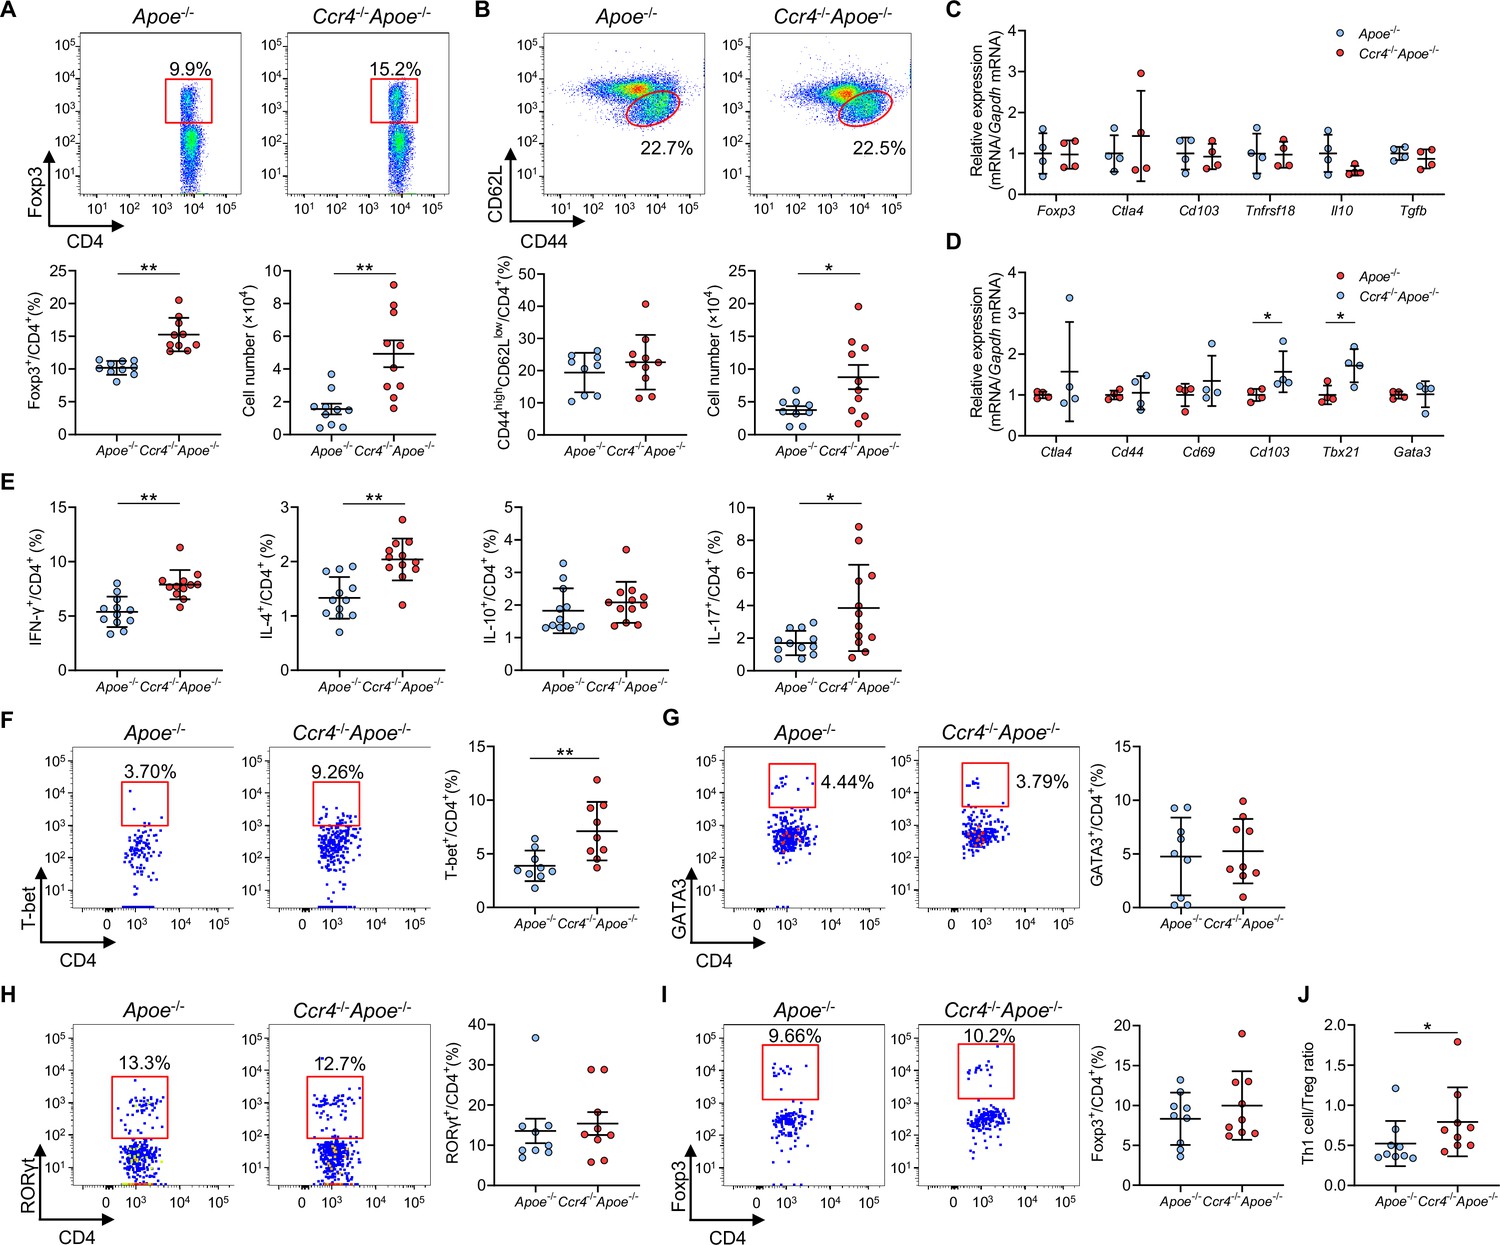
C-C chemokine receptor 4 (CCR4) deficiency promotes T helper type 1 (Th1) cell responses in para-aortic lymph nodes (LNs) and atherosclerotic aorta.
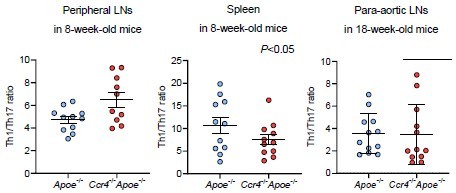
(A, B) Representative flow cytometric analysis of CD4+ forkhead box P3 (Foxp3)+ regulatory T cells (Tregs) (A) and CD4+CD44highCD62Llow effector memory T cells (B) in para-aortic LNs. The graphs represent the total numbers and proportions of CD4+Foxp3+ Tregs (A) and CD4+CD44highCD62Llow effector memory T cells (B) in para-aortic LNs. n=9–10 per group. (C, D) mRNA expression of Treg-associated markers in Tregs (C) and mRNA expression of activation or helper T cell-associated molecules in non-Tregs (D) in para-aortic LNs. The expression levels of the target genes were normalized so that the mean values in apolipoprotein E-deficient (Apoe-/-) mice were set to 1. Tregs or non-Tregs purified from pooled para-aortic LNs of 9–10 mice were analyzed as a sample. n=4 per group. (E) The graphs represent the frequencies of interferon (IFN)-γ+, interleukin (IL)–4+, IL-10+, and IL-17+ CD4+ T cells in para-aortic LNs. n=12 per group. (F–H) Representative flow cytometric analysis of T-box expressed in T cells (T-bet) (F), GATA3 (G), and retinoic acid-related orphan receptor gamma t (RORγt) (H) expression in aortic CD3+CD4+CD45+ T cells. The graphs represent the frequencies of T-bet+ (F), GATA3+ (G), and RORγt+ (H) cells among aortic CD3+CD4+CD45+ T cells. n=9 per group. (I) Representative flow cytometric analysis of Foxp3 expression in aortic CD3+CD4+CD45+ T cells. The graph represents the frequency of Foxp3+ Tregs among aortic CD3+CD4+CD45+ T cells. n=9 per group. (J) The graph represents the ratio of CD4+T-bet+ Th1 cells to CD4+Foxp3+ Tregs (Th1 cell/Treg ratio). n=9 per group. Pooled aortic lymphoid cells from two mice were analyzed as a sample. Eighteen-week-old Apoe-/- or CCR4-deficient mice on an Apoe-/- background (Ccr4-/-Apoe-/-) were used for all experiments. Data points represent individual animals (A, B, and E) or individual pooled samples (C, D, F–J). Horizontal bars represent means. Error bars indicate s.d. *p<0.05, **p<0.01; Mann–Whitney U-test: (D) Cd103 and (J); two-tailed Student’s t-test: (A, B, D) Tbx21, (E, F).
-
Figure 4—source data 1
Raw numerical values for Figure 4 plots.
- https://cdn.elifesciences.org/articles/101830/elife-101830-fig4-data1-v1.xlsx
Figure 4—figure supplement 1
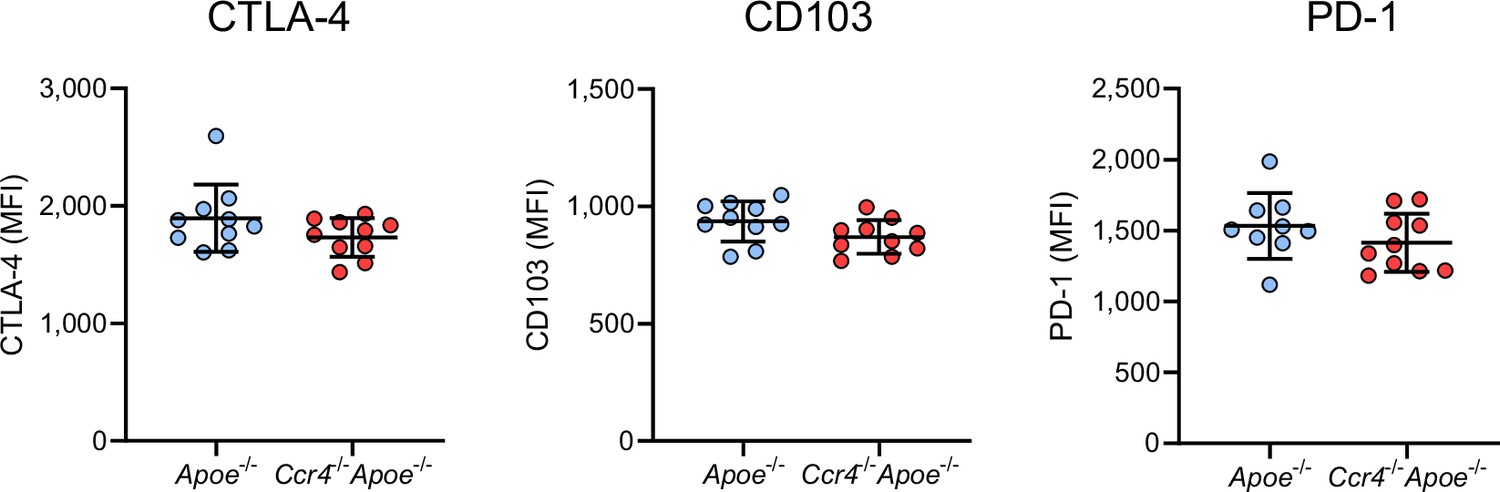
CCR4 deficiency does not affect the expression of activation- or function-associated molecules in Tregs in para-aortic lymph nodes (LNs).
Expression levels of CTLA-4, CD103, and PD-1 were analyzed by gating on CD4+Foxp3+ Tregs in the para-aortic LNs of 18-week-old Apoe-/- or Ccr4-/-Apoe-/- mice. n=9–10 per group. Data points represent individual animals. Horizontal bars represent means. Error bars indicate s.d. MFI, mean fluorescence intensity.
-
Figure 4—figure supplement 1—source data 1
Raw numerical values for Figure 4—figure supplement 1 plots.
- https://cdn.elifesciences.org/articles/101830/elife-101830-fig4-figsupp1-data1-v1.xlsx
Figure 4—figure supplement 2
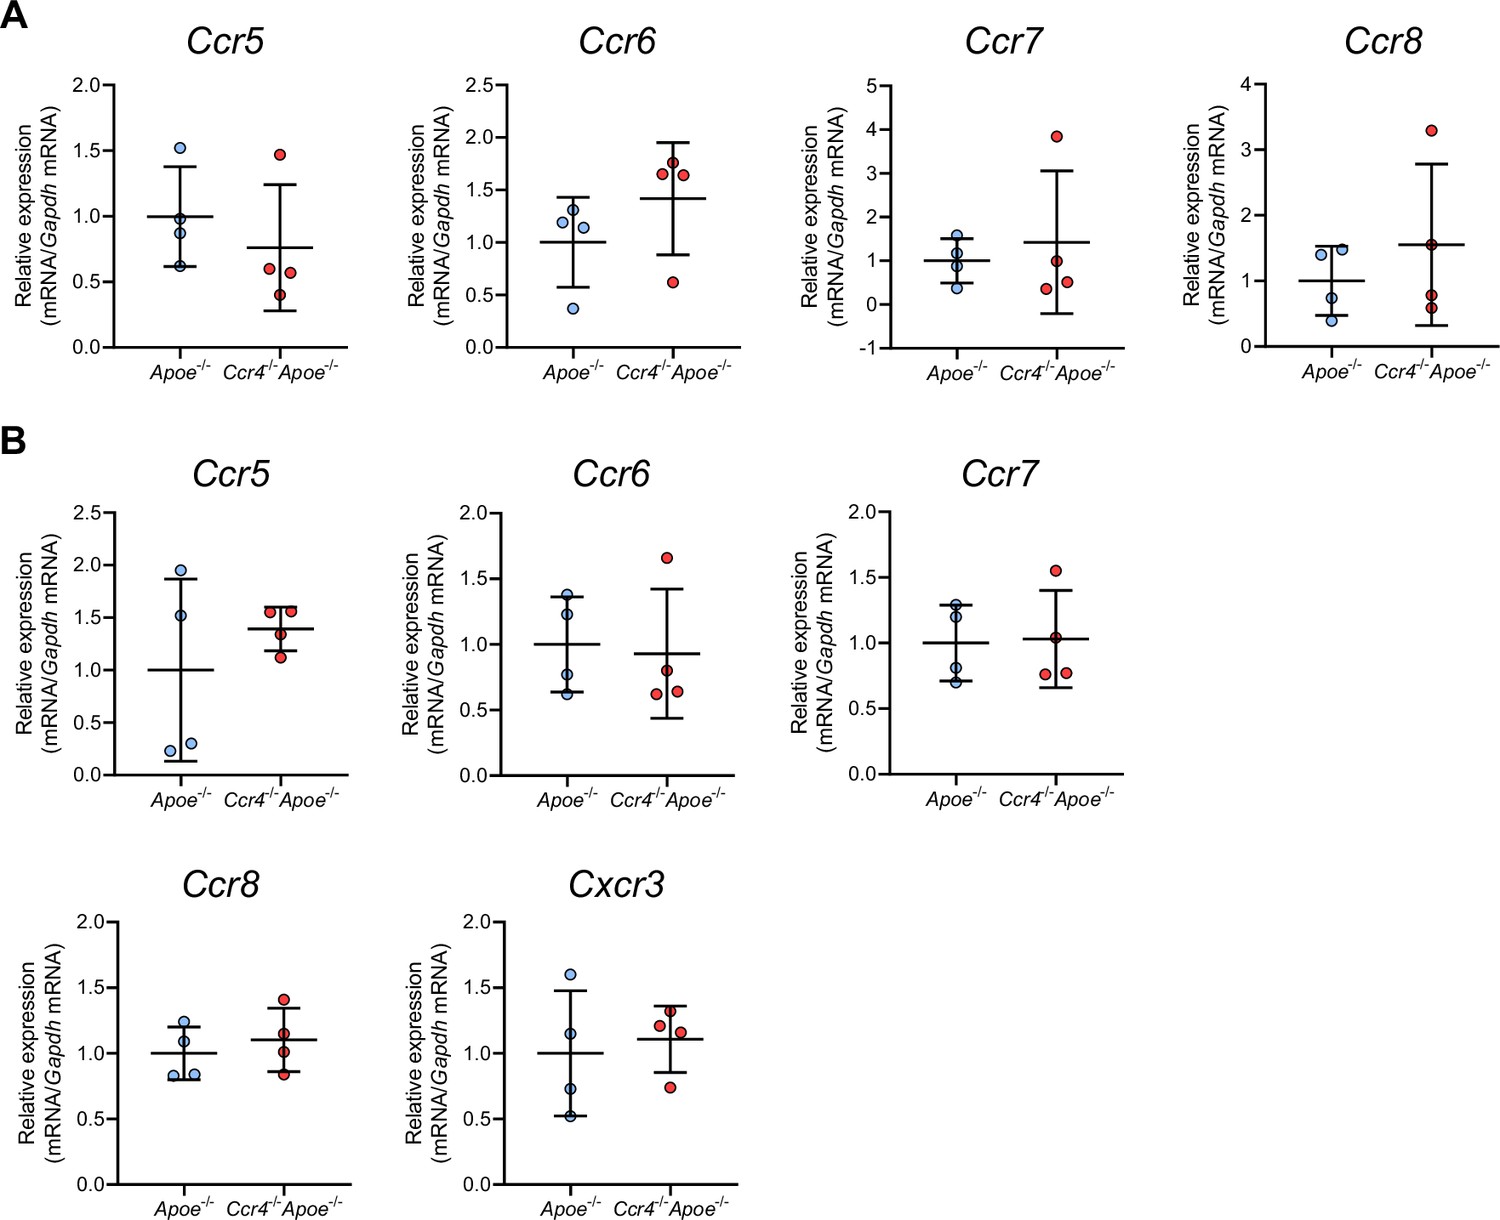
The effect of CCR4 deficiency on the expression of various chemokine receptors in Tregs and non-Tregs in para-aortic lymph nodes (LNs).
mRNA expression of chemokine receptors in Tregs (A) and non-Tregs (B) in the para-aortic LNs of 18-week-old Apoe-/- or Ccr4-/-Apoe-/- mice. The expression levels of the target genes were normalized so that the mean values in Apoe-/- mice were set to 1. Tregs or non-Tregs purified from pooled para-aortic LNs of 9–10 mice were analyzed as a sample. n=4 per group. Data points represent individual pooled samples. Horizontal bars represent means. Error bars indicate s.d.
-
Figure 4—figure supplement 2—source data 1
Raw numerical values for Figure 4—figure supplement 2 plots.
- https://cdn.elifesciences.org/articles/101830/elife-101830-fig4-figsupp2-data1-v1.xlsx
Figure 5
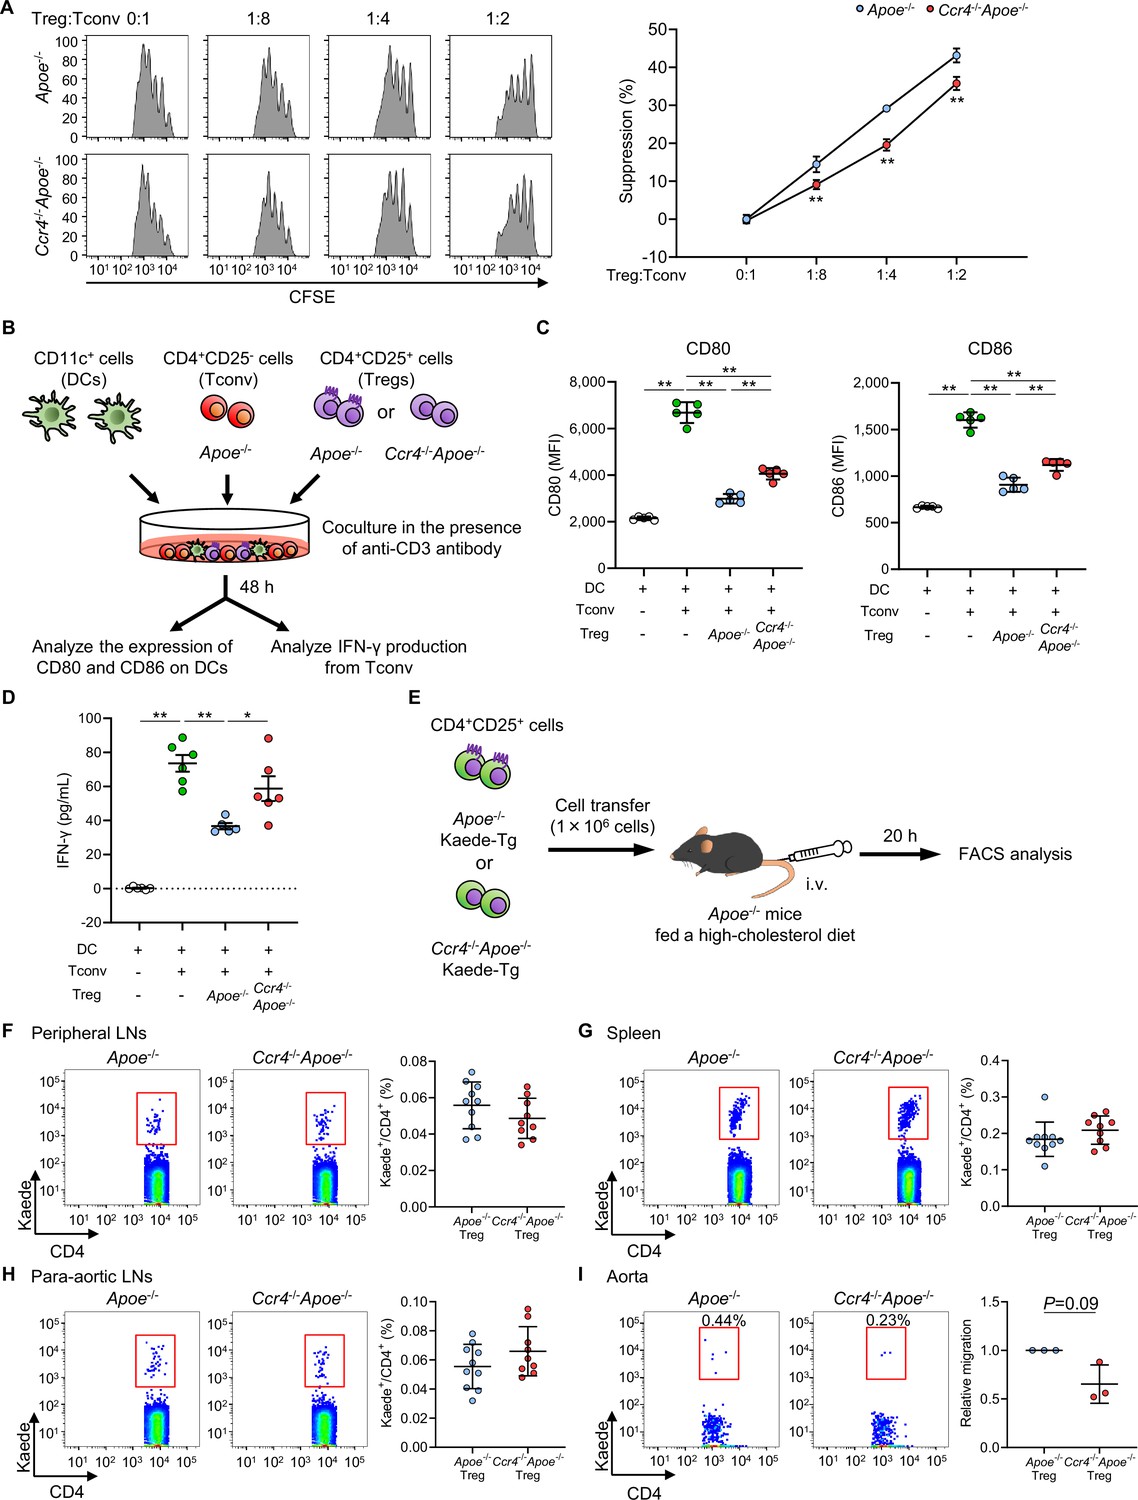
C-C chemokine receptor 4 (CCR4) expression on regulatory T cells (Tregs) regulates T helper type 1 cell responses and mediates Treg migration to the aorta.
(A) The suppressive function of Tregs was assessed by evaluating the proliferation of carboxyfluorescein diacetate succinimidyl ester (CFSE)-labeled conventional T cells (Tconv) cocultured with Tregs from apolipoprotein E-deficient (Apoe-/-) mice or CCR4-deficient mice on an Apoe-/- background (Ccr4-/-Apoe-/-). Data are presented as the results of triplicate wells and are representative of two independent experiments. Data are expressed as the mean ± s.d. (B, C) CD80 and CD86 expression in live splenic dendritic cells (DCs) after 2 days of coculture with Tconv from Apoe-/- mice, or a mixture of Tregs from Apoe-/- or Ccr4-/-Apoe-/- mice and Tconv from Apoe-/- mice in the presence of an anti-CD3 antibody. Data points represent the results of quintuplicate wells. Data are representative of two independent experiments. (B, D) Tconv from Apoe-/- mice and DCs were cocultured with or without Tregs from Apoe-/- or Ccr4-/-Apoe-/- mice in the presence of an anti-CD3 antibody. Interferon (IFN)-γ concentrations in cell supernatants were measured by ELISA. Data points represent the results of sextuplicate wells. (E) Eighteen-week-old Apoe-/- mice fed a high-cholesterol diet for 10 weeks received transfer of Tregs from Apoe-/-Kaede-Tg or Ccr4-/-Apoe-/-Kaede-Tg mice, and the accumulation of Kaede+ Tregs in the peripheral lymphoid tissues and aorta was analyzed by flow cytometry 20 hours later. (F–I) Representative flow cytometric analysis and the proportions of Kaede+ Tregs among CD4+ T cells in the peripheral lymph nodes (LNs) (F), spleen (G), para-aortic LNs (H), and aorta (I) of Apoe-/- mice that received Apoe-/-Kaede+ Tregs or Ccr4-/-Apoe-/-Kaede+ Tregs. n=9–10 per group (F–H). Pooled aortic lymphoid cells from five mice in each group were used for analysis. The results are presented as the mean ±s.d. of three independent experiments (I). Data points represent individual animals (F–H) or individual pooled samples (I). Horizontal bars represent means. Error bars indicate s.d. *p<0.05, **p<0.01; one-way ANOVA followed by Tukey’s multiple-comparisons test: (C, D); two-way ANOVA followed by Tukey’s multiple-comparisons test: (A). p=0.09; one-sample t-test: (I). MFI, mean fluorescence intensity.
-
Figure 5—source data 1
Raw numerical values for Figure 5 plots.
- https://cdn.elifesciences.org/articles/101830/elife-101830-fig5-data1-v1.xlsx
Figure 6 with 2 supplements
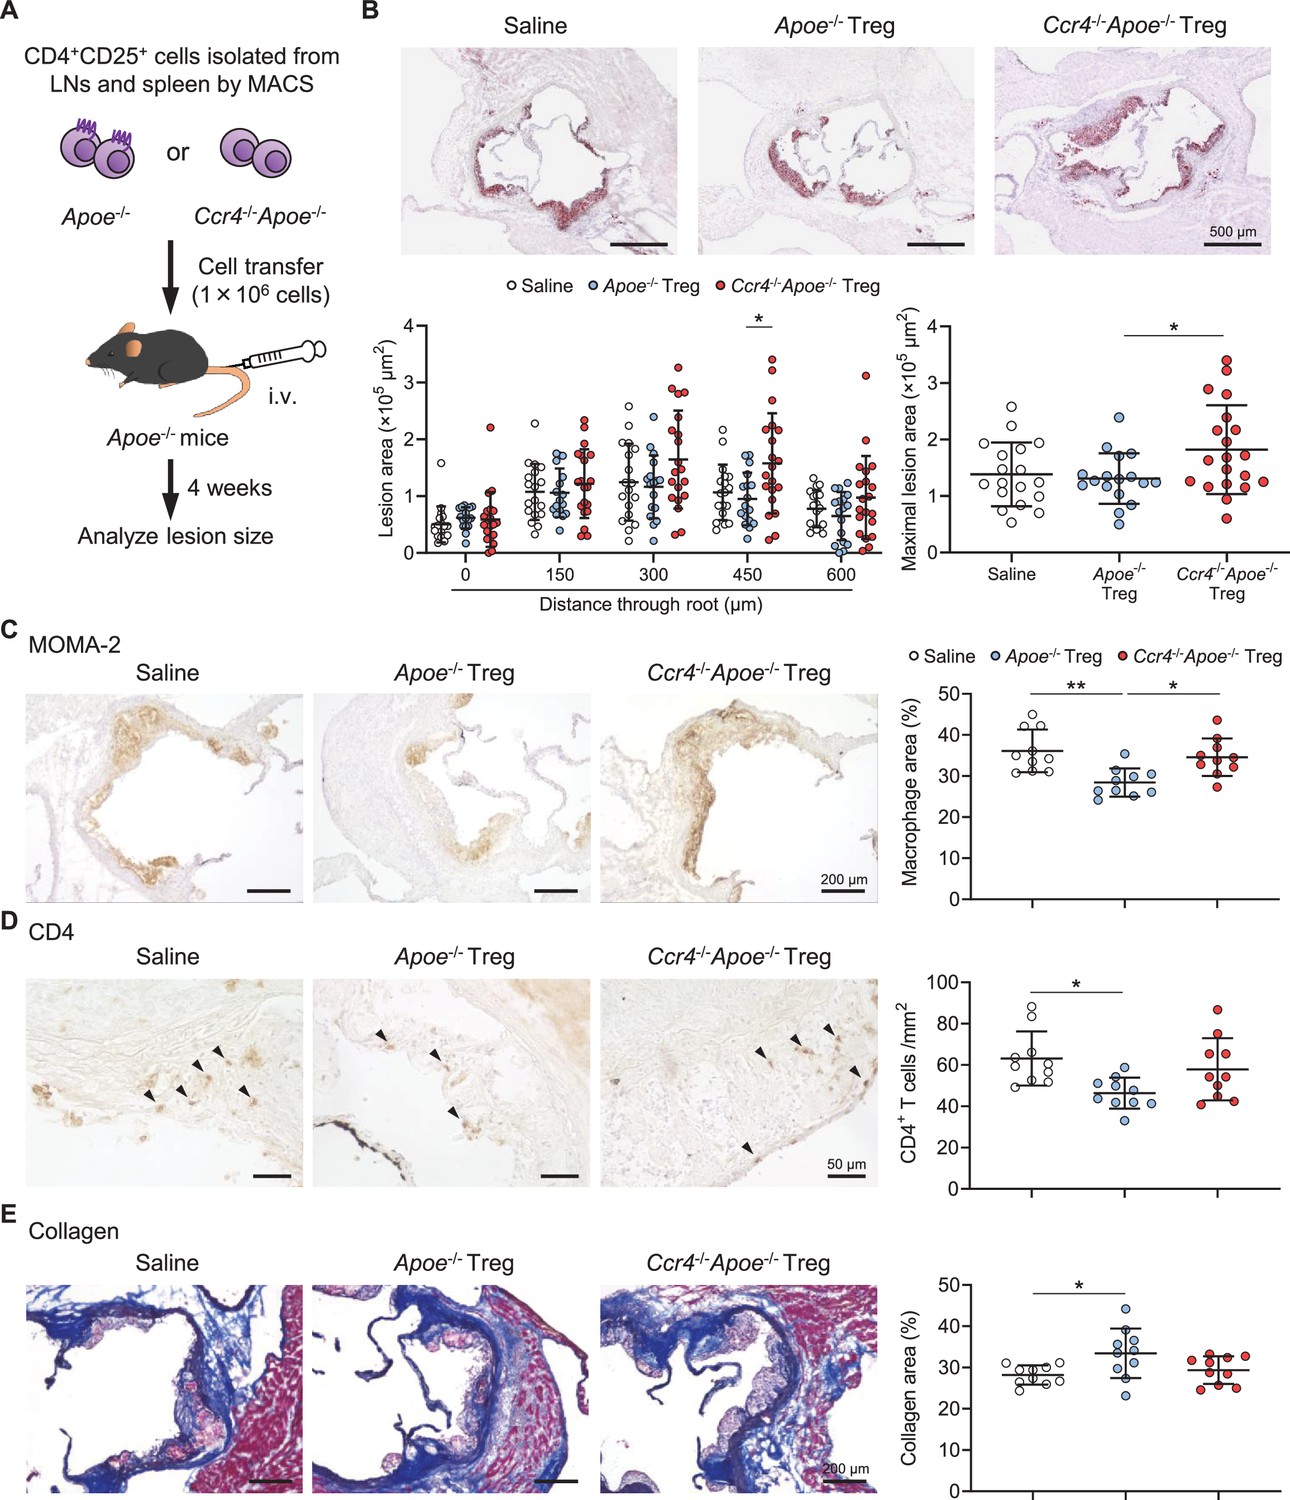
C-C chemokine receptor 4 (CCR4) expression on regulatory T cells (Tregs) is critical for limiting aortic inflammation and the development of early atherosclerosis.
(A) Tregs purified from the peripheral lymph nodes (LNs) and spleen of apolipoprotein E-deficient (Apoe-/-) mice or CCR4-deficient mice on an Apoe-/- background (Ccr4-/-Apoe-/-) were intravenously transferred into 12-week-old Apoe-/- mice fed a standard chow diet, and atherosclerotic lesions were analyzed at 16 weeks of age. As a control without cell transfer, 12-week-old Apoe-/- mice were intravenously injected with saline and atherosclerotic lesions were analyzed at 16 weeks of age. (B) Representative photomicrographs of Oil Red O staining and quantitative analysis of atherosclerotic lesion area at five different levels and maximal lesions in the aortic sinus of Apoe-/- mice injected with saline (n=19), Apoe-/- Tregs (n=17), or Ccr4-/-Apoe-/- Tregs (n=20). (C–E) Representative sections and quantitative analyses of MOMA-2+ macrophages (C), CD4+ T cells (D), and collagen (E) in the aortic sinus of Apoe-/- mice injected with saline, Apoe-/- Tregs, or Ccr4-/-Apoe-/- Tregs. Arrowheads indicate the CD4+ T cells. n=10 per group. Black bars represent 50, 200, or 500 μm as described. Data points represent individual animals. Horizontal bars represent means. Error bars indicate s.d. *p<0.05, **p<0.01; one-way ANOVA followed by Tukey’s multiple-comparisons test.
-
Figure 6—source data 1
Raw numerical values for Figure 6 plots.
- https://cdn.elifesciences.org/articles/101830/elife-101830-fig6-data1-v1.xlsx
Figure 6—figure supplement 1

No significant difference in the mean atherosclerotic lesion area in the aortic sinus was observed among Apoe-/- mice injected with saline, Apoe-/- Tregs, or Ccr4-/-Apoe-/- Tregs.
Quantitative analysis of the mean atherosclerotic lesion area in the aortic sinus of Apoe-/- mice injected with saline (n=19), Apoe-/- Tregs (n=17), or Ccr4-/-Apoe-/- Tregs (n=20). Data points represent individual animals. Horizontal bars represent means. Error bars indicate s.d.
-
Figure 6—figure supplement 1—source data 1
Raw numerical values for Figure 6—figure supplement 1 plots.
- https://cdn.elifesciences.org/articles/101830/elife-101830-fig6-figsupp1-data1-v1.xlsx
Figure 6—figure supplement 2
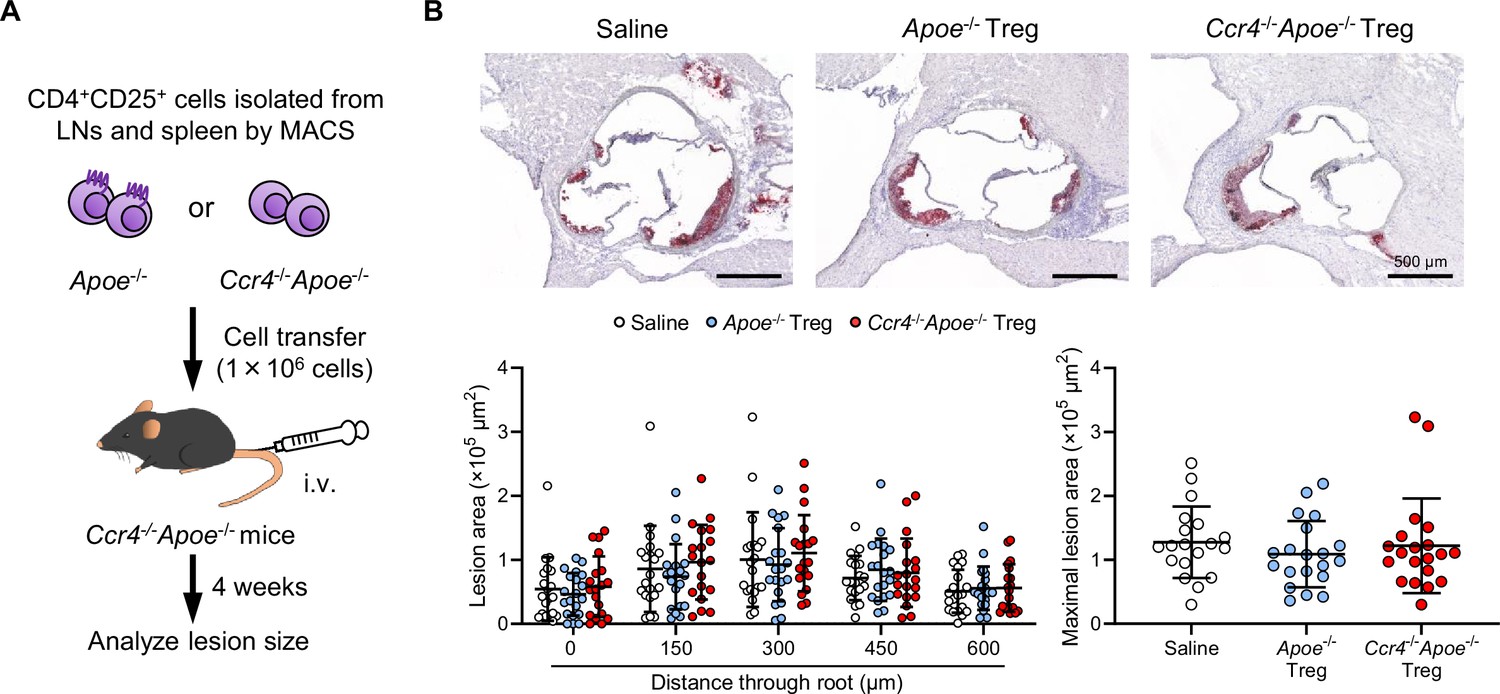
Transfer of CCR4-intact Tregs does not affect the development of early atherosclerotic lesions in Ccr4-/-Apoe-/- mice.
(A) Tregs purified from the peripheral lymph nodes (LNs) and spleen of Apoe-/- or Ccr4-/-Apoe-/- mice were intravenously transferred into 12-week-old Ccr4-/-Apoe-/- mice fed a standard chow diet, and atherosclerotic lesions were analyzed at 16 weeks of age. As a control without cell transfer, 12-week-old Ccr4-/-Apoe-/- mice were intravenously injected with saline and atherosclerotic lesions were analyzed at 16 weeks of age. (B) Representative photomicrographs of Oil Red O staining and quantitative analysis of atherosclerotic lesion area at five different levels and maximal lesions in the aortic sinus of Ccr4-/-Apoe-/- mice injected with saline (n=19), Apoe-/- Tregs (n=20), or Ccr4-/-Apoe-/- Tregs (n=20). Black bars represent 500 μm as described. Data points represent individual animals. Horizontal bars represent means. Error bars indicate s.d.
-
Figure 6—figure supplement 2—source data 1
Raw numerical values for Figure 6—figure supplement 2 plots.
- https://cdn.elifesciences.org/articles/101830/elife-101830-fig6-figsupp2-data1-v1.xlsx
Appendix 1—figure 1
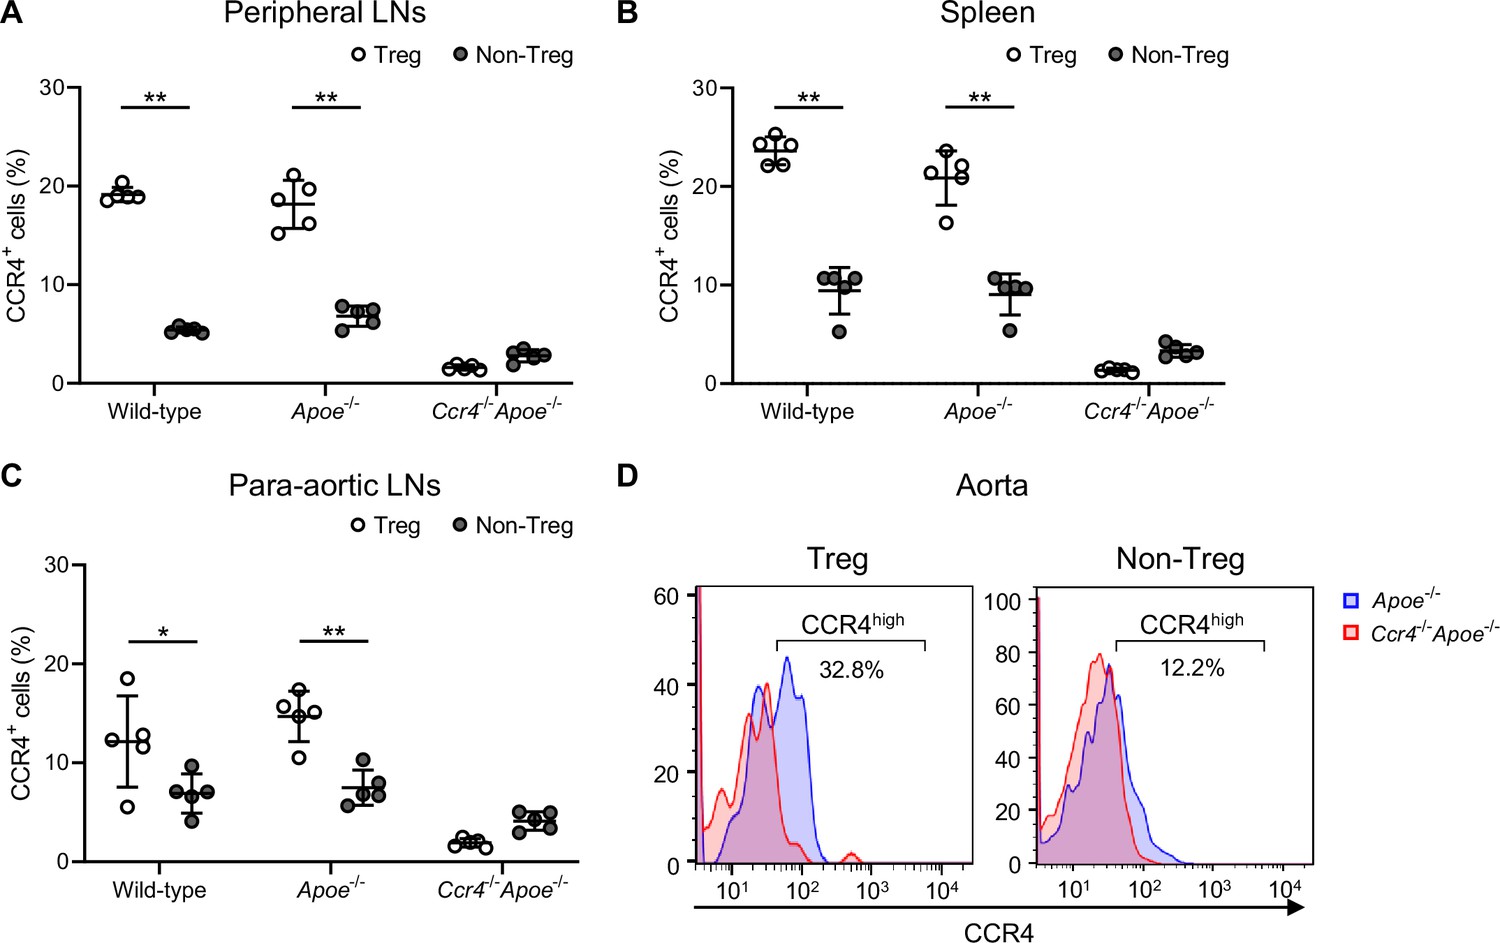
C-C chemokine receptor 4 (CCR4) is predominantly expressed on CD4+Foxp3+ Tregs.
(A–C), The graphs represent the proportions of CCR4+ cells in CD4+Foxp3+ Tregs and CD4+Foxp3- non-Tregs in the peripheral lymph nodes (LNs) (A), spleen (B), and para-aortic LNs (C) of 18-week-old wild-type, Apoe-/-, or Ccr4-/-Apoe-/- mice assessed by flow cytometry. n=5 per group. Data points represent individual animals. Horizontal bars represent means. Error bars indicate s.d. (D) Representative flow cytometric analysis of CCR4 expression in aortic CD4+Foxp3+ Tregs and CD4+Foxp3- non-Tregs from 18-week-old Apoe-/- or Ccr4-/-Apoe-/- mice. Pooled aortic lymphoid cells from 7 to 8 mice in each group were used. Data are representative of two independent experiments. *p<0.05, **p<0.01; two-way ANOVA followed by Tukey’s multiple-comparisons test: (A, B and C).
-
Appendix 1—figure 1—source data 1
Raw numerical values for Appendix 1—figure 1 plots.
- https://cdn.elifesciences.org/articles/101830/elife-101830-app1-fig1-data1-v1.xlsx
Appendix 2—figure 1
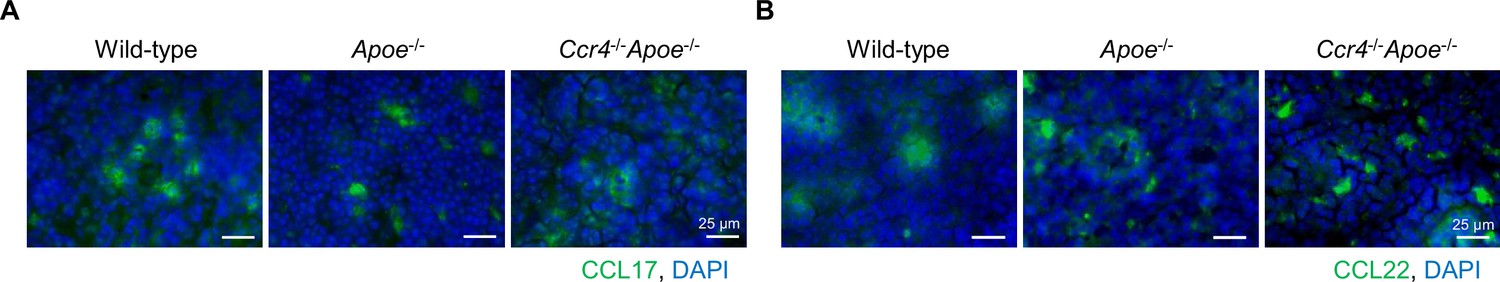
CCL17 and CCL22 are detected in peripheral lymph nodes (LNs).
Immunostaining for CCL17 (green) (A) and CCL22 (green) (B) in the peripheral LNs of 18-week-old wild-type, Apoe-/-, or Ccr4-/-Apoe-/- mice. Nuclei were stained with DAPI (blue). Data are representative of five mice analyzed in each group. White bars represent 25 μm as described.
Appendix 3—figure 1
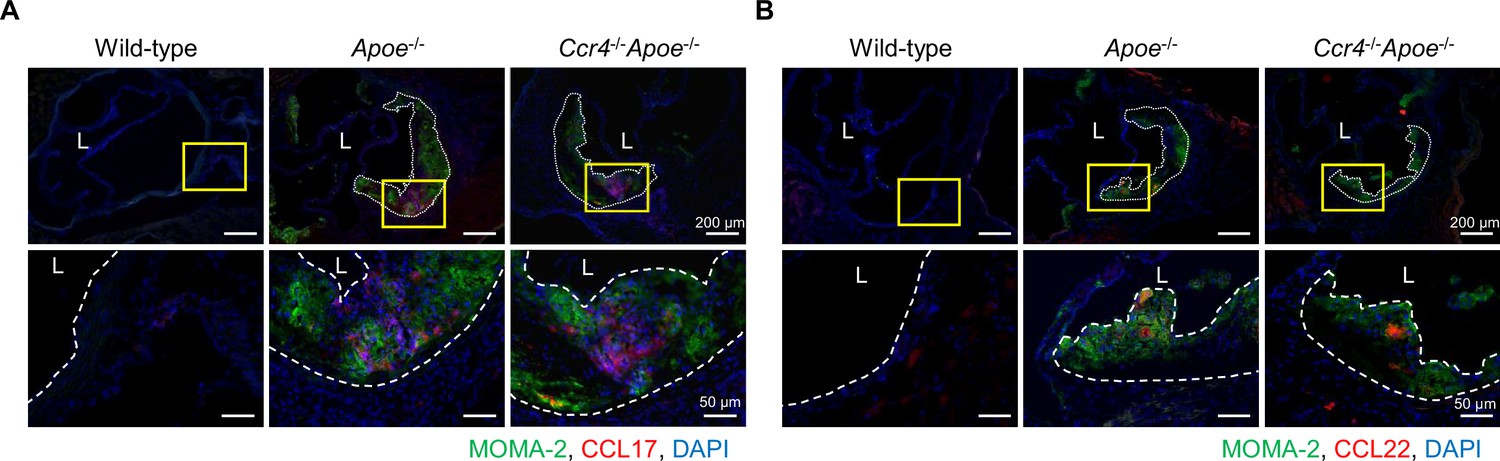
CCL17 and CCL22 are detected in atherosclerotic lesions.
Immunostaining for CCL17 (red) and MOMA-2 (green) (A) and for CCL22 (red) and MOMA-2 (green) (B) in the aortic sinus of 18-week-old wild-type, Apoe-/-, or Ccr4-/-Apoe-/- mice. Boxed area is expanded to show high-power fields. Nuclei were stained with DAPI (blue). Dashed lines demarcate atherosclerotic lesions or indicate the inner lining of arteries; L, lumen. Data are representative of five mice analyzed in each group. White bars represent 50 or 200 μm as described.
Appendix 4—figure 1
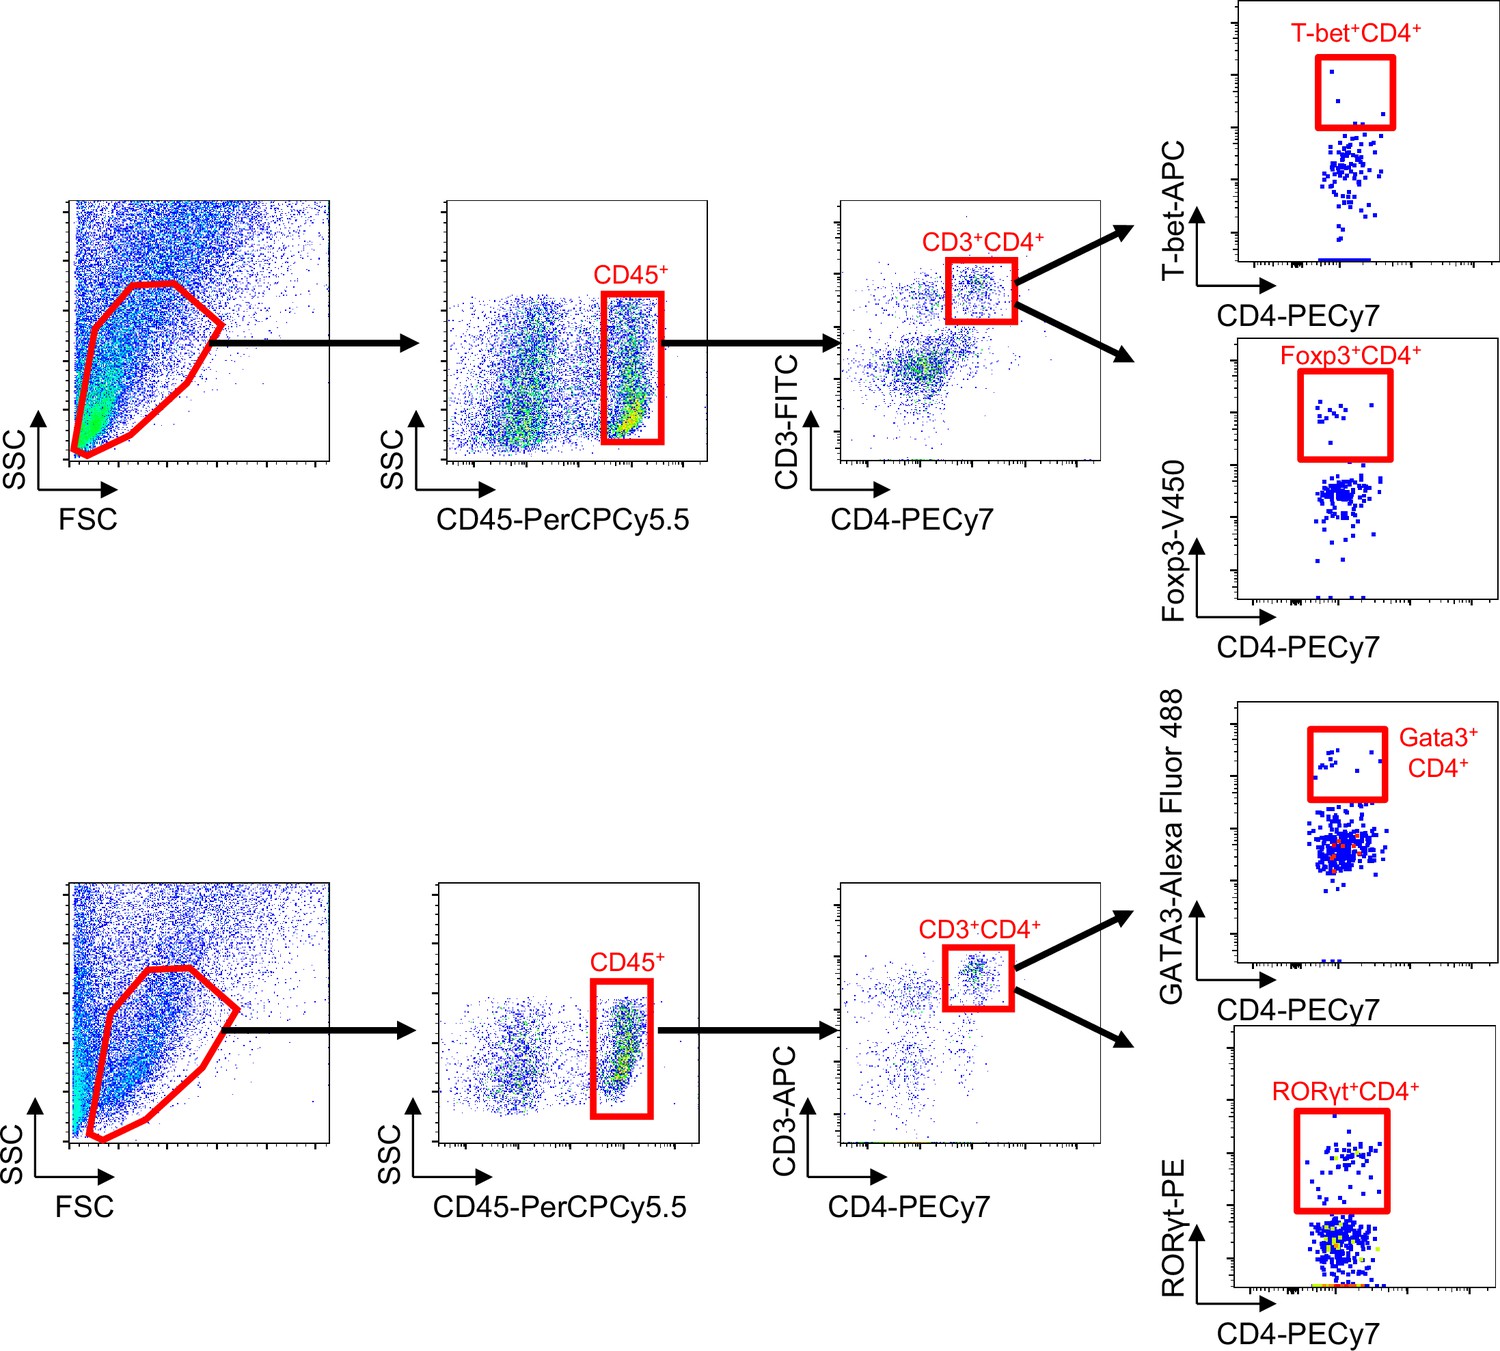
Gating strategy of flow cytometric analysis of T-bet, GATA3, RORγt, and Foxp3 expression in aortic CD3+CD4+CD45+ T cells.
Appendix 5—figure 1
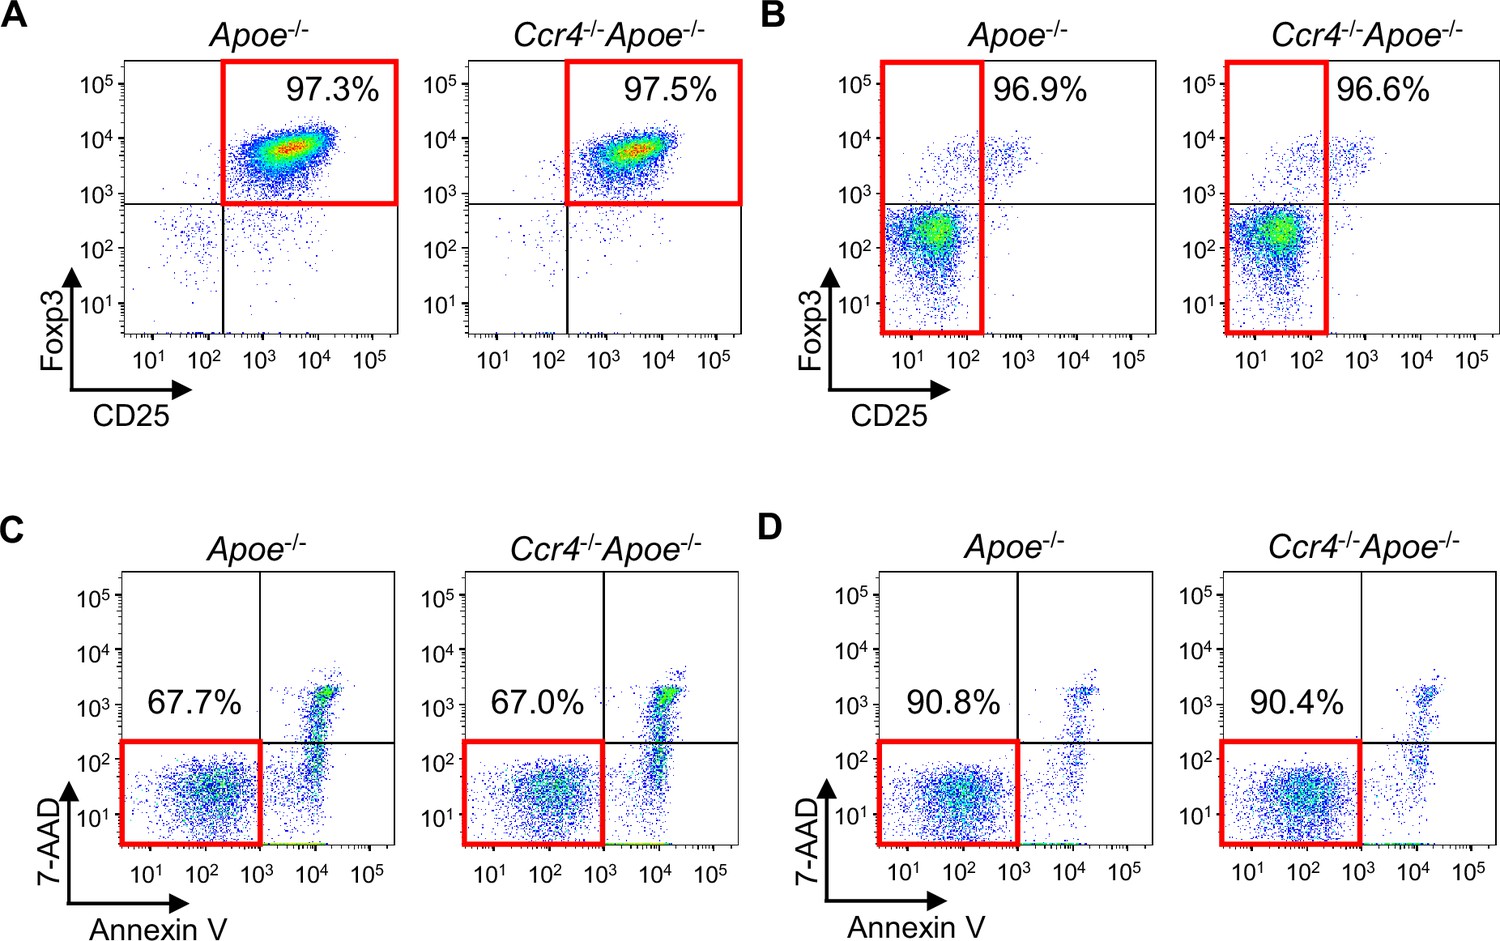
The purity and viability of CD4+CD25+ Tregs and CD4+CD25 T cells isolated from Apoe-/- or Ccr4-/-Apoe-/- mice.
Representative flow cytometric analysis of CD25 and Foxp3 expression in CD4+CD25+ Tregs (A) and CD4+CD25- T cells (B) purified from peripheral lymphoid tissues of Apoe-/- or Ccr4-/-Apoe-/- mice. Representative flow cytometric analysis of the viability of CD4+CD25+ Tregs (C) and CD4+CD25- T cells (D) purified from peripheral lymphoid tissues of Apoe-/- or Ccr4-/-Apoe-/- mice. T cells which neither expressed 7-AAD nor Annexin V were considered viable.
Appendix 6—figure 1
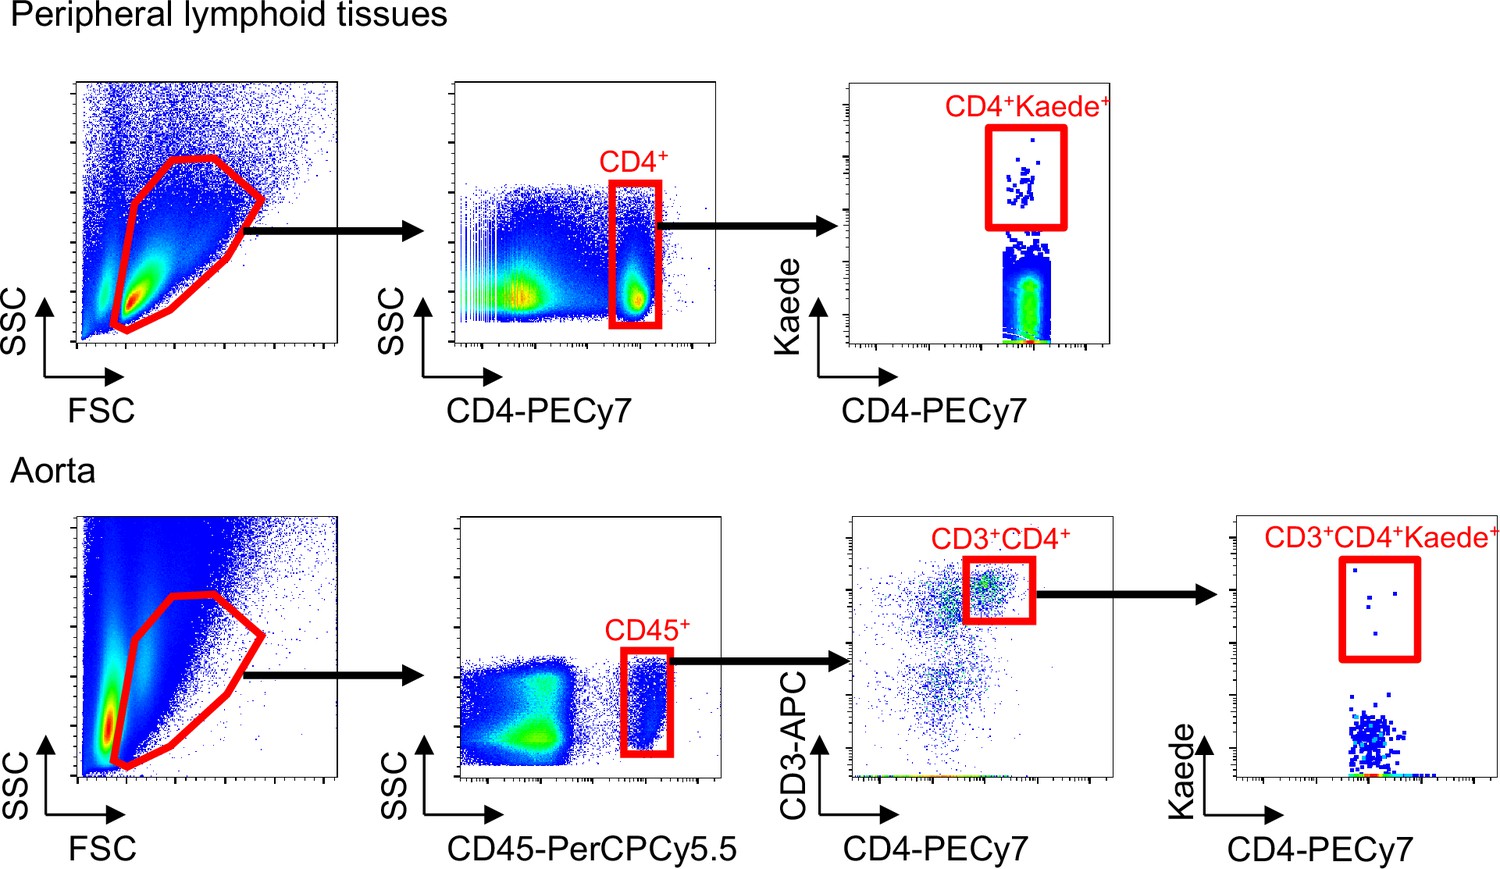
Gating strategy of flow cytometric analysis of Kaede-expressing Tregs in peripheral lymphoid tissues and aortas.
Author response image 1
Tables
Table 1
Body weight and plasma lipid profile in 18-week-old mice.
| Apoe-/- | Ccr4-/-Apoe-/- | |
|---|---|---|
| Body weight (g) | 31.76±1.94 (n=27) | 31.69±2.24 (n=27) |
| Total cholesterol (mg/dL) | 526.5±146.3 (n=10) | 520.4±150.6 (n=10) |
| High-density lipoprotein-cholesterol (mg/dL) | 24.90±6.49 (n=10) | 19.80±5.87 (n=10) |
| Triglycerides (mg/dL) | 89.70±21.07 (n=10) | 86.40±39.58 (n=10) |
Table 2
Body weight and plasma lipid profile in Apoe-/- mice treated with saline, Apoe-/- Tregs, or Ccr4-/-Apoe-/- Tregs.
| Saline | Apoe-/-Treg | Ccr4-/-Apoe-/-Treg | |
| Body weight (g) | 27.82±2.82 (n=18) | 27.80±2.42 (n=20) | 27.72±2.59 (n=19) |
| Total cholesterol (mg/dL) | 505.3±114.0 (n=10) | 605.5±105.1 (n=10) | 607.3±76.35 (n=10) |
| High-density lipoprotein-cholesterol (mg/dL) | 15.00±2.87 (n=10) | 15.20±3.26 (n=10) | 13.80±4.83 (n=10) |
| Triglycerides (mg/dL) | 87.40±36.69 (n=10) | 92.70±27.15 (n=10) | 96.60±33.94 (n=10) |
Table 3
Body weight and plasma lipid profile in Ccr4-/-Apoe-/- mice treated with saline, Apoe-/- Tregs, or Ccr4-/-Apoe-/- Tregs.
| Saline | Apoe-/-Treg | Ccr4-/-Apoe-/-Treg | ||
| Body weight (g) | 32.44±2.75 (n=12) | 30.69±3.55 (n=12) | 32.16±2.12 (n=12) | |
| Total cholesterol (mg/dL) | 589.1±144.3 (n=10) | 616.1±105.6 (n=10) | 526.4±115.9 (n=10) | |
| High-density lipoprotein-cholesterol (mg/dL) | 16.30±3.65 (n=10) | 13.80±3.19 (n=10) | 12.10±2.96* (n=10) | |
| Triglycerides (mg/dL) | 83.0±57.56 (n=10) | 91.60±55.52 (n=10) | 72.70±13.99 (n=10) |
Table 4
Antibodies for immunohistochemistry.
| Antibodies | Clone | Fluorescent dye | Source |
|---|---|---|---|
| Anti-CCL17 Ab | - | - | abcam |
| ab182793 | |||
| Anti-MOMA-2 Ab | - | - | BMA Biomedical |
| T-2007 | |||
| Anti-CCL22 Ab | - | - | R&D |
| AF439 | |||
| Anti-CD4 Ab | RM4-5 | - | BD Biosciences |
| 550280 | |||
| Anti-rabbit IgG | - | Alexa Fluor 568 | Thermo Fisher Scientific |
| A11011 | |||
| Anti-goat IgG | - | Alexa Fluor 568 | Thermo Fisher Scientific |
| A11057 | |||
| Anti-rat IgG | - | Alexa Fluor 488 | Thermo Fisher Scientific |
| A21208 | |||
| Anti-rat IgG | - | Biotin | abcam |
| ab102250 |
Table 5
Antibodies for flow cytometry.
| Antibodies | Clone | Fluorescent dye | Source |
|---|---|---|---|
| Anti-CD16/CD32 Ab | 2.4G2 | - | BD Biosciences |
| 553142 | |||
| Anti-CD45 Ab | 30-F11 | PerCPCy5.5 | BD Biosciences |
| 550994 | |||
| Anti-CD3 Ab | 145-2C11 | BD Biosciences | |
| APC | 553066 | ||
| FITC | 553062 | ||
| PECy7 | 552774 | ||
| Anti-CD4 Ab | RM4-5 | PECy7 | BD Biosciences |
| 552775 | |||
| Anti-CCR4 Ab | 2G12 | PE | BioLegend |
| 131204 | |||
| Anti-Foxp3 Ab | FJK-16s | V450 | eBioscience |
| 48-5773-82 | |||
| Anti-CD44 Ab | IM7 | PE | BD Biosciences |
| 553134 | |||
| Anti-CD62L Ab | MEL-14 | FITC | BD Biosciences |
| 553150 | |||
| Anti-Ki67 Ab | SolA15 | FITC | eBioscience |
| 11-5698-82 | |||
| Anti-CD152 Ab | UC10-4B9 | APC | eBioscience |
| 17-1522-82 | |||
| Anti-CD103 Ab | M290 | FITC | BD Biosciences |
| 557494 | |||
| Anti-CD25 Ab | PC61 | PE | BD Biosciences |
| 553866 | |||
| Anti-CD28 Ab | 37.51 | - | BD Biosciences |
| 553294 | |||
| Anti-IFNγ Ab | XMG1.2 | PE | BD Biosciences |
| 554412 | |||
| Anti-IL-4 Ab | 11B11 | PE | BD Biosciences |
| 554435 | |||
| Anti-IL-10 Ab | JES5-16E3 | APC | BD Biosciences |
| 554468 | |||
| Anti-IL-17 Ab | TC11-18H10 | APC | BD Biosciences |
| 560184 | |||
| Anti-T-bet Ab | 4B10 | APC | BioLegend |
| 644814 | |||
| Anti-Gata3 Ab | L50-823 | Alexa Fluor 488 | BD Biosciences |
| 560163 | |||
| Anti-RORγt Ab | Q31-378 | PE | BD Biosciences |
| 562607 | |||
| Anti-CD8 Ab | 53-6.7 | PerCPCy5.5 | BD Biosciences |
| 553033 | |||
| Anti-B220 Ab | RA3-6B2 | PE | BD Biosciences |
| 553090 | |||
| Anti-CD11b Ab | M1/70 | V450 | BD Horizon |
| 560455 | |||
| Anti-Ly6G Ab | 1A8 | FITC | BD Biosciences |
| 551460 | |||
| Anti-Ly6C Ab | AL-21 | AOC | BD Biosciences |
| 560595 | |||
| Anti-NK1.1 Ab | PK136 | APC | BD Biosciences |
| 550627 | |||
| Anti-CD11c Ab | HL3 | V450 | BD Horizon |
| 560521 | |||
| Anti-I-Ab Ab | AF6-120.1 | FITC | BD Biosciences |
| 553551 | |||
| Anti-CD80 Ab | 16-10A1 | PE | BD Biosciences |
| 553769 | |||
| Anti-CD86 Ab | GL1 | APC | BD Biosciences |
| 558703 | |||
| Anti-CD279 Ab | 29F.1A12 | FITC | BioLegend |
| 135213 |
Table 6
Primer sequences for quantitative reverse transcription PCR.
| Gene | Forward primer sequence (5'→3') | Reverse primer sequence (5'→3') |
|---|---|---|
| Gapdh | TGTGTCCGTCGTGGATCTGA | TTGCTGTTGAAGTCGCAGGAG |
| Il1b | TCCAGGATGAGGACATGAGCAC | GAACGTCACACACCAGCAGGTTA |
| Il6 | CCACTTCACAAGTCGGAGGCTTA | GCAAGTGCATCATCGTTGTTCATAC |
| Il10 | GACCAGCTGGACAACATACTGCTAA | GATAAGGCTTGGCAACCCAAGTAA |
| Tnf | CCACCACGCTCTTCTGTCTAC | AGGGTCTGGGCCATAGAACT |
| Ifng | CGGCACAGTCATTGAAAGCCTA | GTTGCTGATGGCCTGATTGTC |
| Tbx21 | CTGCCTACCAGAACGCAGA | AAACGGCTGGGAACAGGA |
| Gata3 | GGATGTAAGTCGAGGCCCAAG | ATTGCAAAGGTAGTGCCCGGTA |
| Rorc | CACAGAGACACCACCGGACAT | CGTGCAGGAGTAGGCCACATT |
| Foxp3 | CTCATGATAGTGCCTGTGTCCTCAA | AGGGCCAGCATAGGTGCAAG |
| Ctla4 | CCTCTGCAAGGTGGAACTCATGTA | AGCTAACTGCGACAAGGATCCAA |
| Cd103 | ATGGCATTCAGTGGTCTGTGCTA | CACCAAGGATCGGCAGTTCA |
| Tnfrsf18 | GTTCAGAACGGAAGTGGCAACA | GCTTGCAGATCTTGCACTGAGG |
| Tgfb | GTGTGGAGCAACATGTGGAACTCTA | TTGGTTCAGCCACTGCCGTA |
| Cd44 | CTGGCACTGGCTCTGATTCTTG | TCCCATTGCCACCGTTGA |
| Cd69 | TGGCCCAACGCTCTTGTTC | GCCCAATCCAATGTTCCAGTTC |
| Ccr4 | TCTACAGCGGCATCTTCTTCAT | CAGTACGTGTGGTTGTGCTCTG |
| Ccr5 | CCTAGCCAGAGGAGGTGAGACATC | AGCTATAGGTCGGAACTGACCCTTG |
| Ccr6 | GGCAGTTACTCATGCCACCAA | GGAGCAGCATCCCACAGTTAAAG |
| Ccr7 | GGTGGTGGCTCTCCTTGTCATT | ACACCGACTCGTACAGGGTGTAGTC |
| Ccr8 | CAGACCCACAACCTGCTGGA | GACAGCGTGGACAATAGCCAGA |
| Ccr1 | GGTTGGGACCTTGAACCTTG | GGGTAGGCTTCTGTGAAATCTG |
| Cxcr3 | ATCACCTGGTGGTGCTAGTGGA | AAAGGCATAGAGCAGCGGATTG |
| Cx3cr1 | AAGCACTTGCCTCTGGTGGA | AGGCCTCAGCAGAATCGTCATA |
Additional files
-
MDAR checklist
- https://cdn.elifesciences.org/articles/101830/elife-101830-mdarchecklist1-v1.docx
-
Appendix 1—figure 1—source data 1
Raw numerical values for Appendix 1—figure 1 plots.
- https://cdn.elifesciences.org/articles/101830/elife-101830-app1-fig1-data1-v1.xlsx
Download links
A two-part list of links to download the article, or parts of the article, in various formats.
Downloads (link to download the article as PDF)
Open citations (links to open the citations from this article in various online reference manager services)
Cite this article (links to download the citations from this article in formats compatible with various reference manager tools)
C-C chemokine receptor 4 deficiency exacerbates early atherosclerosis in mice
eLife 13:RP101830.
https://doi.org/10.7554/eLife.101830.4


