Dual role of FOXG1 in regulating gliogenesis in the developing neocortex via the FGF signalling pathway
- Department of Biological Sciences, Tata Institute of Fundamental Research, India
- Institute of Science and Technology Austria, Austria
Figures
Figure 1 with 3 supplements
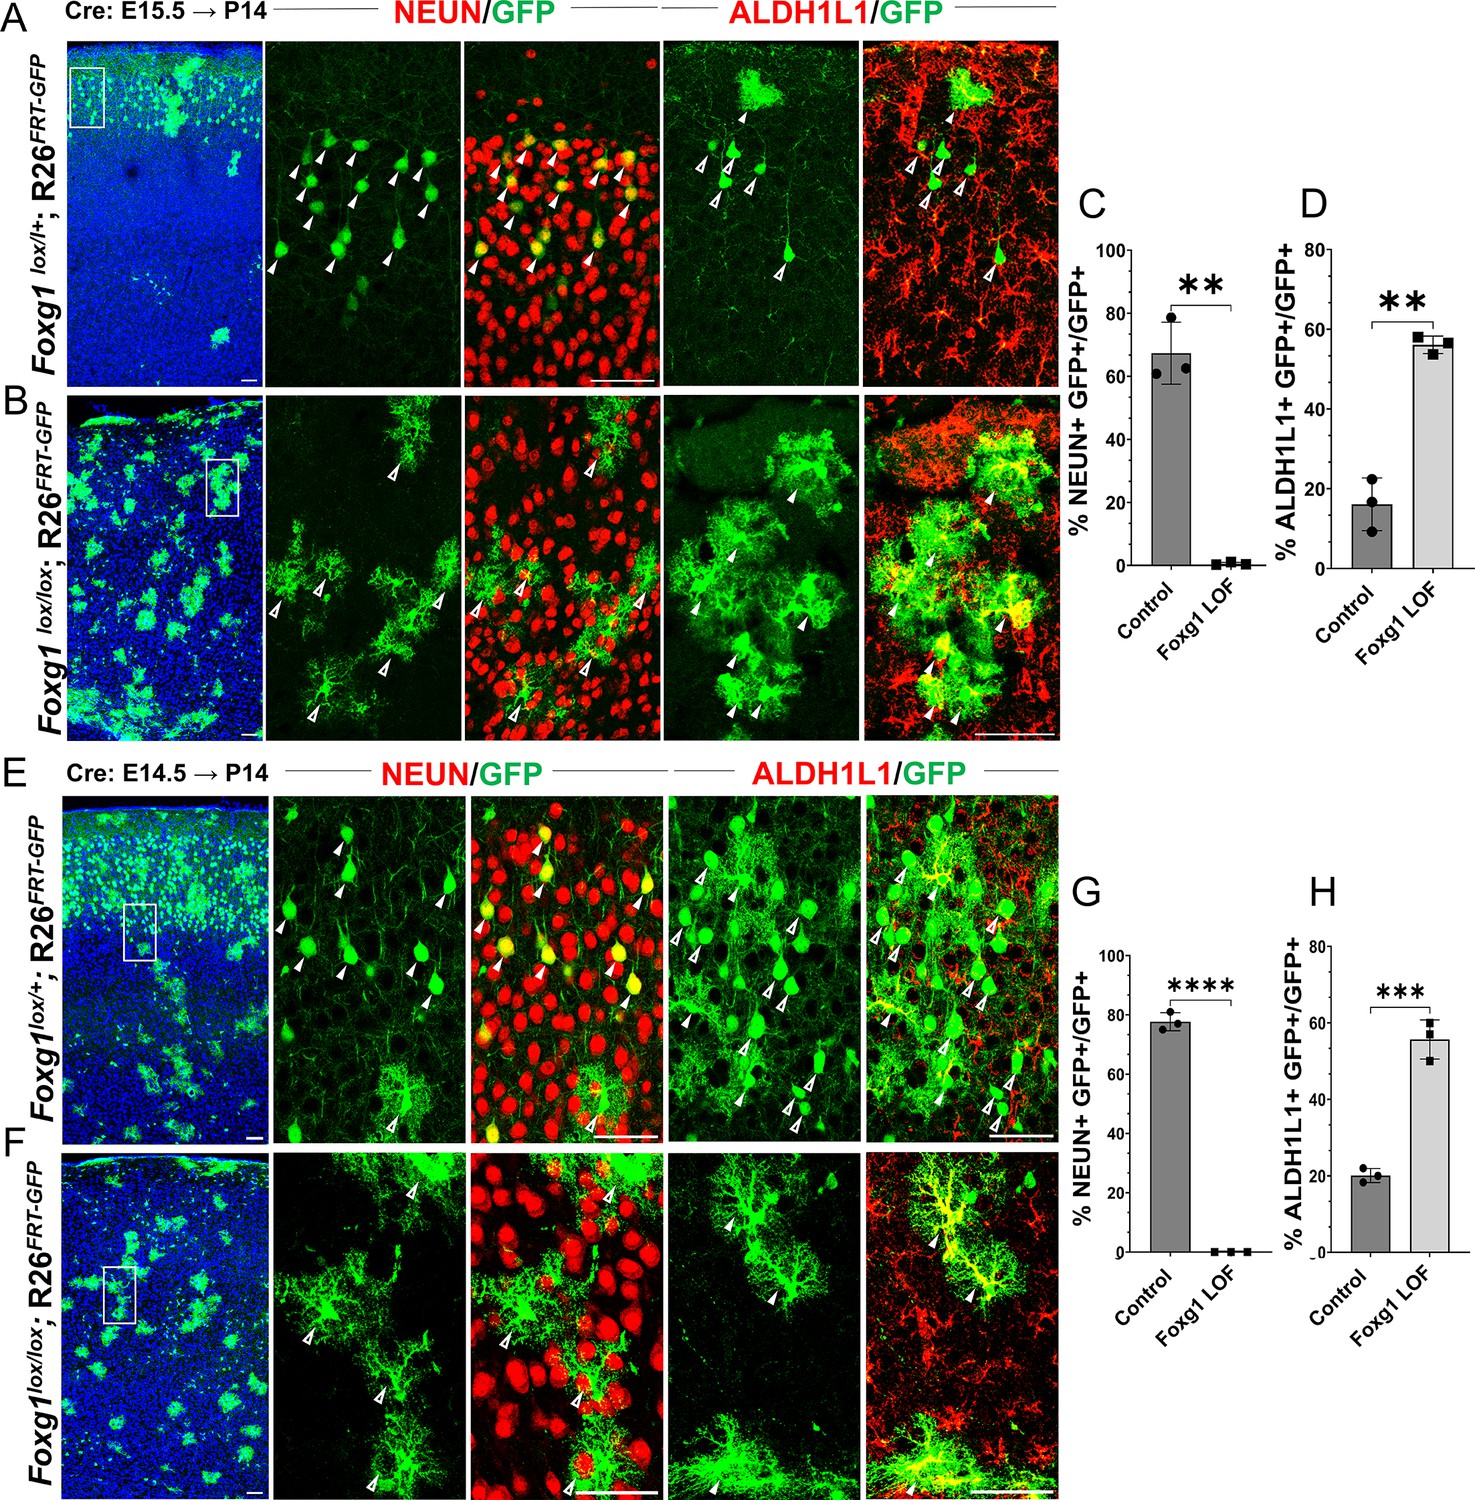
Loss of Foxg1 causes premature gliogenesis.
(A–D) Cre electroporation at E15.5 in control (A, Foxg1lox/+; Rosa26FRT-GFP) and Foxg1 loss-of-function (LOF) (B, Foxg1lox/lox; Rosa26FRT-GFP) embryos, followed by analysis at P14. (C, D) 67.3% of GFP+ cells colocalised with NeuN in control brains and 1% in Foxg1 LOF brains. 16% of GFP+ cells colocalised with ALDH1L1 in control brains and 56% in Foxg1 LOF brains. n = 2151 (Control), 2761 (Foxg1 LOF) cells from N = 3 brains (biologically independent replicates). (E–H) Cre electroporation at E14.5 in control (E, Foxg1lox/+; Rosa26FRT-GFP) and Foxg1 LOF (F, Foxg1lox/lox; Rosa26FRT-GFP) embryos, followed by analysis at P14. (G, H) 77.7% of GFP+ cells colocalised with NeuN in control brains and 0% in Foxg1 LOF brains. 20.1% of GFP+ cells colocalised with ALDH1L1 in control brains and 55.7% in Foxg1 LOF brains. n = 3,160 (Control), 2978 (Foxg1 LOF) cells from N = 3 brains (biologically independent replicates). In each row (A, B, E, F), the boxes in the leftmost low magnification panels indicate approximate regions shown in either the NEUN or ALDH1L1 high-magnification panels. Filled arrowheads depict colocalisation, and open arrowheads depict non-colocalisation of marker and electroporated cells. Statistical test: two-tailed unpaired t-test. *p<0.05, **p<0.01, ***p<0.001, ****p<0.0001. All scale bars are 50 μm.
Figure 1—figure supplement 1
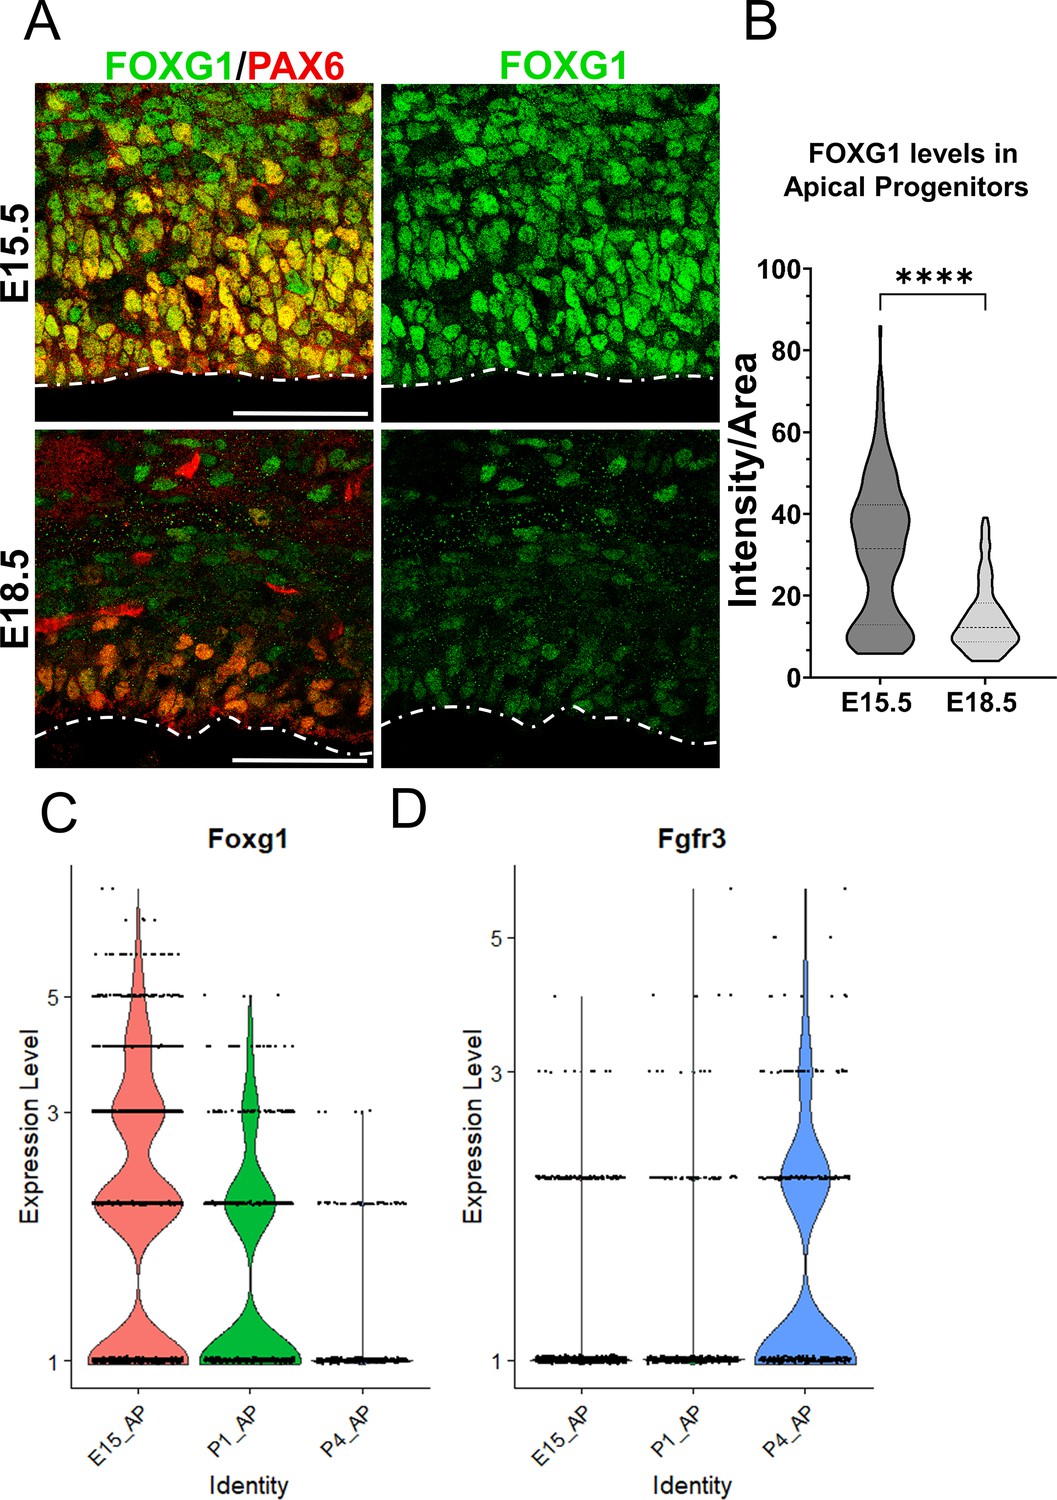
Complementary temporal regulation of Foxg1 and Fgfr3 in progenitors during the gliogenic period.
(A) FOXG1 immunostaining at E15.5 and E18.5 in control brains together with apical progenitor marker PAX6. (B) Nuclear intensity quantification of FOXG1 in apical progenitors reveals a significant decrease in levels by E18.5, suggesting an endogenous mechanism for the transition of neurogenesis to gliogenesis in progenitors. n = 350 cells from N = 3 (biologically independent replicates). Statistical test: Mann–Whitney test. Scale bar: 50 μm. (C, D) Violin plots depicting normalised gene expression levels from scRNA-seq data (Di Bella et al., 2021) for Foxg1 (C) and Fgfr3 (D) reveal complementary temporal dynamics for these genes in progenitors at E15.5, P1, and P4.
Figure 1—figure supplement 2
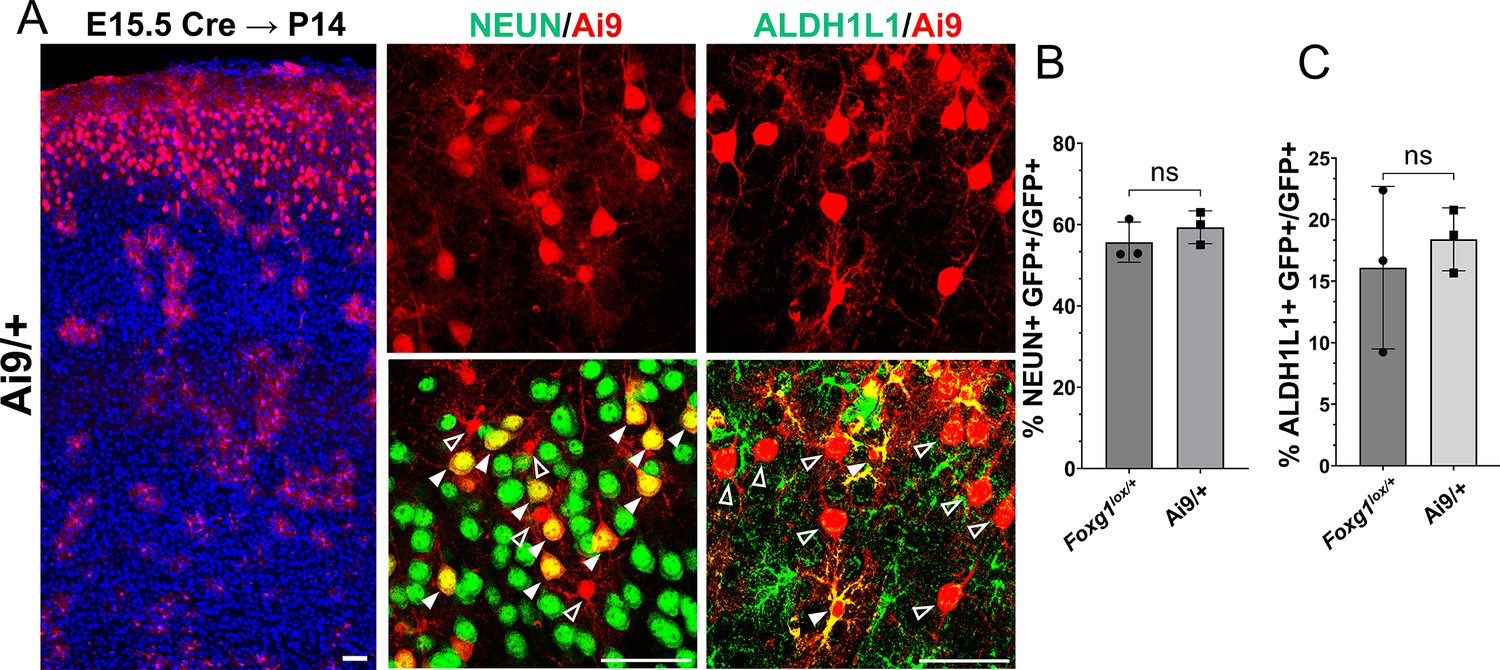
Foxg1 haploinsufficiency at E15.5 does not lead to premature gliogenesis.
This experiment aimed to examine whether there is a difference in baseline neurogenesis in Foxg1+/+ versus Foxg1lox/+ brains since the latter are used as controls in Figures 1 and 6. (A) Cre electroporation at E15.5 in control embryos carrying an Ai9 reporter. Brains were harvested at P14. The leftmost panel in (A) is a low-magnification image, as the scale bar indicates. (B) Quantification of Ai9+ cells reveals similar proportions of these cells colocalise with NeuN in +/+ controls (72%) compared to Foxg1lox/+; GFP FRT brains (67%). (C) Quantification of glial marker ALDH1L1 reveals similar proportions of Ai9+ cells colocalise with ALDH1L1 in +/+ brains (18%) compared to Foxg1lox/+; GFP FRT brains (16%). No significant difference is observed between the two conditions. n = 2790 cells from N = 3 (biologically independent replicates) were examined over three independent experiments. Statistical test: unpaired t-test.
Figure 1—figure supplement 3
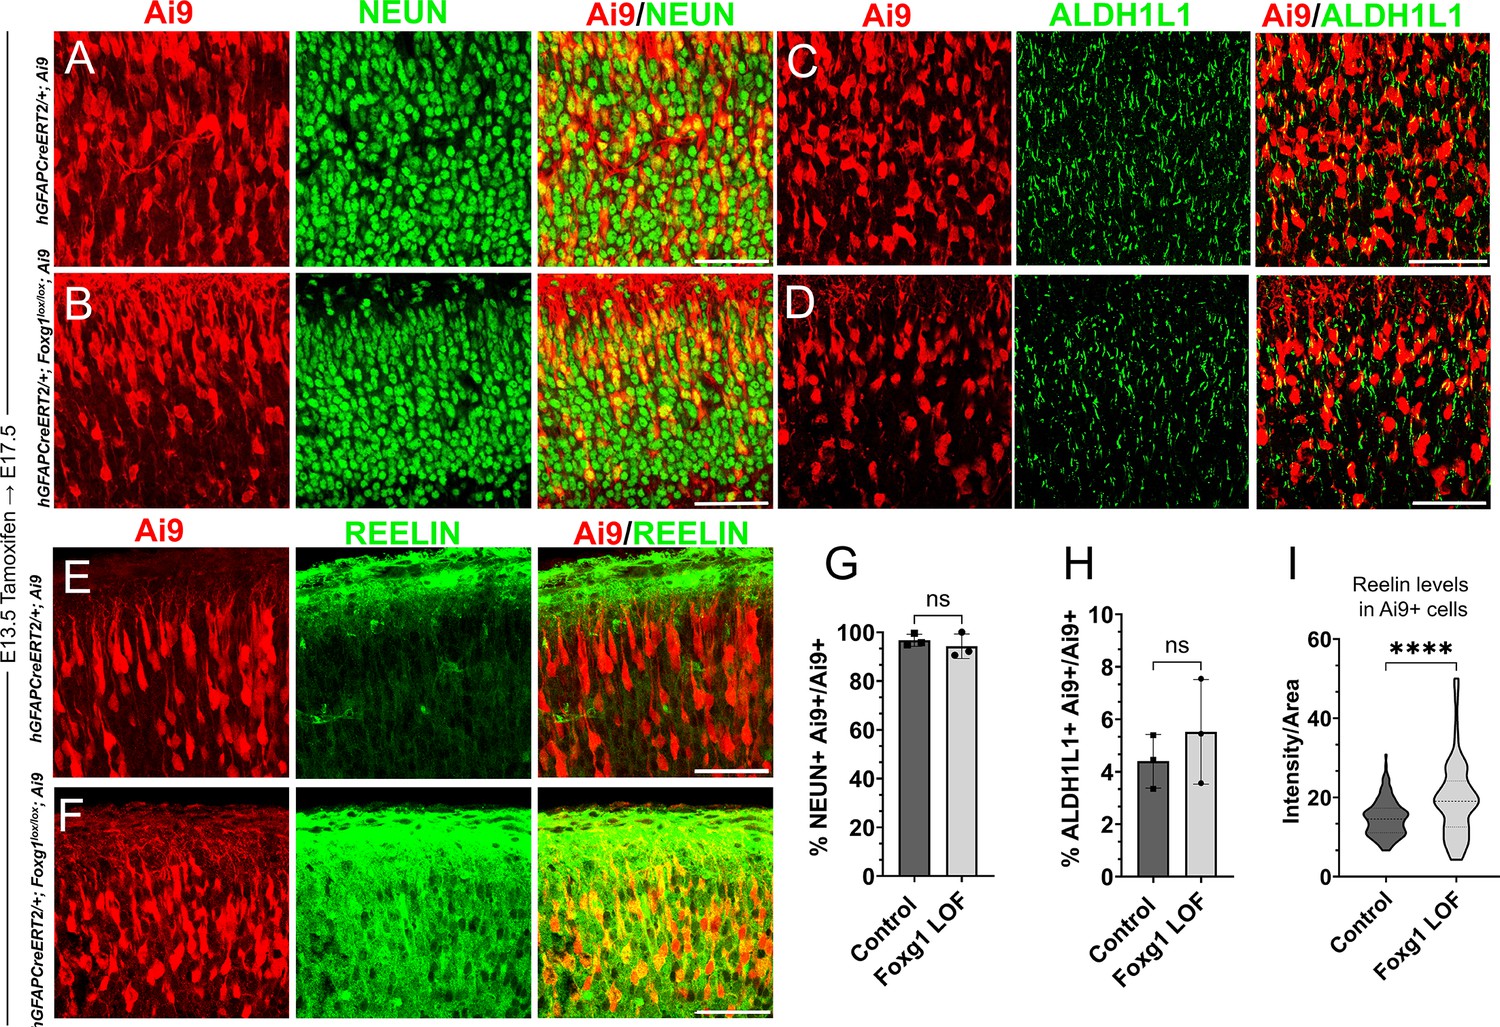
Loss of Foxg1 at E13.5 does not lead to premature gliogenesis but results in increased REELIN.
(A–F) hGFAP-CreERT2/+; Ai9 (Control) and hGFAP-CreERT2/+; Foxg1lox/lox; Ai9 (Foxg1 loss-of-function [LOF]) brains after tamoxifen administration at E13.5, followed by analysis at E17.5. (A, B, G) 96% of Ai9+ cells colocalised with NEUN in control brains and 95% in Foxg1 LOF brains. (C, D, H) 4% of Ai9+ cells colocalised with ALDH1L1 in control brains and 5% in Foxg1 LOF brains. (E, F, I) The average REELIN intensity per Ai9+ cell increased from 17% in control brains to 22% in Foxg1 LOF brains. n = 2,508 (Control), 2798 (Foxg1 LOF) cells from N = 3 brains (biologically independent replicates).
Figure 2 with 1 supplement
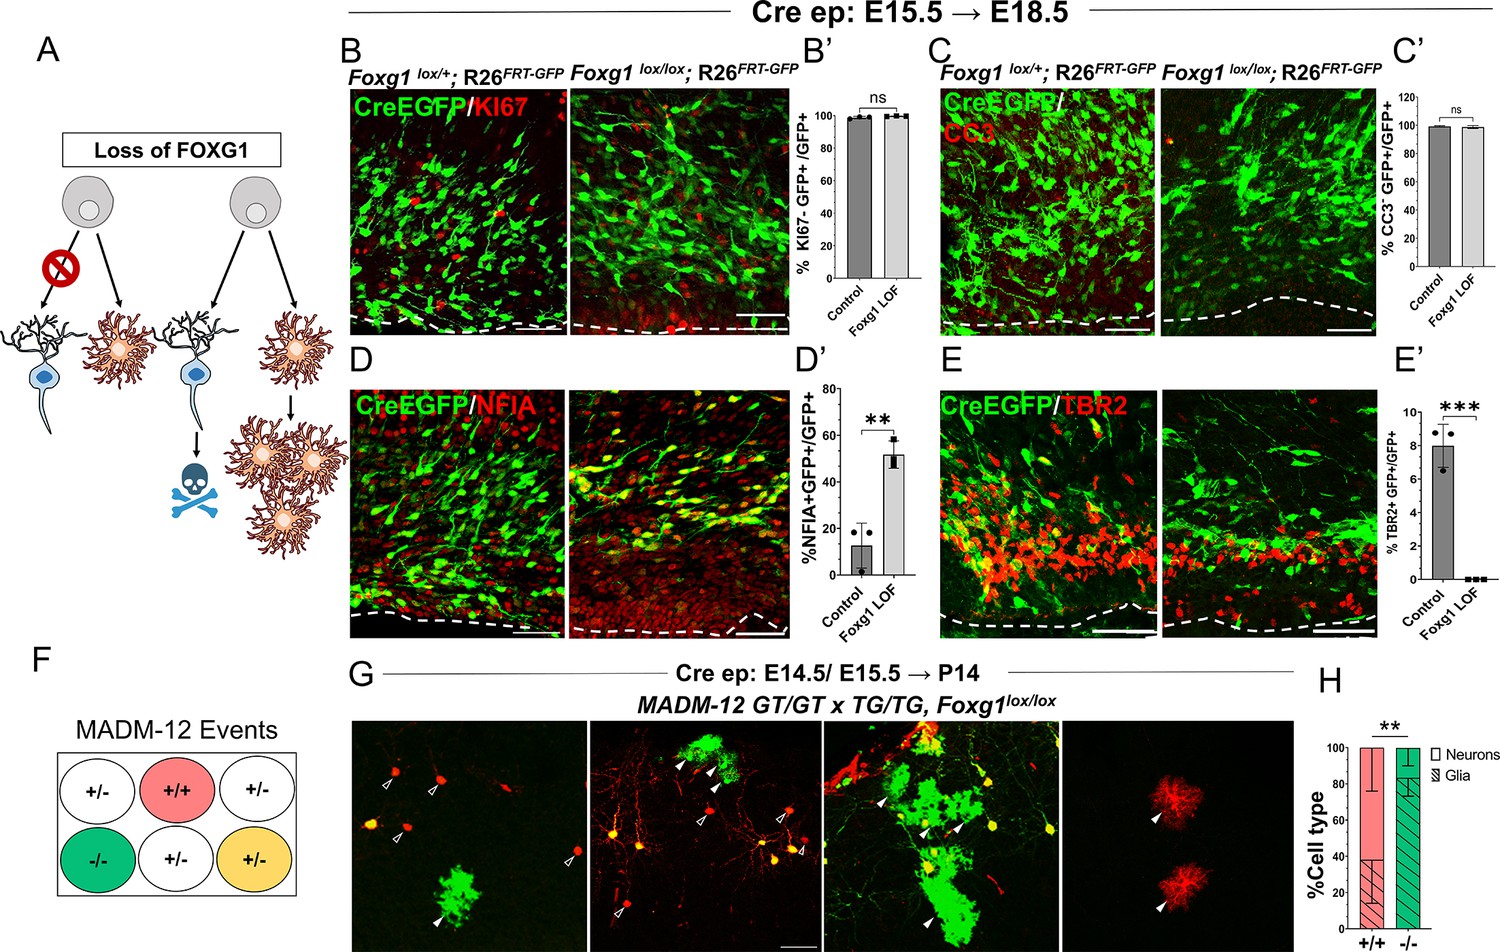
Foxg1 loss-of-function (LOF) leads to premature glial fate acquisition in progenitors but no proliferation defects.
(A) Schematic depicting the two alternative mechanisms that could result in enhanced gliogenesis upon loss of Foxg1: a change in cell type produced by the progenitor, i.e., ‘fate switch’ or increase in proliferation of astrocytes accompanied by neuronal cell death. (B, B', C, C’) Images of the ventricular and sub-ventricular zone (the dashed line indicates the ventricle boundary). Cre electroporation at E15.5 in control (Foxg1lox/+; Rosa26FRT-GFP) and Foxg1 LOF (Foxg1lox/lox; Rosa26FRT-GFP) embryos, followed by analysis at E18.5. Proliferation marker KI67 (B, B’) colocalises with similar numbers of GFP+ cells in control and Foxg1 LOF brains. Cell death marker Cleaved Caspase 3 (C, C’) does not reveal differences in colocalisation with GFP+ control and Foxg1 LOF cells. In contrast, glial progenitor markers NFIA (D, D’) display increased colocalisation with GFP+ cells in Foxg1 LOF (51.7%) compared with controls (12.5%). Neurogenic intermediate progenitor marker TBR2 (E, E’) displays decreased colocalisation with GFP+ cells in Foxg1 LOF brains (0%) compared with controls (8%). n = 3590 (control), 2100 (mutant) cells from N = 3 brains (biologically independent replicates). (F) Schematic depicting the genotype and corresponding fluorescent labels resulting from the Mosaic Analysis with Double Markers (MADM) recombination events. (G-H) Cre electroporation at E14.5/E15.5 in Foxg1-MADM brains (M12GT/TG, Foxg1) analysed at P14. Green (Foxg1—/—) and red (Foxg1+/+) cells were scored based on neuronal (open arrowheads, G) or glial (arrowheads, E) morphology. (H) Represents the number of neurons or glia as a percentage of the total population of neurons +glia of each genotype: control (red; +/+) or Foxg1 mutant (green –/–) neurons. n = 354 cells from N = 5 brains (biologically independent replicates). Statistical test: two-tailed unpaired t-test. *p<0.05, **p<0.01, ***p<0.001, ****p<0.0001. All scale bars: 50 μm.
Figure 2—figure supplement 1
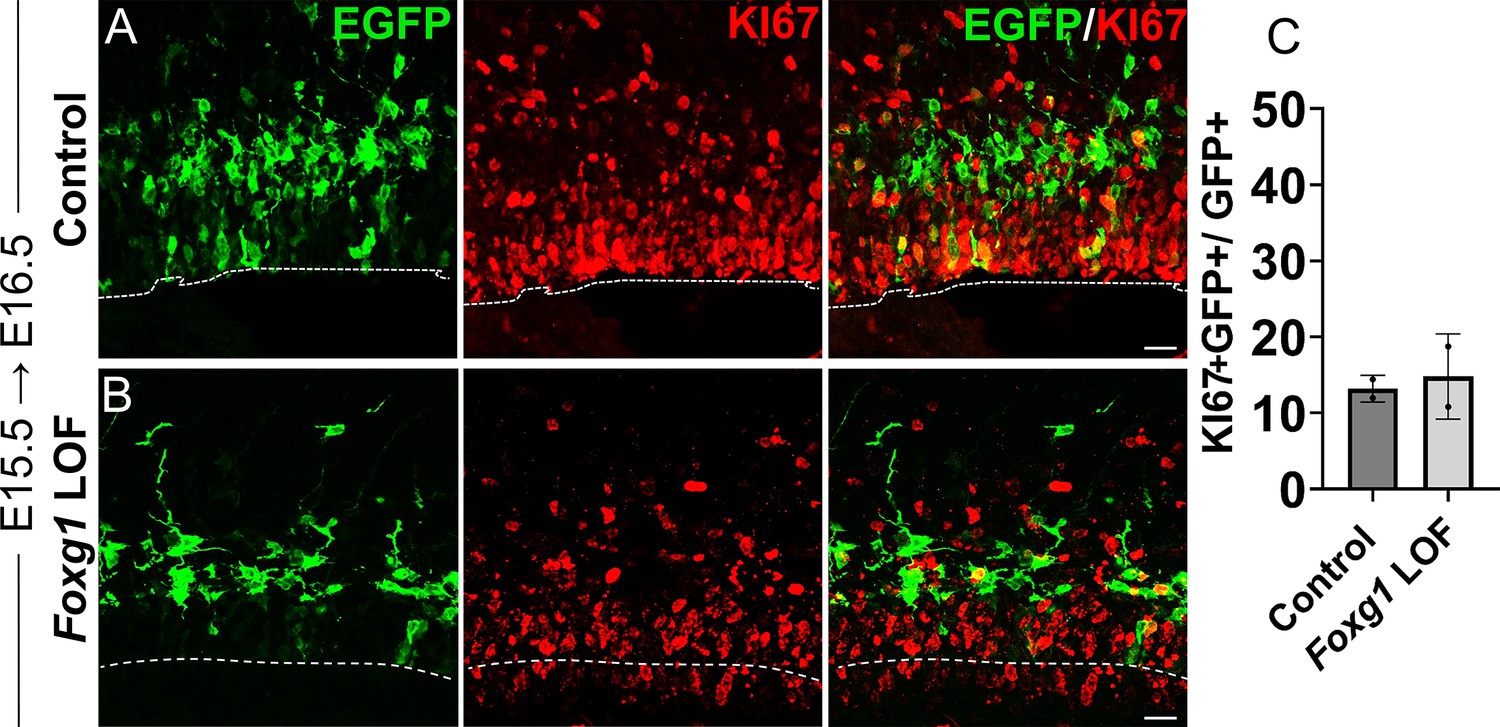
Loss of Foxg1 from E15.5 does not lead to enhanced proliferation at E16.5.
Analysis of the proliferation marker KI67 in Control and Foxg1 LOF E16.5 progenitors, 1 day post-electroporation at E15.5. KI67 colocalises with comparable numbers of GFP+ cells in both Control (A; Cre in Foxg1lox/+) and Foxg1 LOF (B; Cre in Foxg1lox/lox) brains. Quantifications are presented in (C). n = 403 cells (Control) and 663 cells (Foxg1 LOF) from N = 2 biologically independent experiments.
Figure 3 with 1 supplement
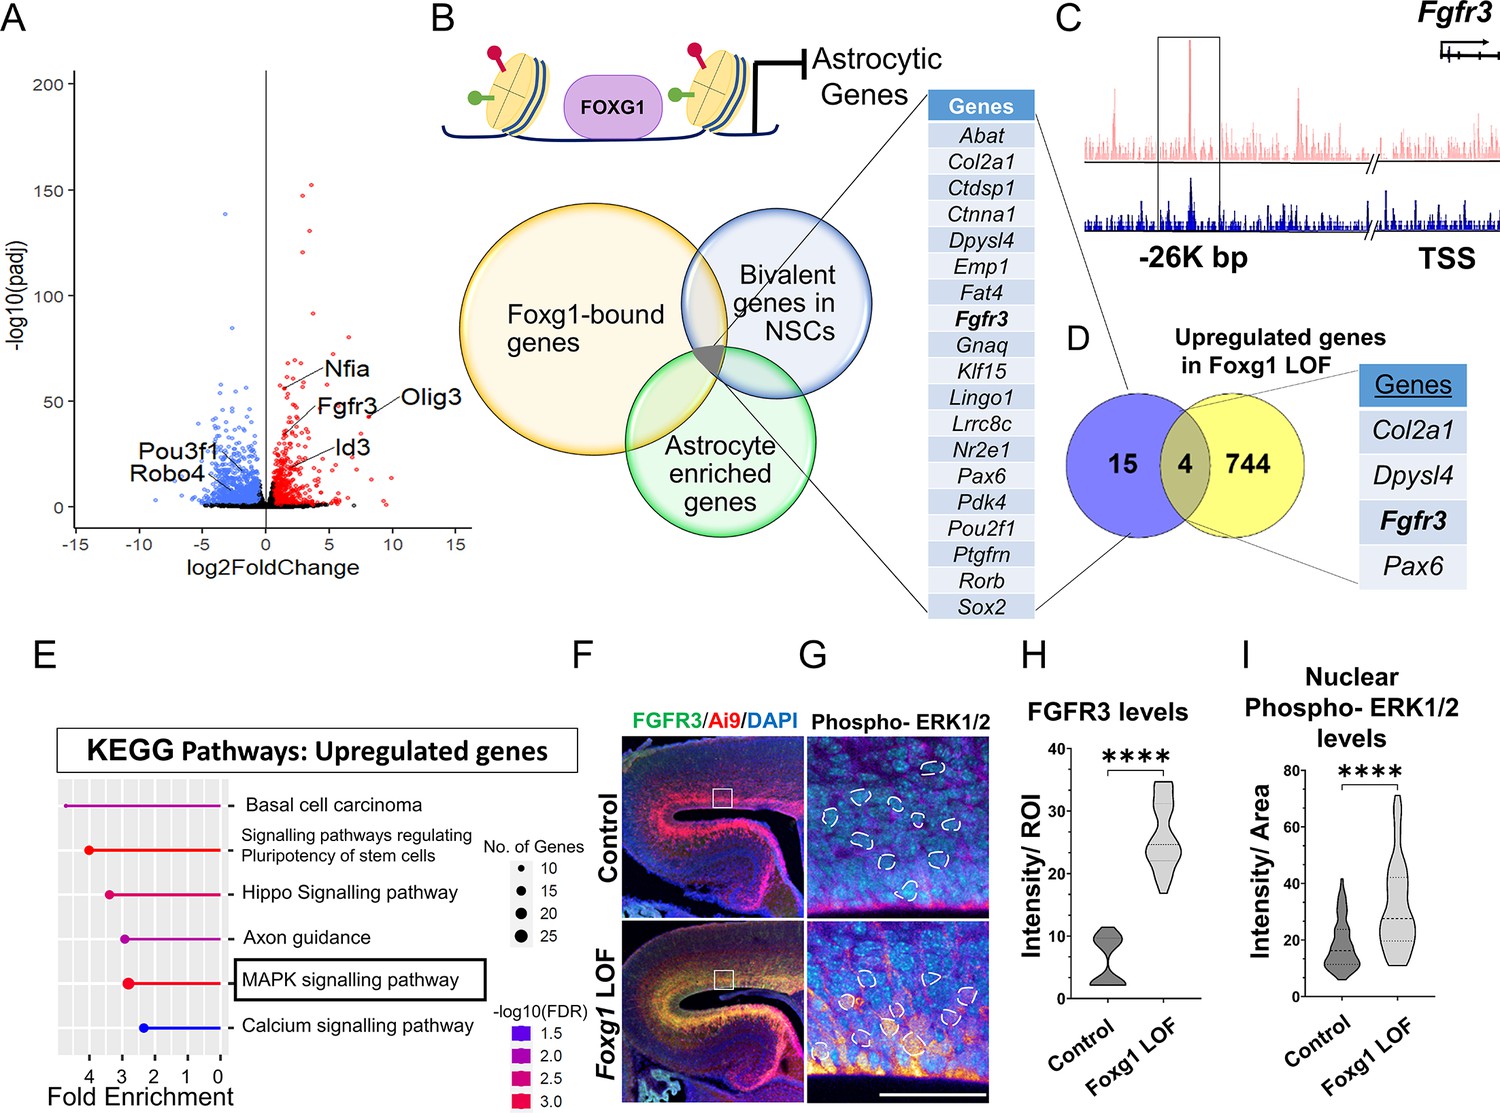
FOXG1 binds and regulates the expression of Fgfr3.
(A) RNA-seq analysis of FACS-purified Control and Foxg1 loss-of-function (LOF) progenitors harvested two days after labelling at E15.5. Gliogenic factors such as Nfia, Id3, and Olig3 are upregulated, and neuronal markers such as Pou3f1 and Robo4 are downregulated. (B–D) Multimodal analysis comparing FOXG1 occupancy (ChIP-seq) and bivalent epigenetic marks (H3K4Me3 and H3K27Me3) and astrocyte-enriched genes from Telley et al., 2019 reveals a list of 19 genes common to each dataset (B). Four of these are upregulated upon loss of Foxg1, including the known gliogenic gene Fgfr3 (D). FOXG1 occupies a –26 kb enhancer region of Fgfr3 (C). (E) KEGG analysis of the upregulated genes from (A) identifies the MAPK signalling pathway downstream of FGF signalling. (F) Loss of Foxg1 from E15.5 progenitors (hGFAP-CreERT2, tamoxifen at E15.5) causes upregulation of FGFR3 receptor by E17.5 as seen in cells near the VZ of the somatosensory cortex. Boxes (F) indicate the regions in high magnification shown in the adjacent panels (G). Dashed circles outline the regions of interest (ROIs) identified in the DAPI channel used for intensity quantification in (H). (G; n = 50 [Control and Foxg1 LOF] ROIs from N = 3 brains) and phosphorylated-ERK1/2 (H; n = 67 [Control] and 89 [Foxg1 LOF]) cells from N = 3 brains (biologically independent replicates). Statistical test: Mann–Whitney test *p<0.05, **p<0.01, ***p<0.001, ****p<0.0001. All scale bars: 50 μm.
Figure 3—figure supplement 1
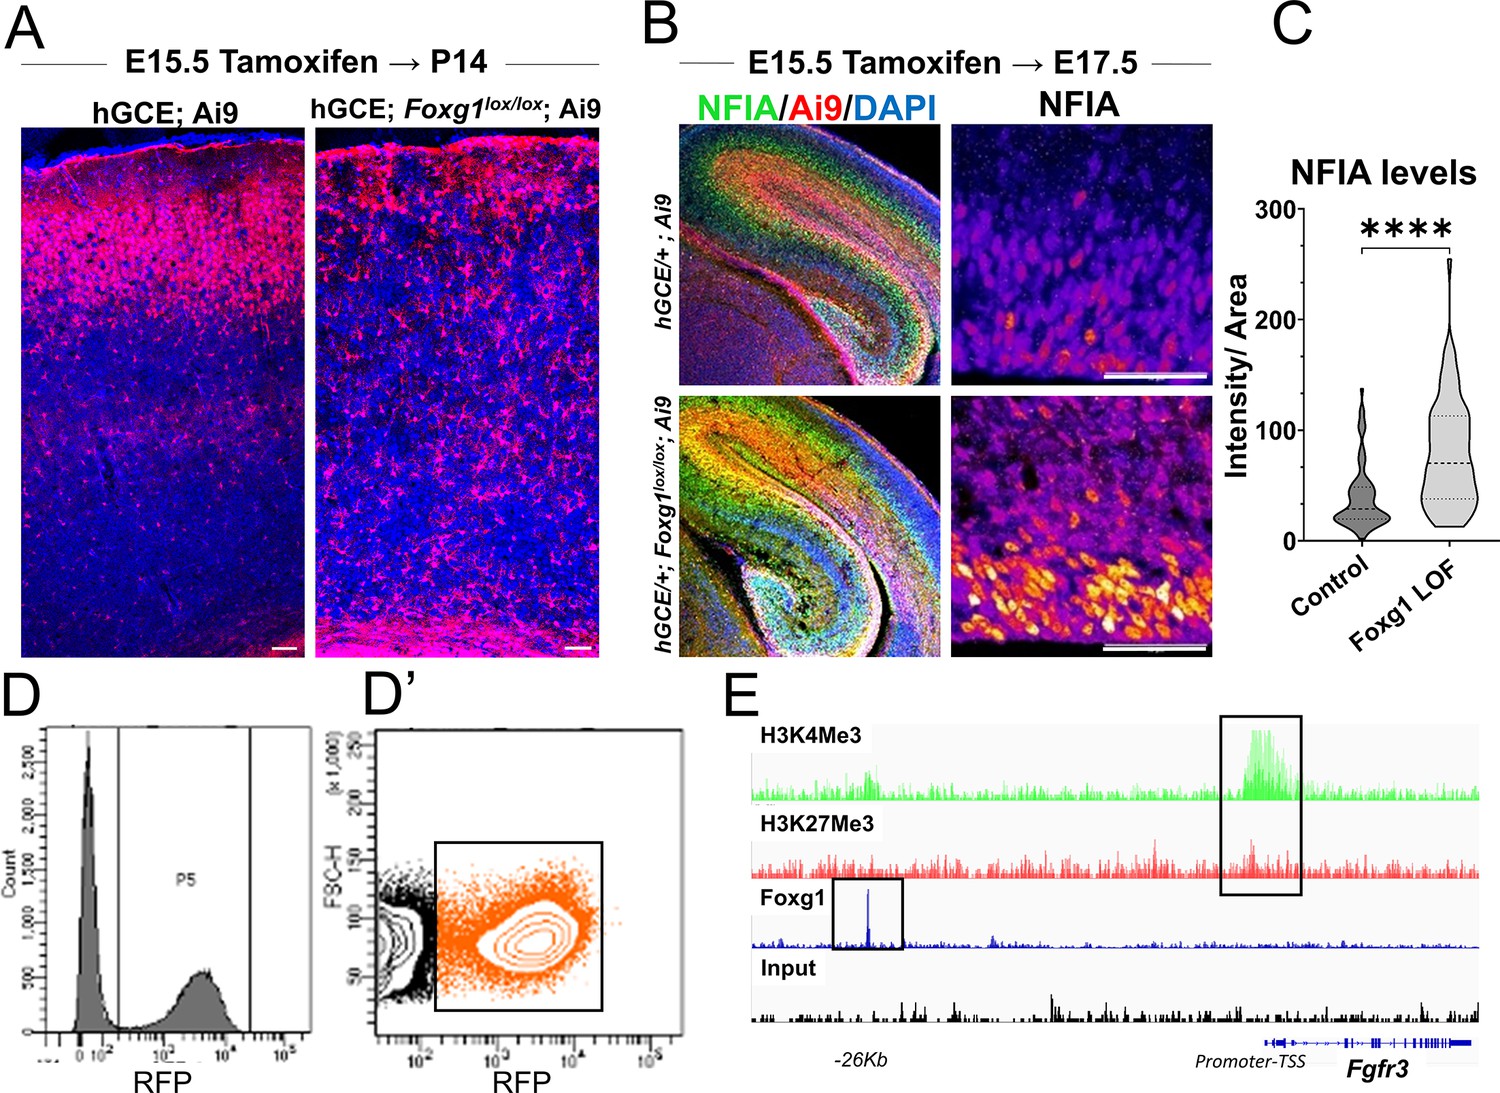
hGFAP-CreERT2; Ai9 (hGCE) line-based recapitulation of the premature gliogenesis phenotype and subsequent analysis.
(A) hGFAP-CreERT2/+; Ai9 (hGCE; Ai9) and hGFAP-CreERT2/+; Foxg1 lox/lox; Ai9 (labelled hGCE Foxg1lox/lox; Ai9) brains after tamoxifen administration at E15.5 and harvesting at P14. The Foxg1 loss-of-function (LOF) condition shows the absence of neurons and enhanced glia, consistent with the phenotype from the electroporation-mediated loss of Foxg1. This result is similar to that in Figure 1. (B, C) hGCE Foxg1lox/lox; Ai9 (tamoxifen at E15.5, harvested at E17.5). Foxg1 LOF progenitors display a significant upregulation of gliogenic factor NFIA (n = 310 [hGCE; Ai9] and 367 [hGCE Foxg1lox/lox; Ai9] cells from N = 3 biologically independent replicates). (D, D’) Fluorescence-activated cell sorting (FACS) plot of the Ai9+ cells obtained from control and hGCE Foxg1lox/lox; Ai9 brains (tamoxifen at E15.5, harvested at E17.5). Cells in the boxed cluster in (D’) were collected at E17.5 and purified for RNA sequencing. (E) Plot depicting the presence of both H3K4Me3 and H3K27Me3 (Bivalent) marks at the Fgfr3 promoter region and the presence of a FOXG1 binding site at 26 kb upstream region of the gene. Statistical test: Mann–Whitney test. Scale bar: 50 μm.
Figure 4
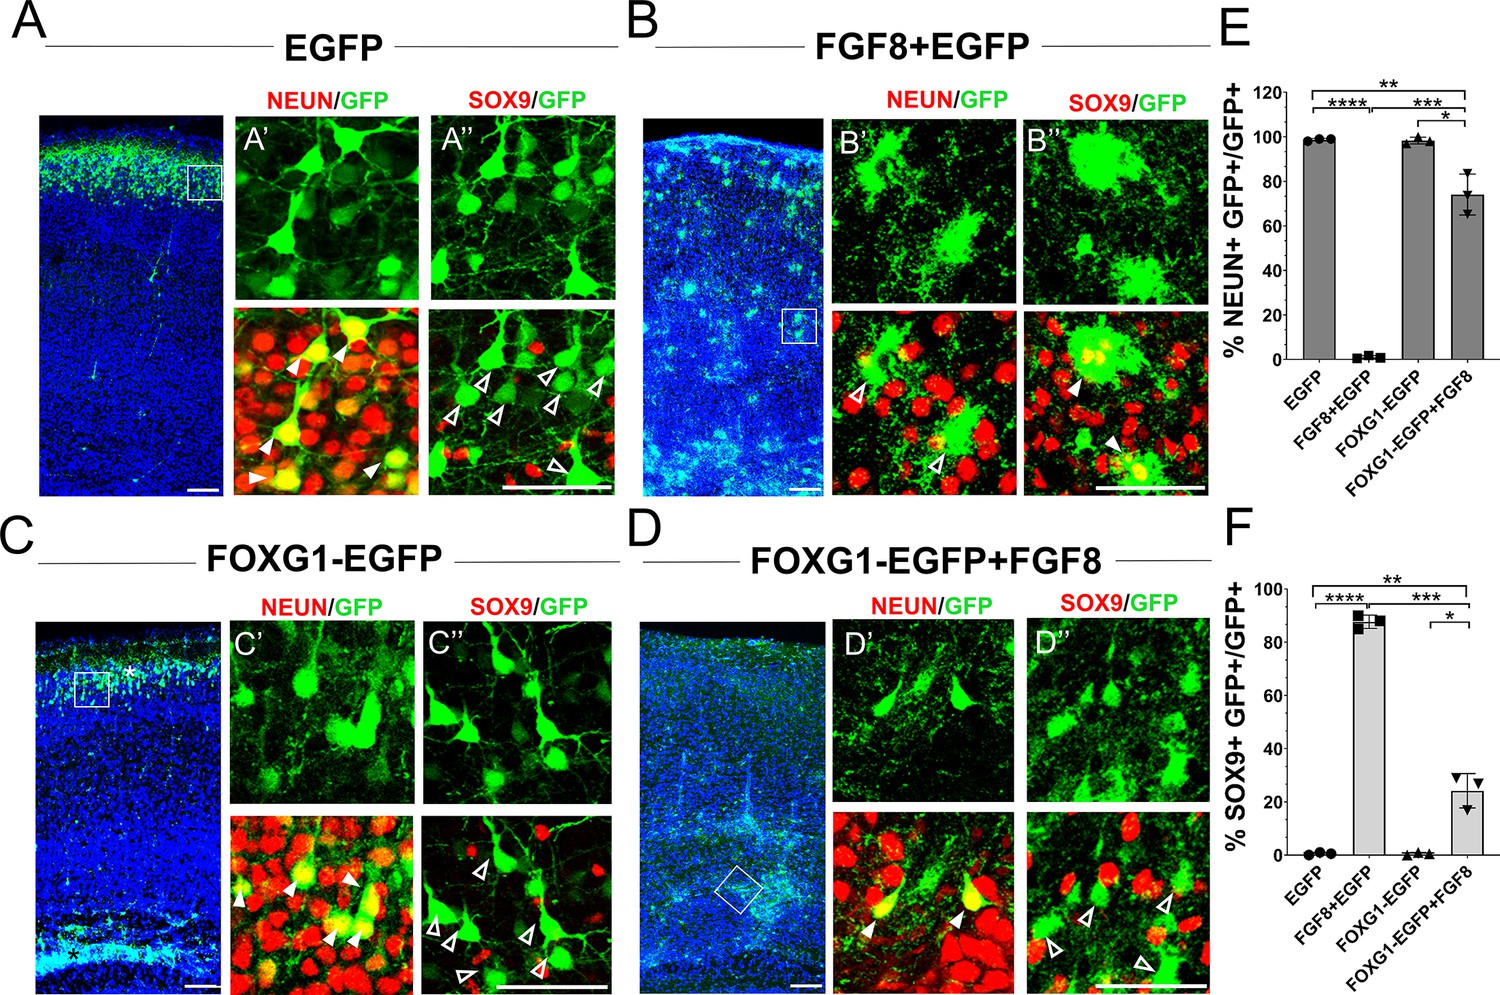
Foxg1 suppresses FGF-induced gliogenesis.
(A–D) In-utero electroporations were performed in wild-type embryos at E15.5, and the brains were analysed at P7. (A) GFP electroporation labels LII/III cells that are NEUN+ (arrowheads) and SOX9– (open arrowheads). (B) Overexpression of Fgf8 leads to premature gliogenesis, and the GFP+ cells are NEUN– (open arrowheads) and SOX9+ (arrowheads). (C) Overexpression of Foxg1 produced NEUN+ (arrowheads) and SOX9– (open arrowheads) neurons, some of which displayed delayed migration (black asterisk), and others migrated to the cortical plate (white asterisk), as shown in Miyoshi and Fishell, 2012. (D) Overexpression of Foxg1 together with FGF8 partially rescued neuronal fate such that GFP+ cells also displayed NEUN (arrowheads) but not SOX9 (open arrowheads). In (A–D), the boxes in the leftmost low-magnification panels indicate approximate regions shown in the adjacent high-magnification panels. (E) Quantifications of GFP+ cells that are also NEUN+ in each condition: 98.6% (GFP); 1.8% (Fgf8); 98.3% (Foxg1); 74.1% (Foxg1+Fgf8). (F) Quantifications of GFP+ cells that are also SOX9+ in each condition: 0% (Egfp); 87.7% (Fgf8+Egfp); 0% (Foxg1-Egfp); 24.2% (Foxg1-Egfp+Fgf8). n = 2,123 (Egfp), 1643 (Fgf8+Egfp), 1357 (Foxg1-Egfp), 1924 (Foxg1-Egfp+Fgf8) cells each from N = 3 brains (biologically independent replicates). Statistical test: two-way ANOVA with Tukey’s correction. *p<0.05, **p<0.01, ***p<0.001, ****p<0.0001. All scale bars: 50 μm.
Figure 5 with 1 supplement
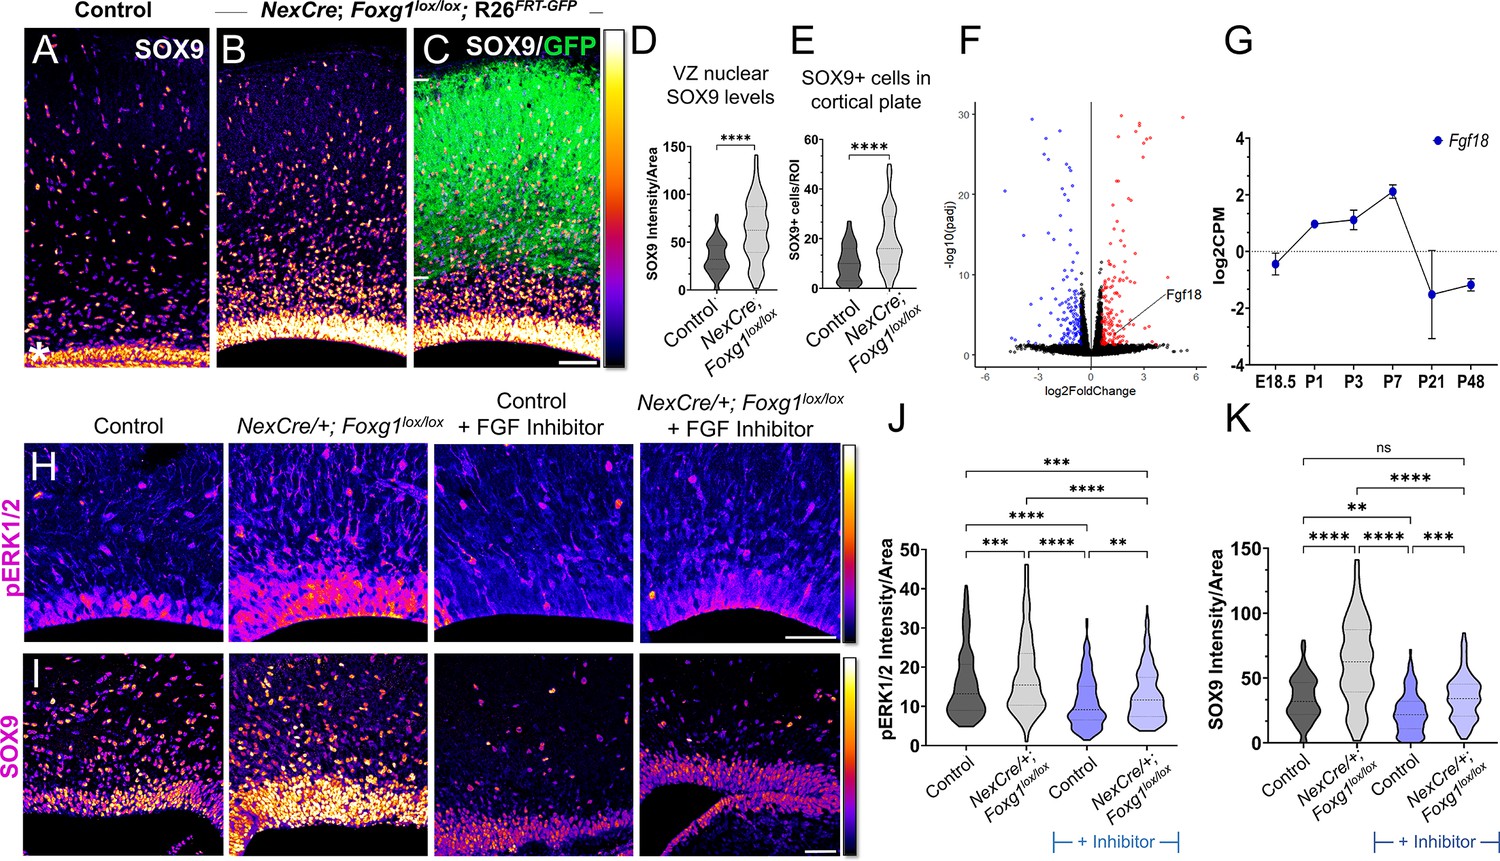
Postmitotic neuron Foxg1 loss-of-function (LOF) leads to premature gliogenesis and upregulation of the MAPK pathway.
(A) SOX9 staining in the control P0 cortex identifies gliogenic progenitors at the ventricular zone (VZ, white asterisk) and scattered cells throughout the cortical plate. (B–D) NexCre-driven loss of Foxg1 is specific to postmitotic neurons, as seen by GFP reporter expression (C, white bars) and causes a non-autonomous upregulation of nuclear SOX9 in the VZ progenitors and an increase in the numbers of SOX9+ cells cortical plate (B; quantifications: D, E). (B) and (C) are images of the same section showing SOX9 alone (B) and together with the GFP reporter (C). (F) Transcriptomic analysis of cortical plate tissue from control and NexCre/+; Foxg1lox/lox; Rosa26FRT-GFP reveals a significant upregulation of Fgf18 upon loss of Foxg1. (G) Fgf18 expression in CUX2+ upper-layer cells peaks at P7, as seen in the RNA seq dataset from Yuan et al., 2022. (H) Examination at E18.5 reveals increased levels of phosphorylated p42/44-ERK1/2 (pERK1/2) within the VZ of NexCre/+; Foxg1lox/lox brains, indicative of enhanced FGF signalling. This upregulation of pERK1/2 is reversed upon treatment with the FGF Inhibitor NVP-BGJ398 (H; quantifications: J). (I) In sections from the same brains, levels of SOX9 within the VZ are increased upon postmitotic loss of Foxg1, and this is restored to baseline levels upon administration of the inhibitor. (I; quantifications: K). Quantifications of pERK1/2 in each condition: 233 (Control); 248 (NexCre/+; Foxg1lox/lox); 207 (Control+ NVP-BGJ398); 223 (NexCre/+; Foxg1lox/lox+NVP-BGJ398) cells from N = 2 brains (biological replicates from two independent experiments). Quantifications of SOX9 levels in each condition: 233 (Control); 234 (NexCre/+; Foxg1lox/lox); 228 (Control+ NVP-BGJ398); 205 (NexCre/+; Foxg1lox/lox+NVP-BGJ398) cells from N = 3 brains (biological replicates from two independent experiments). Statistical test: Mann–Whitney test (D, E); two-way ANOVA with Tukey’s correction (J, K). *p<0.05, **p<0.01, ***p<0.001, ****p<0.0001. All scale bars: 50 μm.
Figure 5—figure supplement 1
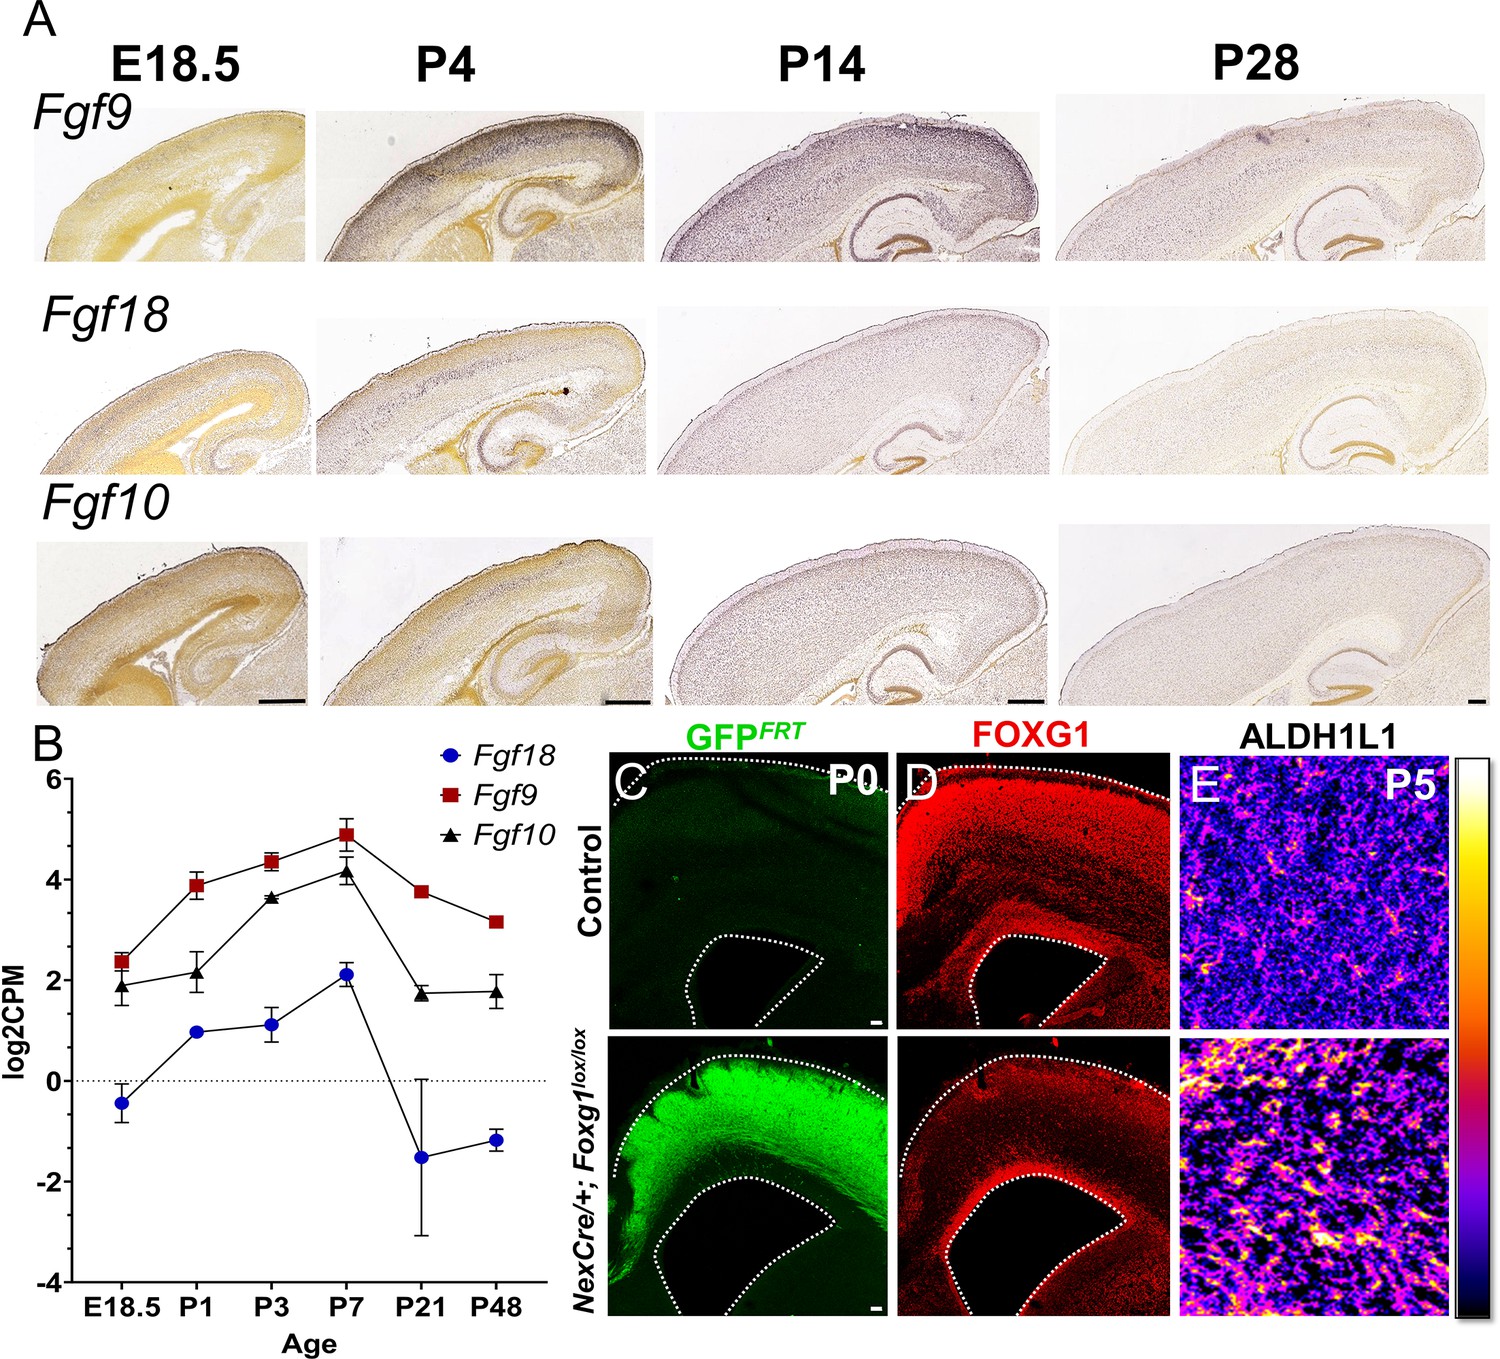
Postmitotic neuron-specific role of FOXG1 in regulating FGF signalling.
(A, B) Expression of FGF ligands such as Fgf9, Fgf10, and Fgf18 peaks in the first postnatal week and declines thereafter as seen in Allen Brain Atlas in situ hybridisation data (A; Thompson et al., 2014 and RNA-Seq data from Yuan et al., 2022). (C–E) Deletion of Foxg1 using NexCre results in a reduction of FOXG1 protein expression specifically within the cortical plate (C, D) and an apparent increase in ALDH1L1 staining within the cortical plate (E).
Figure 6 with 3 supplements
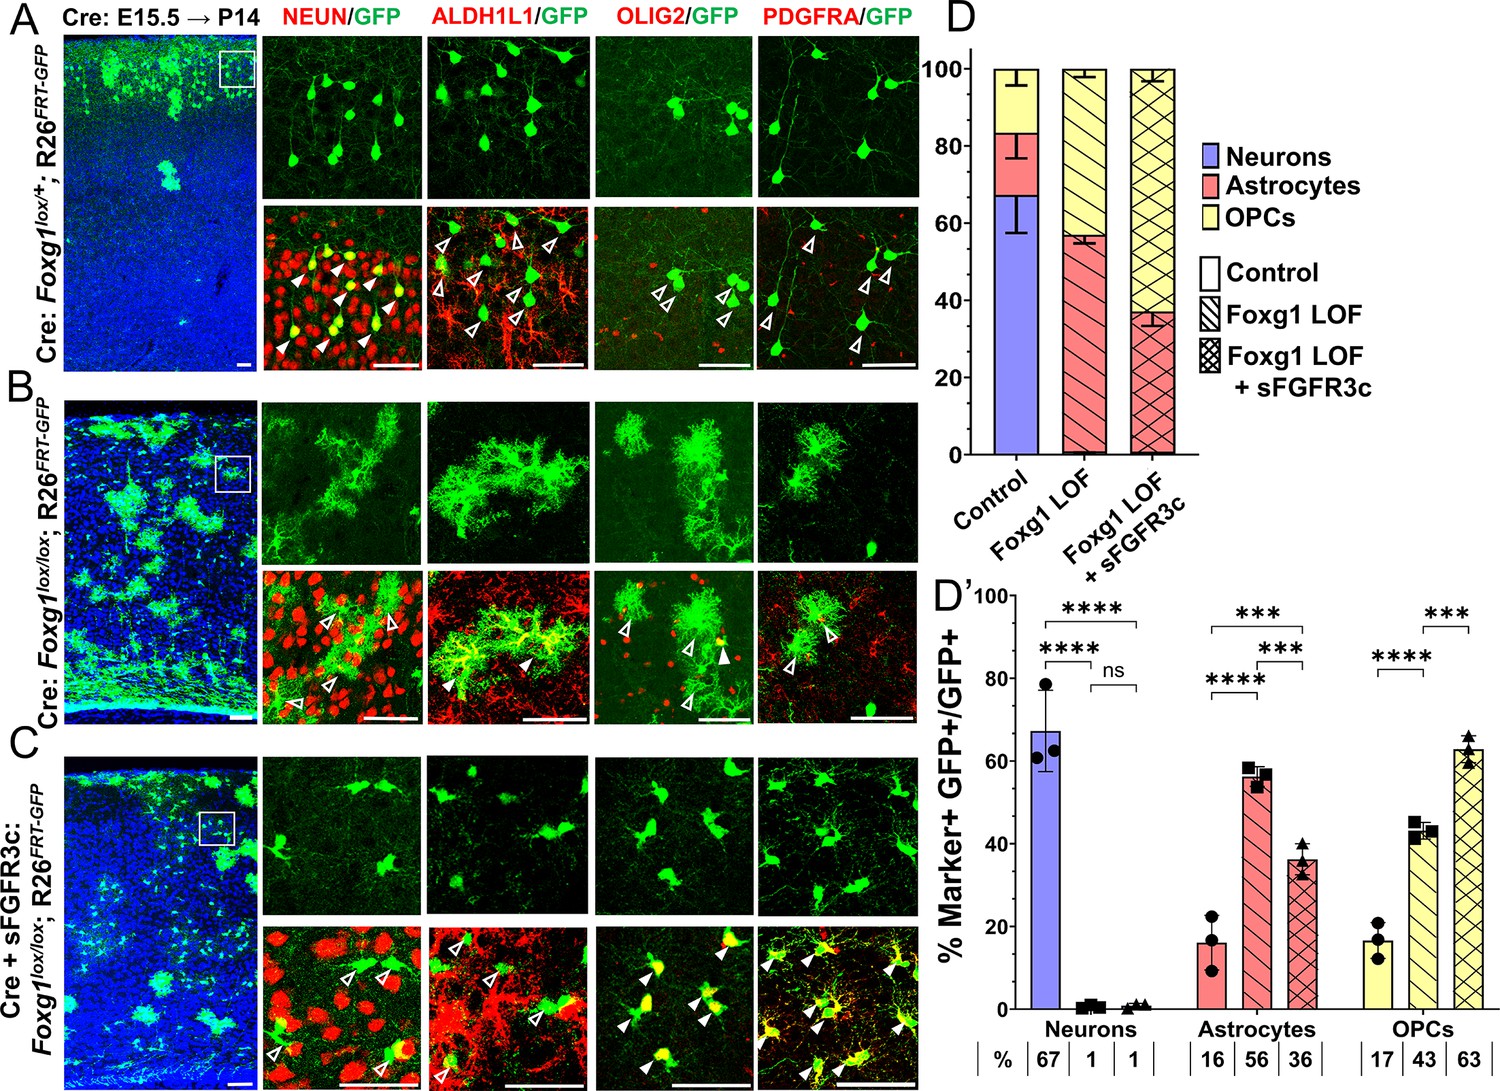
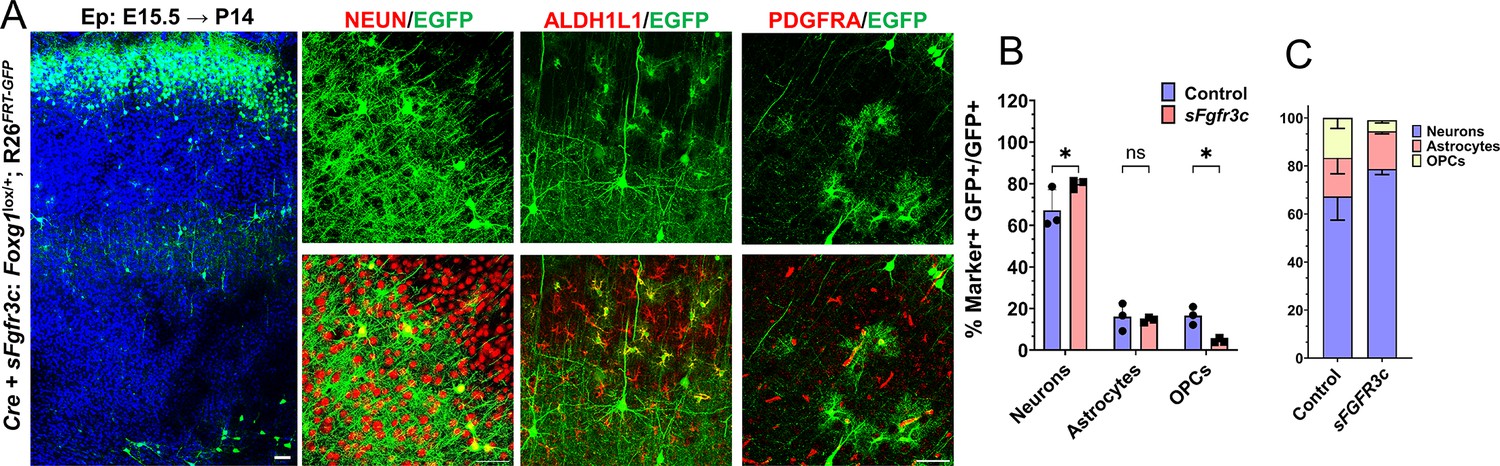
Foxg1-Fgf double loss-of-function (LOF) leads to premature oligogenesis.
(A–C) Cre electroporation at E15.5 in control (A, Foxg1lox/+; Rosa26FRT-GFP) and Foxg1 LOF (B, Foxg1lox/lox; Rosa26FRT-GFP) embryos, followed by analysis at P14. GFP+ cells in control brains do not colocalise with ALDH1L1, OLIG2, and PDGFRA staining (A), whereas most GFP+ cells in Foxg1 LOF brains display these markers (B). Co-electroporation of Cre together with a construct encoding soluble FGFR3c (an FGF-chelator) in Foxg1lox/lox; Rosa26FRT-GFP causes a significant increase in the co-localisation of GFP+ cells with oligodendrocyte precursor cells (OPCs) markers such as OLIG2 and PDGFRA (C). In each row (A–C), the boxes in the leftmost low magnification panels indicate approximate regions from the same section or serial sections shown in the adjacent high magnification panels. A quantitative analysis reveals a drastic reduction of upper-layer neurogenesis at the expense of gliogenesis (astrocytes + OPCs) upon loss of Foxg1 and an additional increase in the percentage of OPCs with the additional abrogation of FGF signalling (D, D’). n = 4069 (Control), 3970 (Foxg1 LOF), 3332 (Foxg1 LOF+sFgfr3c) from N = 3 brains (biologically independent replicates). Statistical test: two-way ANOVA.with Tukey’s correction *p<0.05, **p<0.01, ***p<0.001, ****p<0.0001. All scale bars: 50 μm.
Figure 6—figure supplement 1
sFgfr3c overexpression at E15.5 in Rosa26FRT-GFP background leads to prolonged neurogenesis.
(A–C) sFgfr3c+Cre electroporation at E15.5 in Control (A, Foxg1lox/+; Rosa26FRT-GFP) embryos, followed by analysis at P14 (A). 79.9% of GFP+ cells colocalise with NEUN, compared to 67.3% in Controls. 14.55% of GFP+ cells colocalise with ALDH1L1 compared to 16% in Controls. 3.9% of cells colocalise with PDGFRA compared to 17% in Controls (B, C). n = 2000 cells from N = 3 biologically independent experiments. Statistical analysis: Student’s t-test. Scale bars: 50 μm.
Figure 6—figure supplement 2
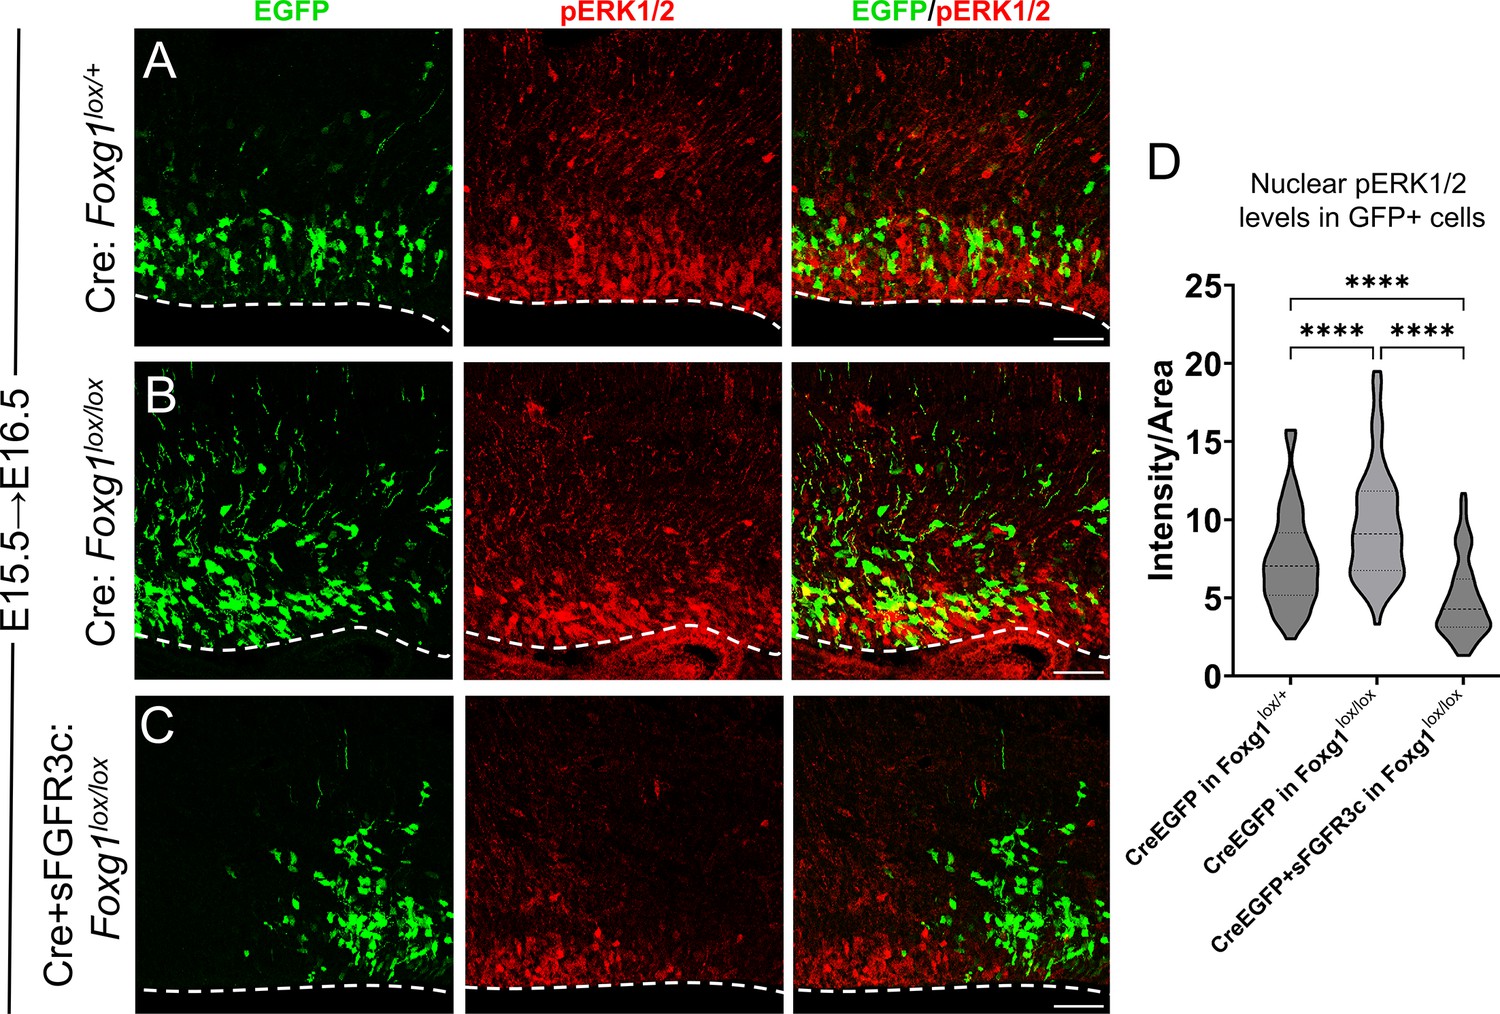
FGF signalling is modulated upon induction of sFGFR3c in E15.5 progenitors.
(A–D) Quantification of pERK1/2 levels in E15.5 progenitors examined at E16.5, 1 day post-electroporation, under different conditions: (A, B) Electroporation of Cre in Foxg1lox/lox embryos (B) at E15.5 results in elevated pERK1/2 levels compared to controls (A). This increase is significantly attenuated upon electroporation of Cre+sFGFR3c in Foxg1lox/lox progenitors (C). The intensity quantification is represented in (D). n = 500 cells per condition from N = 2 biologically independent experiments. Statistical analysis: two-way ANOVA with Tukey’s correction. Scale bars: 50 μm.
Figure 6—figure supplement 3
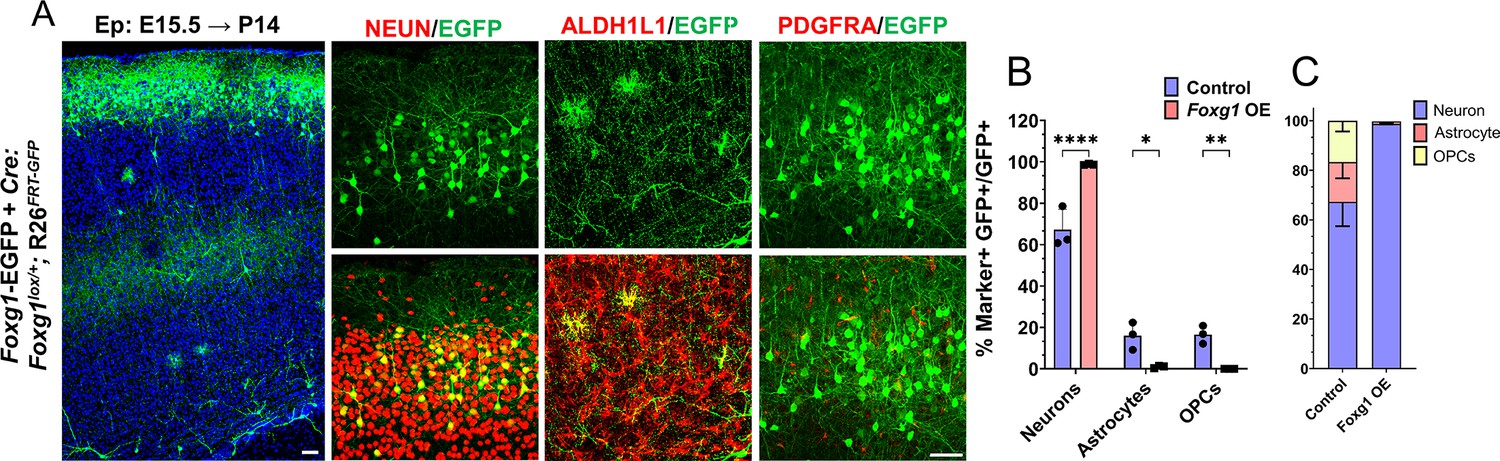
Foxg1 overexpression at E15.5 in Rosa26FRT-GFP background leads to prolonged neurogenesis.
(A–C) Foxg1-Egfp+Cre electroporation at E15.5 in Control (A, Foxg1lox/+; Rosa26FRT-GFP) embryos, followed by analysis at P14 (A). 98% of GFP+ cells colocalise with NEUN, compared to 67.3% in Controls. 2% of GFP+ cells colocalise with ALDH1L1 compared to 16% in Controls. 0% of cells colocalise with PDGFRA compared to 17% in Controls (B, C). n = 2000 cells from N = 3 biologically independent experiments. Statistical analysis: Student’s t-test. Scale bars: 50 μm.
Figure 7
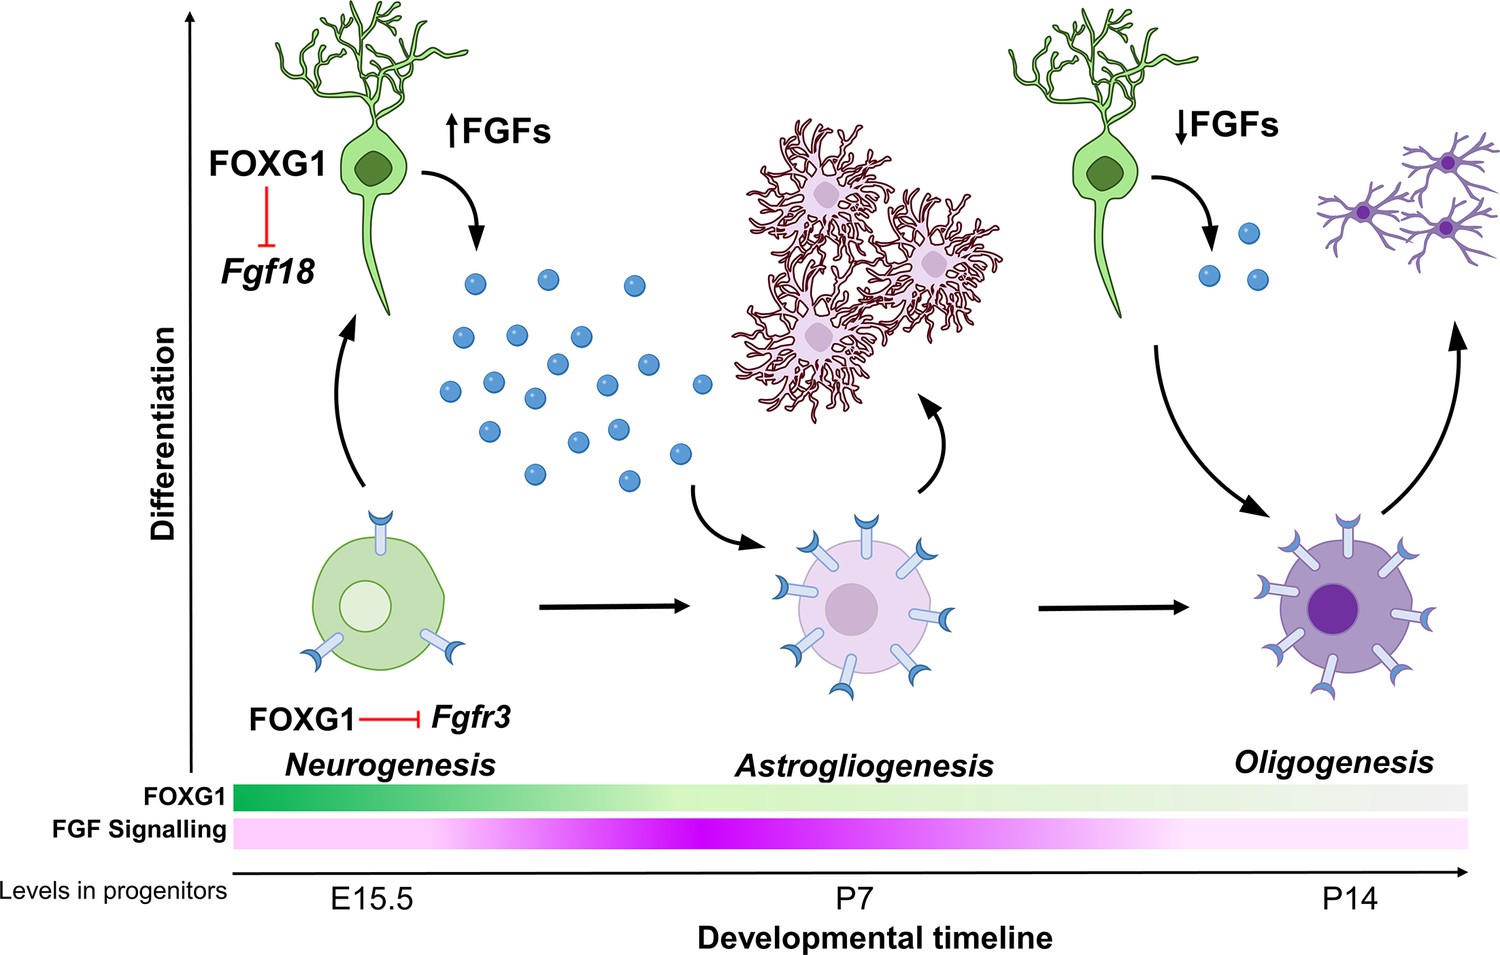
Schematic depicting the regulation of gliogenesis by FOXG1.
In neurogenic progenitors, FGFR3 levels are suppressed by FOXG1. As time progresses, FOXG1 levels decrease within progenitors (expression gradient in green), and FGFR3 levels increase (expression gradient in magenta), making progenitors more sensitive to FGF signalling. Concomitantly, postmitotic neurons secrete factors, including FGF18, which is also under FOXG1 regulation. FGF signalling drives progenitors towards astrogliogenesis. Later, when both, FOXG1 and FGF levels are low, the progenitors transition to oligogenesis.
Tables
Key resources table
| Reagent type (species) or resource | Designation | Source or reference | Identifiers | Additional information |
|---|---|---|---|---|
| Strain, strain background (Mus musculus) | Foxg1lox/lox; Rosa26FRT-GFP | PMID:22726835 | ||
| Strain, strain background (M. musculus) | MADM-12 GT/GT | PMID:34161767 | ||
| Strain, strain background (M. musculus) | MADM-12 TG/TG | PMID:34161767 | ||
| Strain, strain background (M. musculus) | hGFAP-CreERT2 | Jackson Laboratory | Strain No.: 012849 | |
| Strain, strain background (M. musculus) | Ai9 | Jackson Laboratory | Strain No.: 007909 | |
| Strain, strain background (M. musculus) | NexCre/+ (Neurod6-Cre) | PMID:17146780 | ||
| Transfected construct (M. musculus) | pCAGG-IRES-eGFP | PMID:22726835 | Gift from Prof. Gord Fishell | |
| Transfected construct (M. musculus) | pCAGG-IRES-FOXG1-EGFP | PMID:22726835 | Gift from Prof. Gord Fishell | |
| Transfected construct (M. musculus) | pCAGG-FGF8 | PMID:31175212 | Gift from Prof. Hiroshi Kawasaki | |
| Transfected construct (M. musculus) | pCAGG-sFGFR3c | PMID:31175212 | Gift from Prof. Hiroshi Kawasaki | |
| Antibody | Biotinylated GFP (goat polyclonal) | Abcam | Catalog number: ab6658 | 1:200 |
| Antibody | NEUN (rabbit monoclonal) | Thermo Fisher Scientific | Catalog number: 702022 | 1:200 |
| Antibody | ALDH1L1 (rabbit polyclonal) | Abcam | Catalog number: ab87117 | 1:200 |
| Antibody | OLIG2 (rabbit polyclonal) | Merck Millipore | Catalog number: AB9610 | 1:200 |
| Antibody | SOX9 (rabbit monoclonal) | Abcam | Catalog number: ab185230 | 1:200 |
| Antibody | KI67 (rabbit monoclonal) | Thermo Fisher Scientific | Catalog number: MA5-14520 | 1:1000 |
| Antibody | RFP (mouse monoclonal) | Thermo Fisher Scientific | Catalog number: MA5-15257 | 1:200 |
| Antibody | Phospho p42/44 MAPK (rabbit monoclonal) | Cell Signaling Technology | Catalog number: 4370S | 1:200 |
| Antibody | FGFR3 (rabbit polyclonal) | Affinity Biosciences | Catalog number: AF0160 | 1:100 |
| Antibody | NF1A (rabbit polyclonal) | Abcam | Catalog number: ab228897 | 1:500 |
| Antibody | PAX6 (mouse monoclonal) | Thermo Fisher Scientific | Catalog number: MA1-109 | 1:500 |
| Antibody | EOMES (rat monoclonal) | Thermo Fisher Scientific | Catalog number: 14-4875-82 | 1:200 |
| Antibody | SOX2 (mouse monoclonal) | Thermo Fisher Scientific | Catalog number: MA1-014 | 1:200 |
| Antibody | CD140a (mouse monoclonal) | BD Biosciences | Catalog number: 558774 | 1:500 |
| Antibody | FOXG1 (rabbit polyclonal) | TakaraBio | Catalog number: M227 | 1:200 |
| Antibody | Anti-rabbit 568 (goat polyclonal) | Thermo Fisher Scientific | Catalog number: A11011 | 1:200 |
| Antibody | Streptavidin Alexa 488 Conjugate Dye | Thermo Fisher Scientific | Catalog number: S32354 | 1:200 |
| Antibody | Anti-rabbit 647 (donkey polyclonal) | Thermo Fisher Scientific | Catalog number: A31573 | 1:200 |
| Antibody | Anti-mouse 568 (goat polyclonal) | Thermo Fisher Scientific | Catalog number: A11004 | 1:200 |
| Antibody | Anti-rat 647 (goat polyclonal) | Thermo Fisher Scientific | Catalog number: A21247 | 1:200 |
| Antibody | Anti-rat 568 (goat polyclonal) | Thermo Fisher Scientific | Catalog number: A11077 | 1:200 |
| Antibody | Anti-rabbit 488 (goat polyclonal) | Thermo Fisher Scientific | Catalog number: A11034 | 1:200 |
| Commercial assay or kit | FlashTag | Thermo Fisher Scientific | SKU C34554 | |
| Commercial assay or kit | HBSS without calcium/magnesium | Thermo Fisher Scientific | Catalog number: 14170112 | |
| Commercial assay or kit | HBSS with calcium/magnesium | Thermo Fisher Scientific | Catalog number: 14025092 | |
| Commercial assay or kit | 0.25% Trypsin | Thermo Fisher Scientific Gibco | Catalog number: 15400054 | |
| Chemical compound, drug | Corn oil | Sigma-Aldrich | Catalog number: 8267 | |
| Chemical compound, drug | Triton-X100 | Sigma-Aldrich | CAS No.: 9036-19-5 | |
| Chemical compound, drug | Tamoxifen | Sigma-Aldrich | Catalog number:T5648 | |
| Chemical compound, drug | NVP-BGJ398 | MedChemExpress | Catalog number: HY-13311 | |
| Software, algorithm | FastQC | Babraham Bioinformatics | Other | https://www.bioinformatics.babraham.ac.uk/projects/fastqc/ |
| Software, algorithm | HISAT2 | PMID:31375807 | ||
| Software, algorithm | DESeq2 | PMID:25516281 | ||
| Software, algorithm | Shiny GO | PMID:31882993 | ||
| Software, algorithm | SRA Toolkit | SRA Toolkit Development Team | Other | https://trace.ncbi.nlm.nih.gov/Traces/sra/sra.cgi?view=software |
| Software, algorithm | Bowtie2 | PMID:22388286 | ||
| Software, algorithm | Homer | PMID:20513432 | ||
| Software, algorithm | BEDTools | PMID:20110278 | ||
| Software, algorithm | IGV | PMID:21221095 | ||
| Software, algorithm | Fiji | PMID:22743772 |
Additional files
-
Supplementary file 1
FOXG1 occupied and differentially expressed genes in progenitors.
Dataset 1 (separate file): Sheet 1: differentially expressed genes identified using DESeq2 in the Foxg1 LOF cells vs. Control at E17.5 related to Figure 3A. Sheet 2: list intersecting regions between the FOXG1 ChIP-seq and bivalent marks H3K27me3 and H3K4me3.
- https://cdn.elifesciences.org/articles/101851/elife-101851-supp1-v1.xlsx
-
Supplementary file 2
Neuron-specific Foxg1 loss induced differentially expressed secreted factors in the cortical plate.
Dataset 2 (separate file): Sheet 1: differentially expressed genes identified using DESeq2 in NexCre/+; Foxg1 LOF vs Control cortical plate cells related to Figure 5E. Sheet 2: list of differentially expressed secreted molecules subset from the NexCre/+; Foxg1 LOF vs Control RNA seq dataset.
- https://cdn.elifesciences.org/articles/101851/elife-101851-supp2-v1.xlsx
-
MDAR checklist
- https://cdn.elifesciences.org/articles/101851/elife-101851-mdarchecklist1-v1.pdf
Download links
A two-part list of links to download the article, or parts of the article, in various formats.
Downloads (link to download the article as PDF)
Open citations (links to open the citations from this article in various online reference manager services)
Cite this article (links to download the citations from this article in formats compatible with various reference manager tools)
Dual role of FOXG1 in regulating gliogenesis in the developing neocortex via the FGF signalling pathway
eLife 13:RP101851.
https://doi.org/10.7554/eLife.101851.3


