The ESCRT protein CHMP5 restricts bone formation by controlling endolysosome-mitochondrion-mediated cell senescence
- Xuanwu Hospital Capital Medical University, China
- National Clinical Research Center for Geriatric Diseases, China
- Joint Therapeutics Co. Ltd, China
- Beijing Citident Hospital of Stomatology, China
- Department of Molecular, Cell and Cancer Biology, University of Massachusetts Chan Medical School, United States
- The First Affiliated Hospital of Xiamen University-ICMRS Collaborating Center for Skeletal Stem Cells, State Key Laboratory of Cellular Stress Biology, Faculty of Medicine and Life Sciences, School of Medicine, Xiamen University, China
- Department of Medicine/Division of Rheumatology, University of Massachusetts Chan Medical School, United States
Figures
Figure 1 with 1 supplement
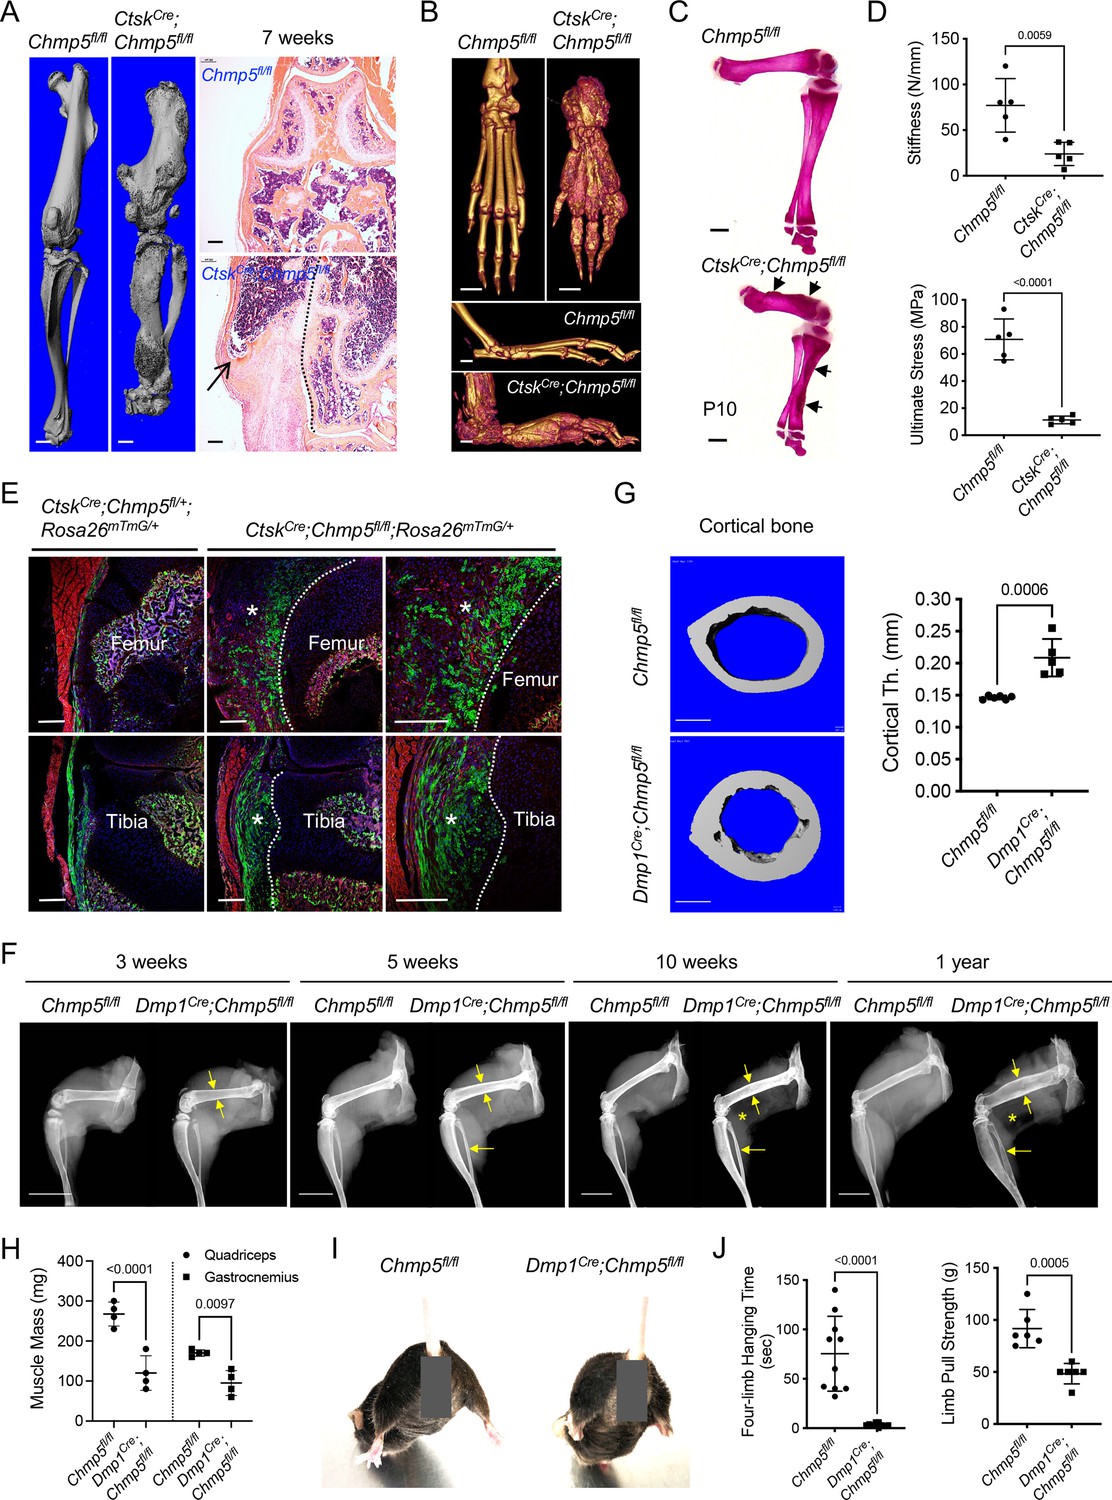
Ablation of charged multivesicular body protein 5 (Chmp5) in mouse osteogenic lineage cells causes aberrant bone formation.
(A) Micro-CT and H&E staining showing periskeletal overgrowth in CtskCre;Chmp5fl/fl mice in comparison with Chmp5fl/fl mice at 7 wk of age. Dot line representing the approximate bone border. n=10 animals per group. (B) Micro-CT images displaying periskeletal overgrowth in the ankle and foot in CtskCre;Chmp5fl/fl versus Chmp5fl/fl mice at 1 y of age. n=4 animals per group. (C) Alizarin red staining of skeletal preparations on postnatal day 10. n=4 mice per group, arrows indicating periskeletal bone overgrowth. (D) Three-point test showing femur bone stiffness and ultimate stress (fracture stress) in CtskCre;Chmp5fl/fl and Chmp5fl/fl mice. n=5 male animals per group. Similar changes were observed in both sexes. (E) Confocal images mapping Ctsk+ (GFP+) progenitors in periskeletal tissues in CtskCre;Chmp5fl/+;Rosa26mTmG/+ and CtskCre; Chmp5fl/fl;Rosa26mTmG/+ mice at 2 wk of age. Asterisks indicate periskeletal overgrowths; dot line represents the approximate bone border. n=4 animals each group. (F) X-ray images demonstrating progressive cortical bone expansion (arrows) and decreased skeletal muscle mass (asterisks) in Dmp1Cre;Chmp5fl/fl in comparison with Chmp5fl/fl mice. n=3, 3, 10, 8 animals per group for 3 wk, 5 wk, 10 wk, and 1 y of age, respectively. (G) Micro-CT analyses displaying cortical bone expansion in Dmp1Cre;Chmp5fl/fl relative to Chmp5fl/fl mice at 10 wk of age. n=6 Chmp5fl/fl and 5 Dmp1Cre;Chmp5fl/fl male mice, similar changes found in both genders. (H) Skeletal muscle mass in Dmp1Cre;Chmp5fl/fl compared to Chmp5fl/fl mice at 10–12 wk of age. n=4 animals (male) per group, similar changes found in both genders. (I) Hindlimb abduction of Dmp1Cre;Chmp5fl/fl mice in comparison with Chmp5fl/fl littermate controls at 10 wk of age. More than 20 animals per group were observed. (J) Four-limb handing time (n=10 per group, pooled data from both sexes), and forelimb pull strength (n=6 per group, male mice) in Dmp1Cre;Chmp5fl/fl compared to Chmp5fl/fl mice at 10–12 wk of age. Similar changes found in both genders. All data are mean ± s.d.; two-tailed unpaired Student’s t-test. Scale bars, 1 mm for micro-CT and skeletal preparation images, 200 μm for histological images, and 10 mm in panel (F).
-
Figure 1—source data 1
Data of three-point test, cortical bone thickness, and quantification of skeletal muscle mass and functions.
For Figure 1D, Data of femur bone stiffness and ultimate stress (fracture stress) by three-point test in CtskCre;Chmp5fl/fl and Chmp5fl/fl mice; Figure 1G, Data of cortical bone thickness (mm) by micro-CT analysis in Dmp1Cre;Chmp5fl/fl relative to Chmp5fl/fl mice; Figure 1H, Data of skeletal muscle mass (mg) in Dmp1Cre;Chmp5fl/fl compared to Chmp5fl/fl mice at 10–12 wk of age; Figure 1J, Data of four-limb handing time (s) and forelimb pull strength (g) in Dmp1Cre;Chmp5fl/fl compared to Chmp5fl/fl mice.
- https://cdn.elifesciences.org/articles/101984/elife-101984-fig1-data1-v1.xlsx
Figure 1—figure supplement 1
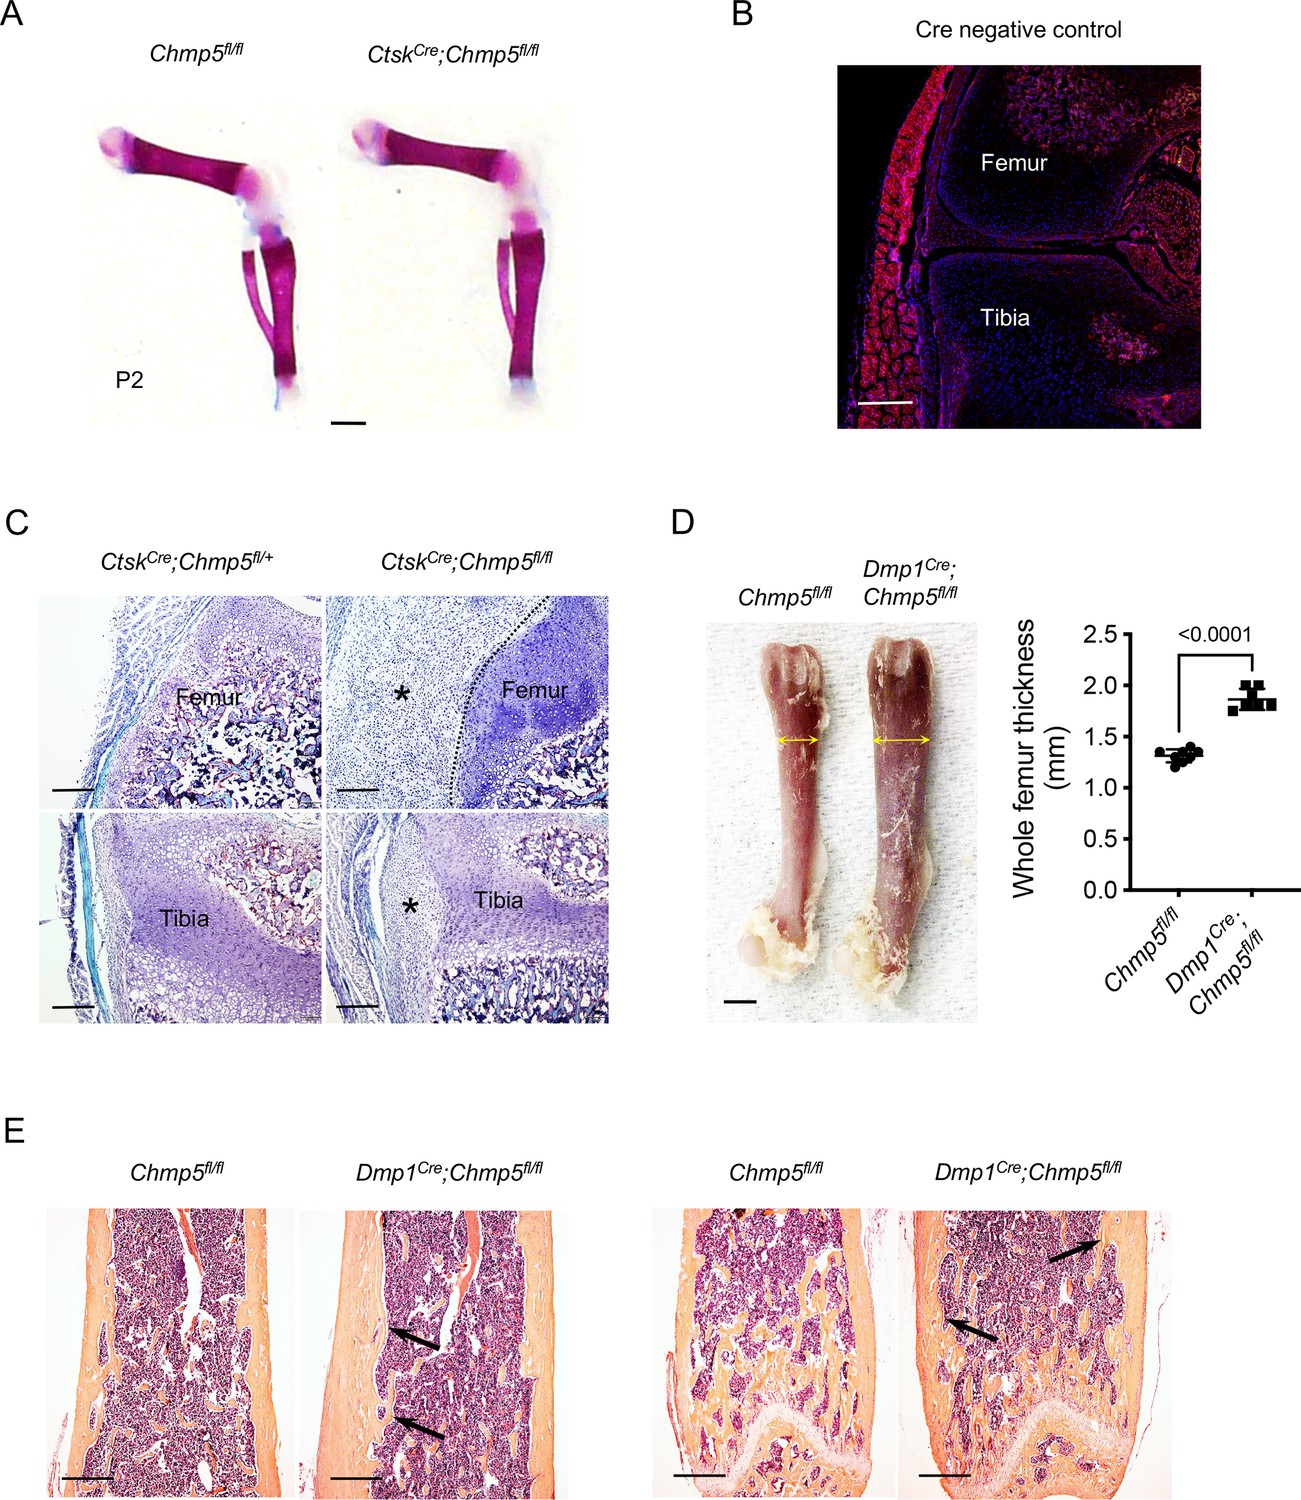
Charged multivesicular body protein 5 (CHMP5) restricts bone formation in osteogenic lineage cells.
(A) Alizarin red staining of skeletal preparations on postnatal day 2. n=4 mice per group. Scale bar, 1 mm. (B) Confocal images of Rosa26mTmG/+ (Cre-) control mice. Related to Figure 1E. Scale bar, 200 μm. (C) Tartrate-resistant acid phosphatase (TRAP) staining demonstrating the absence of osteoclasts in peri-skeletal overgrowth (asterisk) of CtskCre;Chmp5fl/fl mice at 2 wk of age. TRAP+ osteoclasts in the bone marrow as positive control; dot-line representing approximate border between peri-skeletal overgrowth and the bone at femoral condyle of the knee. Images are representative of three animals per group. Scale bar, 200 μm. (D) Gross image and measurement of femur thickness showing bone expansion in Dmp1Cre;Chmp5fl/fl versus Chmp5fl/fl mice at 10 wk of age. n=13 Chmp5fl/fl and 12 Dmp1Cre;Chmp5fl/fl mice. Scale bar, 1 mm. (E) H&E histology showing bone expansion at the endosteum (arrows) in Dmp1Cre;Chmp5fl/fl mice. The left images show the midshaft and the right images show the metaphysis of the femur bone. Images are representative of three mice per group. Scale bars, 0.5 mm. Data are mean ± s.d.; two-tailed unpaired Student’s t-test.
-
Figure 1—figure supplement 1—source data 1
For Figure 1—figure supplement 1D, Data of whole femur thickness (mm) in Dmp1Cre;Chmp5fl/fl versus Chmp5fl/fl mice at 10 wk of age.
- https://cdn.elifesciences.org/articles/101984/elife-101984-fig1-figsupp1-data1-v1.xlsx
Figure 2 with 1 supplement
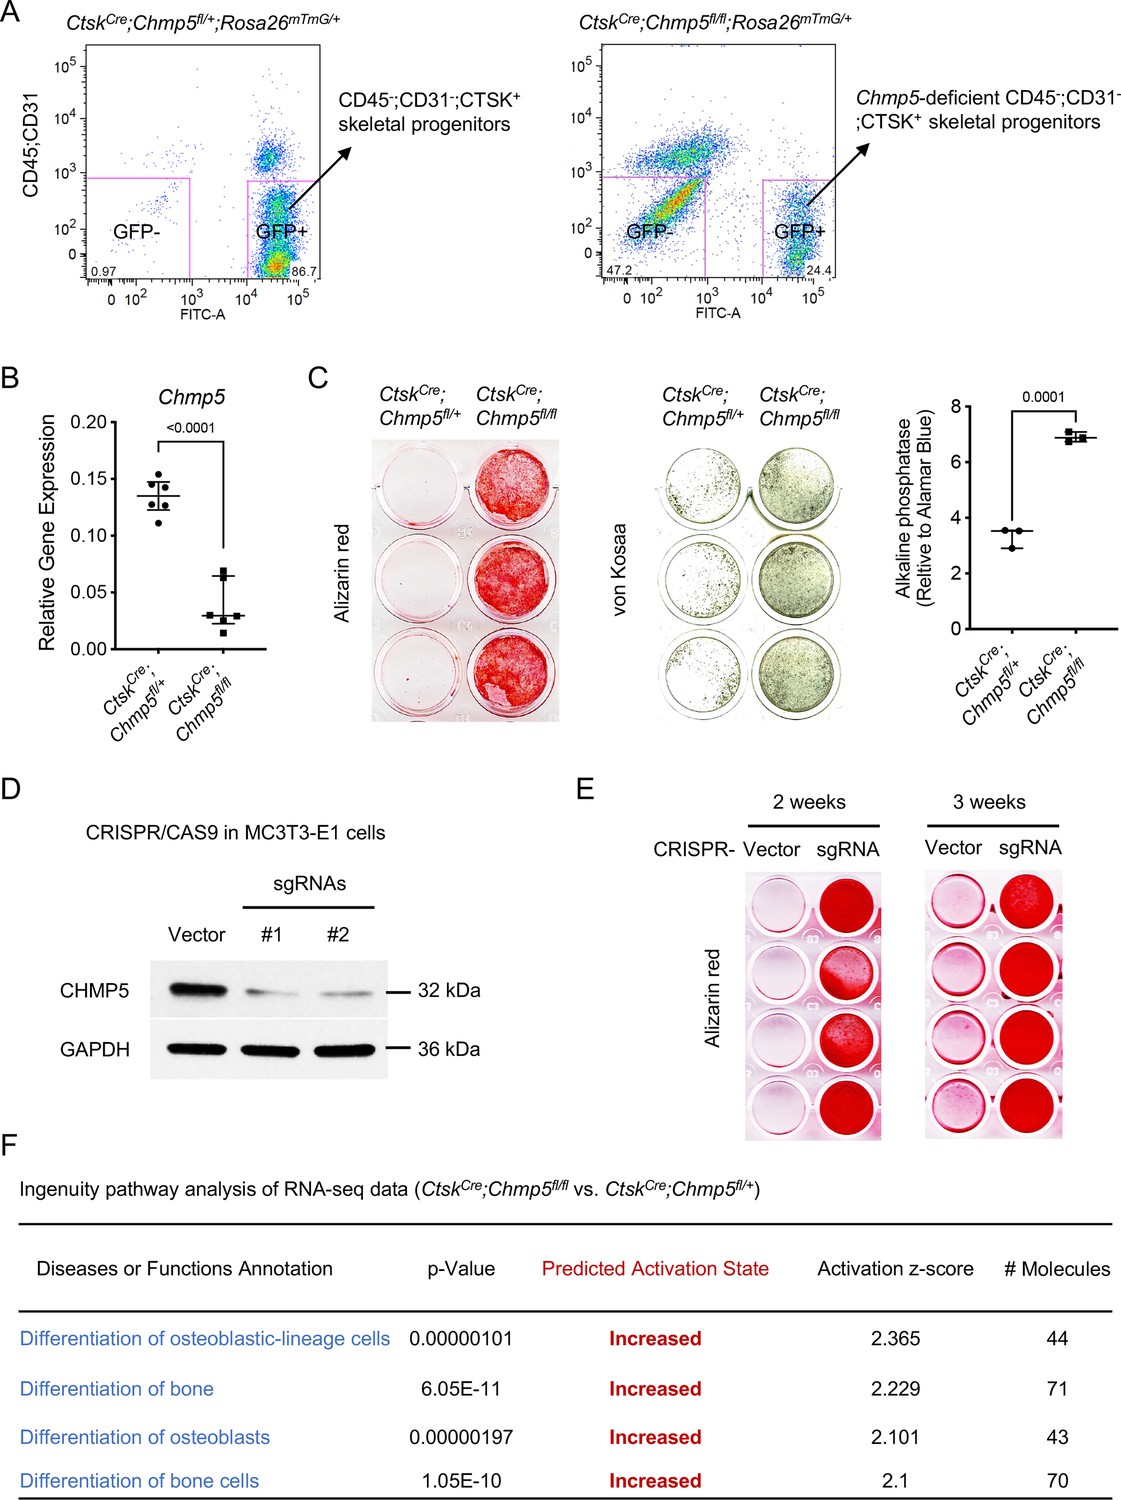
Charged multivesicular body protein 5 (CHMP5) restricts osteogenesis in skeletal progenitor cells.
(A) Flow cytometry showing the strategy for sorting CD45-;CD31-;GFP+ and CD45-;CD31-;GFP- periskeletal progenitors from periskeletal tissues of CtskCre;Chmp5fl/+;Rosa26mTmG/+ and CtskCre;Chmp5fl/fl;Rosa26mTmG/+ mice at 2 wk of age. n=10 mice per group. (B) Quantitative PCR determining the expression of Chmp5 in CtskCre;Chmp5fl/fl relative to CtskCre;Chmp5fl/+ periskeletal progenitors. n=6 mice per group. (C) Alizarin red staining, von Kossa staining, and alkaline phosphatase activity assay determining osteogenesis in CtskCre;Chmp5fl/fl compared to CtskCre;Chmp5fl/+ periskeletal progenitors. n=3 replicates each group, representative results of cells from three different mice per group. (D) Western blot confirming Chmp5 deletion in mouse MC3T3-E1 cells by lentiviral CRISPR/CAS9. (E) Alizarin red staining demonstrating osteogenesis in MC3T3-E1 cells with or without Chmp5 deletion by lentiviral CRISPR/CAS9. n=4 replicates per group, experiments repeated twice for each time point. (F) Ingenuity pathway analysis of RNA-seq data showing increased activity of osteoblast differentiation in CtskCre;Chmp5fl/fl vs. CtskCre;Chmp5fl/+ periskeletal progenitors. All data are mean ± s.d.; two-tailed unpaired Student’s t-test.
-
Figure 2—source data 1
Data of qPCR and alkaline phosphatase activity assay.
- https://cdn.elifesciences.org/articles/101984/elife-101984-fig2-data1-v1.xlsx
-
Figure 2—source data 2
Original files for western blot analysis displayed in Figure 2D.
- https://cdn.elifesciences.org/articles/101984/elife-101984-fig2-data2-v1.zip
-
Figure 2—source data 3
PDF file containing original western blots for Figure 2D, indicating the relevant bands.
- https://cdn.elifesciences.org/articles/101984/elife-101984-fig2-data3-v1.zip
Figure 2—figure supplement 1
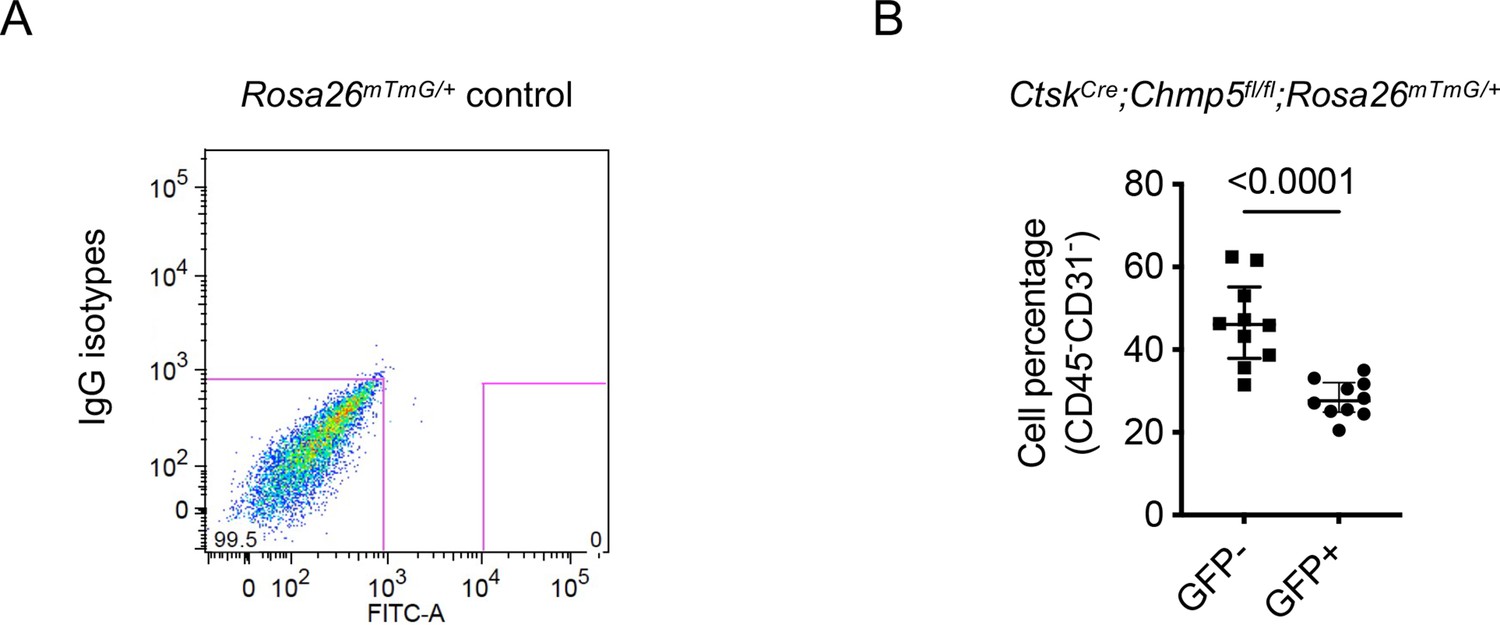
Sorting of CD45-;CD31-;CTSK+ periskeletal progenitors.
(A) Unstained cells from Rosa26mTmG/+ mice as a negative control for sorting CD45-;CD31-;CTSK+ skeletal progenitors. Related to Figure 2A. (B) Quantification of CD45-;CD31-;GFP+ and CD45-;CD31-;GFP- cell population in samples of CtskCre;Chmp5fl/fl;Rosa26mTmG/+ mice. n=10 mice per group.
-
Figure 2—figure supplement 1—source data 1
For Figure 2—figure supplement 1B, Data of quantification of CD45-;CD31-;GFP+ and CD45-;CD31-;GFP- cell population.
- https://cdn.elifesciences.org/articles/101984/elife-101984-fig2-figsupp1-data1-v1.xlsx
Figure 3 with 1 supplement
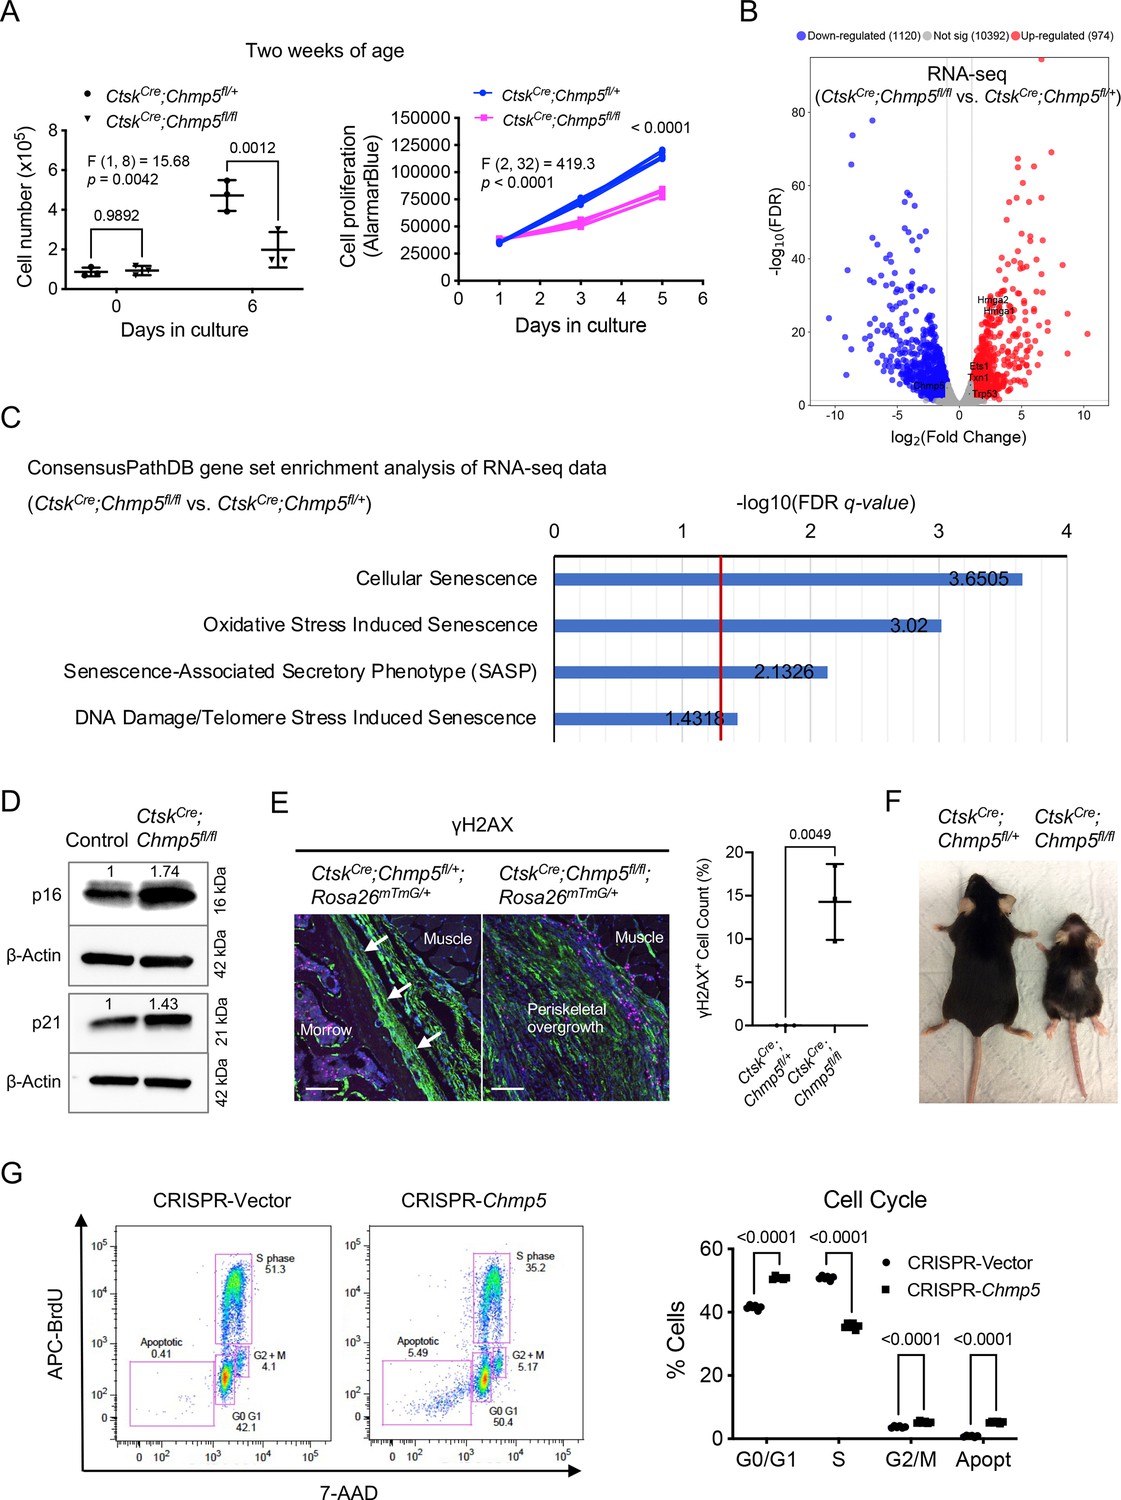
Charged multivesicular body protein 5 (CHMP5) controls skeletal progenitor cell senescence.
(A) Cell number counting and AlamarBlue assay determining cell proliferation in CtskCre;Chmp5fl/fl and CtskCre;Chmp5fl/+ periskeletal progenitors from 2-wk-old animals. n=3 replicates per group per time point; experiments repeated three times using cells from three different mice. (B) Volcano plot of RNA-seq data showing differentially expressed genes in CtskCre;Chmp5fl/fl vs. CtskCre;Chmp5fl/+ periskeletal progenitors. n=3 per group with cells from three different animals. (C) ConsensusPathDB gene set enrichment analysis of RNA-seq data showing positive enrichment of genes in multiple molecular pathways related to cell senescence (Reactome) in CtskCre;Chmp5fl/fl relative to CtskCre;Chmp5fl/+ periskeletal progenitors. (D) Western blot determining the expression of p16 and p21 proteins in CtskCre;Chmp5fl/fl compared to wild-type (control) periskeletal progenitors. The numbers above lanes indicate the intensity of the p16 or p21 band relative to that of Control cells after normalization by β-Actin. Results repeated three times with cells from 3 different animals. (E) Immunostaining of γH2AX and quantification of γH2AX+;GFP+ cells in the periosteum and periskeletal overgrowth in CtskCre;Chmp5fl/+;Rosa26mTmG/+ and CtskCre;Chmp5fl/fl;Rosa26mTmG/+ mice, respectively. n=3 with tissues from three different animals per group. Scale bars, 100 μm; arrows indicating the periosteum. (F) Gross image demonstrating aging-related phenotypes in CtskCre;Chmp5fl/fl compared to CtskCre;Chmp5fl/+ mice at 1 y of age. Images are representative of five animals per group. (G) Cell cycle analysis in ATDC5 cells with or without Chmp5 deletion. n=3 replicates per group, results repeated twice. All data are mean ± s.d.; two-way ANOVA followed by multiple comparisons or two-tailed unpaired Student’s t-test (E).
-
Figure 3—source data 1
Data of cell proliferation, γH2AX + cell counts, and cell cycle.
For Figure 3A, Data of cell number counting and AlamarBlue assay in CtskCre;Chmp5fl/fl and CtskCre;Chmp5fl/+ periskeletal progenitors from 2-wk-old animals; Figure 3E, Data of quantification of γH2AX+;GFP+ cells in the periosteum and periskeletal overgrowth in CtskCre;Chmp5fl/+;Rosa26mTmG/+ and CtskCre;Chmp5fl/fl;Rosa26mTmG/+ mice; Figure 3G, Data of cell cycle analysis in ATDC5 cells with or without Chmp5 deletion.
- https://cdn.elifesciences.org/articles/101984/elife-101984-fig3-data1-v1.xlsx
-
Figure 3—source data 2
Original files for western blot analysis displayed in Figure 3D.
- https://cdn.elifesciences.org/articles/101984/elife-101984-fig3-data2-v1.zip
-
Figure 3—source data 3
PDF file containing original western blots for Figure 3D, indicating the relevant bands.
- https://cdn.elifesciences.org/articles/101984/elife-101984-fig3-data3-v1.zip
Figure 3—figure supplement 1
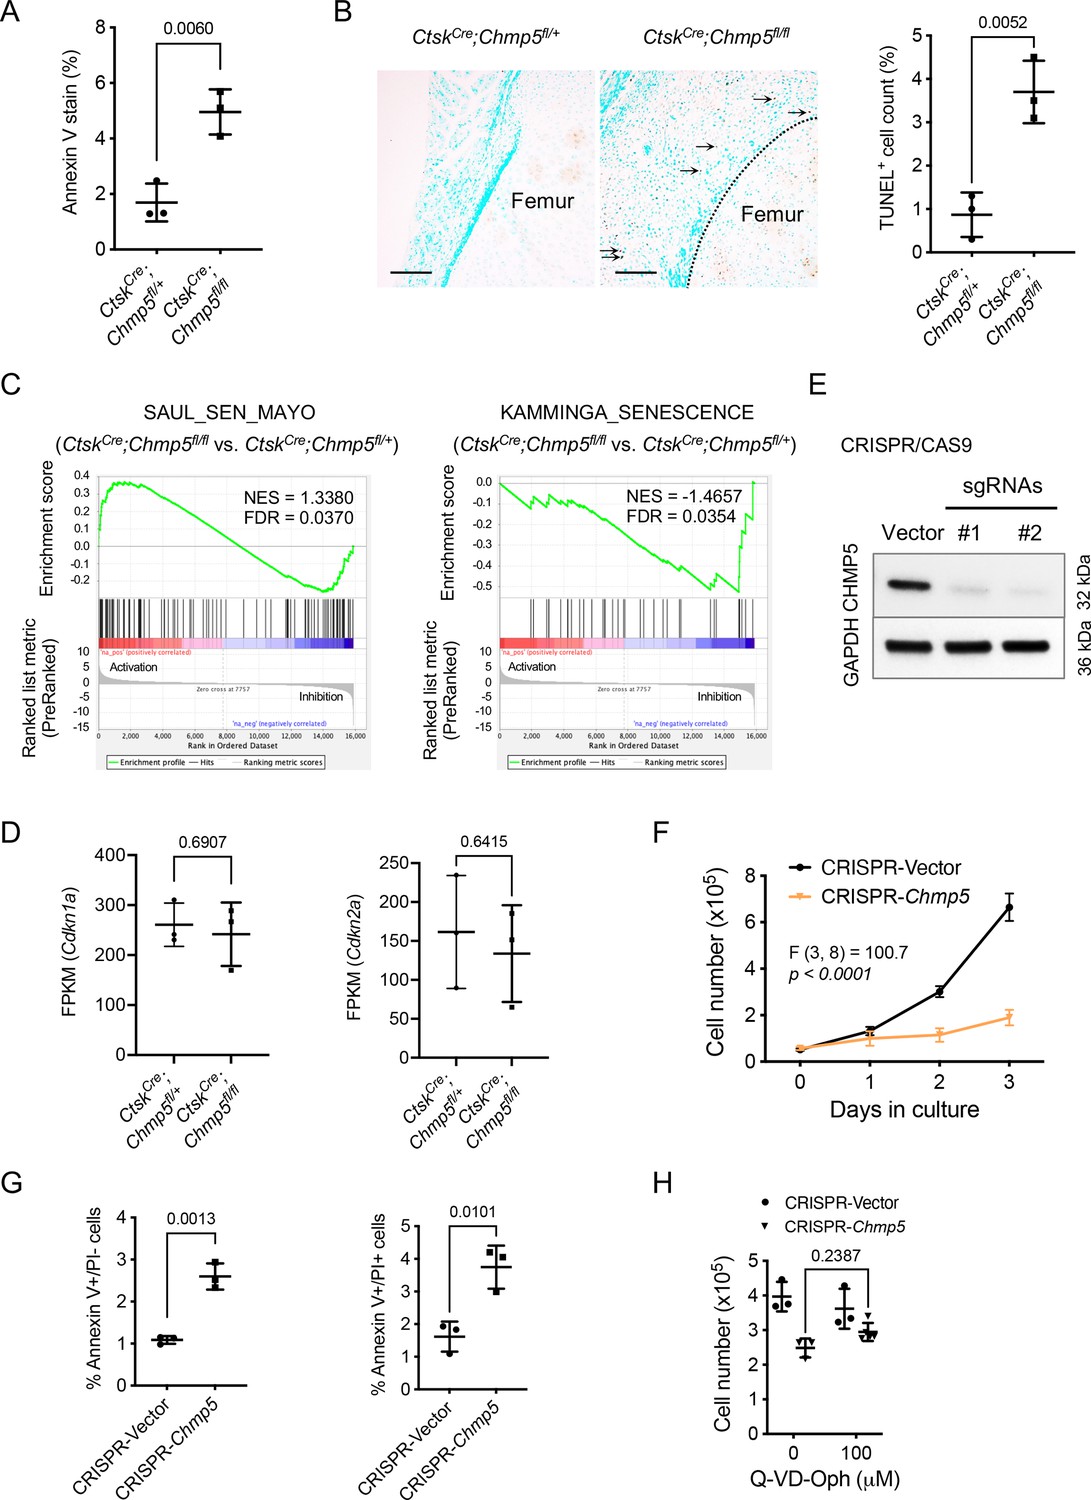
Cell apoptosis is not the main cause of the decreased proliferative rate in charged multivesicular body protein 5 (Chmp5)-deficient skeletal progenitors.
(A) Annexin V stain examining cellular apoptosis in CtskCre;Chmp5fl/fl and CtskCre;Chmp5fl/+ periskeletal progenitors. n=3 replicates each group; repeated twice using cells from two mice per group. (B) Transferase dUTP nick end labeling (TUNEL) staining and quantification of TUNEL+ cells (%) in the periskeletal tissues of CtskCre;Chmp5fl/fl and CtskCre;Chmp5fl/+ mice. Arrows indicating positive cells in periskeletal overgrowth in CtskCre;Chmp5fl/fl mice, dot line representing approximate border between periskeletal overgrowth and bone in the femoral condyle of the knee; n=3 animals per group; scale bars, 100 μm. (C) Gene set enrichment analysis (GSEA) of RNA-seq data showing significant enrichment of SAUL_SEN_MAYO and KAMMINGA_SENESCENCE genesets in CtskCre;Chmp5fl/fl relative to CtskCre;Chmp5fl/+ periskeletal progenitors. (D) Cdkn1a and Cdkn2a mRNA levels in CtskCre;Chmp5fl/fl and CtskCre;Chmp5fl/+ periskeletal progenitors according to RNA-seq data. n=3 per group with cells from three different animals. (E) Western blot confirming deletion of Chmp5 in ATDC5 cells by lentiviral CRISPR/CAS9. (F) Cell number counting determining cell proliferation in ATDC5 cells after deleting Chmp5 by lentiviral CRISPR/CAS9. n=4 replicates per group per time point, experiment repeated three times. (G) Annexin V-PI stain analyzing cellular apoptosis in ATDC5 cells with or without Chmp5 deletion. n=3 replicates for each group, repeated three times. (H) Cell number counting determining cell proliferation in ATDC5 cells with or without Chmp5 deletion after treatment with the pan-caspase inhibitor Q-VD-OPh. n=3 replicates of each group each dose, repeated twice. All data are mean ± s.d.; two-tailed Student’s t-test for comparison of two groups or two-way ANOVA followed by multiple comparisons.
-
Figure 3—figure supplement 1—source data 1
Data on cell apoptosis, gene expression, and cell numbers.
For Figure 3—figure supplement 1A Data of Annexin V stain; Figure 3—figure supplement 1B Data of quantification of TUNEL+ cells (%); Figure 3—figure supplement 1D Gene expression of Cdkn1a and Cdkn2a (FPKM); Figure 3—figure supplement 1F Data of cell number counting in ATDC5 cells after deleting Chmp5 by lentiviral CRISPR/CAS9; Figure 3—figure supplement 1G Data of Annexin V-PI stain in ATDC5 cells with or without Chmp5 deletion; Figure 3—figure supplement 1H Data of cell number counting after treatment with Q-VD-OPh.
- https://cdn.elifesciences.org/articles/101984/elife-101984-fig3-figsupp1-data1-v1.xlsx
-
Figure 3—figure supplement 1—source data 2
Original files for western blot analysis displayed in Figure 3—figure supplement 1E.
- https://cdn.elifesciences.org/articles/101984/elife-101984-fig3-figsupp1-data2-v1.zip
-
Figure 3—figure supplement 1—source data 3
PDF file containing original western blots for Figure 3—figure supplement 1E, indicating the relevant bands.
- https://cdn.elifesciences.org/articles/101984/elife-101984-fig3-figsupp1-data3-v1.zip
Figure 4 with 1 supplement
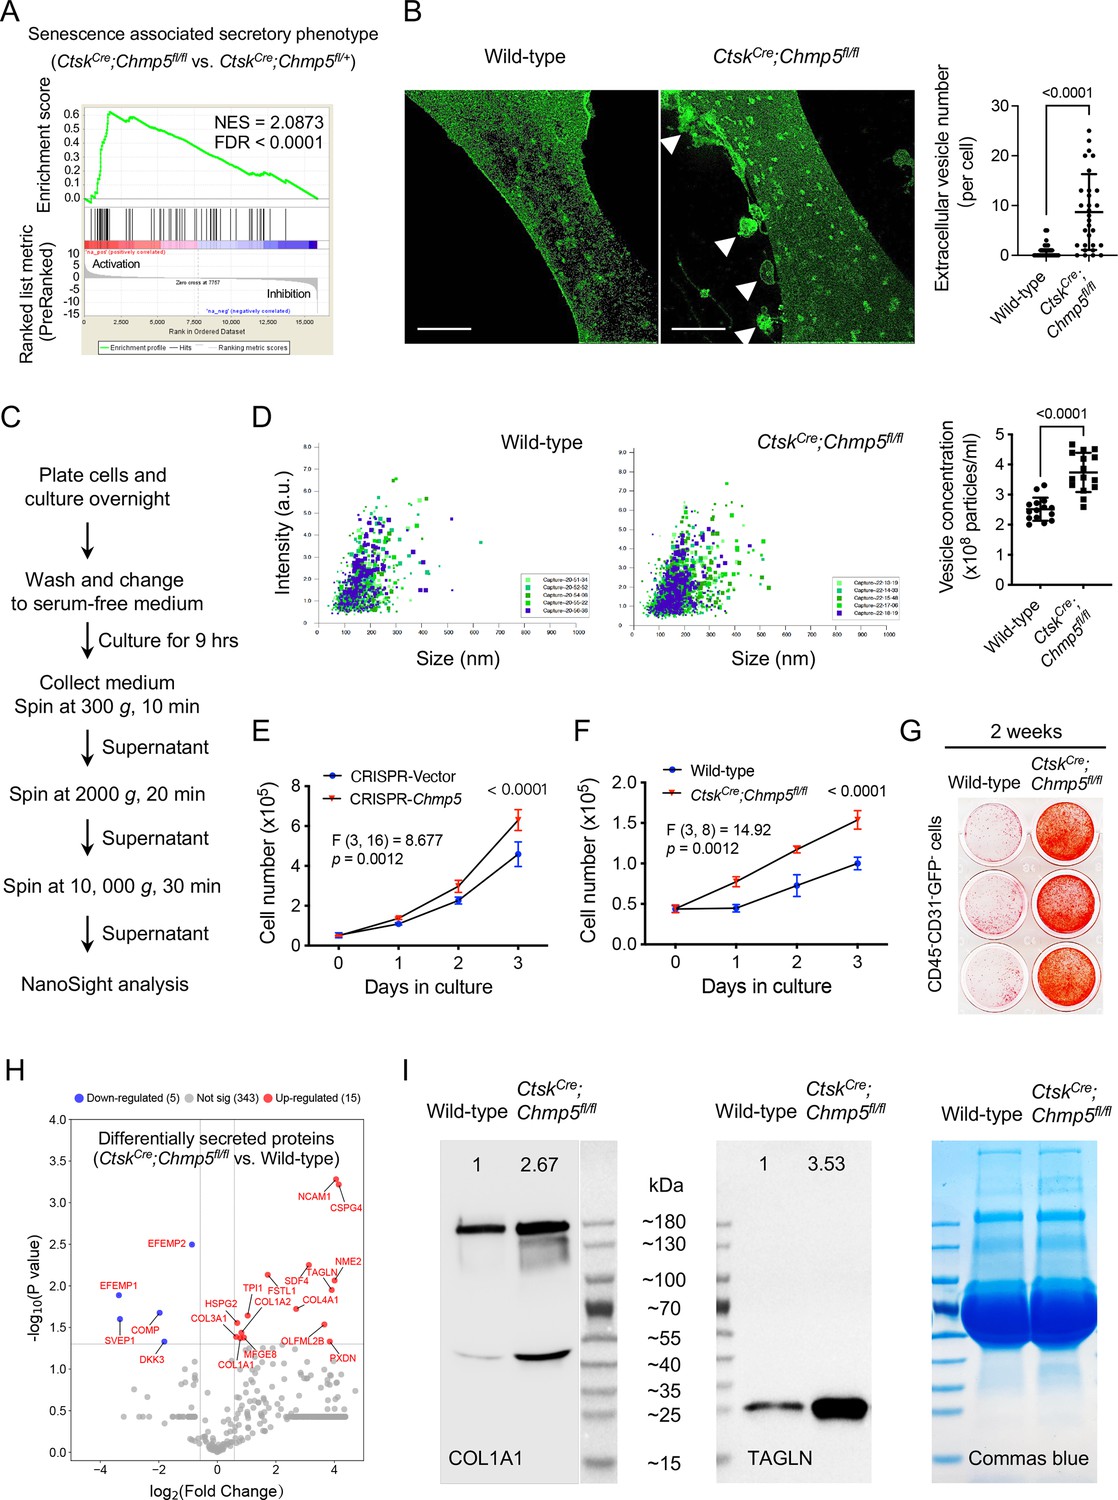
Secretory phenotype of charged multivesicular body protein 5 (Chmp5)-deficient skeletal progenitors.
(A) Gene set enrichment analysis (GSEA) of RNA-seq data showing positive enrichment of genes associated with the molecular pathway of senescence-associated secretory phenotype (Reactome database) in CtskCre;Chmp5fl/fl relative to CtskCre;Chmp5fl/+ periskeletal progenitors. (B) Confocal images showing and quantifying extracellular vesicles (arrowheads) around CtskCre;Chmp5fl/fl periskeletal progenitors. Images are representative of 30 cells from three animals per group. Scale bars, 10 μm. (C and D) Nanoparticle tracking analysis of extracellular vesicles in culture medium of CtskCre;Chmp5fl/fl and wild-type periskeletal progenitors. Data pooled from three replicates per group, five reads for each; repeated twice using cells from two mice per group. (E) Cell number counting determining cell proliferation in ATDC5 cells treated with culture supernatant from Chmp5-deficient or Chmp5-sufficient cells. n=3 per group per time point, repeated twice. (F and G) Cell number counting and alizarin red staining examining cell proliferation (F) and osteogenesis (G) in neighboring CD45-;CD31-;GFP- progenitors sorted from periskeletal tissues of CtskCre;Chmp5fl/fl;Rosa26mTmG/+ or CtskCre;Rosa26mTmG/+ mice. n=3 replicates per group per time point, repeated three times using cells from three different animals. (H) Volcano plot showing differentially secreted protein in supernatants of CtskCre;Chmp5fl/fl vs. wild-type periskeletal progenitors analyzed by Nano LC-MS/MS. n=3 with cells from three different animals per group. (I) Western blot verifying the increase in COL1A1 and TAGLN proteins in supernatants of CtskCre;Chmp5fl/fl relative to wild-type periskeletal progenitors. Commas blue stain as the loading control. Results repeated three times using cells from three different mice in each group. All data are mean ± s.d.; two-tailed unpaired Student’s t-test for comparison of two groups or two-way ANOVA followed by multiple comparisons.
-
Figure 4—source data 1
Data of extracellular vesicle number, concentration, and cell numbers.
For Figure 4B, Data of quantifying extracellular vesicle number (per cell); Figure 4D, Data of extracellular vesicle concentration (× 105 particles/ml); Figure 4E, Cell number counting determining cell proliferation in ATDC5 cells treated with culture supernatant from Chmp5-deficient or Chmp5-sufficient cells; Figure 4F, Cell number counting examining cell proliferation in CD45-;CD31-;GFP- progenitors.
- https://cdn.elifesciences.org/articles/101984/elife-101984-fig4-data1-v1.xlsx
-
Figure 4—source data 2
Original files for western blot analysis displayed in Figure 4I.
- https://cdn.elifesciences.org/articles/101984/elife-101984-fig4-data2-v1.zip
-
Figure 4—source data 3
PDF file containing original western blots for Figure 4I, indicating the relevant bands.
- https://cdn.elifesciences.org/articles/101984/elife-101984-fig4-data3-v1.zip
Figure 4—figure supplement 1
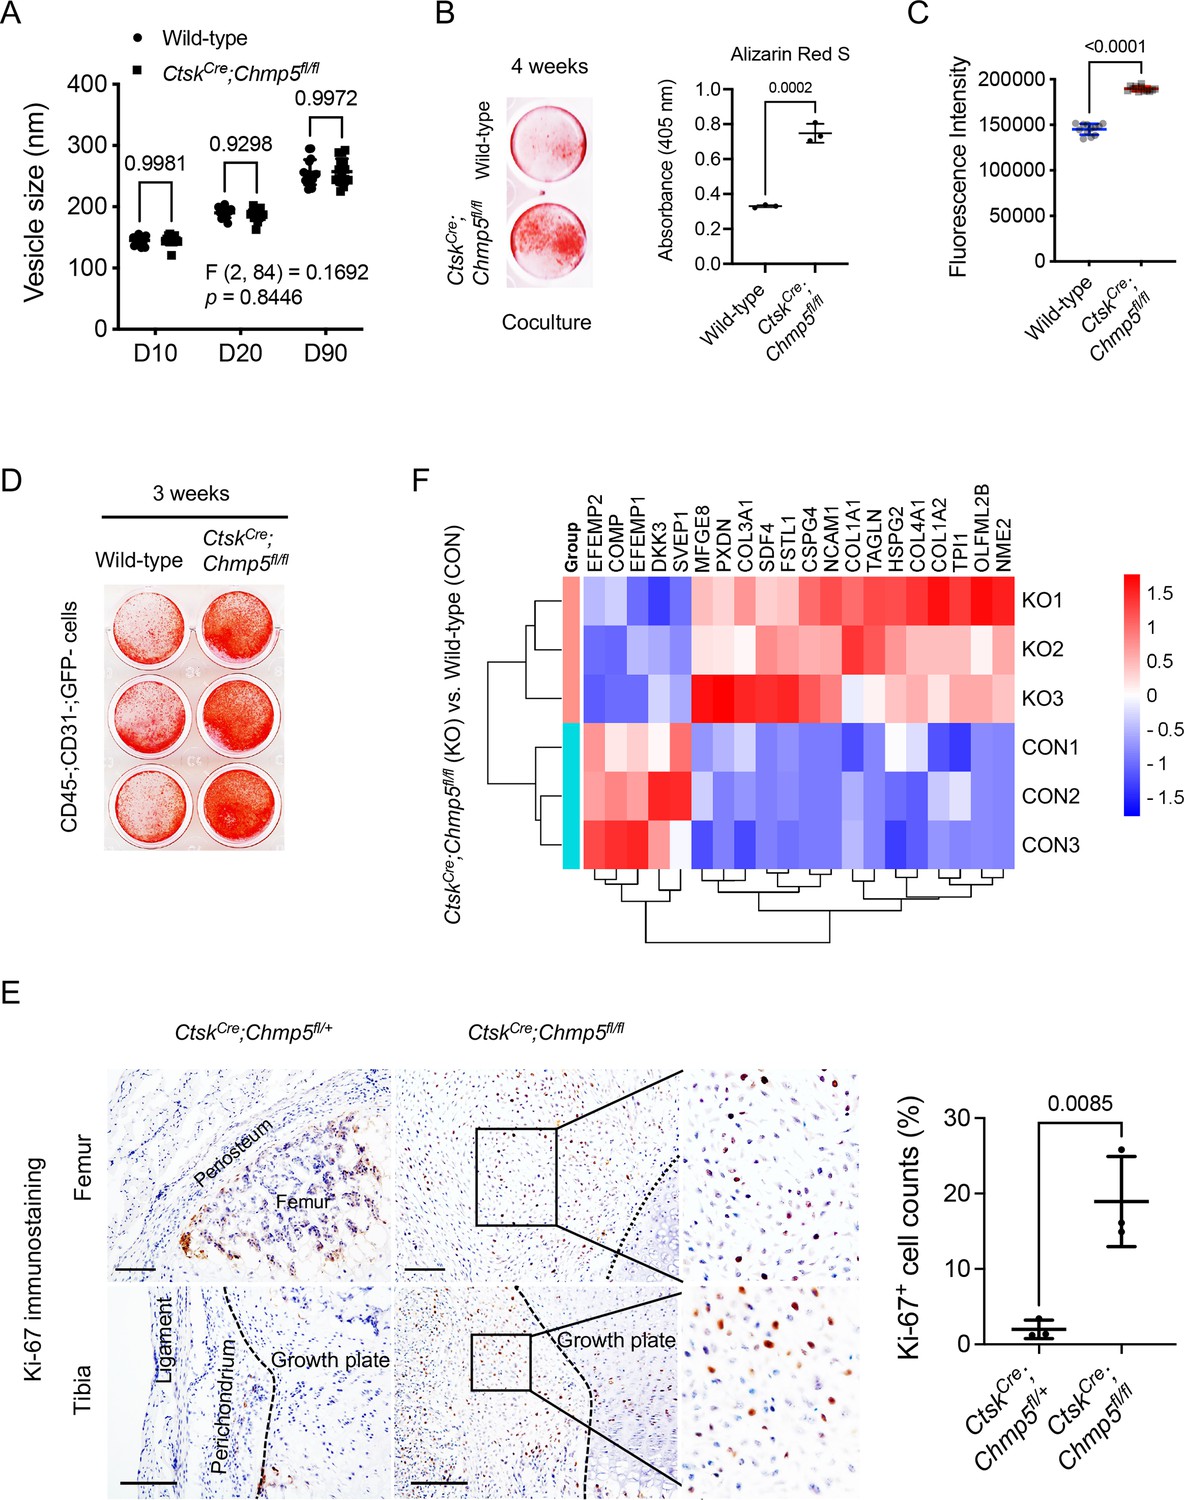
Secretory phenotype of charged multivesicular body protein 5 (Chmp5)-deficient skeletal progenitors.
(A) Nanoparticle tracking analysis showing the size distribution of extracellular vesicles in CtskCre;Chmp5fl/fl and wild-type skeletal progenitors. Data pooled from three replicates, five reads for each; repeated twice using cells from two mice; D10, D50, and D90 indicate percent undersize, for example D50=229 nm representing that 50% of vesicles are 229 nm or smaller. (B) Alizarin red staining and quantification showing osteogenesis in coculture of CtskCre;Chmp5fl/fl and wild-type periskeletal progenitors. n=3 replicates per group, repeated twice using cells from two different animals. (C) AlarmaBlue assay examining cell proliferation in neighboring CD45-;CD31-;GFP- progenitors sorted from periskeletal tissues of CtskCre;Chmp5fl/fl;Rosa26mTmG/+ or CtskCre;Rosa26mTmG/+ mice. n=12 replicates per group per time point, repeated three times using cells from three animals. (D) Alizarin red staining determining osteogenesis in neighboring CD45-;CD31-;GFP- progenitors sorted from periskeletal tissues of CtskCre;Chmp5fl/fl;Rosa26mTmG/+ or CtskCre;Rosa26mTmG/+ mice after induction in osteogenic medium for 3 wk. n=3 replicates per group per time point, repeated three times using cells from three animals. (E) Immunostaining and quantification of cell proliferation marker Ki-67 in the periskeletal tissues around the knee of CtskCre;Chmp5fl/fl and CtskCre;Chmp5fl/+ mice. n=3 animals per group; dot line representing the approximate border between the periskeletal overgrowth and the bone in the femoral condyle; scale bars, 100 μm. (F) Heatmap of LC-MS/MS results showing differentially secreted proteins in supernatants of CtskCre;Chmp5fl/fl relative to wild-type skeletal progenitors. n=3 with cells from three different animals per group for Nano LC-MS/MS analysis. All data are mean ± s.d., two-way ANOVA followed by multiple comparisons or two-tailed unpaired Student’s t-test for two-group comparison.
-
Figure 4—figure supplement 1—source data 1
Data of extracellular vesicle distribution, Alizarin red S quantification, Alamar blue activity, and Ki-67+ cell counts.
For Figure 4—figure supplement 1A, Data of extracellular vesicle size distribution in CtskCre;Chmp5fl/fl and wild-type skeletal progenitors; Figure 4—figure supplement 1B, Data of quantifying Alizarin red S staining; Figure 4—figure supplement 1C, Data of AlamarBlue activity assay in CD45-;CD31-;GFP- progenitors; Figure 4—figure supplement 1E, Data of quantifying cell proliferation marker Ki-67+ cells.
- https://cdn.elifesciences.org/articles/101984/elife-101984-fig4-figsupp1-data1-v1.xlsx
Figure 5 with 1 supplement
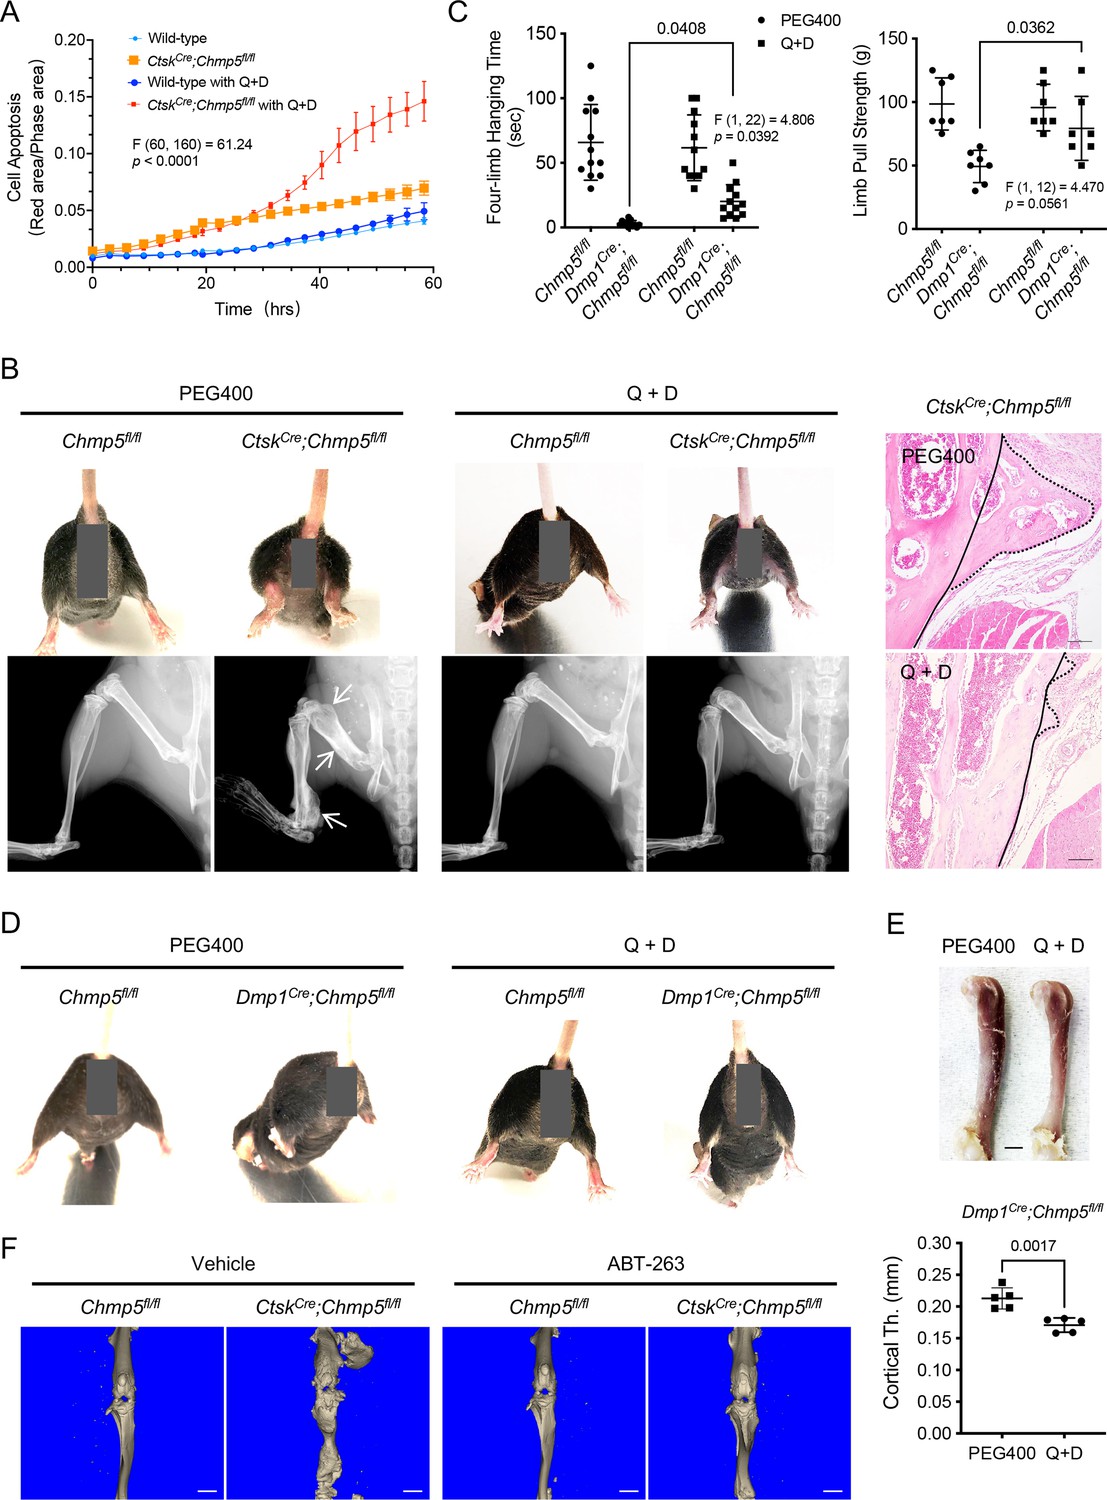
Senolytic treatment mitigates musculoskeletal pathologies in charged multivesicular body protein 5 (Chmp5) conditional knockout mice.
(A) Incucyte live-cell apoptosis analysis of CtskCre;Chmp5fl/fl and wild-type periskeletal progenitors treated with 50 μM Quercetin and 500 nM dasatinib (Q+D) and labeled by Annexin V. n=6 for each group, experiment repeated twice using cells from different animals. (B) Gross images, radiography, and histology (H&E) respectively demonstrating hindlimb abduction and periskeletal bone overgrowth (arrows or dot-line) in CtskCre;Chmp5fl/fl in comparison with Chmp5fl/fl mice after treatment with Q+D or vehicle PEG400 weekly for 7 wk. n=8–10 mice per group. Continuous lines in H&E images indicating an approximate edge of the cortical bone and dot lines indicating the edge of periskeletal overgrowing bones. Scale bars, 100 μm. (C) Four-limb hanging time and forelimb pull strength in Dmp1Cre;Chmp5fl/fl and Chmp5fl/fl mice after treatment with Q+D or the vehicle PEG400 weekly for 16 wk. n=12 animals per group for hanging time test pooled from both genders; n=7 male mice per group for the forelimb pull strength test, similar changes found in both genders. (D) Gross images showing hindlimb abduction in Dmp1Cre;Chmp5fl/fl compared to Chmp5fl/fl mice after treatment with Q+D or the vehicle PEG400. n=12 animals per group. (E) Gross image and Micro-CT analysis demonstrating femur and cortical bone thickness in Dmp1Cre;Chmp5fl/fl mice after treatment with Q+D or the vehicle PEG400. n=5 male mice per group, similar changes found in both genders. Scale bar, 1 mm. (F) Micro-CT images showing periskeletal bone overgrowth in CtskCre;Chmp5fl/fl in comparison with Chmp5fl/fl mice after treatment with ABT-263 or vehicle weekly for 8 wk. n=4 mice per group, Scale bars, 2 mm. All data are mean ± s.d.; two-way ANOVA followed by multiple comparisons or two-tailed unpaired Student’s t-test for comparison of two groups.
-
Figure 5—source data 1
Data on cell apoptosis, skeletal muscle functions, and cortical bone thickness after senolytic treatments.
For Figure 5A, Data of Incucyte live-cell apoptosis analysis in CtskCre;Chmp5fl/fl and wild-type periskeletal progenitors after quercetin and dasatinib (Q+D) treatment; Figure 5C, Data of four-limb hanging time (s) and forelimb pull strength (g) in Dmp1Cre;Chmp5fl/fl and Chmp5fl/fl mice after Q+D treatment; Figure 5E, Data of cortical bone thickness (mm) by micro-CT analysis after Q+D treatment.
- https://cdn.elifesciences.org/articles/101984/elife-101984-fig5-data1-v1.xlsx
Figure 5—figure supplement 1
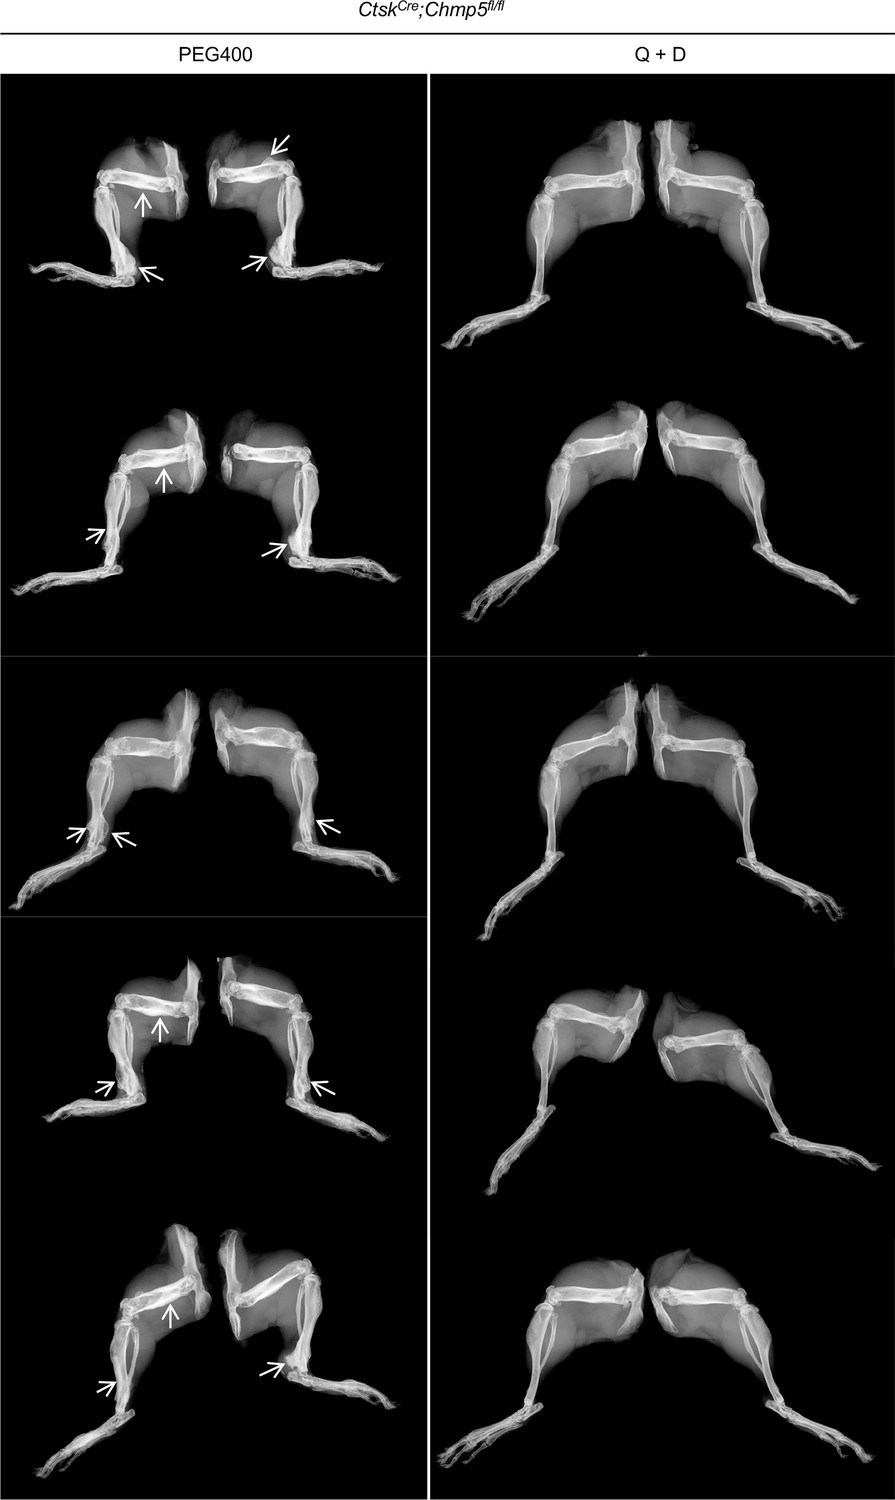
Additional x-ray images of CtskCre;Chmp5fl/fl mice after treatment with Q+D or the vehicle PEG400 for 7 wk.
Arrows indicating periskeletal bone overgrowths.
Figure 6 with 1 supplement
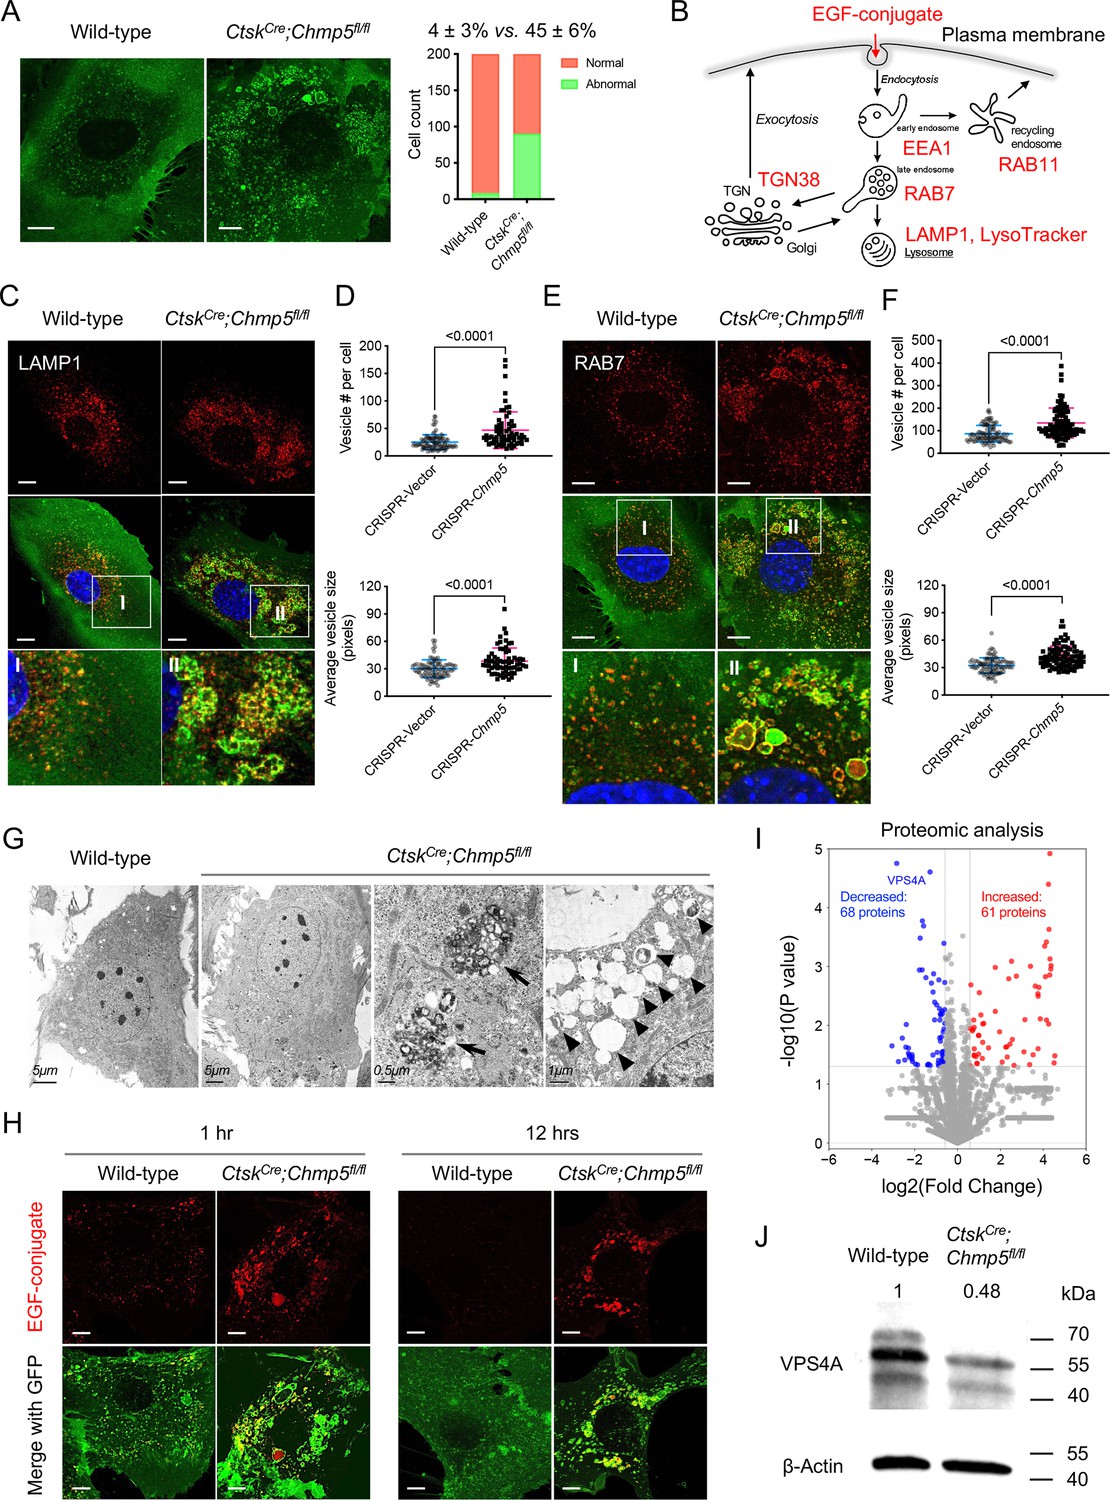
Charged multivesicular body protein 5 (CHMP5) is essential for endolysosomal functions and maintaining VPS4A protein in skeletal progenitors.
(A) Representative confocal images demonstrating abnormally enlarged vesicles in cultured CtskCre;Chmp5fl/fl relative to wild-type periskeletal progenitors. Abnormal cells identified by containing enlarged GFP+ vesicles. n=200 cells from three mice per group. (B) Schematic showing molecular markers utilized to analyze the endocytic pathway. (C) Representative confocal images showing LAMP1 immunostaining in CtskCre;Chmp5fl/fl and wild-type periskeletal progenitors. n=20 cells per group. (D) Quantification of LAMP1+ vesicles in ATDC5 cells with or without Chmp5 depletion. n=93, 66 cells, respectively. (E) Representative confocal images showing RAB7 immunostaining in CtskCre;Chmp5fl/fl and wild-type periskeletal progenitors. n=15 cells per genotype. (F) Quantification of RAB7+ vesicles in ATDC5 cells with or without Chmp5 depletion. n=94, 92 cells, respectively. (G) Transmission electron microscopy showing the accumulation of multivesicular body-like structures (arrows) and lysosome-like structures (arrowheads) in CtskCre;Chmp5fl/fl relative to wild-type periskeletal progenitors. n=30 cells per group. (H) Confocal live cell images demonstrating delayed degradation of the EGF conjugate in CtskCre;Chmp5fl/fl vs. wild-type periskeletal progenitors. n=10 cells each group per time point. (I) Volcano plot of proteomic analysis showing differentially expressed proteins in CtskCre;Chmp5fl/fl vs. wild-type periskeletal progenitors. n=3 with cells from three different animals. (J) Western blot verifying the decrease in VPS4A protein in CtskCre;Chmp5fl/fl vs. wild-type periskeletal progenitors. The numbers above lanes indicate the intensity of the VPS4A band relative to that of wild-type cells after normalization by β-Actin. Results repeated three times with cells from three different mice in each group. All data are mean ± s.d.; Mann-Whitney test for the comparison of the vesicle number and two-tailed unpaired Student’s t-test for the comparison of the vesicle size in (D) and (F). Scale bars, 10 μm except (G) as indicated.
-
Figure 6—source data 1
Data of LAMP1+ or RAB7+ vesicle numbers and average sizes.
- https://cdn.elifesciences.org/articles/101984/elife-101984-fig6-data1-v1.xlsx
-
Figure 6—source data 2
Original files for western blot analysis displayed in Figure 6J.
- https://cdn.elifesciences.org/articles/101984/elife-101984-fig6-data2-v1.zip
-
Figure 6—source data 3
PDF file containing original western blots for Figure 6J, indicating the relevant bands.
- https://cdn.elifesciences.org/articles/101984/elife-101984-fig6-data3-v1.zip
Figure 6—figure supplement 1
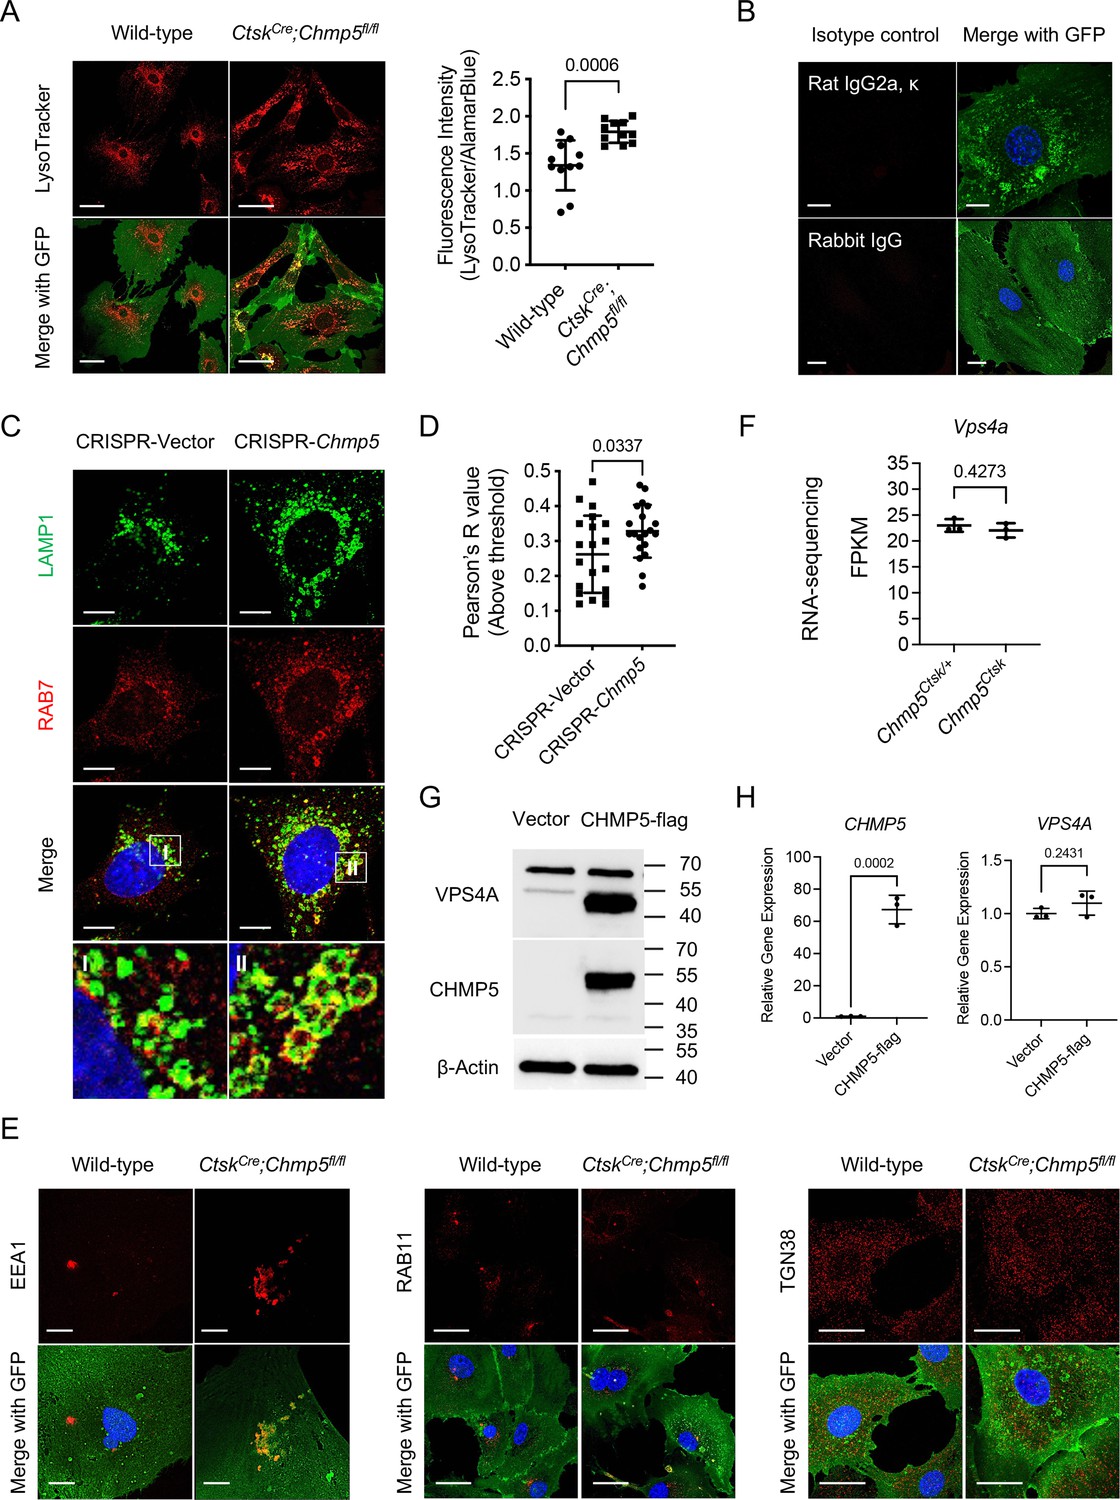
Charged multivesicular body protein 5 (CHMP5) is essential for endolysosomal functions and maintaining VPS4A protein in skeletal progenitors.
(A) Representative confocal fluorescence images and quantification of the fluorescence intensity of LysoTracker Red DND-99 in CtskCre;Chmp5fl/fl compared to wild-type periskeletal progenitors. n=11 replicates per group for quantitative analysis; repeated three times using cells from three mice. Scale bars, 50 μm. (B) Isotype controls for immunofluorescence staining. Scale bars, 20 μm. (C) Co-localization of LAMP1 and RAB7 in Chmp5-sufficient or Chmp5-deficient ATDC5 cells. Scale bars, 10 μm. (D) Colocalization analysis of LAMP1 and RAB7 performed by the ImageJ Coloc2 programme and Pearson’s R value (above threshold) shown, n=20 cells per group. (E) Representative confocal images of immunostaining for early endosome marker EEA1, cycling endosome marker RAB11, and trans-Golgi network marker TGN38 in CtskCre;Chmp5fl/fl vs. wild-type periskeletal progenitors. n=30 cells per group. Scale bars, 10 μm (EEA1), 20 μm (RAB11), 25 μm (TGN38). (F) RNA-seq data showing Vps4a mRNA expression in CtskCre;Chmp5fl/fl vs. CtskCre;Chmp5fl/+ periskeletal progenitors. n=3 with cells from three different animals for each group. (G) Western blot showing that CHMP5 and VPS4A protein expression after transfection of CHMP5 or empty vector in HEK-293T cells. Experiments repeated three times with independent cells and transfections at different times. (H) Quantitative PCR showing the expression of CHMP5 and VPS4A mRNA after transfecting CHMP5 or empty vector in HEK-293T cells. n=3 replicates for each group, experiments repeated three times with independent cells and transfections at different times. All data shown as mean ± s.d.; two-tailed unpaired Student’s t-test.
-
Figure 6—figure supplement 1—source data 1
Data of LysoTracker fluorescence intensity, colocalization of LAMP1 and RAB7, and gene expression.
For Figure 6—figure supplement 1A, Data of quantifying LysoTracker Red DND-99 fluorescence intensity; Figure 6—figure supplement 1D, Pearson’s R value (above threshold) of colocalization analysis of LAMP1 and RAB7 by ImageJ Coloc2 programme; Figure 6—figure supplement 1F, Vps4a mRNA expression in CtskCre;Chmp5fl/fl vs. CtskCre;Chmp5fl/+ periskeletal progenitors (FPKM by RNA-seq); Figure 6—figure supplement 1H, Relative gene expression of CHMP5 and VPS4A (2-ΔΔCt).
- https://cdn.elifesciences.org/articles/101984/elife-101984-fig6-figsupp1-data1-v1.xlsx
-
Figure 6—figure supplement 1—source data 2
Original files for western blot analysis displayed in Figure 6—figure supplement 1G.
- https://cdn.elifesciences.org/articles/101984/elife-101984-fig6-figsupp1-data2-v1.zip
-
Figure 6—figure supplement 1—source data 3
PDF file containing original western blots for Figure 6—figure supplement 1G, indicating the relevant bands.
- https://cdn.elifesciences.org/articles/101984/elife-101984-fig6-figsupp1-data3-v1.zip
Figure 7 with 1 supplement
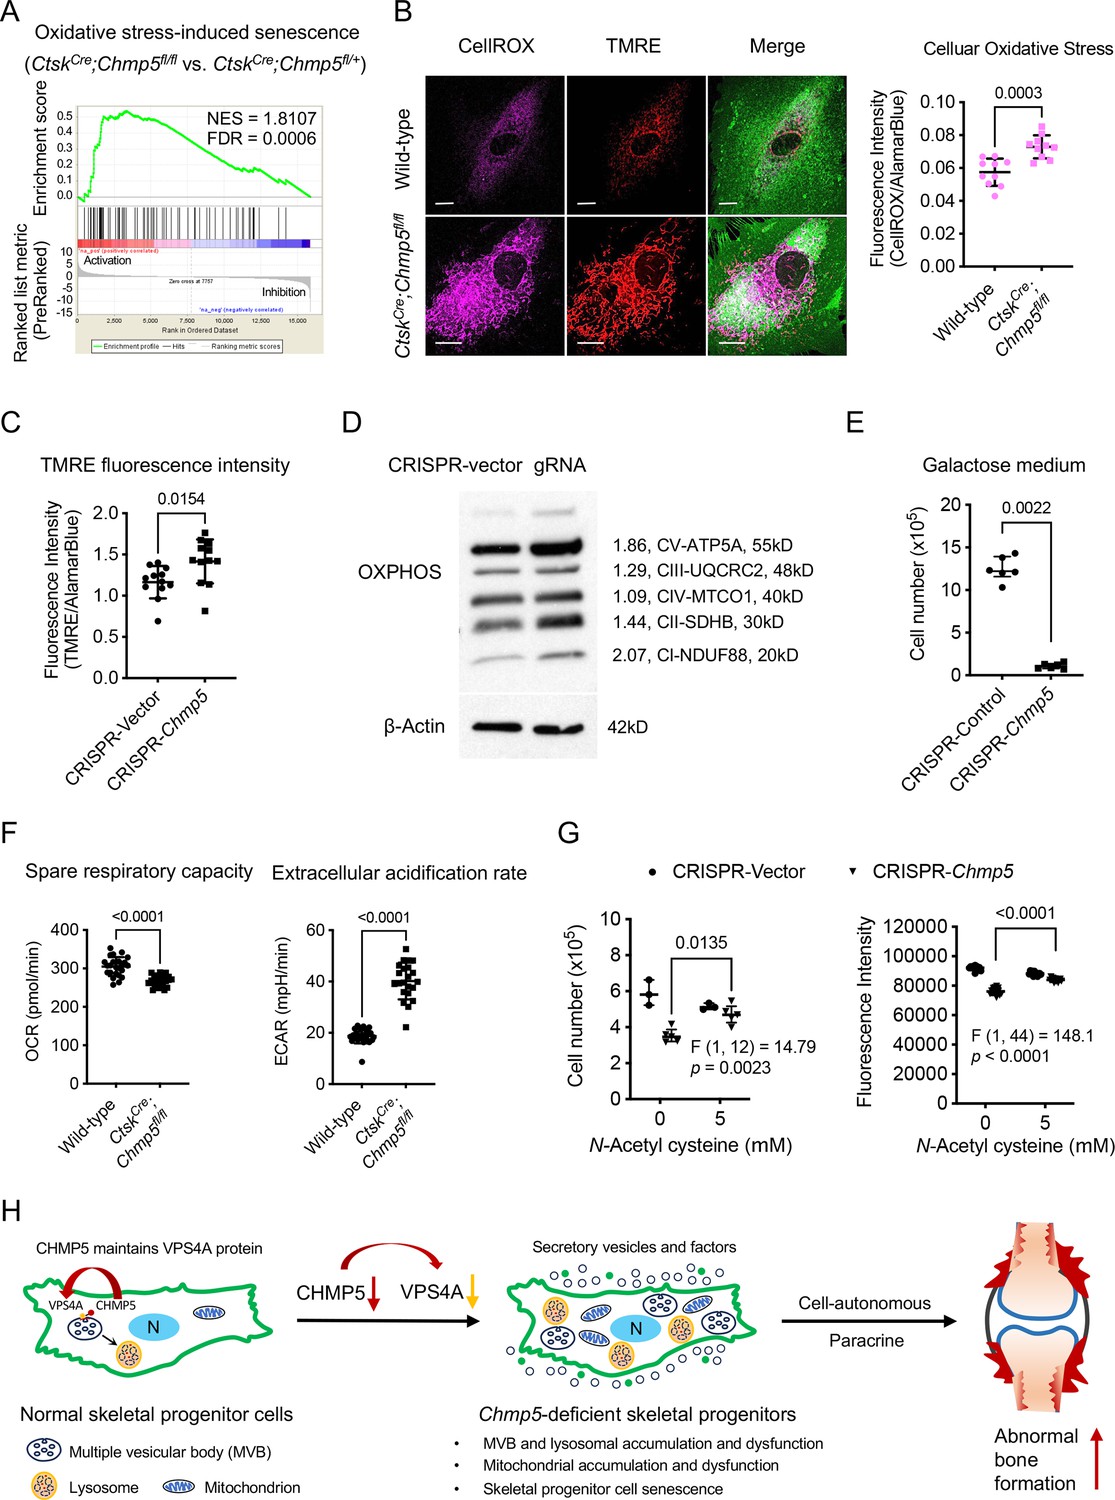
Mitochondrial dysfunction is responsible for cell senescence in charged multivesicular body protein 5 (Chmp5)-deleted skeletal progenitors.
(A) Gene set enrichment analysis (GSEA) of RNA-seq data reporting positive enrichment of genes associated with the molecular pathway of oxidative stress-induced senescence in CtskCre;Chmp5fl/fl relative to CtskCre;Chmp5fl/+ periskeletal progenitors. (B) Confocal fluorescence images showing intracellular ROS (CellROX Deep Red) and mitochondria (TMRE) in CtskCre;Chmp5fl/fl vs. wild-type periskeletal progenitors. Images are representative of 30 cells per group. Scale bars, 15 μm. The graph on the right shows the quantification of the fluorescence intensity of CellROX Deep Red. n=10 each group, results repeated twice. (C) Quantification of TMRE fluorescence intensity in Chmp5-sufficient and Chmp5-deficient ATDC5 cells. n=12 for each group, repeated three times. (D) Western blotting determines the expression of mitochondrial OXPHOS proteins NDUF88, SDHB, MT-CO1, UQCRC2, and ATF5A in Chmp5-deficient compared to Chmp5-sufficient ATDC5 cells. Experiment was repeated twice. (E) Cell number counting to determine cell proliferation in galactose medium. n=6 replicates per group, repeated three times. (F) Seahorse mitochondrial stress test showing mitochondrial respiratory capacity and extracellular acidification rate in CtskCre;Chmp5fl/fl relative to wild-type periskeletal progenitors. Data pooled from cells of three mice, eight replicates for each sample. (G) Cell number counting and AlamarBlue assay determining cell proliferation in ATDC5 cells with or without Chmp5 depletion after treatment with the antioxidant N-Acetyl cysteine. n=3 or 12 each group for cell number counting or AlamarBlue assay, respectively; results repeated three times. (H) Schematic showing the function of CHMP5 in maintaining VPS4A protein and endolysosomal homeostasis and restricting cell senescence and osteogenesis in skeletal progenitors. All data are mean ± s.d.; two-tailed unpaired Student’s t-test, except the Mann-Whitney test in panel (E).
-
Figure 7—source data 1
Data of CellROX and TMRE fluorescence intensity, mitochondrial respiration, and cell proliferation.
For Figure 7B, Data of quantifying CellROX Deep Red fluorescence intensity; Figure 7C, Data of quantifying TMRE fluorescence intensity; Figure 7E, Data of cell number counting; Figure 7F, Data of mitochondrial respiratory capacity and extracellular acidification rate in CtskCre;Chmp5fl/fl relative to wild-type periskeletal progenitors; Figure 7G, Data of cell number counting and AlamarBlue assay after treatment with N-Acetyl cysteine.
- https://cdn.elifesciences.org/articles/101984/elife-101984-fig7-data1-v1.xlsx
-
Figure 7—source data 2
Original files for western blot analysis displayed in Figure 7D.
- https://cdn.elifesciences.org/articles/101984/elife-101984-fig7-data2-v1.zip
-
Figure 7—source data 3
PDF file containing original western blots for Figure 7D, indicating the relevant bands.
- https://cdn.elifesciences.org/articles/101984/elife-101984-fig7-data3-v1.zip
Figure 7—figure supplement 1
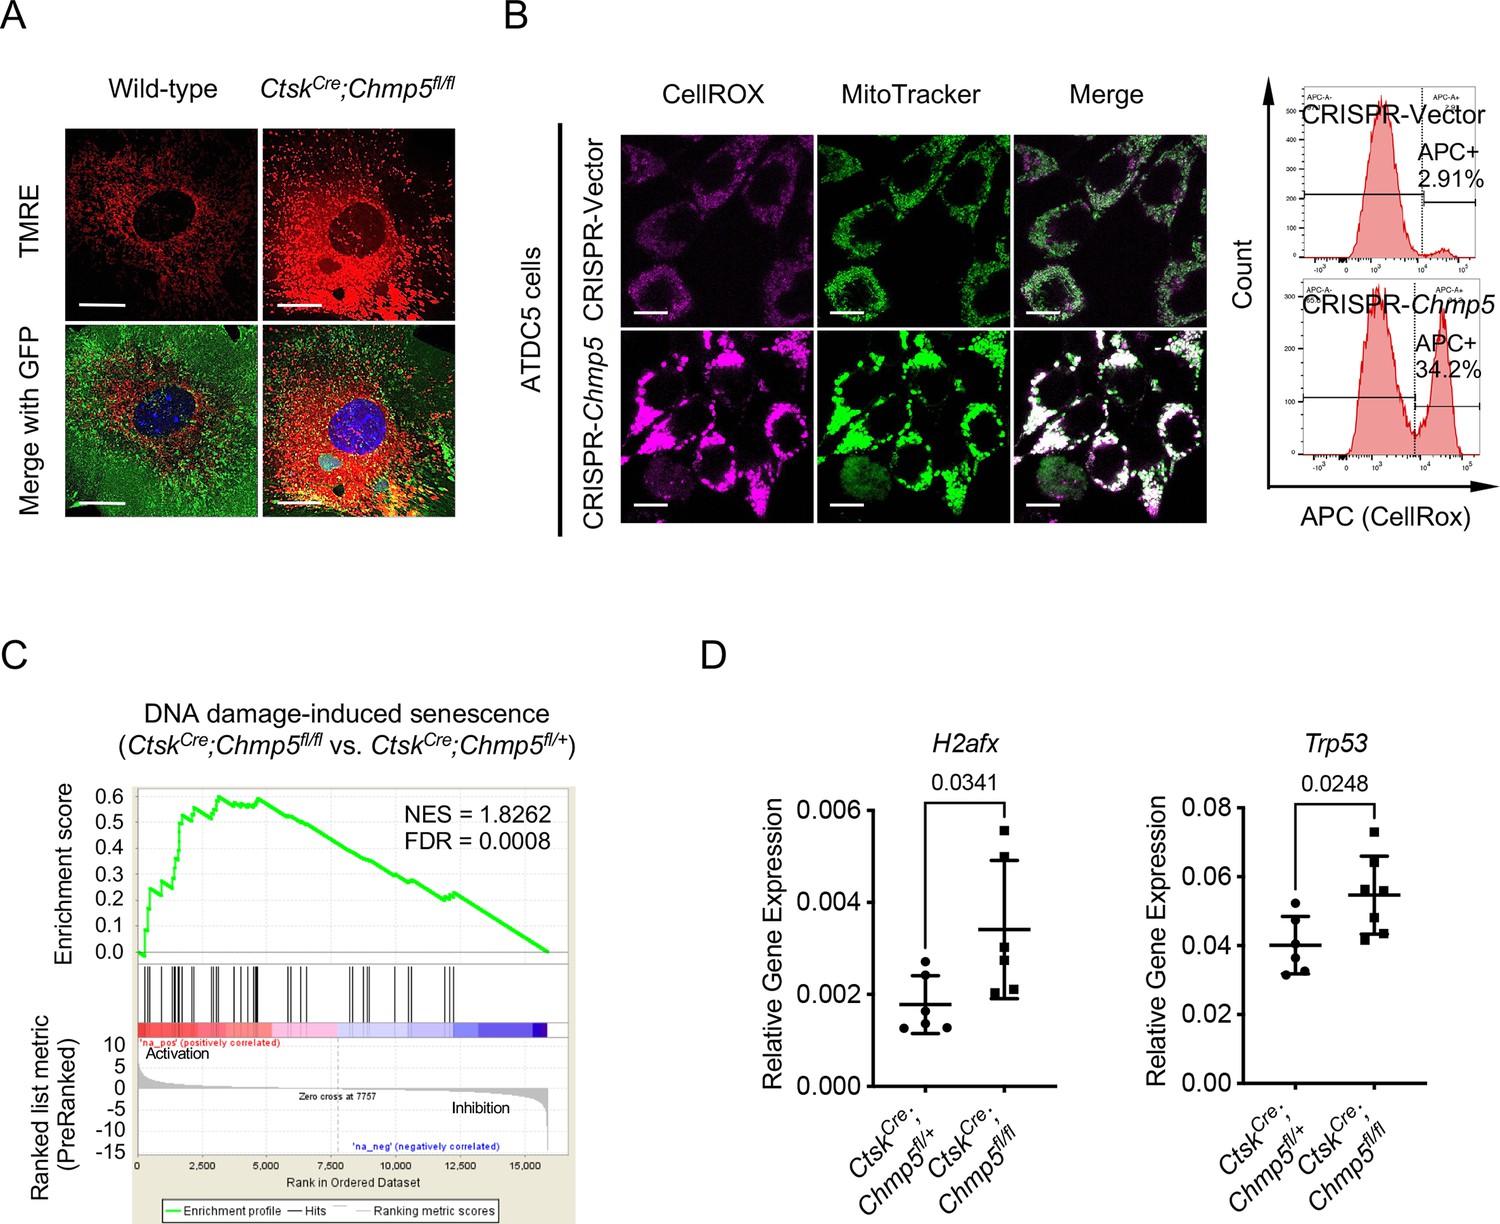
Mitochondrial dysfunction and activation of DNA damage-induced senescence in charged multivesicular body protein 5 (Chmp5)-deficient skeletal progenitors.
(A) Representative TMRE confocal images showing accumulation of mitochondria in CtskCre;Chmp5fl/fl periskeletal progenitors. n=30 cells per group, scale bars, 25 μm. (B) Confocal fluorescence imaging mapping intracellular ROS (CellROX Deep Red) and mitochondria (MitoTracker Green) in ATDC5 cells with or without Chmp5 depletion. n=20 cells for each group; scale bars, 10 μm. The right histogram shows the quantification of CellROX Deep Red in ATDC5 cells by flow cytometry. n=3 per group, experiment repeated twice. (C) Gene set enrichment analysis (GSEA) of RNA-seq data showing positive enrichment of genes associated with the molecular pathway of DNA damage-induced senescence in CtskCre;Chmp5fl/fl relative to CtskCre;Chmp5fl/+ periskeletal progenitors. (D) Quantitative PCR determining expression of H2afx and Trp53 genes in CtskCre;Chmp5fl/fl relative to CtskCre;Chmp5fl/+ periskeletal progenitors. n=6 with cells from different animals per group. Data shown as mean ± s.d.; two-tailed unpaired Student’s t-test.
-
Figure 7—figure supplement 1—source data 1
For Figure 7—figure supplement 1D, Relative gene expression of H2afx and Trp53 (2-ΔCt).
- https://cdn.elifesciences.org/articles/101984/elife-101984-fig7-figsupp1-data1-v1.xlsx
Tables
Key resources table
| Reagent type (species) or resource | Designation | Source or reference | Identifiers | Additional information |
|---|---|---|---|---|
| Genetic reagent (Mus. musculus) | Chmp5tm2.1Gho; Chmp5fl | PMID:26195726 | RRID:MGI:3629214 | A gift from Dr. Sankor Ghosh |
| Genetic reagent (Mus. musculus) | Chmp5-flox | This paper | Generated by CRISPR/Cas9; Targeting exons 4 and 5 of mouse Chmp5 gene | |
| Genetic reagent (Mus. musculus) | Ctsktm1(cre)Ska; CtskCre | PMID:17803905 | RRID:MGI:3764465 | |
| Genetic reagent (Mus. musculus) | B6N.FVB-Tg(Dmp1-cre)1Jqfe/BwdJ; Dmp1-Cre | PMID:17384025 | Strain #:023047 RRID:IMSR_JAX:023047 | |
| Genetic reagent (Mus. musculus) | B6.Cg-Tg(Prrx1-cre)1Cjt/J; Prrx1Cre | PMID:12112875 | Strain #:005584 RRID:IMSR_JAX:005584 | |
| Genetic reagent (Mus. musculus) | B6;SJL-Tg(Col2a1-cre)1Bhr/J; Col2a1-Cre | PMID:10686612 | Strain #:003554 RRID:IMSR_JAX:003554 | |
| Genetic reagent (Mus. musculus) | B6.Cg-Tg(Sp7-tTA,tetO-EGFP/cre)1Amc/J; Osx1-GFP::Cre | PMID:16854976 | Strain #:006361 RRID:IMSR_JAX:006361 | |
| Genetic reagent (Mus. musculus) | Gt(ROSA)26Sortm4(ACTB-tdTomato,-EGFP)Luo; mTmG | PMID:17868096 | Strain #:007676 RRID:IMSR_JAX:007676 | |
| Cell line (M. musculus) | MC3T3-E1 Cell Line (Mouse C57BL/6 calvaria) | ECACC | Cat# 99072810, RRID:CVCL_0409 | Authenticated by osteogenic differentiation; tested negative for mycoplasma |
| Cell line (M. musculus) | ATDC5 cells (mouse 129 teratocarcinoma-derived osteochondral progenitors) | Sigma-Aldrich | Cat#:99072806 RRID:CVCL_3894 | Authenticated by chondrogenic differentiation; tested negative for mycoplasma |
| Cell line (Homo sapiens) | HEK-293T cells | China Center for Type Culture Collection | RRID:CVCL_0063 | Authenticated by STR profiling; tested negative for mycoplasma |
| Transfected construct (mammalian) | lentiCRISPRv2 | Addgene | Cat# 52961 RRID:Addgene_52961 | A gift from Feng Zhang |
| Transfected construct (mammalian) | pMDLg/pRRE | Addgene | Cat# 12251; RRID:Addgene_12251 | A gift from Didier Trono |
| Transfected construct (mammalian) | pRSV-Rev | Addgene | Cat# 12253; RRID:Addgene_12253 | A gift from Didier Trono |
| Transfected construct (mammalian) | pMD2.G | Addgene | Cat# 12259; RRID:Addgene_12259 | A gift from Didier Trono |
| Antibody | APC anti-mouse CD45 (rat monoclonal) | BioLegend | Cat# 147708, RRID:AB_2563540 | FACS (1:200) |
| Antibody | APC anti-mouse CD31 (rat monoclonal) | BioLegend | Cat# 102410, RRID:AB_312905 | FACS (1:200) |
| Antibody | anti-CHMP5 antibody (Rabbit polyclonal) | PMID:26195726 | WB (1:1000) | |
| Antibody | Anti-CHMP5 antibody (mouse monoclonal) | Santa Cruz Biotechnology | Cat# sc-374338 RRID:AB_10989738 | WB (1:1000) |
| Antibody | Anti-p16 INK4A antibody (rabbit monoclonal) | Cell Signaling Technology | Cat# 29271, RRID:AB_3674659 | WB (1:1000) |
| Antibody | Anti-p21 Waf1/Cip1 antibody (rabbit monoclonal) | Cell Signaling Technology | Cat# 37543, RRID:AB_2935811 | WB (1:1000) |
| Antibody | Anti-phospho-Histone H2A.X (Ser139) antibody (rabbit monoclonal) | Cell Signaling Technology | Cat# 9718, RRID:AB_2118009 | IF (1:400) |
| Antibody | Anti-COL1A1 antibody (rabbit monoclonal) | Cell Signaling Technology | Cat# 72026, RRID:AB_2904565 | WB (1:1000) |
| Antibody | Anti-TAGLN antibody (rabbit polyclonal) | Abcam | Cat# ab14106, RRID:AB_443021 | WB (1:1000) |
| Antibody | Anti-Ki67 antibody (rabbit polyclonal) | Abcam | Cat# ab15580, RRID:AB_443209 | IHC (1:200) |
| Antibody | Anti-EEA1 antibody (mouse monoclonal) | BD Biosciences | Cat# 610456, RRID:AB_397829 | IF (1:150) |
| Antibody | Anti-RAB7 antibody (Rabbit monoclonal) | Cell Signaling Technology | Cat# 9367, RRID:AB_1904103 | IF (1:250) |
| Antibody | Anti-RAB11 antibody (Rabbit monoclonal) | Cell Signaling Technology | Cat# 5589, RRID:AB_10693925 | IF (1:250) |
| Antibody | Anti-CD107a antibody (rat monoclonal) | BD Biosciences | Cat# 553792, RRID:AB_2134499 | IF (1:250) |
| Antibody | Anti-TGN38 antibody (rat monoclonal) | R and D Systems | Cat# MAB7944, RRID:AB_2713953 | IF (1:250) |
| Antibody | Anti-VPS4A antibody (mouse monoclonal) | Santa Cruz Biotechnology | Cat# sc-393428, RRID:AB_2773025 | WB (1:1000) |
| Antibody | Total OXPHOS rodent antibody cocktail | Abcam | Cat# ab110413, RRID:AB_2629281 | WB (1:1000) |
| Antibody | Anti-GAPDH antibody (rabbit monoclonal) | Cell Signaling Technology | Cat# 2118, RRID:AB_561053 | WB (1:2000) |
| Antibody | Anti-β-Actin antibody (rabbit monoclonal) | Cell Signaling Technology | Cat# 8457, RRID:AB_10950489 | WB (1:2000) |
| Recombinant DNA reagent | pCMV-SFB-CHMP5-Neo (plasmid) | This paper | Overexpression of human CHMP5 | |
| Recombinant DNA reagent | pCMV-SFB-Neo (plasmid) | This paper | Empty vector | |
| Sequence-based reagent | sgRNAs targeting mouse Chmp5 exon 1 | This paper | sgRNA1: GGCTCCGCCACCTAGCTTGA, sgRNA2: GTTTCGCTTTTCCGAAGAAT | |
| Peptide, recombinant protein | pHrodo Red Epidermal Growth Factor (EGF) Conjugate | ThermoFisher Scientific | Cat# P35374 | |
| Commercial assay or kit | TUNEL Assay Kit - HRP-DAB | Abcam | Cat# ab206386 | |
| Commercial assay or kit | Annexin V Apoptosis Detection Kit APC | ThermoFisher Scientific | Cat# 88-8007-72 | |
| Commercial assay or kit | APC BrdU Flow Kit | BD Bioscience | Cat# 552598 | |
| Commercial assay or kit | Seahorse XF Cell Mito Stress Test Kit | Agilent | Cat# 103015–100 | |
| Chemical compound, drug | InSolution Q-VD-OPh, Non-O-methylated | Millipore | Cat# 551476 | 100 μM |
| Chemical compound, drug | Lysotracker Red DND-99 | ThermoFisher Scientific | Cat# L7528 | 75 nM |
| Chemical compound, drug | MitoTracker Green FM | ThermoFisher Scientific | Cat# M7514 | 200 nM |
| Chemical compound, drug | CellROX Deep Red Reagent | ThermoFisher Scientific | Cat# C10422 | 5 μM |
| Chemical compound, drug | N-Acetyl-L-cysteine | Sigma-Aldrich | Cat# A7250 | 5 mM |
| Chemical compound, drug | Quercetin | Sigma-Aldrich | Cat# Q4951 | Cell (50 μM), Animal (50 µg/g body weight) |
| Chemical compound, drug | Dasatinib | Sigma-Aldrich | Cat# CDS023389 | Cell (500 nM), Animal (5 µg/g body weight) |
| Chemical compound, drug | Navitoclax (ABT-263) | Selleck | Cat# S1001 | 10 ug/g body weight |
| Software, algorithm | Bowtie 2 | PMID:22388286 | RRID:SCR_016368 | Version 2.2.6 |
| Software, algorithm | Systems Transcriptional Activity Reconstruction (STAR) | PMID:23104886 | RRID:SCR_005622 | Version 2.5.3 |
| Software, algorithm | Cuffdiff | PMID:23222703 | RRID:SCR_001647 | Version 2.2.1 |
| Software, algorithm | Ingenuity Pathway Analysis | Qiagen | RRID:SCR_008653 | |
| Software, algorithm | PANTHER | http://www.pantherdb.org/ | RRID:SCR_004869 | Version 14.1 |
| Software, algorithm | Gene Set Enrichment Analysis (GSEA) | http://www.broadinstitute.org/gsea/ | RRID:SCR_003199 | Version 4.3.3 |
| Software, algorithm | ConsensusPathDB | http://cpdb.molgen.mpg.de | RRID:SCR_002231 | Version 14.10.2021 |
| Software, algorithm | MaxQuant | http://www.biochem.mpg.de/5111795/maxquant | RRID:SCR_014485 | Version 1.6.2.10 |
| Software, algorithm | Fiji | PMID:22743772 | RRID:SCR_002285 | Version 2.16.0 |
| Software, algorithm | Flowjo | BD Biosciences | RRID:SCR_008520 | Version 10.10.0 |
| Software, algorithm | GraphPad Prism | GraphPad Prism (https://graphpad.com) | RRID:SCR_015807 | Version 10.1.1 |
Additional files
Download links
A two-part list of links to download the article, or parts of the article, in various formats.
Downloads (link to download the article as PDF)
Open citations (links to open the citations from this article in various online reference manager services)
Cite this article (links to download the citations from this article in formats compatible with various reference manager tools)
The ESCRT protein CHMP5 restricts bone formation by controlling endolysosome-mitochondrion-mediated cell senescence
eLife 13:RP101984.
https://doi.org/10.7554/eLife.101984.3


