Sphingosine-1-phosphate signaling regulates the ability of Müller glia to become neurogenic, proliferating progenitor-like cells
- Department of Neuroscience, College of Medicine, The Ohio State University, United States
- Neuroscience Graduate Program, The Ohio State University, United States
- Campus Chemical Instrument Center, Mass Spectrometry and Proteomics Facility, The Ohio State University, United States
Figures
Figure 1 with 1 supplement
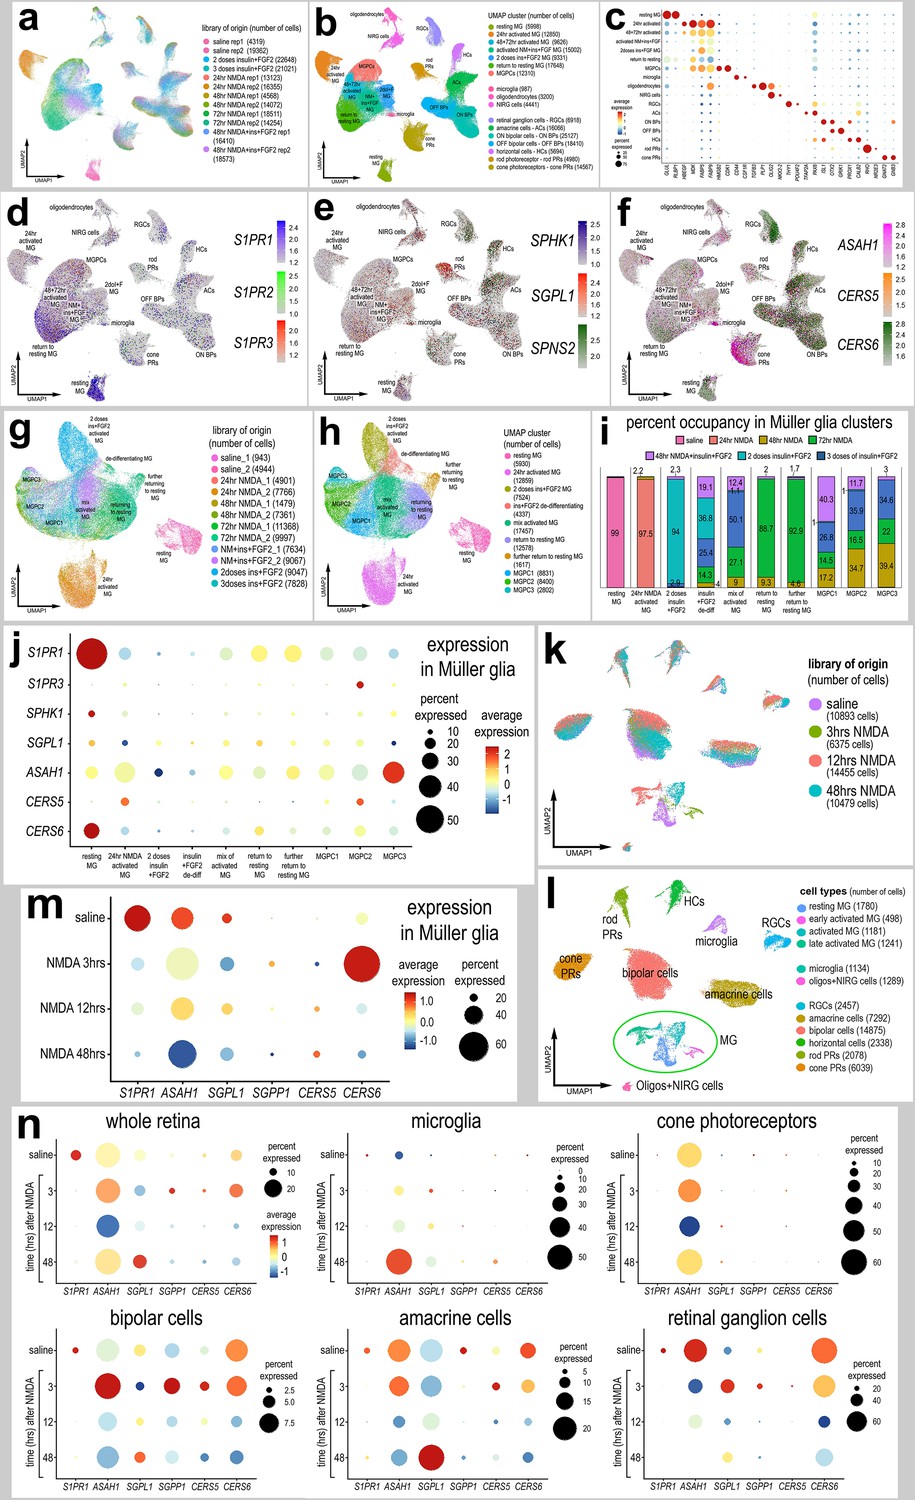
Patterns of expression of S1P-related genes.
scRNA-seq was used to identify patterns of expression of S1P-related factors among retinal cells with the data presented in UMAP (a, b, d–h, k, l) or dot plots (c, j, m, n). Aggregate scRNA-seq libraries were generated for cells from (i) control retinas and retinas 24, 48, and 72 hr after NMDA-treatment, retinas treated with two or three doses of insulin and FGF2, and retinas treated with insulin, FGF2 and NMDA (a–f). MG were bioinformatically isolated and analyzed from the large aggregate library (g–i), and control retinas and retinas 3, 12, and 48 hr after NMDA (k–l). UMAP-ordered cells formed distinct clusters of neuronal cells, resting MG, early activated MG, activated MG, and Müller glia-derived progenitor cells (MGPCs) based on distinct patterns of gene expression (see methods and Figure S1). UMAP heatmap plots illustrate patterns and levels of expression of S1P receptors S1PR1 and S1PR3 (d), S1P metabolism and transport genes SPHK1, SGPL1, and SPNS2 (e), and ceramide metabolism genes ASAH1, CERS5, and CERS6 (f) illustrate levels and patterns of expression across the whole retina. Dot plots illustrate relative levels of expression (heatmap) and percent expression (dot size) in MG, activated MG, and MGPCs (j, m), whole retina, and other cell types (n) in different UMAP clusters. Significance of difference was determined by using a Wilcox rank sum with Bonferoni correction. Abbreviations: MG – Müller glia, NMDA – N-methyl-D-aspartate, UMAP – uniform manifold approximation and projection.
-
Figure 1—source data 1
Statistics for S1P-related genes in aggregate scRNA-seq libraries.
- https://cdn.elifesciences.org/articles/102151/elife-102151-fig1-data1-v1.docx
Figure 1—figure supplement 1

Patterns of expression of genes in resting MG, activated MG, and Müller glia-derived progenitor cells (MGPCs).
Aggregate scRNA-seq libraries were generated for cells from (i) control retinas and retinas 24, 48, and 72 hr after NMDA-treatment, retinas treated with two or three doses of insulin and FGF2, and retinas treated with insulin, FGF2 and NMDA (a–l). UMAP heatmap plots illustrate patterns and levels of expression of S1P receptors S1PR1 (d), S1PR2 (e), and S1PR3 (f), S1P metabolism and transport genes SPHK1 (g), SGPL1 (h), and SPNS2 (i), and ceramide metabolism genes ASAH1 (j), CERS5 (k), and CERS6 (l) illustrate levels and patterns of expression across the whole retina. Aggregate scRNA-seq libraries were generated for cells from (i) control retinas and retinas 3, 12, and 48 hr after NMDA-treatment (m–r). UMAP heatmap plots illustrate patterns and levels of expression of GLUL and RLBP1 in resting MG (o), TGFB2 and PMP2 in activated MG (p), CDK1 and TOP2A in MGPCs (q), and S1PR1 (r). Abbreviations: MG – Müller glia, NMDA – N-methyl-D-aspartate, UMAP – uniform manifold approximation and projection.
Figure 2
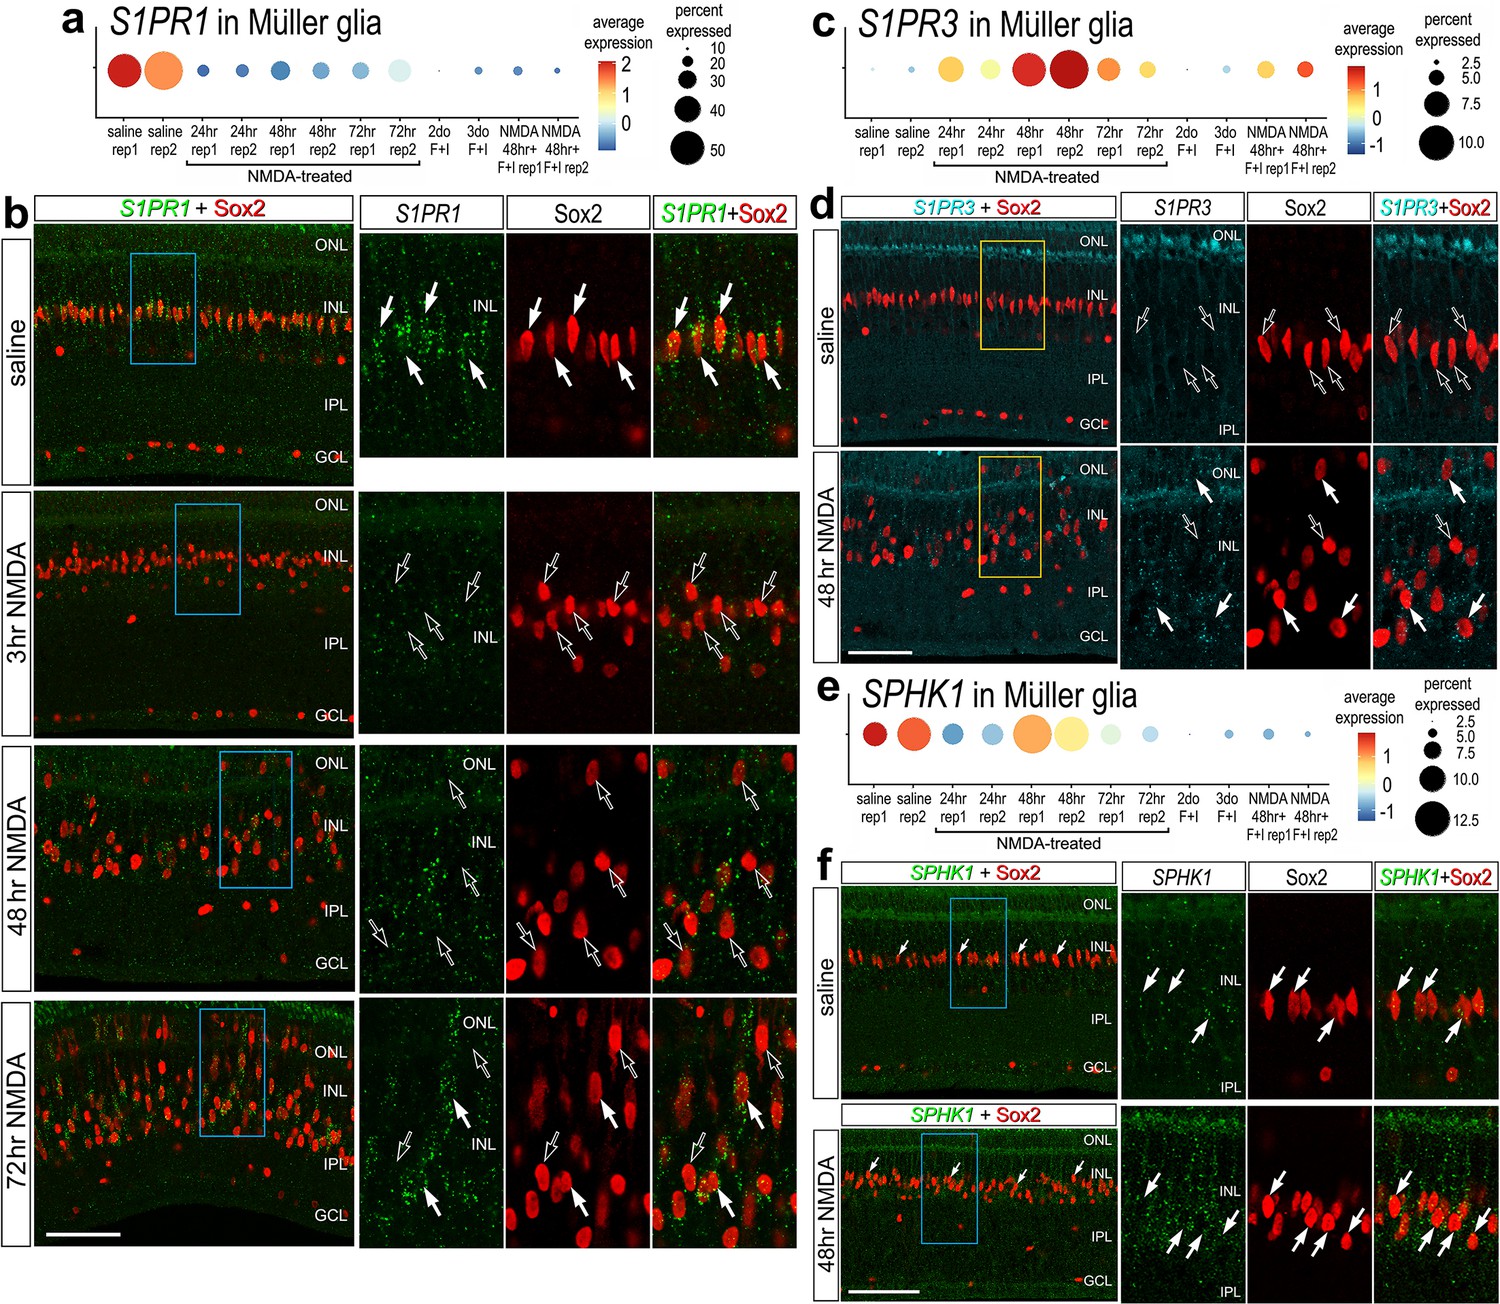
Fluorescence in situ hybridization (FISH) for S1PR1, S1PR3, and SPHK1.
Retinas were obtained from undamaged, saline-treated eyes and eyes injected with NMDA at 3, 48, or 72 hr after treatment. Retinal sections were labeled with antibodies to Sox2 (red) or FISH probes to S1PR1 (green puncta; b), S1PR3 (cyan puncta; d), or SPHK1 (green puncta; f). Dot plots illustrate the average expression (heatmap) and percent expressed (dot size) for S1PR1, S1PR3, and SPHK1 in Müller glia (MG) from different treatments and replicates (rep1 or rep2) (a, c, e). Significance of difference was determined by using a Wilcox rank sum with Bonferoni correction. Hollow arrows indicate MG nuclei labeled for Sox2 alone and solid arrows indicate MG nuclei associated with numerous FISH puncta. Calibration bars in panels b, d ,and f represent 50 µm. Areas indicated by cyan or yellow are enlarged twofold in adjacent panels. Abbreviations: ONL – outer nuclear layer, INL – inner nuclear layer, IPL – inner plexiform layer, GCL – ganglion cell layer, ns – not significant, NMDA – N-methyl-D-aspartate.
Figure 3
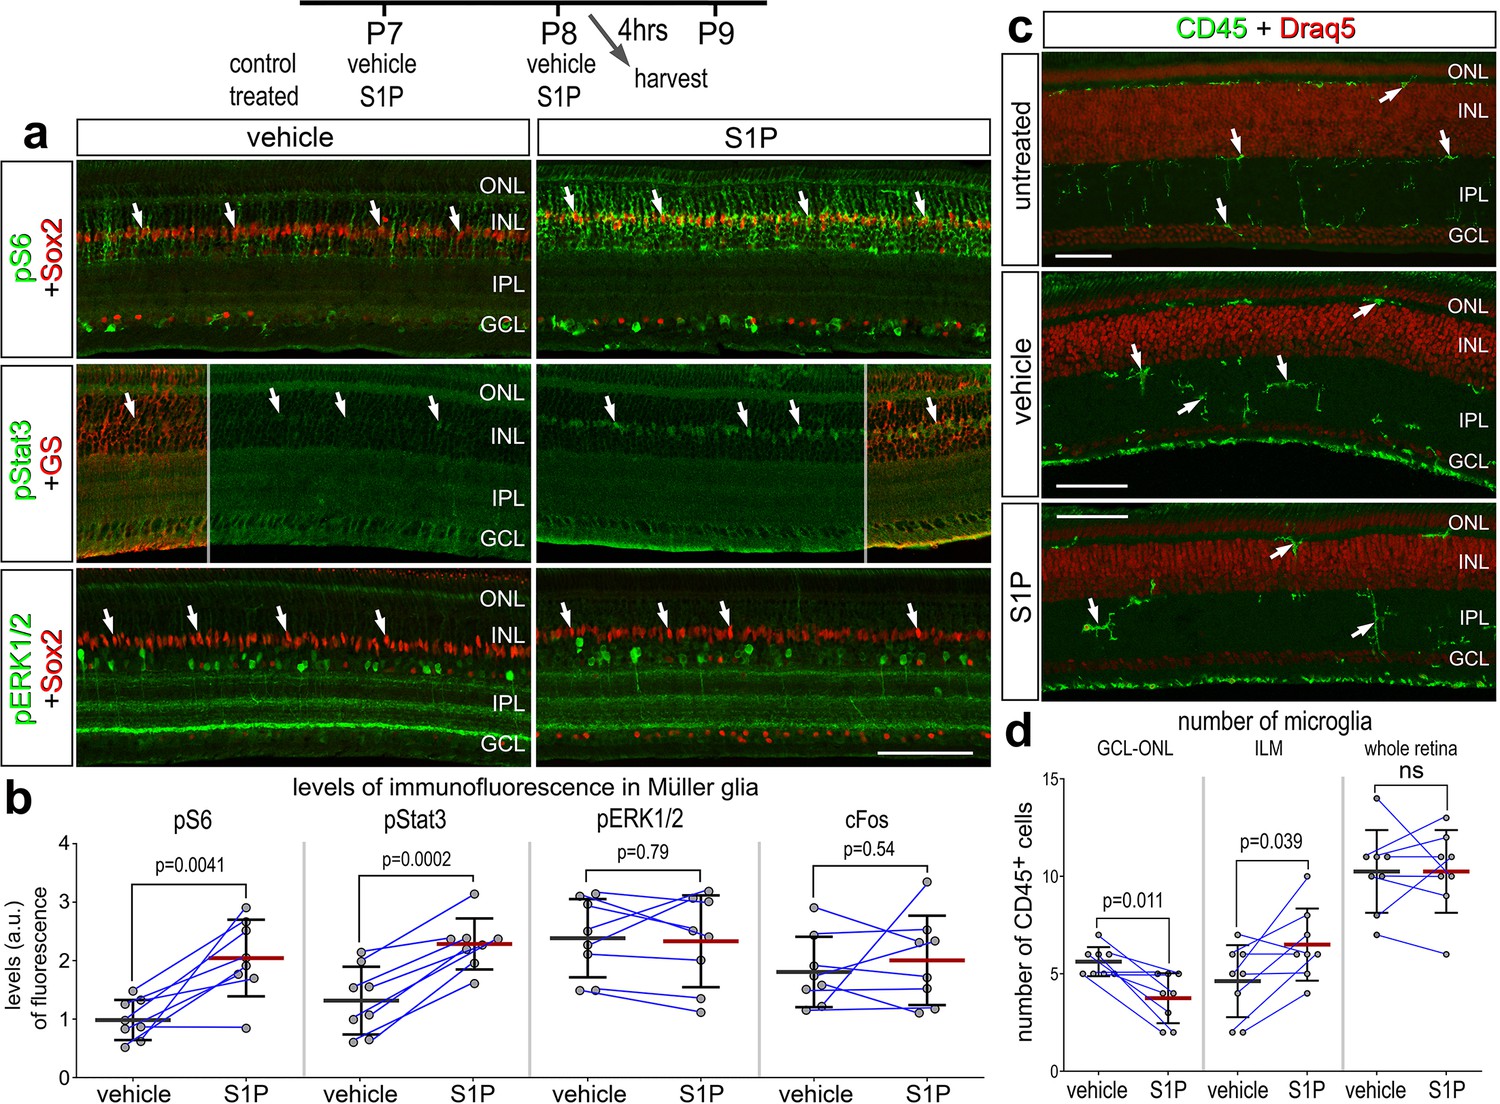
Activation of cell signaling pathways and microglia by S1P.
Retinas were obtained from eyes injected with vehicle or S1P at P7 and P8, and harvested 4 hr after the last injection. Retinal sections were labeled with antibodies to Sox2 (red) and pS6 (green), pStat3 (green), or pERK1/2 (a), or antibodies to CD45 (green) or DNA stain (Draq5; red) (c). Arrows indicate the nuclei of Müller glia (MG). Calibration bars in panels a and c represent 50 µm. Areas indicated by cyan or yellow are enlarged twofold in adjacent panels. The histograms in (b) illustrate the mean (bar ± SD) fluorescence intensity sum for pS6, pStat3, pERK1/2, and cFos in MG. The histograms in (d) illustrate the mean (bar ± SD) numbers of CD45+ microglia in the GCL–ONL, at the INL, or whole retina. Each dot represents one biological replicate and blue lines connect replicates from control and treated retinas from one individual. Significance of difference (p-values) was determined by using a paired t-test. Abbreviations: ONL – outer nuclear layer, INL – inner nuclear layer, IPL – inner plexiform layer, GCL – ganglion cell layer, ns – not significant.
Figure 4 with 4 supplements
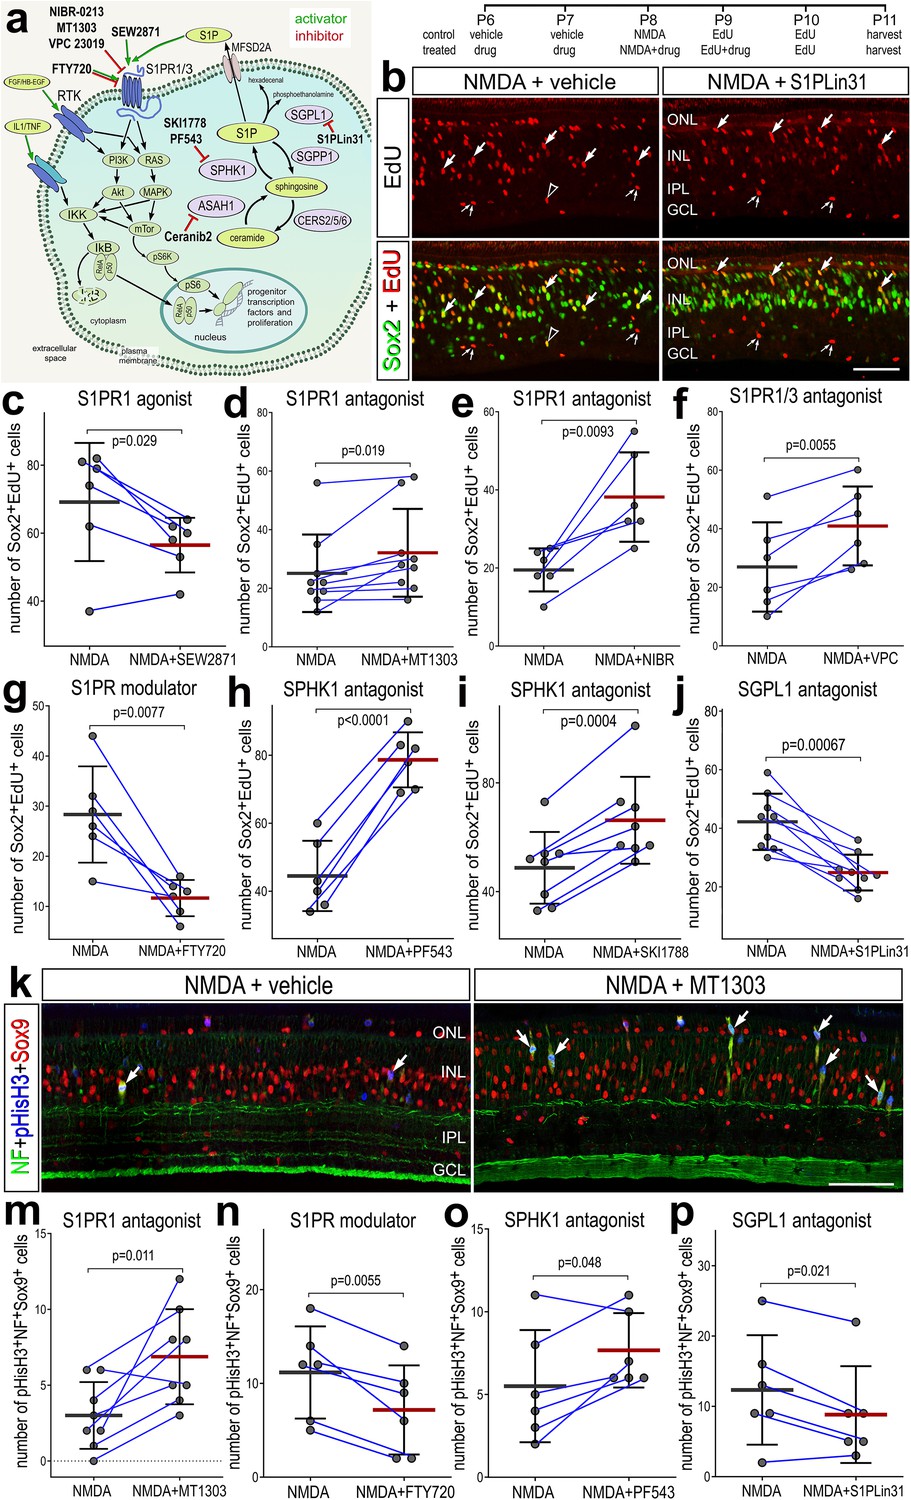
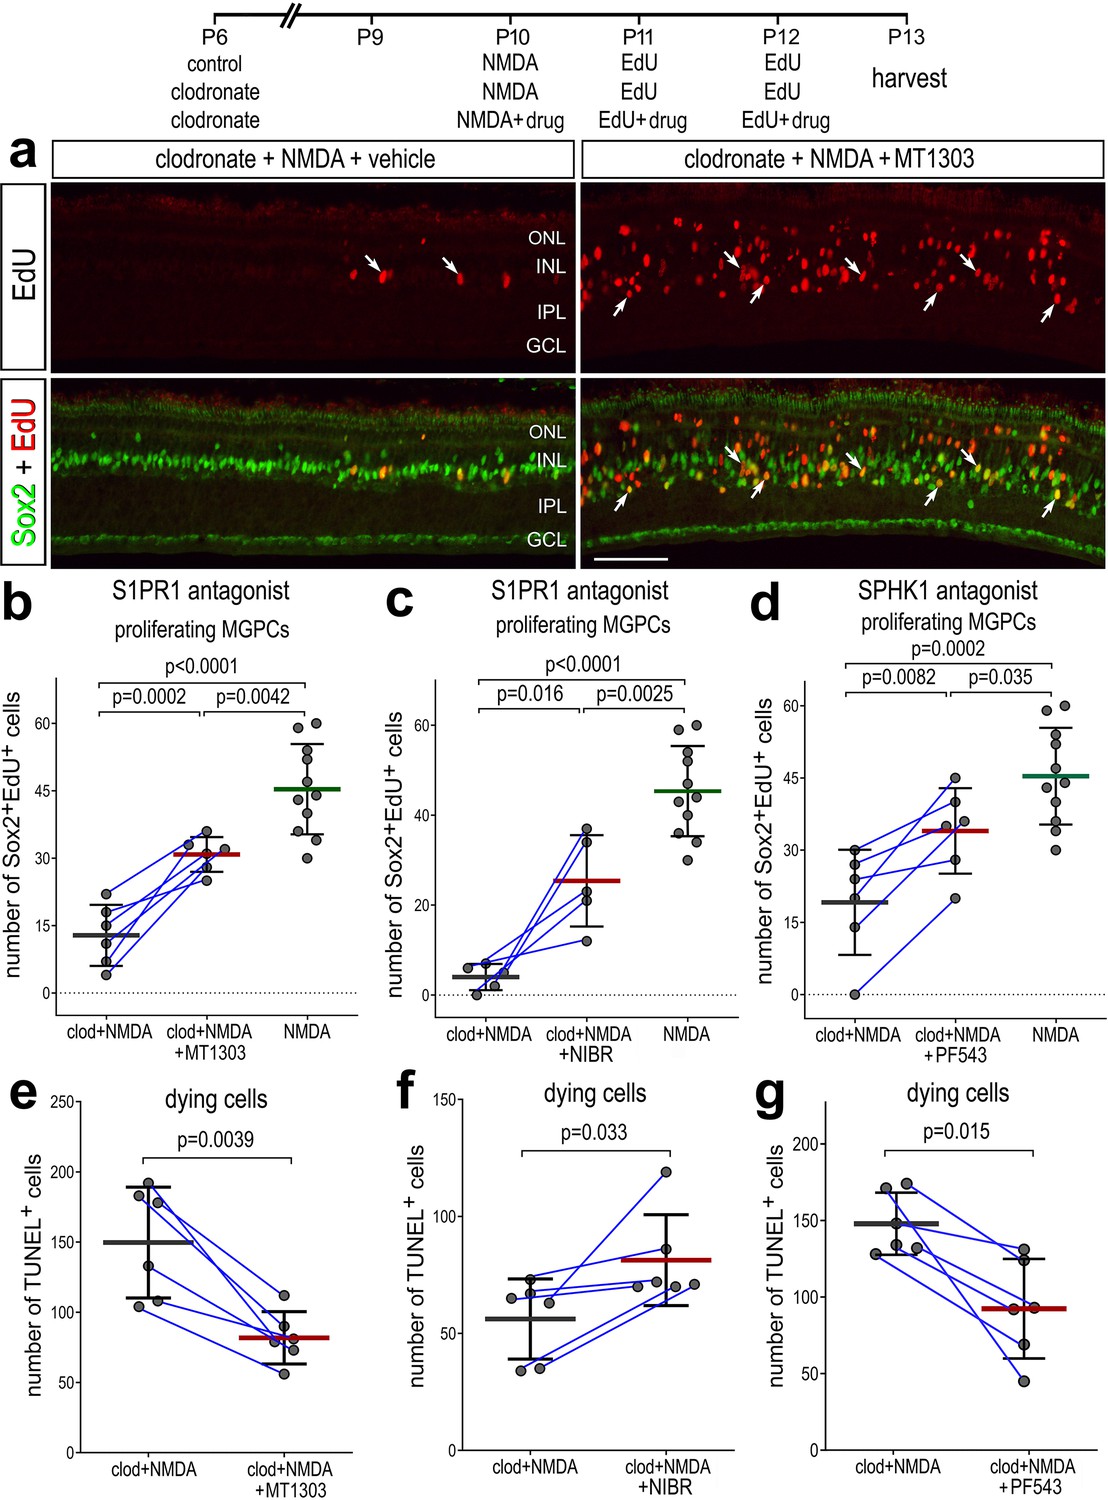
Effects of different inhibitors to S1P receptor, synthesizing enzymes and degrading enzymes on the formation of proliferating Müller glia-derived progenitor cells (MGPCs).
Schematic diagram of the receptors and enzymes involved in S1P signaling (a). The diagram includes the different agonists and antagonists that were applied to target the different components of the S1P pathway (a). Eyes were injected with vehicle or drug at P6 and P7, NMDA ± drug at P8, EdU ± drug at P9, EdU at P10, and retinas harvested at P11. Retinal sections were labeled for EdU incorporation and antibodies to Sox2 (b) or Sox9, neurofilament, and phospho-histone H3 (k). Arrows indicate Müller glia (MG), small double arrows indicate presumptive EdU-labeled microglia, and hollow arrow-heads indicate presumptive proliferating NIRG cells. The calibration bar represents 50 µm (b, k). Histograms (c–j, m–p) illustrate the mean (bar ± SD), each dot represents one biological replicate, and blue lines connect counts from control and treated retinas from one individual. Significance of difference (p-values) was determined by using a paired t-test. Abbreviations: ONL – outer nuclear layer, INL – inner nuclear layer, IPL – inner plexiform layer, GCL – ganglion cell layer, ns – not significant, NMDA – N-methyl-D-aspartate, EdU – 5-ethynyl-2-deoxyuridine.
Figure 4—figure supplement 1
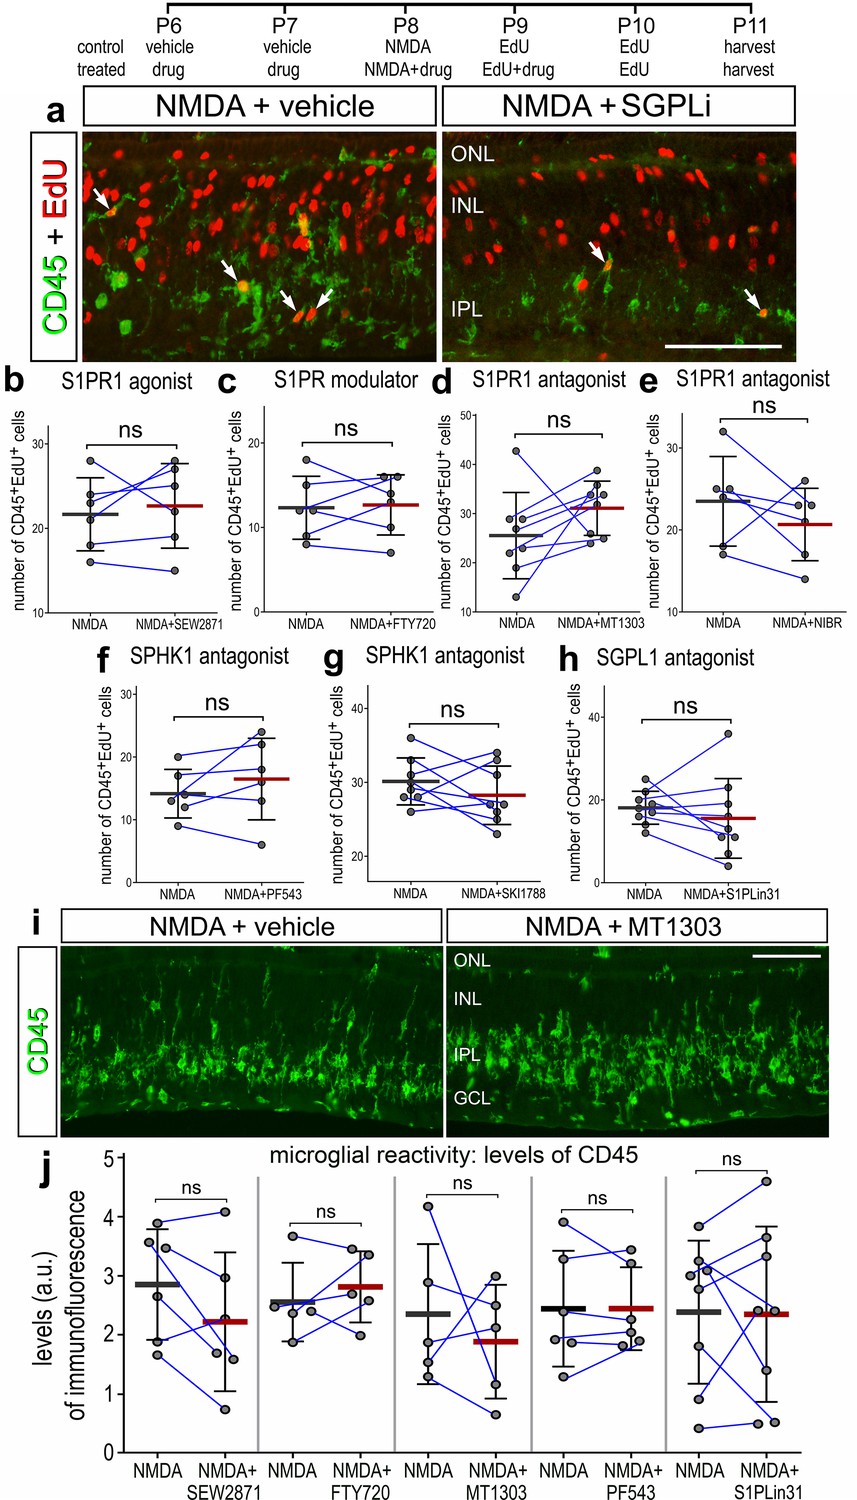
Microglia proliferation was unaffected by agonists and antagonists to different components of S1P signaling.
Arrows indicate Müller glia (MG), small double arrows indicate EdU-labeled microglia, and hollow arrow-heads indicate proliferating NIRG cells. The calibration bar represents 50 µm (b). Histograms (c–j) illustrate the mean (bar ± SD), each dot represents one biological replicate and blue lines connect counts from control and treated retinas from one individual. Significance of difference (p-values) was determined by using a paired t-test. Abbreviations: ONL – outer nuclear layer, INL – inner nuclear layer, IPL – inner plexiform layer, GCL – ganglion cell layer, NIRG – non-astrocytic inner retinal glial cell, ns – not significant, EdU – 5-ethynyl-2-deoxyuridine.
Figure 4—figure supplement 2
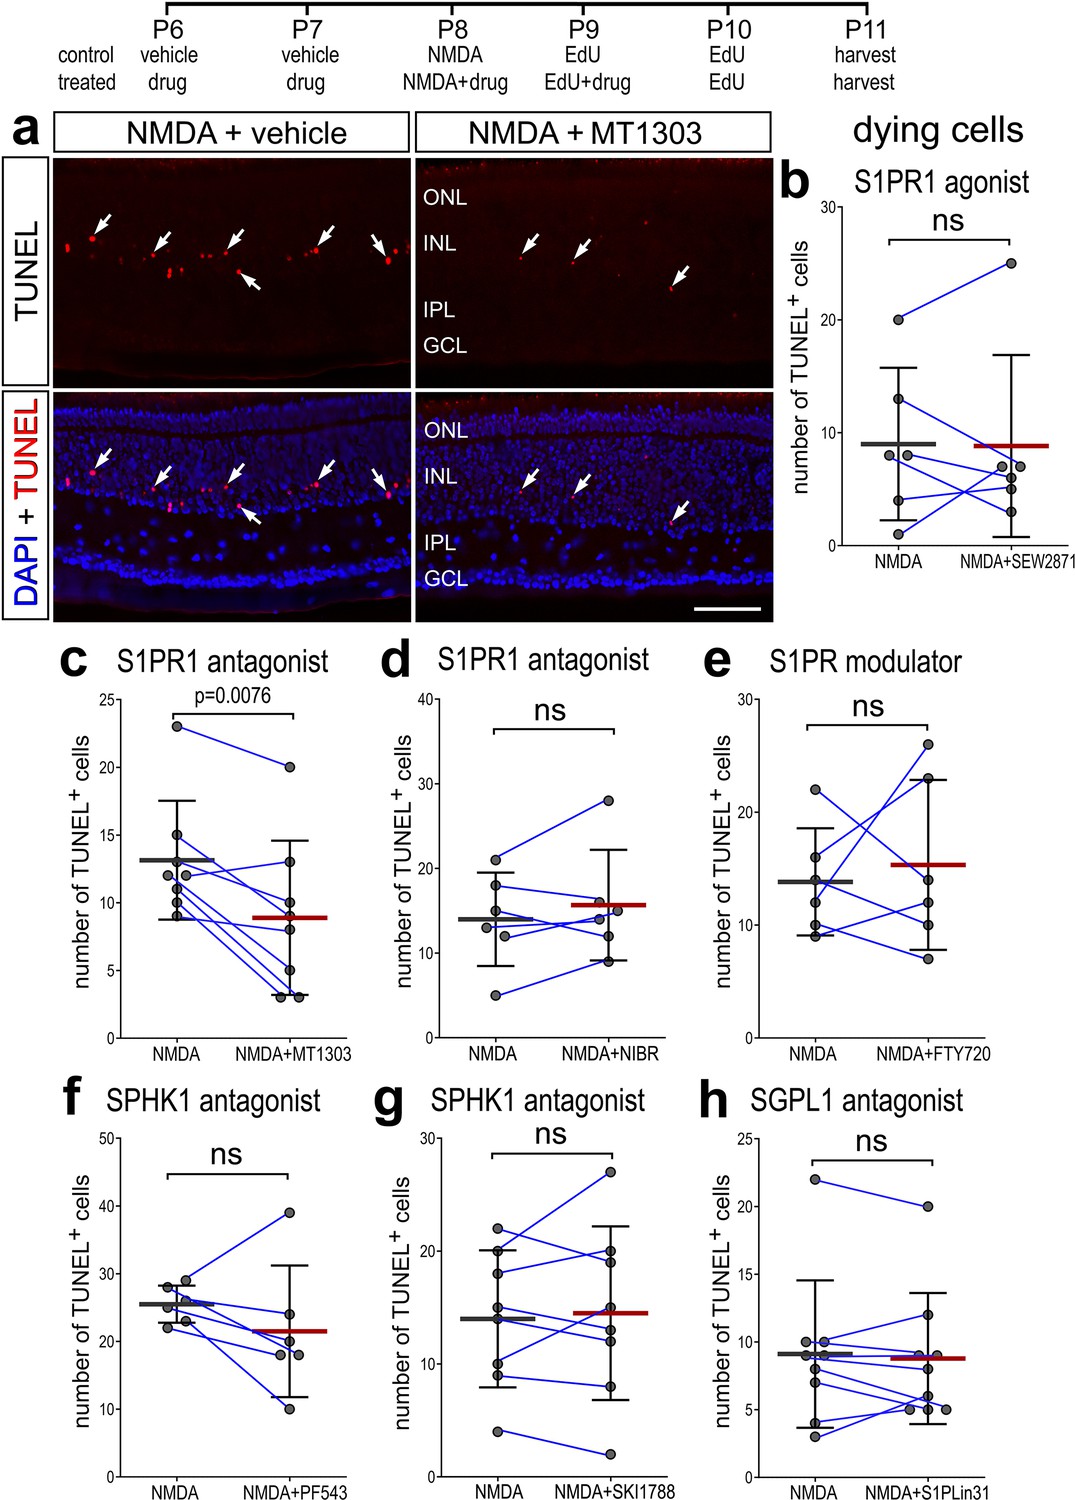
Numbers of dying cells are unaffected by agonists and antagonists to different components of S1P signaling.
Dying cells were labeled for fragmented DNA using the TUNEL method (red), and all nuclei were labeled with DAPI (blue) (a). Arrows indicate TUNEL-positive nuclei of dying cells. The calibration bar represents 50 µm. Histograms (b–h) illustrate the mean (bar ± SD), each dot represents one biological replicate, and blue lines connect counts from control and treated retinas from one individual. Significance of difference (p-values) was determined by using a paired t-test. Abbreviations: ONL – outer nuclear layer, INL – inner nuclear layer, IPL – inner plexiform layer, GCL – ganglion cell layer, ns – not significant.
Figure 4—figure supplement 3
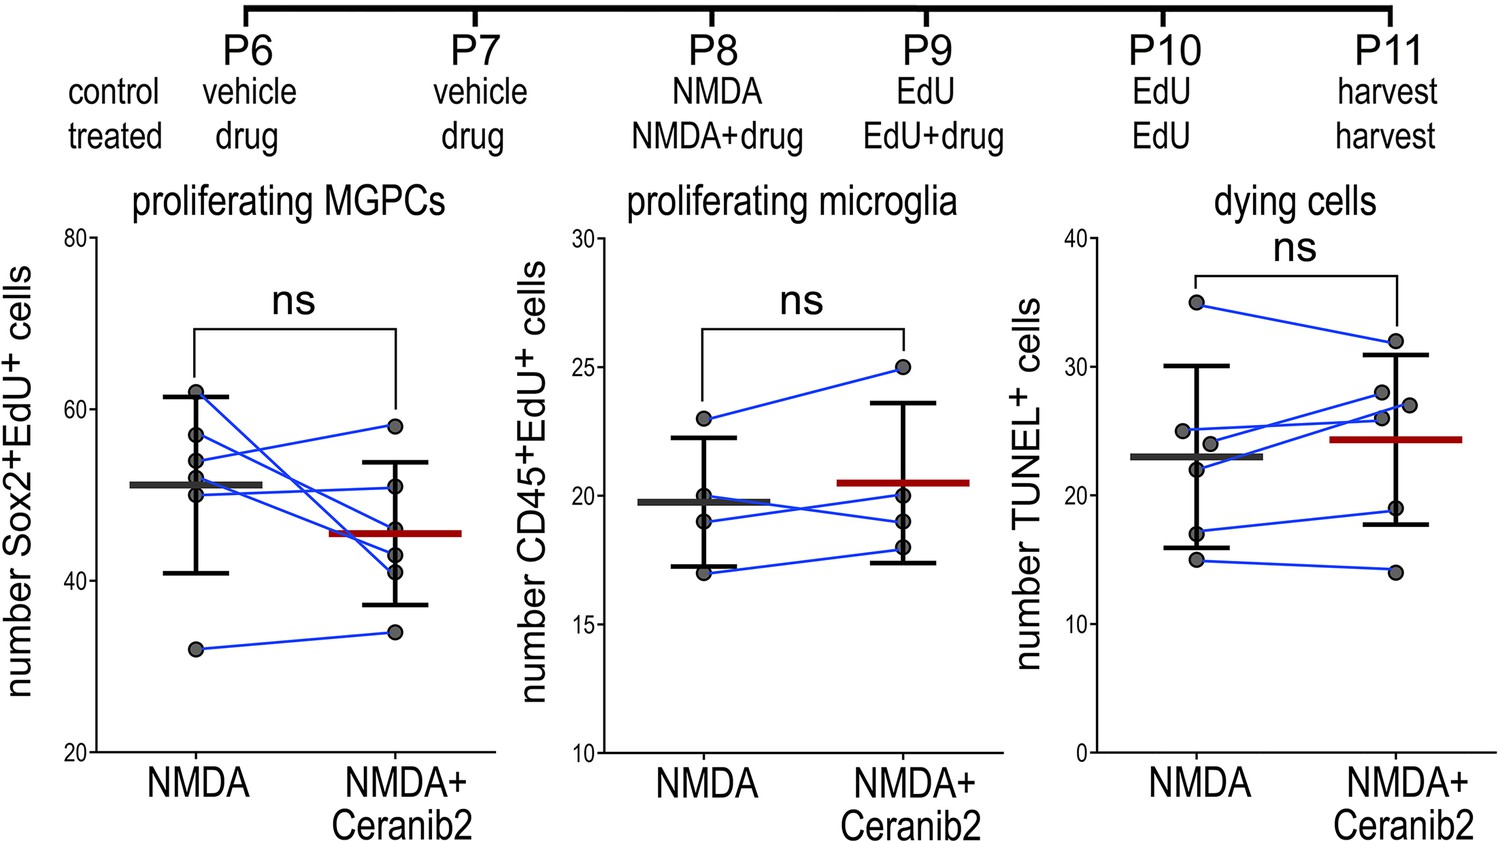
ASAH1 inhibition did not influence proliferating Müller glia-derived progenitor cells (MGPCs), proliferating microglia, or cell death.
Eyes were injected with vehicle or drug at P6 and P7, NMDA at P8, EdU at P9 and P10, and retinas harvested at P11. Retinal sections were labeled for EdU and antibodies to Sox2 and CD45. Dying cells were labeled for fragmented DNA using the TUNEL method. Histograms represent the mean (bar ± SD) and each dot represents one biological replicate (blue lines connect data points from control and treated retinas from the same individual). Significance of difference (p-values) was determined by using a paired t-test. Abbreviations: EdU – 5-ethynyl-2-deoxyuridine, NMDA – N-methyl-D-aspartate.
Figure 4—figure supplement 4
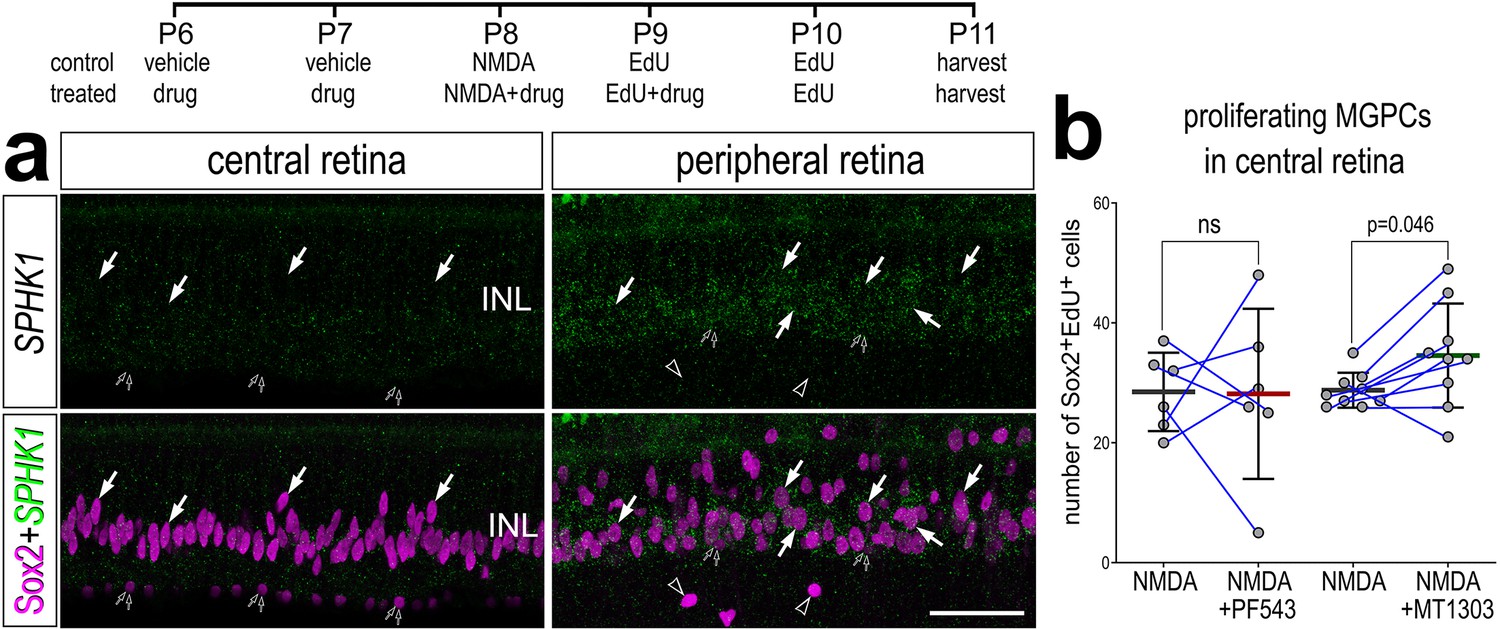
SPHK1 expression is suppressed in the central retina.
Eyes were injected with vehicle ± drug at P6 and P7, NMDA ± drug at P8, EdU ± drug at P9, EdU at P10, and retinas harvested 24 hr later at P11. Arrows indicate Müller glia (MG), small double arrows indicate EdU-labeled microglia, and hollow arrow-heads indicate proliferating NIRG cells (a). The calibration bar represents 50 µm. Histograms (b) illustrate the mean (bar ± SD), each dot represents one biological replicate and blue lines connect replicates from control and treated retinas from one individual. Significance of difference (p-values) was determined by using a paired t-test. Abbreviations: INL – inner nuclear layer, ns – not significant, EdU – 5-ethynyl-2-deoxyuridine.
Figure 5 with 1 supplement
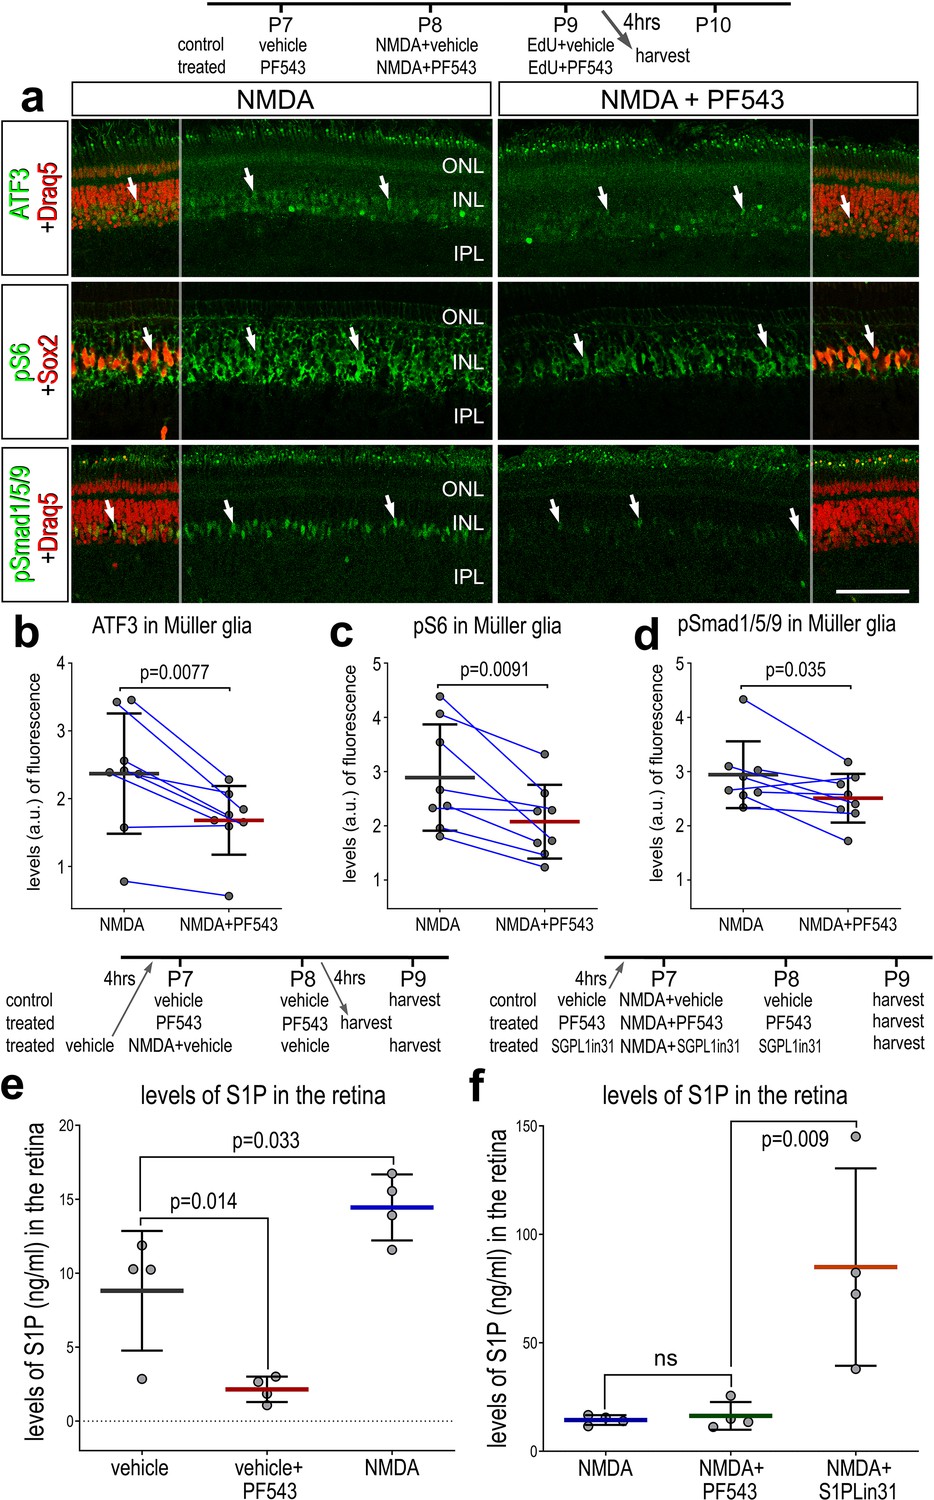
Effects of Sphk1 inhibitor on on S1P levels and activation of cell signaling pathways.
Eyes were injected with vehicle or PF543 at P7, NMDA ± PF543 at P8, EdU ± PF543 P9, and retinas harvested 4 hr after the last injection. Sections of the retina were labeled for DNA (Draq5; red), ATF3 (green), pS6 (green), Sox2 (red), and pSmad1/5/9 (green) (a). Draq5 and Sox2 are included as a partial-field overlay (red, a). Arrows indicate the nuclei of Müller glia (MG). Calibration bar represents 50 µm (a). Eyes were injected with vehicle, PF543, or NMDA at P7, treated with vehicle or PF543 at P8, and harvested 4 hr later (e). LC/MS was used to quantify levels of S1P in retinas treated with saline, NMDA, PF543, NMDA + PF543, or NMDA + SGPL-in-31. Histograms (b–f) illustrate the mean (bar ± SD), each dot represents one biological replicate and blue lines connect counts from control and treated retinas from one individual. Significance of difference (p-values) in b, c, and d was determined by using a paired t-test. Significance of difference (p-values) in e and f was determined using a one-way ANOVA with Šidák correction for multiple comparisons. Abbreviations: ONL – outer nuclear layer, INL – inner nuclear layer, IPL – inner plexiform layer, GCL – ganglion cell layer, ns – not significant, NMDA – N-methyl-D-aspartate, EdU – 5-ethynyl-2-deoxyuridine.
Figure 5—figure supplement 1
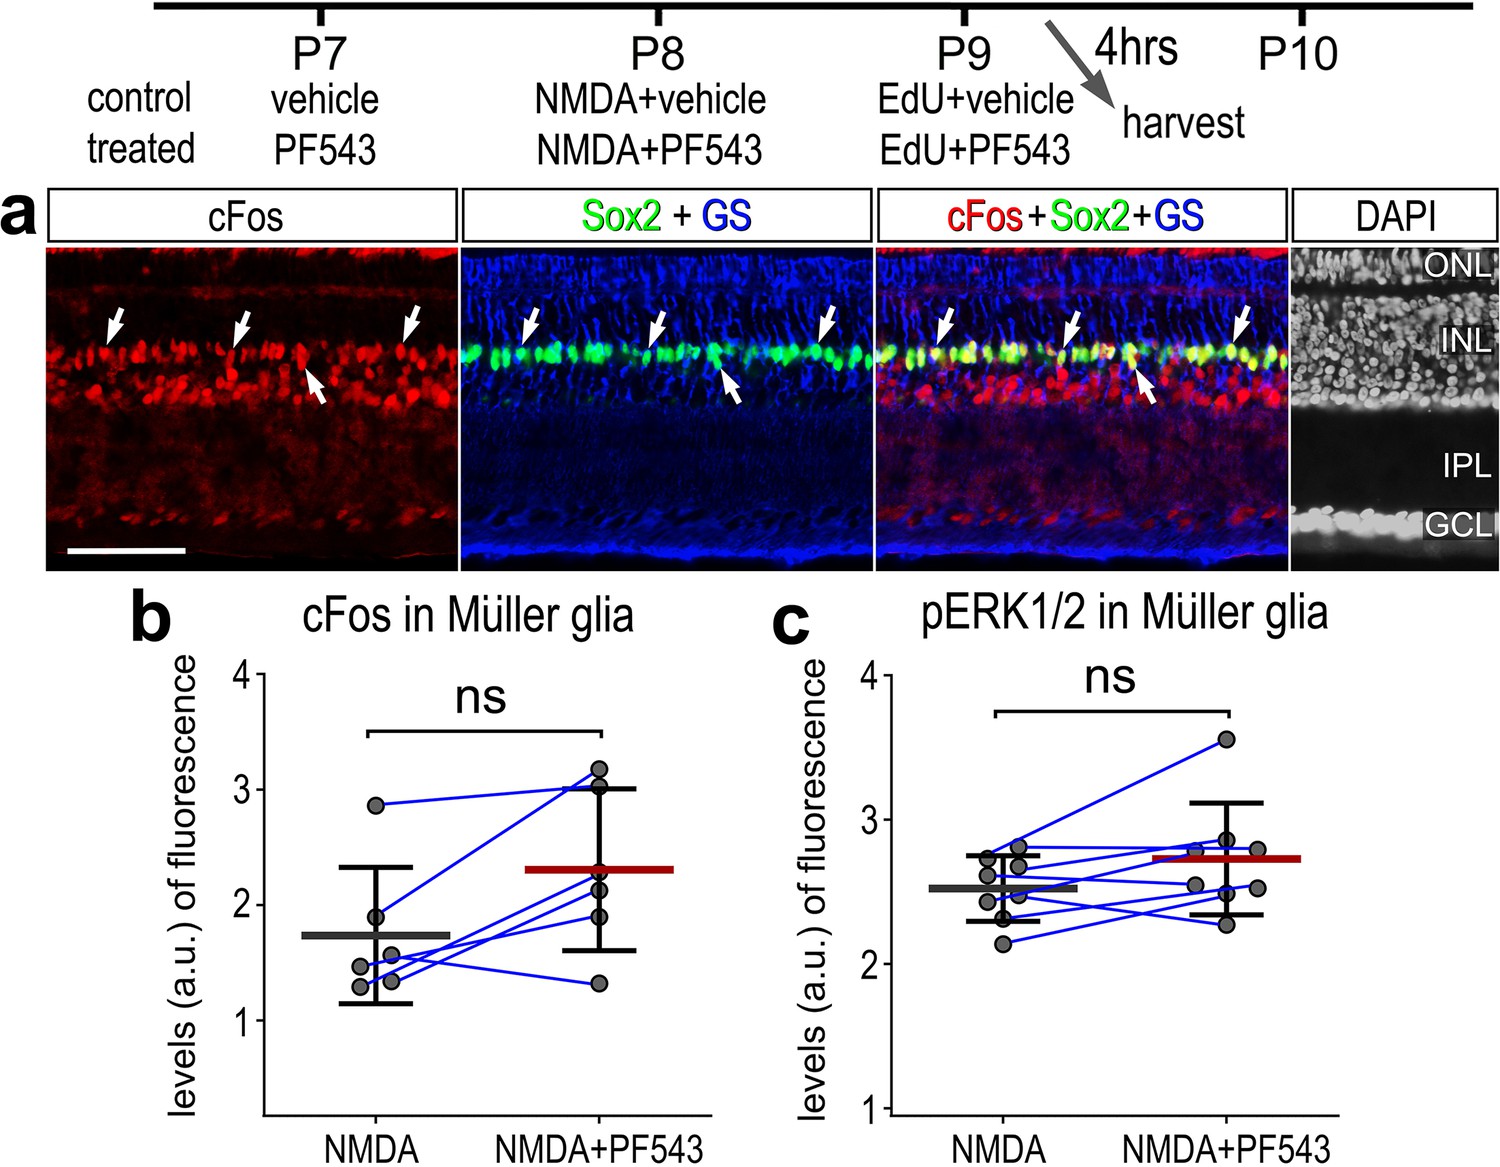
cFos and pERK1/2 levels were unaffected by Sphk1 inhibitor treatment in damaged retinas.
Eyes were injected with vehicle or drug at P7, NMDA at P8, vehicle or drug at P9, and harvested 4 hr later. Retinal sections were labeled with DAPI and for antibodies to Sox2, cFos, GS, and pERK (a). Histograms represent the mean (bar ± SD) and each dot represents one biological replicate (blue lines connect data points from control and treated retinas from the same individual) (b, c). Significance of difference (p-values) was determined by using a paired t-test. Abbreviations: EdU – 5-ethynyl-2-deoxyuridine, NMDA, N-methyl-D-aspartate.
Figure 6

Inhibition of S1P synthesis and S1P receptors stimulates neuronal differentiation from Müller glia-derived progenitor cells (MGPCs).
Eyes were injected with NMDA at P7, EdU at P9, vehicle or drug at P10 and P11, and retinas harvested at P12. Retinas sections were labeled for EdU (red; a, c, e, g) and antibodies to HuC/D (green; c), calretinin (green; e), or visinin (green; g). Arrows indicate the nuclei of regenerated neurons. Calibration bars in panels a, c, e, and g represent 50 µm. Histograms represent the mean (bar ± SD) and each dot represents one biological replicate (blue lines connect data points from control and treated retinas from the same individual) (b, d, f). Significance of difference (p-values) was determined by using a paired t-test. Abbreviations: ONL – outer nuclear layer, INL – inner nuclear layer, IPL – inner plexiform layer, GCL – ganglion cell layer, ns – not significant, NMDA – N-methyl-D-aspartate, EdU – 5-ethynyl-2-deoxyuridine.
Figure 7
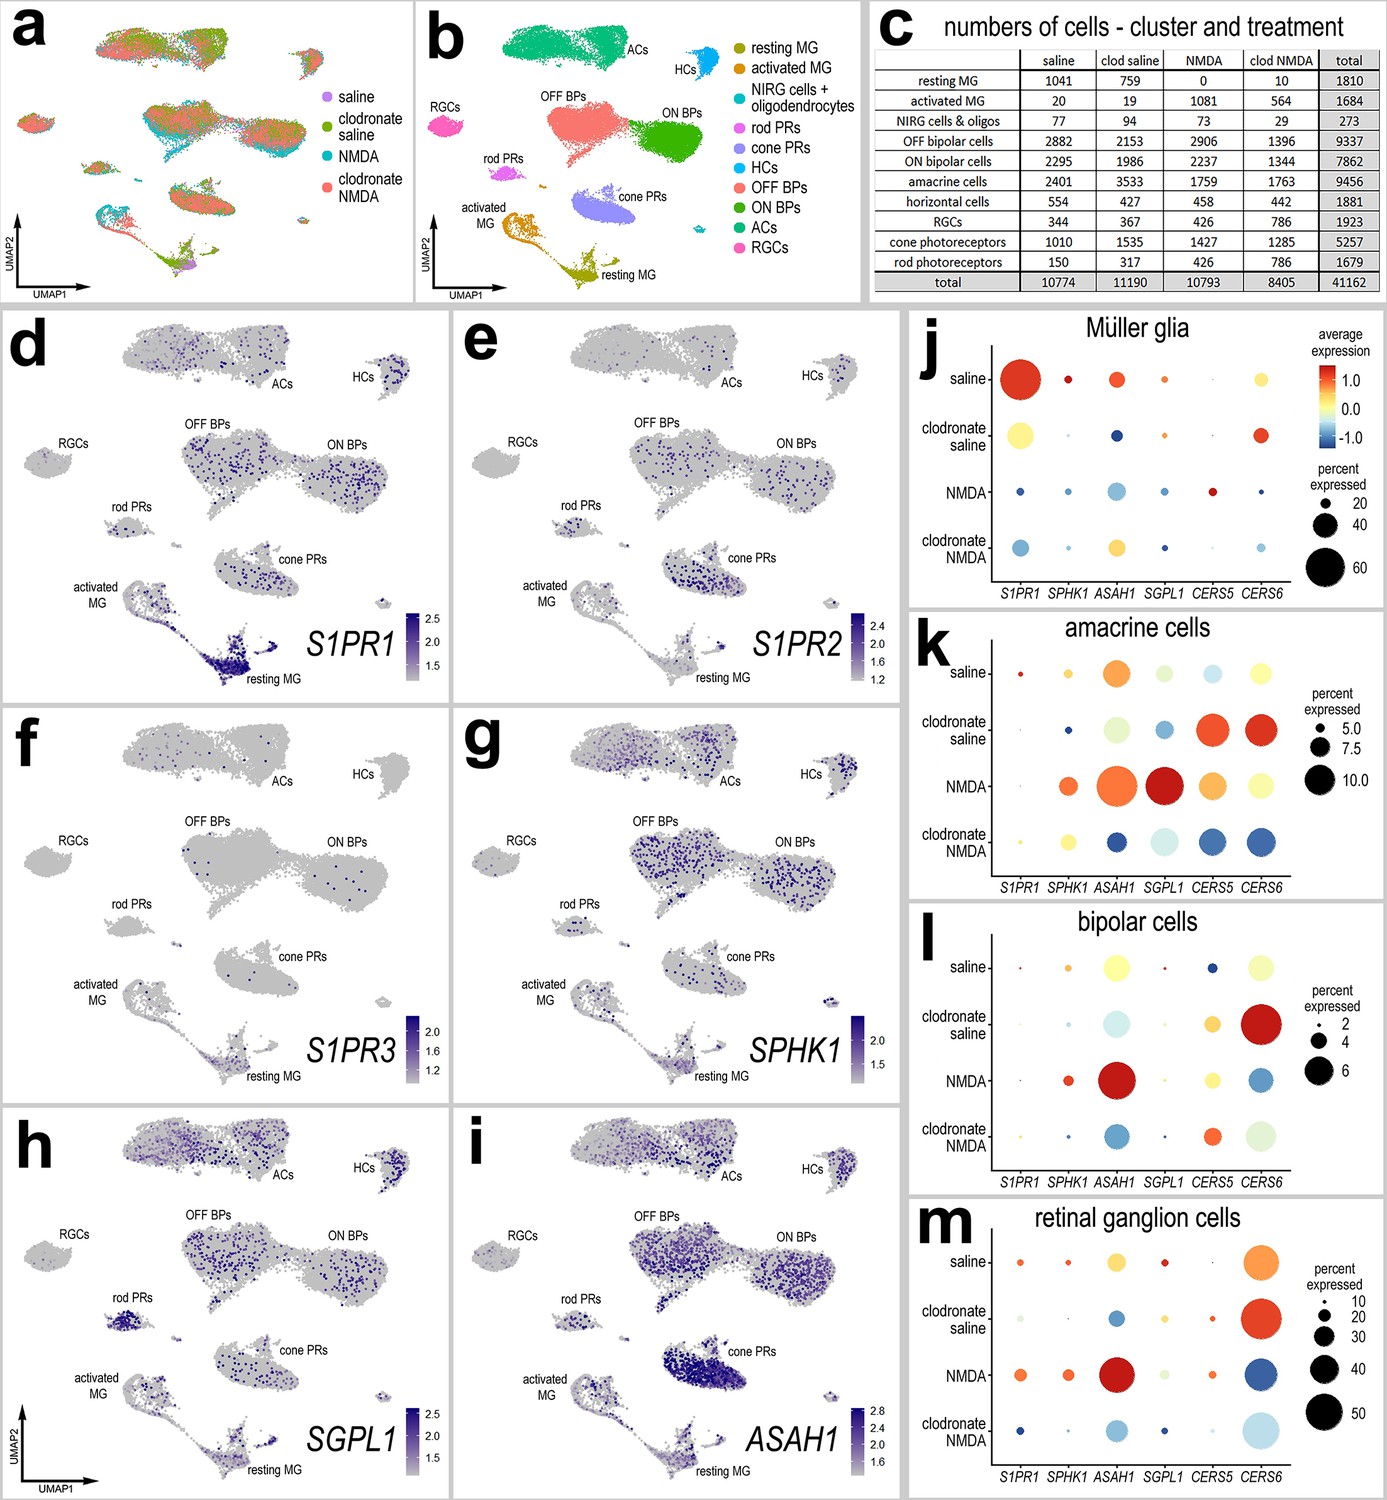
scRNA-seq of normal and damaged retinas with and without microglia.
Retinas were obtained from eyes injected with saline or clodronate liposomes at P6, saline or NMDA at P10, and tissues harvested at 24 hr after the last injection. UMAP ordering of cells is displayed for libraries of origin and distinct clusters of cells (a, b). Number of cells in each UMAP cluster and library of origin are listed in panel c. The identities of clusters of cells in UMAP plots were well-established markers (see methods). UMAP heatmap plots illustrate the patterns and levels of expression of S1PR1, S1PR2, S1PR3, SPHK1, SGPL1, and ASAH1 (d–i). Different cell types, including Müller glia (MG) (j), amacrine cells (k), bipolar cells (ON and OFF cells; l), and retinal ganglion cells (RGCs; m) were bioinformatically isolated and dot plots were generated to assess levels of expression by treatment (library of origin). Dot plots illustrate the percentage of expressing cells (dot size) and significant (p < 0.01) changes in expression levels (heatmap) for genes for cells from retinas treated with saline versus saline-clodronate and NMDA versus NMDA-clodronate. Significance of difference was determined by using a Wilcox rank sum with Bonferoni correction. Abbreviations: NMDA – N-methyl-D-aspartate, UMAP – uniform manifold approximation and projection.
-
Figure 7—source data 1
Statistics for S1P-related genes in clodronate- or saline-treated aggregate scRNA-seq libraries.
- https://cdn.elifesciences.org/articles/102151/elife-102151-fig7-data1-v1.docx
Figure 8
Rescue of Müller glia-derived progenitor cell (MGPC) proliferation in damaged retinas missing microglia.
Arrows indicate Müller glia (MG), small double arrows indicate EdU-labeled microglia, and hollow arrow-heads indicate proliferating NIRG cells (a). The calibration bar represents 50 µm. Histograms (b–g) illustrate the mean (bar ± SD), each dot represents one biological replicate and blue lines connect replicates from control and treated retinas from one individual. Significance of difference (p-values) was determined by using a paired t-test. Abbreviations: ONL – outer nuclear layer, INL – inner nuclear layer, IPL – inner plexiform layer, GCL – ganglion cell layer, NIRG – non-astrocytic inner retinal glial cell, ns – not significant, EdU – 5-ethynyl-2-deoxyuridine.
Figure 9
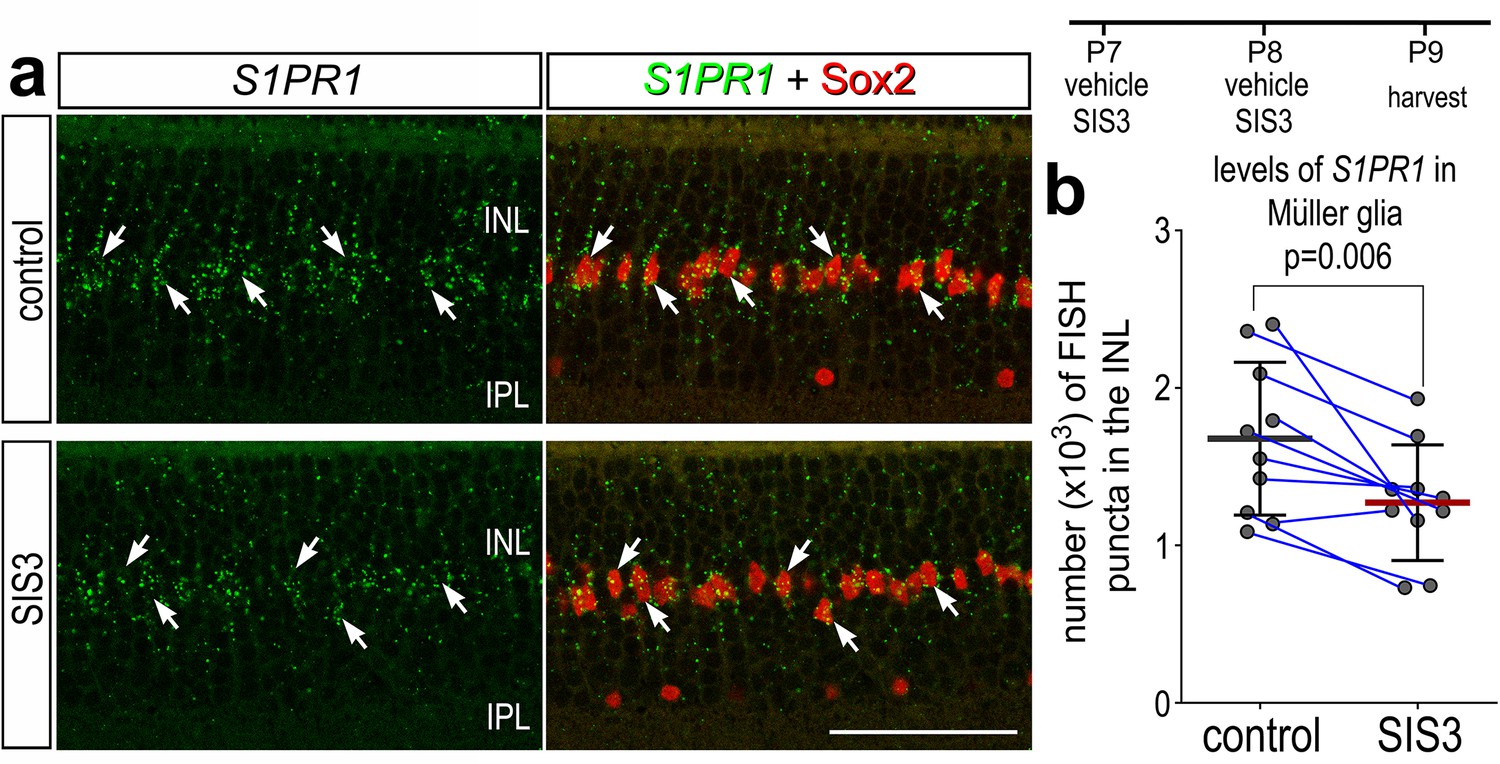
Smad3 inhibitor application suppresses S1PR1 transcription.
Retinas were obtained from eyes injected with vehicle or SIS3 at P7 and P8, and harvested at P9. Retinal sections were labeled with antibodies to Sox2 (red) and FISH probes to S1PR1 (green puncta; a). Solid arrows indicate MG nuclei associated with numerous FISH puncta. Calibration bar represents 50 µm. Histograms (c–j) illustrate the mean (bar ± SD), each dot represents one biological replicate and blue lines connect replicates from control and treated retinas from one individual. Significance of difference (p-values) was determined by using a paired t-test. Abbreviations: ONL – outer nuclear layer, INL – inner nuclear layer, IPL – inner plexiform layer, GCL – ganglion cell layer, MG – Muller glia, ns – not significant.
Figure 10
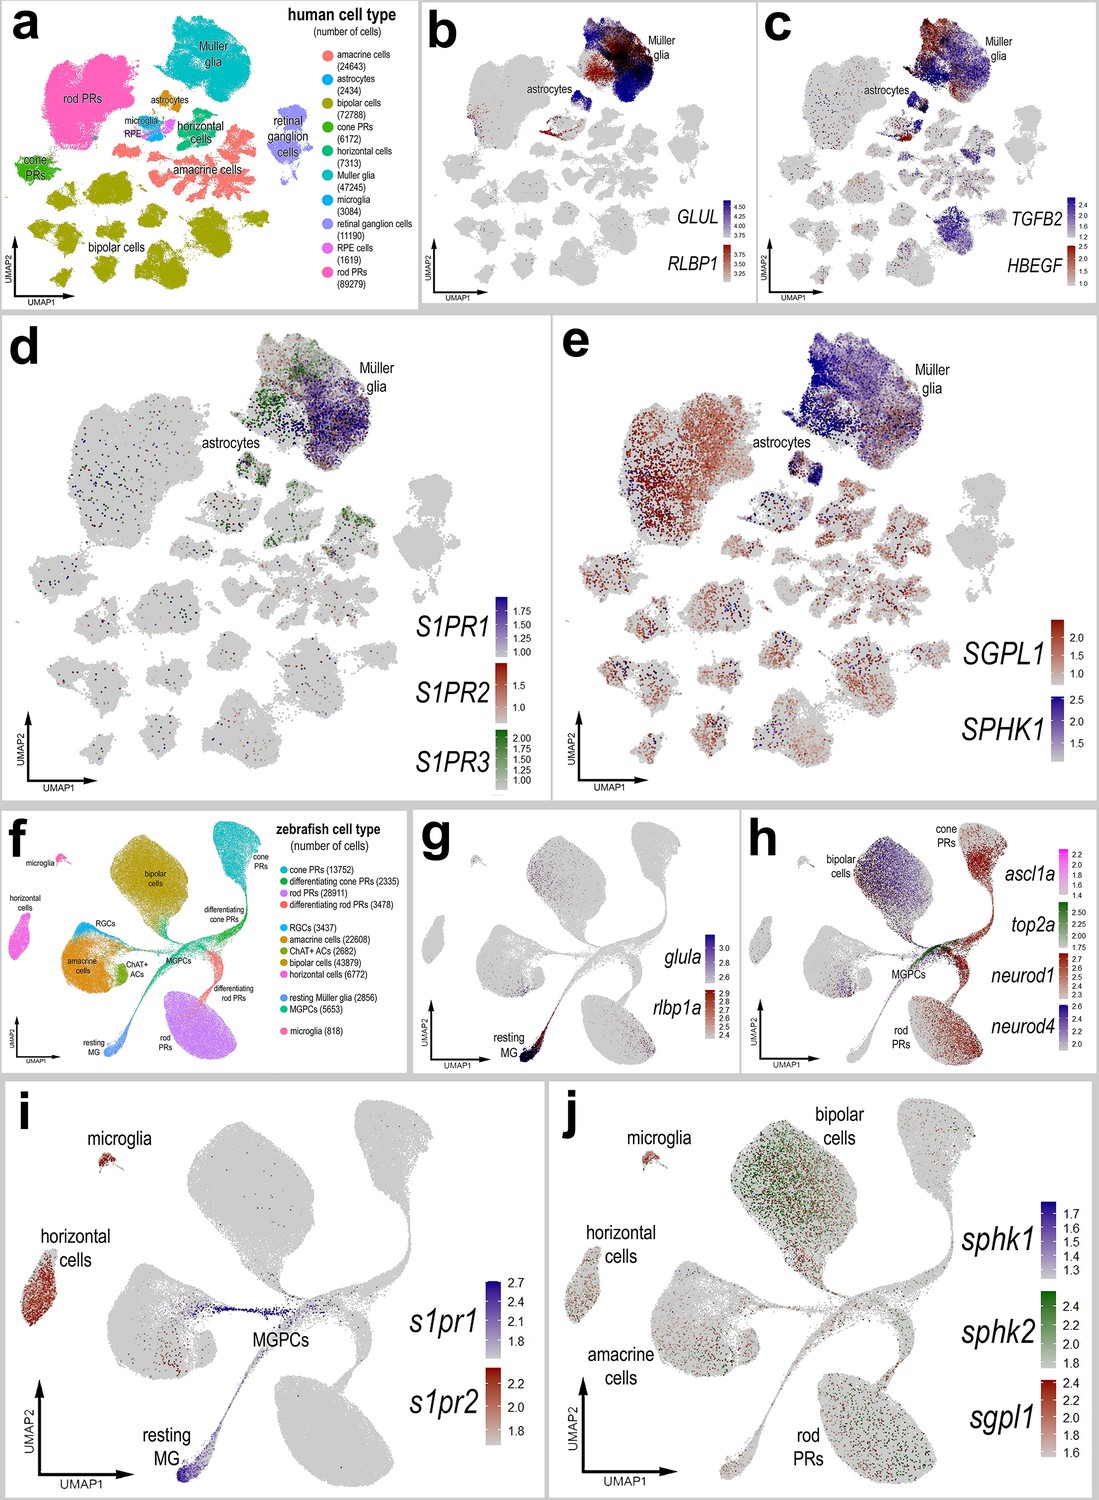
Patterns of expression of S1P-related genes in human and zebrafish retinas.
scRNA-seq was used to identify patterns of expression of S1P-related factors among retinal cells with the data presented in UMAP plots. Aggregate snRNA-seq libraries were generated for human retinas cells at different ages ranging from 42 to 89 years of age (a–e), as described previously (Li et al., 2023). Heatmap plots illustrate the patterns and levels of expression for GLUL and RLBP1 (b), TGFB2 and HBEGF (c), S1PR1, S1PR2, and S1PR3 (d), and SGPL1 and SPHK1 (e) across retinal cells. Aggregate snRNA-seq libraries were generated for zebrafish retinas cells from eyes treated with vehicle, light damage or NMDA and harvest at 1.5, 2.25, 3, 4, 7, and 14 days after damage (f–j), as described previously (Lyu et al., 2023). Heatmap plots illustrate the patterns and levels of expression for glula and rlbp1a (g), ascl1a, top2a, neurod1, and neurod4 (h), s1pr1 and s1pr3 (i), and sgpl1, sphk1, and sphk2 (j) across retinal cells. Abbreviations: NMDA – N-methyl-D-aspartate, UMAP – uniform manifold approximation and projection.
Tables
Table 1
Pharmacological compounds.
| Drug name | Dose (µg) | Source | Catalog number | ED50 (mg/kg) | Initial max dose (mg/kg equivalent per eye) | Vehicle |
|---|---|---|---|---|---|---|
| NMDA | 73 | Sigma | M3262 | N/A | 81.1 | Saline |
| 5-Ethynyl-2′-deoxyuridine | 2 | Thermo Fisher | A10044 | N/A | 2.2 | Saline |
| Sphingosine (d18:1) | 5 | Avanti | 860490P | N/A | 5.5 | Saline 1% BSA |
| Sphingosine-1 phosphate (d18:1) | 5 | Cayman | 62570 | 0.02 | 5.5 | Saline 1% BSA |
| Amiselimod (MT1303) | 5 | Cayman | 20970 | 0.1–10.0 | 5.5 | 20% DMSO in saline |
| Defensamide (MHP) | 5 | Selleck | S6512 | N/A | 5.5 | 20% DMSO in saline |
| Fingolimod (FTY720) | 10 | Sigma | SML0700 | 0.1–2.3 | 11.1 | 20% DMSO in saline |
| NIBR0213 | 4 | Cayman | 21513 | 0.2–15.0 | 4.4 | 20% DMSO in saline |
| PF-543 (hydrochloride) | 5 | Cayman | 17034 | 1.0–7.5 | 5.5 | 20% DMSO in saline |
| SKI-II | 5 | Sigma | S5696 | 1.0 | 5.5 | 20% DMSO in saline |
| S1PL-in-31 | 6 | Aobious | AOB31664 | 2.0–10.0 | 6.7 | 20% DMSO in saline |
| SEW2871 | 5 | Cayman | 10006440 | 5–20 | 5.5 | 20% DMSO in saline |
| TY 52156 | 5 | Cayman | 19119 | 0.3–10 | 5.5 | 20% DMSO in saline |
| VPC 23019 | 4 | Cayman | 13240 | 0.1–1.0 | 4.4 | 20% DMSO in saline |
Table 2
Antibody table – antigen, dilution, host, and sources of antibodies.
| Antibody | Dilution | Host | Clone/catalog number | Source |
|---|---|---|---|---|
| ATF3 | 1:200 | Rabbit | NBP2-85816 | NOVUS |
| Calretinin | 1:1000 | Rabbit | CR7697 | Swant Immunochemicals |
| CD45 | 1:300 | Mouse | HIS-C7 | Cedi Diagnostic |
| cFos | 1:200 | Rabbit | K-25 | Santa Cruz |
| ERK1/2 | 1:600 | Rabbit | 137F5 | Cell Signaling |
| Glutamine synthetase | 1:1000 | Mouse | 610517 | BD Biosciences |
| HuD/C | 1:300 | Mouse | A21271 | Invitrogen |
| Neurofilament | 1:2000 | Mouse | RT97 | DSHB |
| pHisH3 | 1:600 | Rabbit | 06–570 | Millipore |
| pERK1/2 | 1:800 | Rabbit | 4370 | Cell Signaling |
| pS6 | 1:750 | Rabbit | 2215 | Cell Signaling |
| pSmad1/5/9 | 1:250 | Rabbit | D5B10 | Cell Signaling |
| pSTAT3 | 1:300 | Rabbit | 9131 | Cell Signaling |
| Sox2 | 1:1000 | Goat | KOY0418121 | R&D Systems |
| Sox9 | 1:2000 | Rabbit | AB5535 | Millipore |
| Visinin | 1:50 | Mouse | 7G4 | DSHB |
Additional files
Download links
A two-part list of links to download the article, or parts of the article, in various formats.
Downloads (link to download the article as PDF)
Open citations (links to open the citations from this article in various online reference manager services)
Cite this article (links to download the citations from this article in formats compatible with various reference manager tools)
Sphingosine-1-phosphate signaling regulates the ability of Müller glia to become neurogenic, proliferating progenitor-like cells
eLife 13:RP102151.
https://doi.org/10.7554/eLife.102151.4


