Distinct adaptation and epidemiological success of different genotypes within Salmonella enterica serovar Dublin
- Department of Microbiology and Immunology, The University of Melbourne at The Peter Doherty Institute for Infection and Immunity, Australia
- Microbiological Diagnostic Unit Public Health Laboratory, Department of Microbiology and Immunology, The University of Melbourne at The Peter Doherty Institute for Infection and Immunity, Australia
- Centre for Innate Immunity and Infectious Diseases, Hudson Institute of Medical Research, Australia
- School of Medicine, University of St Andrews, United Kingdom
- Department of Microbiology, Monash University, Australia
Figures
Figure 1 with 1 supplement
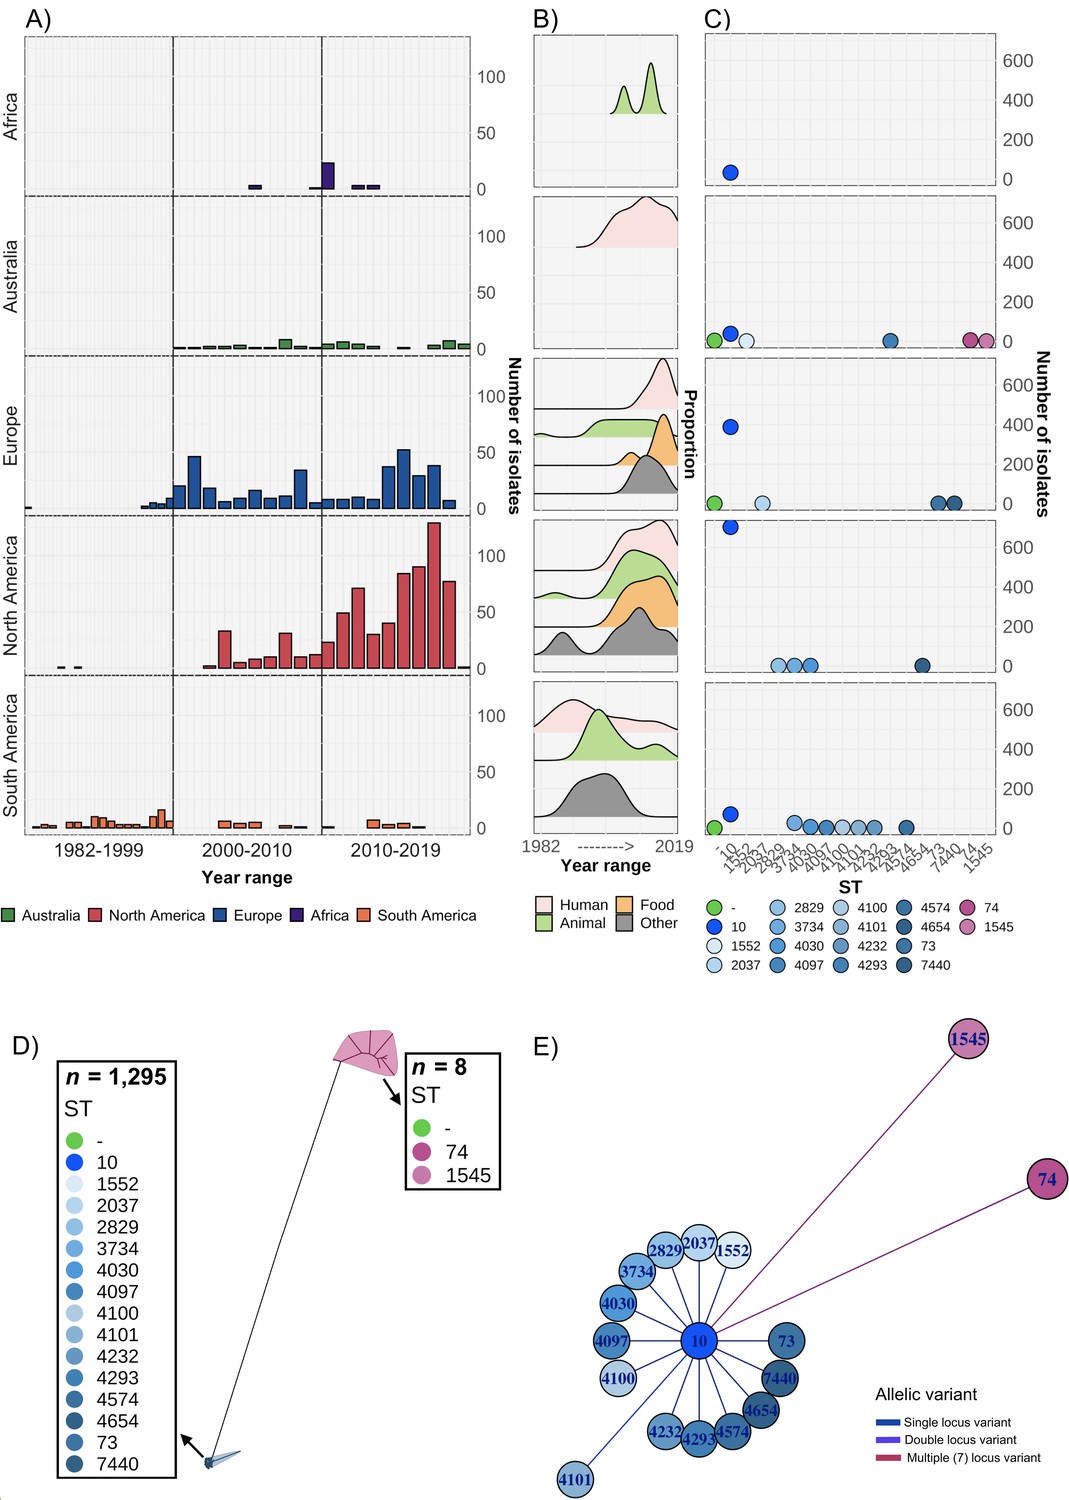
Overview of S. Dublin genomes in the study.
Geographical distribution and clonal relationship of 1303 S. Dublin genomes in the study. (A) Number of S. Dublin genomes according to geographical region and time interval of collection. (B) Distribution of human, animal, and food S. Dublin genomes collected over time. (C) Distribution of S. Dublin sequence types (STs) from each region. Each coloured circle correlates to an ST. Circles in green indicate no ST was identified. (D) Unrooted phylogenetic tree of 1303 S. Dublin genomes. Two main lineages of ST74 (n=8) and sequence type 10 (ST10) (n=1295) shown in blue and pink, respectively. (E) Relatedness of known STs to ST10. The nodes are labelled with the ST, and the branch lengths are indicative of the number of dissimilar locus variants to ST10.
Figure 1—figure supplement 1
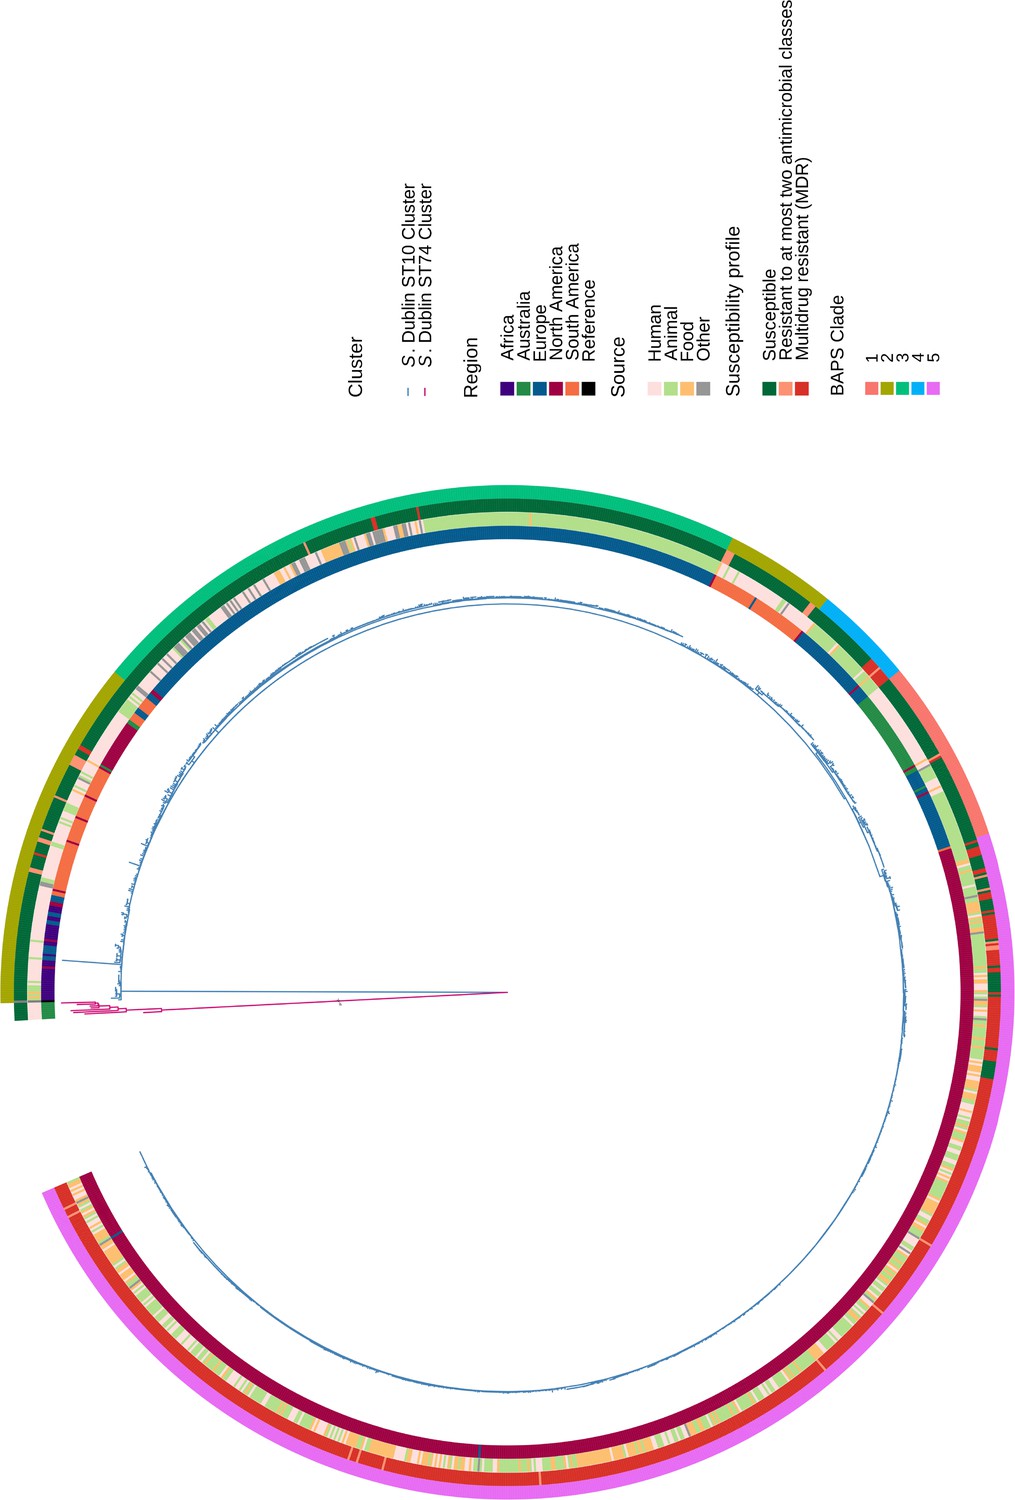
Phylogeny of 1303 S. Dublin genomes.
Population structure of S. Dublin genomes. (A) Midpoint rooted maximum likelihood phylogeny inferred from 5937 single nucleotide polymorphisms (SNPs). The branches are coloured by lineage with ST74 in pink and sequence type 10 (ST10) lineage in blue. The coloured boxes on the tree are the clades identified in the ST10 lineage using the Bayesian analysis of population structure (BAPS). The tips of the tree are coloured by ST. The innermost coloured ring indicates geographical region of collection, the middle ring indicates genome source followed by the AMR susceptibility profile, while the outer ring indicates the BAPS cluster.
Figure 2 with 2 supplements
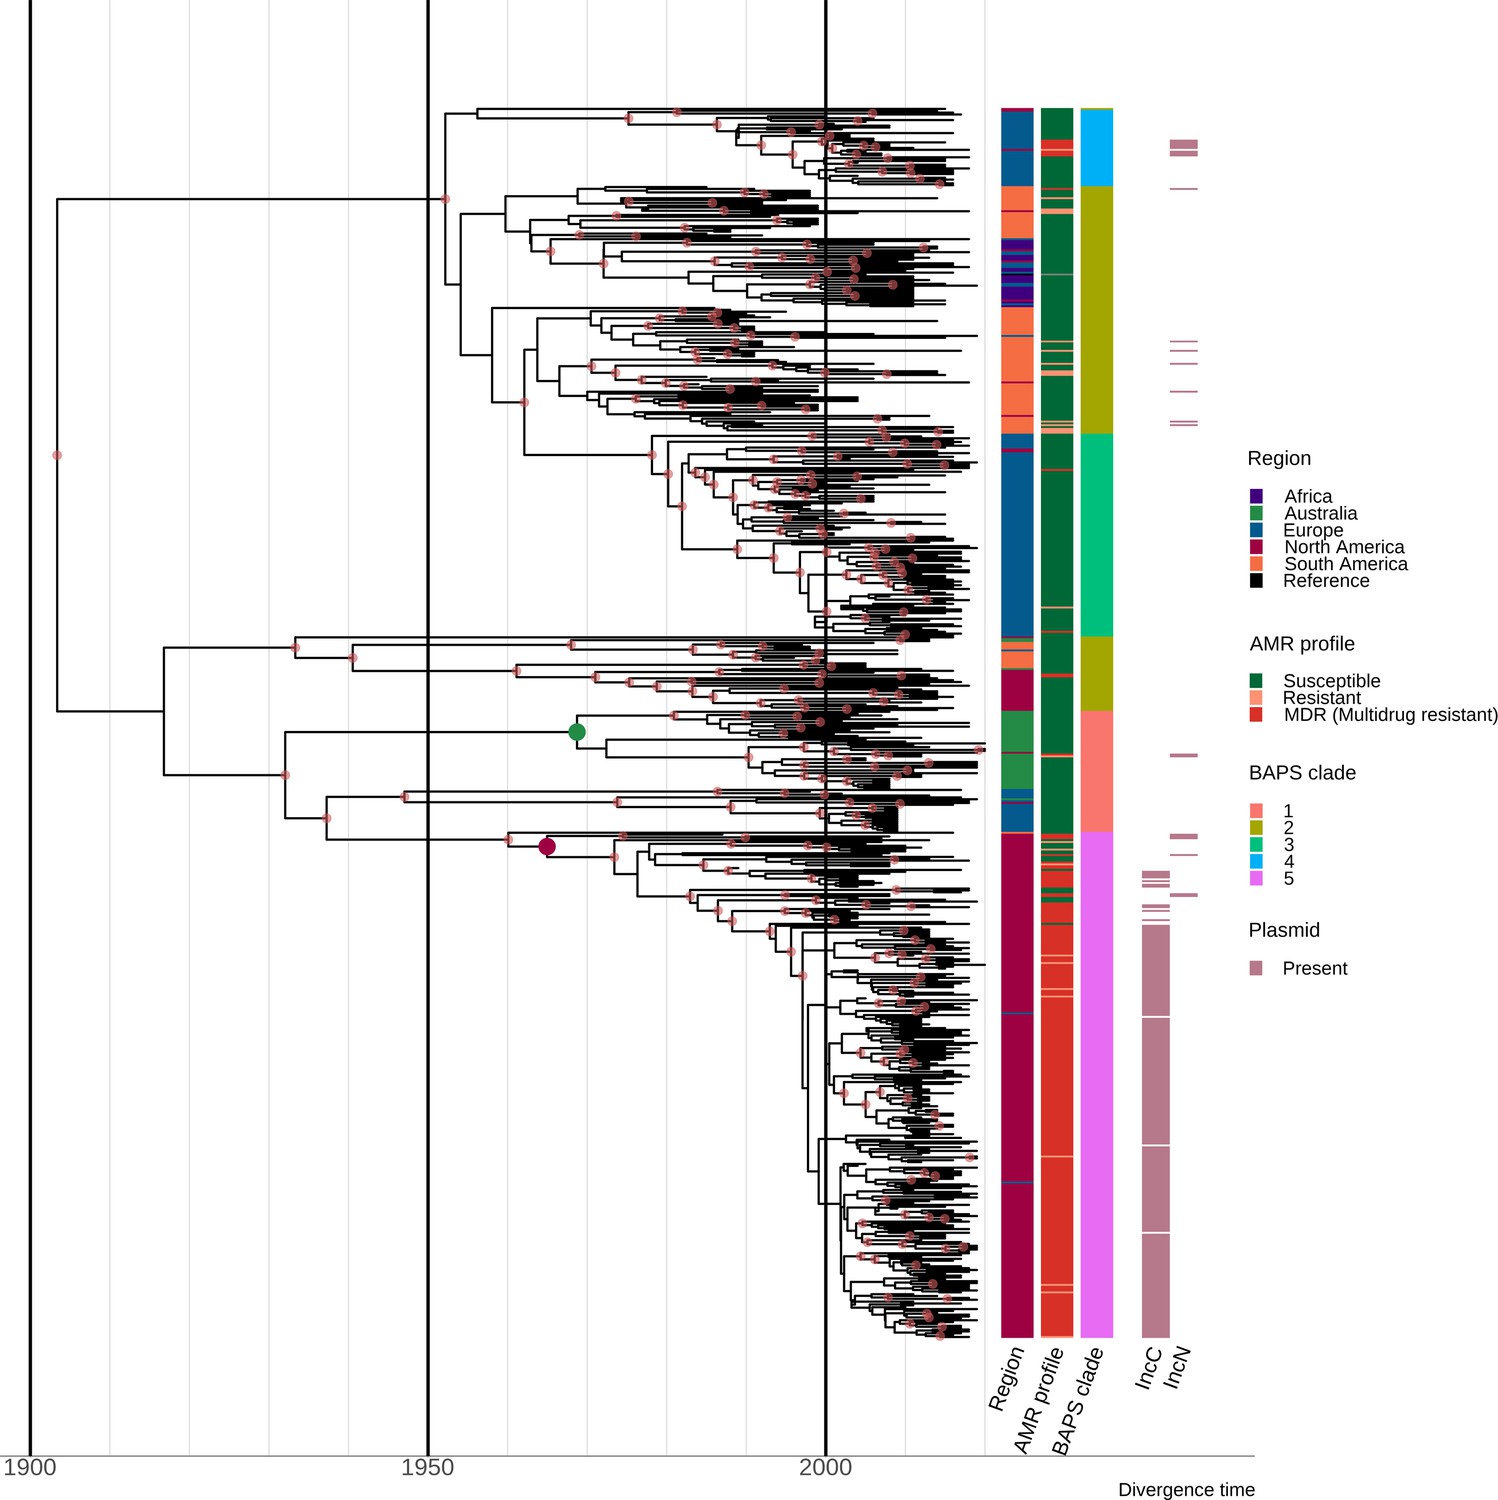
Estimation of divergence time.
Maximum clade credibility (MCC) tree of the 667 S. Dublin sequence type 10 (ST10) genomes. The time in years is shown on the x-axis. From left to right, the coloured heatmaps refer to the region of origin, the susceptibility profile, the Bayesian analysis of population structure (BAPS) clade, and the presence of IncC and IncN plasmid types. The green dot denotes the most recent common ancestor (MRCA) of the Australian subclade, while the maroon dot represents the MRCA of clade 5 multidrug-resistant (MDR) isolates from North America. Internal nodes coloured chestnut red have a posterior probability ≥0.95.
Figure 2—figure supplement 1
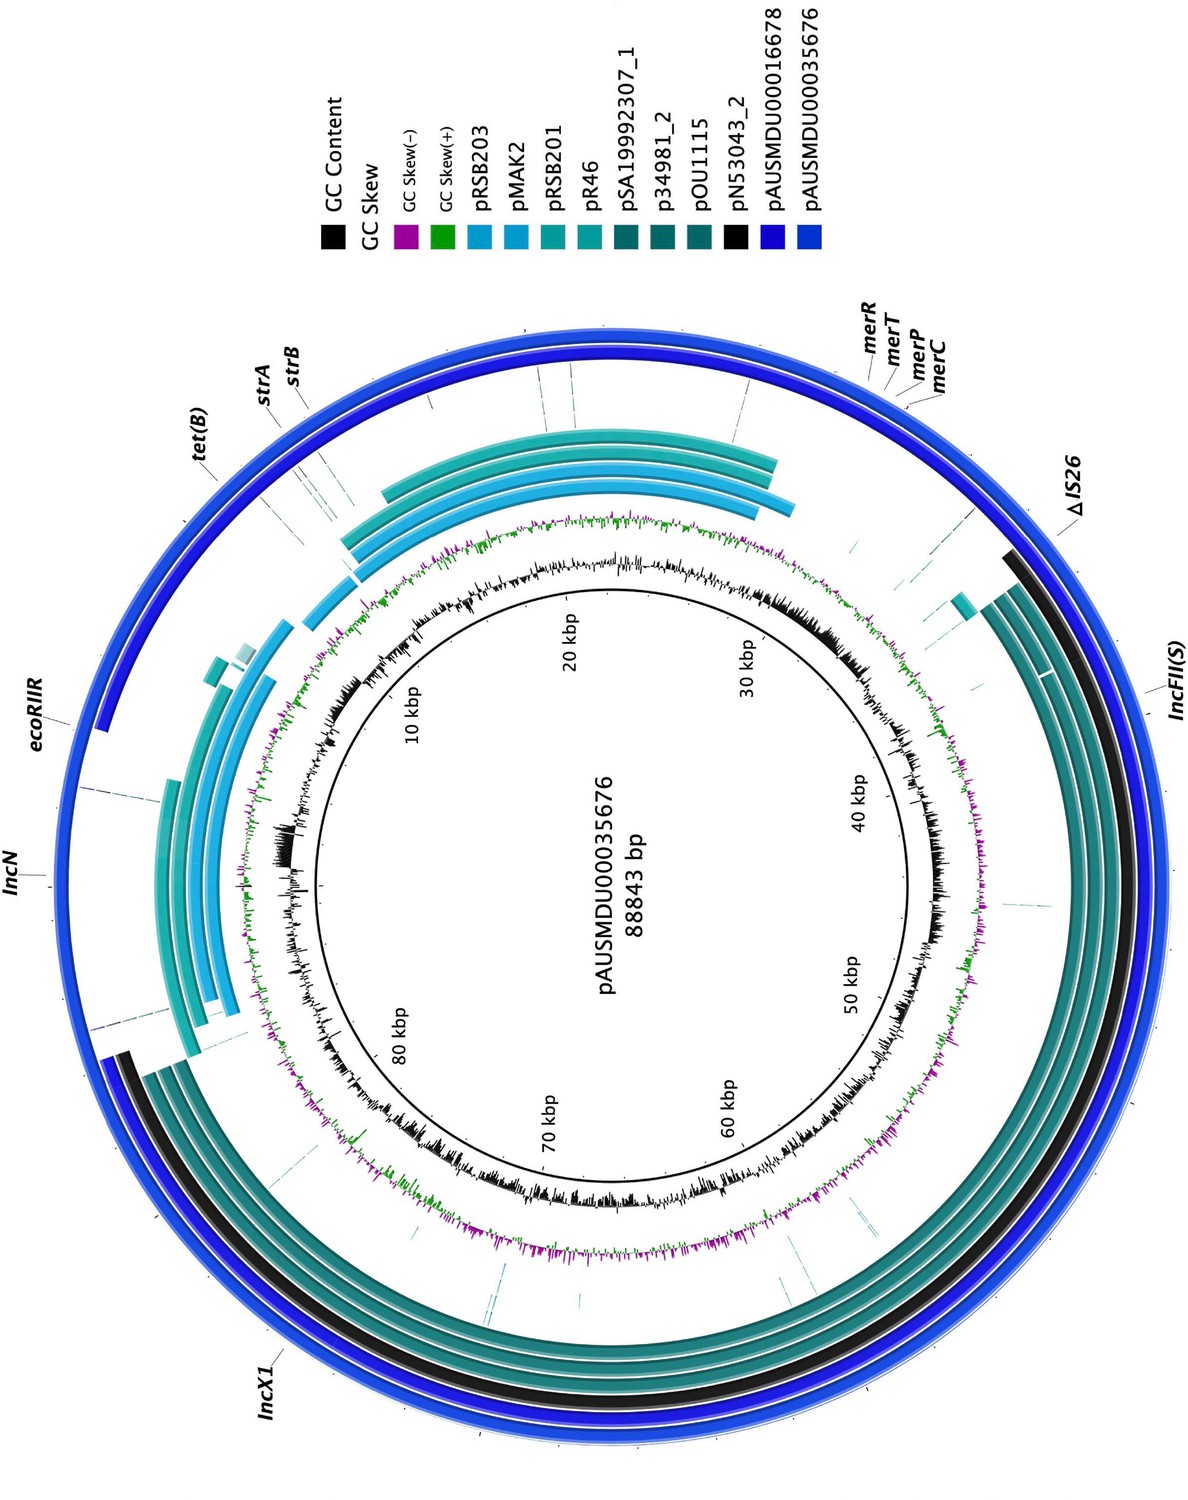
Comparison of plasmids from antimicrobial-resistant AUSMDU00035676 and AUSMDU00016678.
BRIG plots showing sequence homology between complete plasmid genomes from two Australian isolates AUSMDU00035676 (BioSample SAMN40405412) and AUSMDU00016678 (BioSample SAMN18617292). pAUSMDU00035676, a closed reference plasmid (88,843 bp), formed the outermost ring of the plot, while AUSMDU00016678 formed the subsequent ring. The three plasmid replicons, AMR, and heavy metal resistance (HMR) determinants detected in the plasmid are shown. Comparison plasmids include four IncN plasmids from serovars of Salmonella (pSRB203 [JN102342.1] and pSRB201 [JN102341.1] from S. enterica, pR46 [AY046276.1] from S. Typhimurium, and pMAK2 [AB366441.1] from S. Dublin) and four virulence plasmids from S. Dublin, pSA19992307_1 (CP030208.1), p34981_2 (CP032392.1), pOU1115 (DQ115388.2), and pN53043_2 (CP032386.1).
Figure 2—figure supplement 2
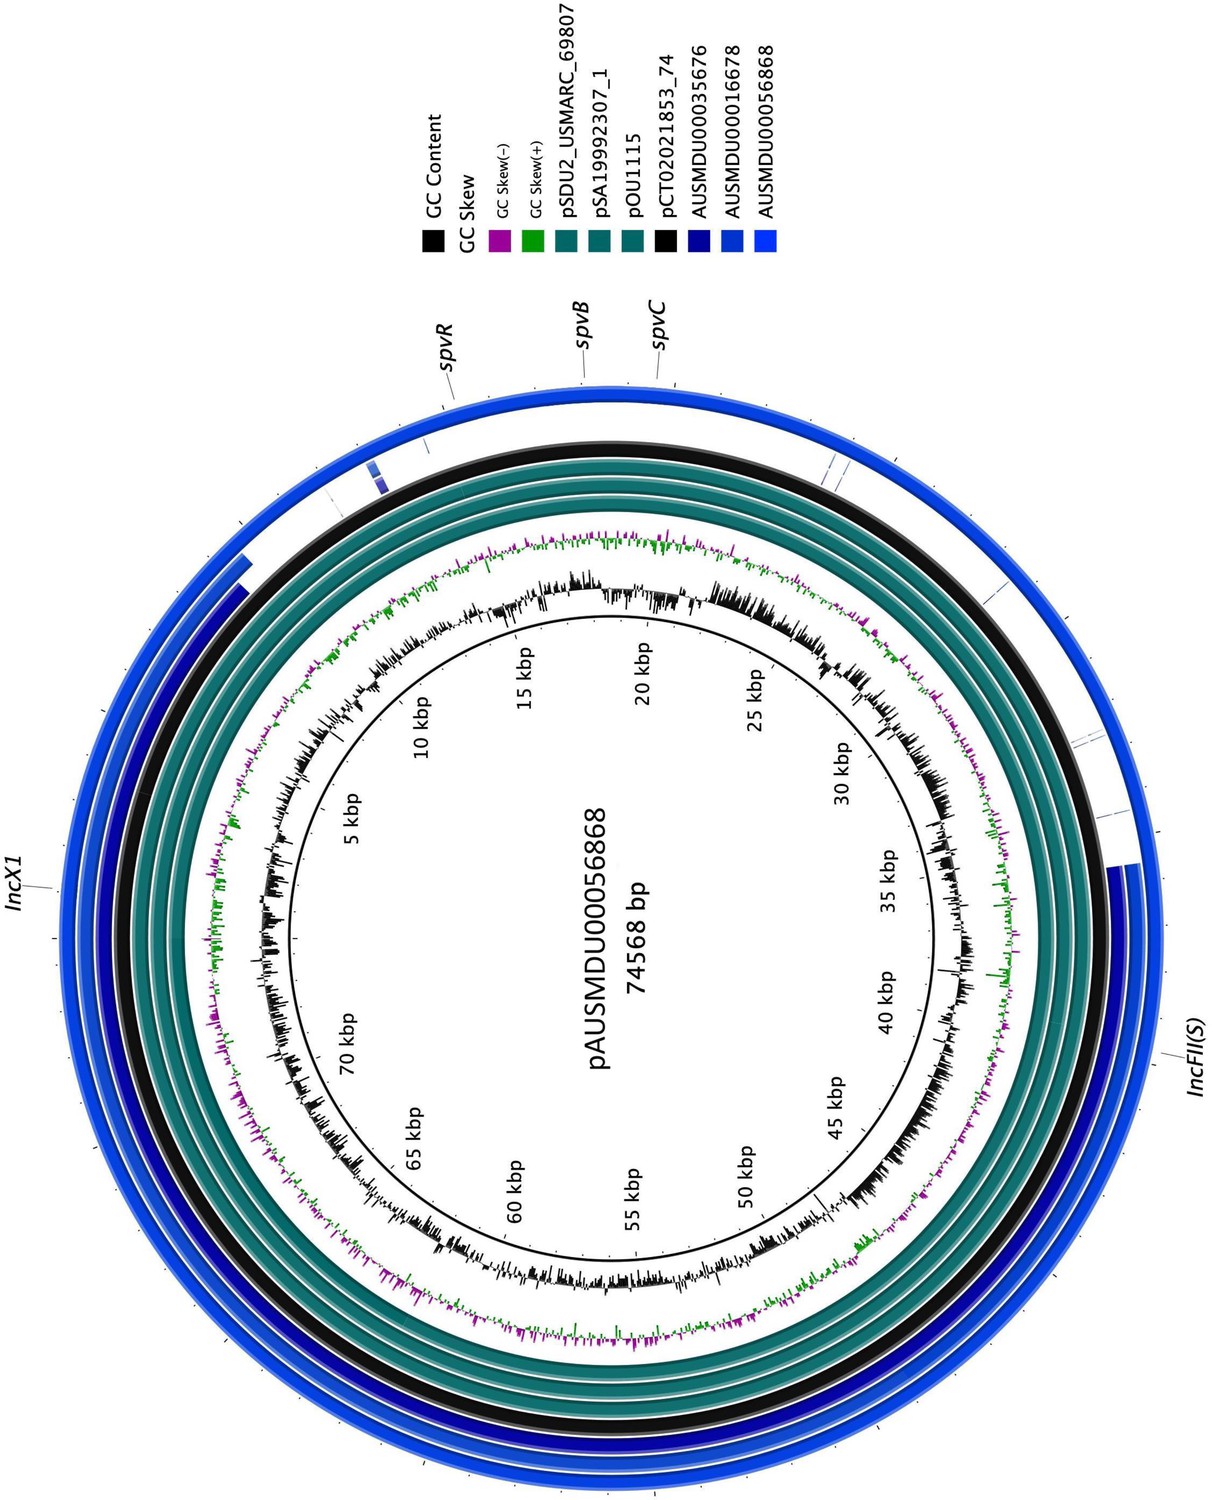
Plasmid assembly of a virulence plasmid identified in an S. Dublin sequence type 10 (ST10) isolate mapped to reference IncX1/IncFII(S) virulence plasmids.
Plasmid assembly of AUSMDU00056868 (74,568 bp), a fully susceptible ST10 isolate, aligned to pCT02021853_74 (CP001143.1, S. Dublin), pOU1115, pSA19992307_1, and pSDU2_USMARC_69807 (CP032381.1, S. Dublin).
Figure 3 with 3 supplements

Resistance profiles of S. Dublin genomes.
Observed resistance profiles of S. Dublin genomes spanning three time intervals for each region. (A) Frequency of susceptible and resistant S. Dublin genomes from each time period. (B) Antimicrobial resistance profiles observed spanning three time periods. The colour of the circle corresponds to an antimicrobial class, while the height is relative to the number of genomes. (C) Heavy metal and biocide resistance profiles observed. The colour of the circle corresponds to its respective heavy metal/biocide class, while the height is relative to the number of genomes.
Figure 3—figure supplement 1
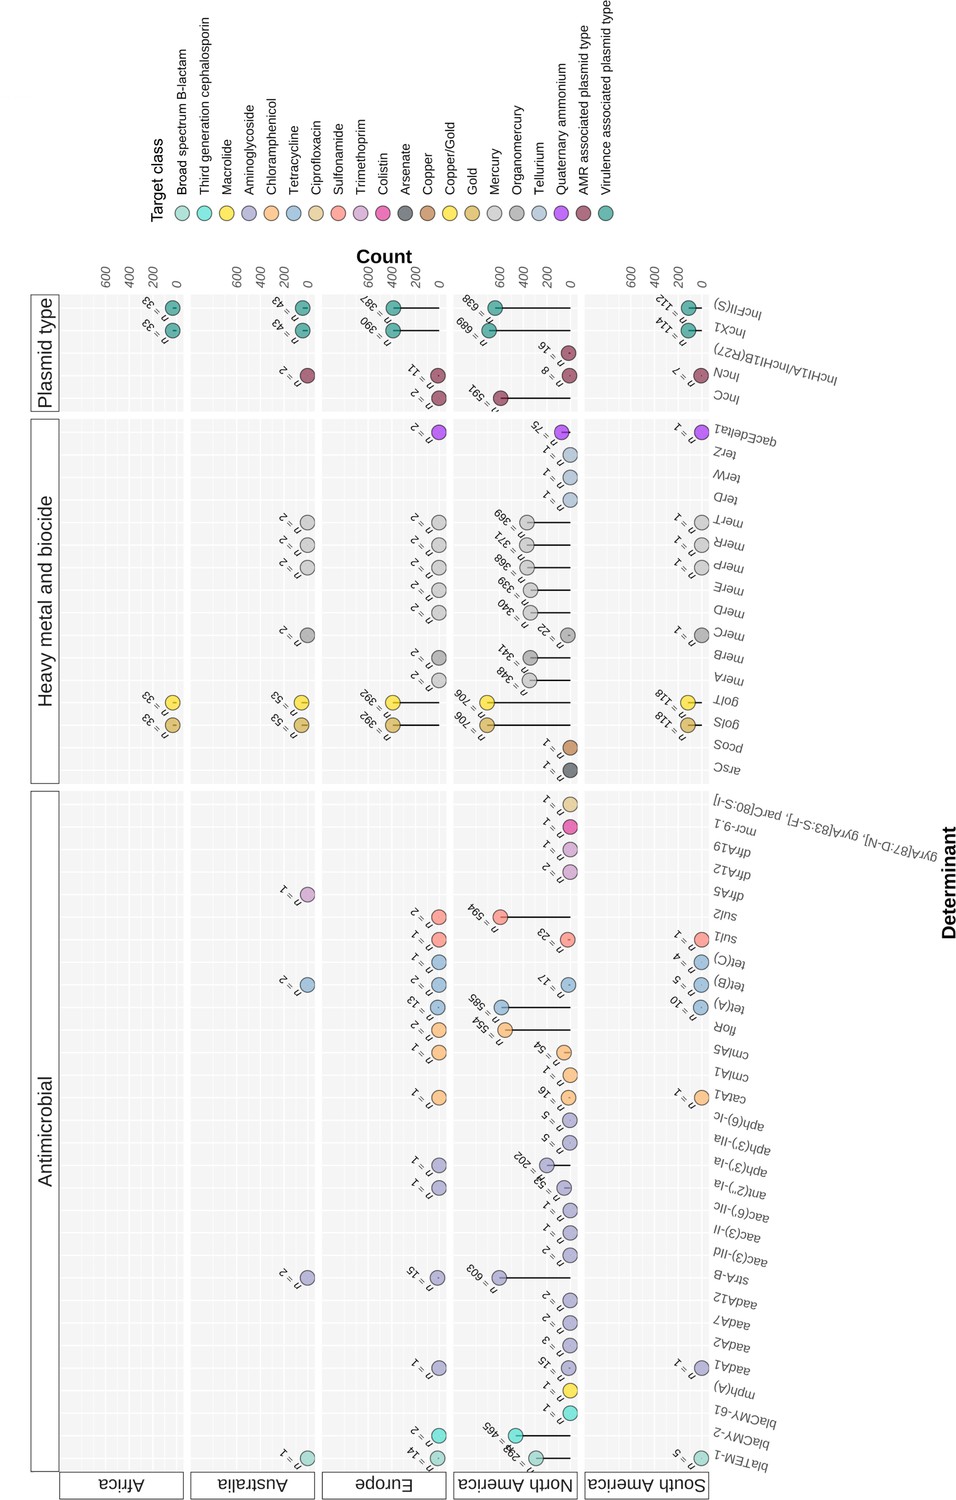
Resistant genotypic profiles of S. Dublin genomes.
Distribution of resistant determinants for each region. The number of genomes associated with AMR, heavy metal and biocide determinants, and selected plasmid replicons. Each heatmap is coloured according to the target determinant class. AMR, antimicrobial resistance.
Figure 3—figure supplement 2
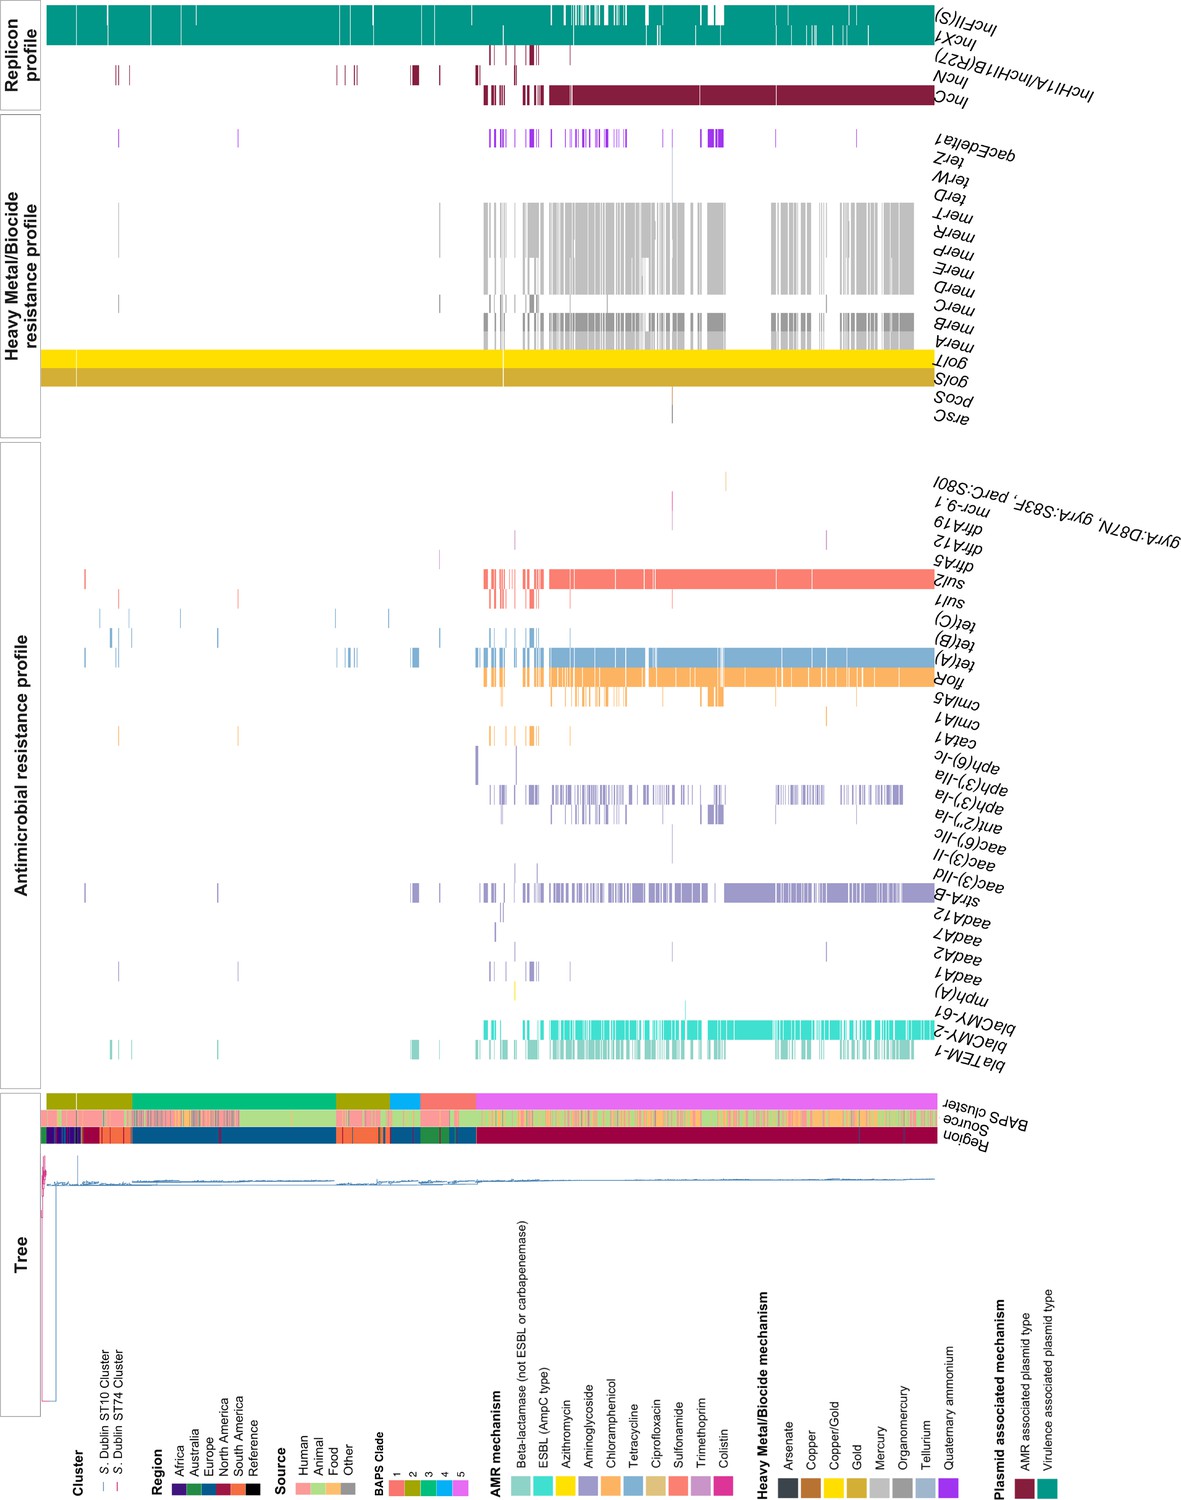
Distribution of resistance determinants in 1303 S. Dublin genomes.
The distribution of antimicrobial resistance determinants, heavy metal resistance determinants, biocide resistance determinants, and selected plasmid replicons detected are shown to the right of the maximum likelihood (ML) tree. Each heatmap is coloured according to the region, the source, Bayesian analysis of population structure (BAPs) cluster, the target resistance determinant, and the plasmid mechanism.
Figure 3—figure supplement 3
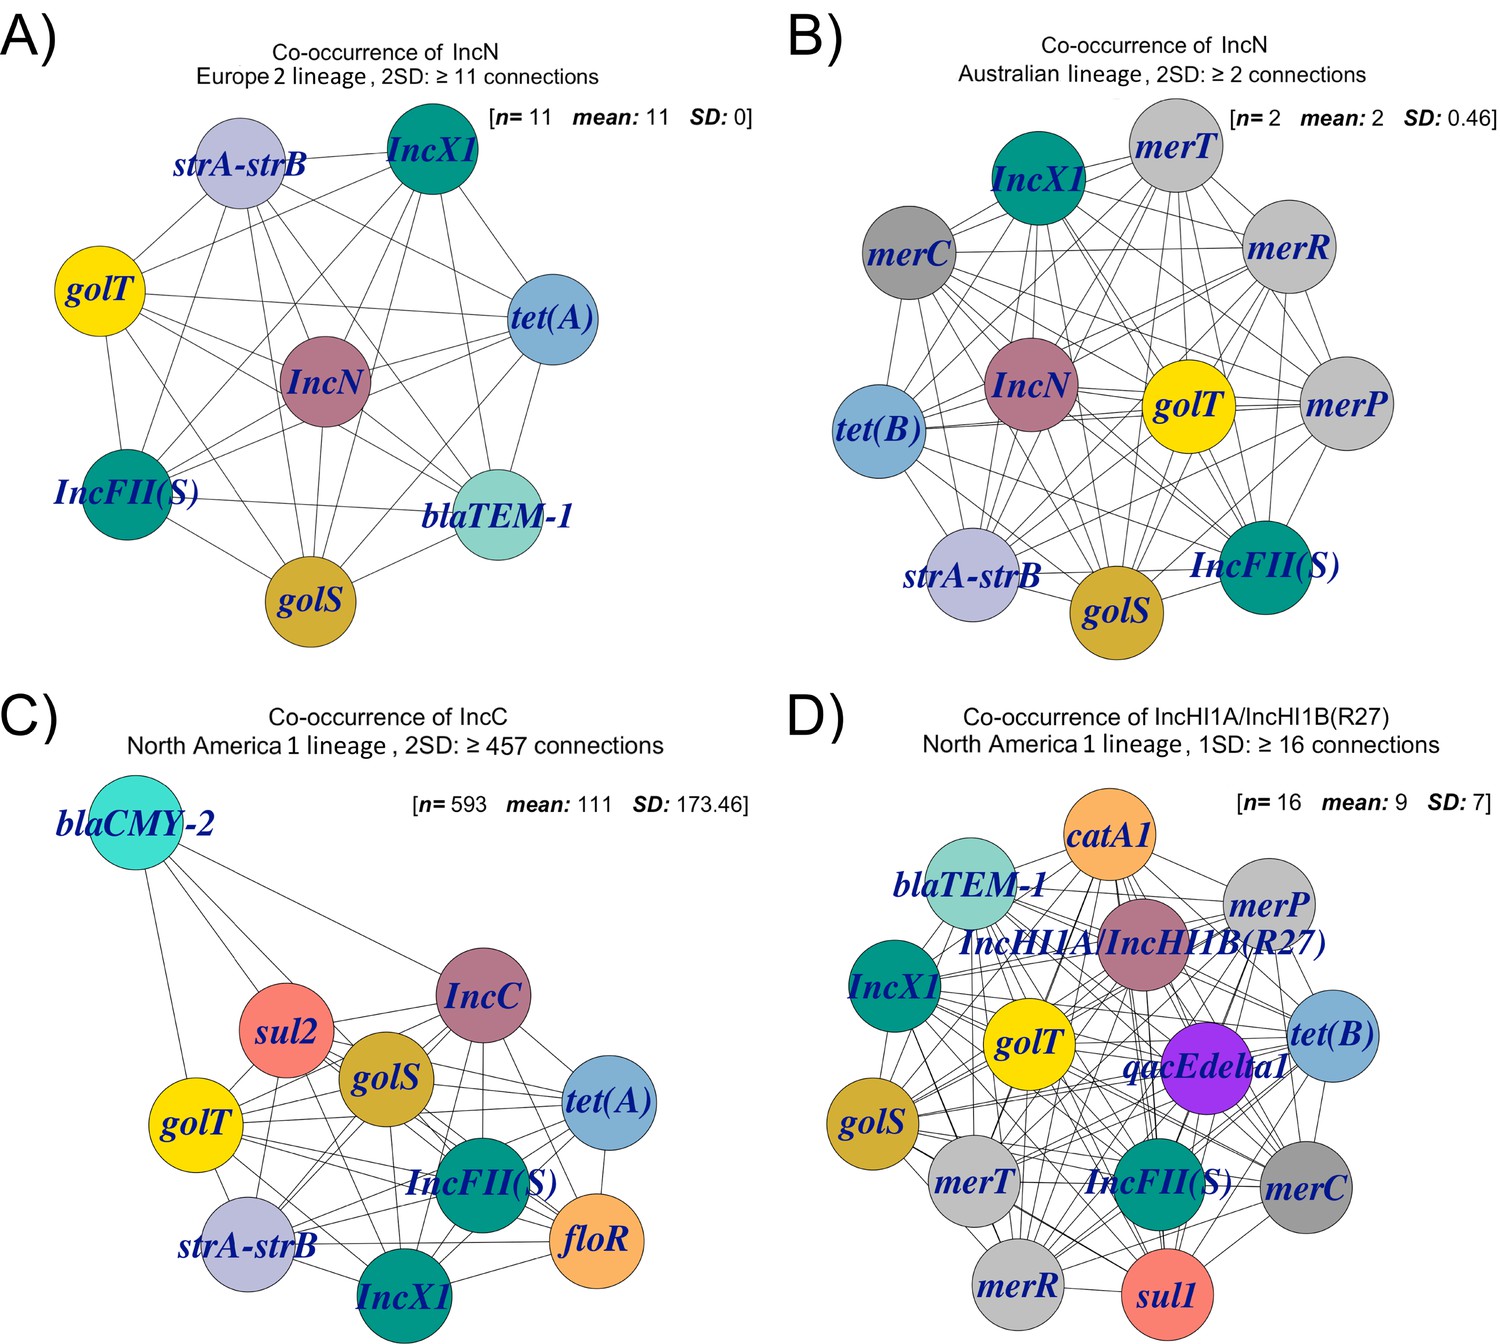
Co-occurrence networks of IncN and IncC resistant profiles.
The most common co-occurring resistant profiles observed for IncN and IncC plasmid types according to region. (A) Co-occurrence networks of European AMR genomes harbouring IncN. (B) Co-occurrence networks of Australian AMR genomes harbouring IncN. (C) Co-occurrence networks of S. Dublin genomes from North America harbouring IncC. (D) Co-occurrence networks of S. Dublin genomes from North America harbouring IncHI1A/IncHI1B(R27). The nodes represent the AMR determinants coloured according to their target determinant class, while the frequency of gene co-occurrence under a given standard deviation is represented by the edges.
Figure 4 with 4 supplements
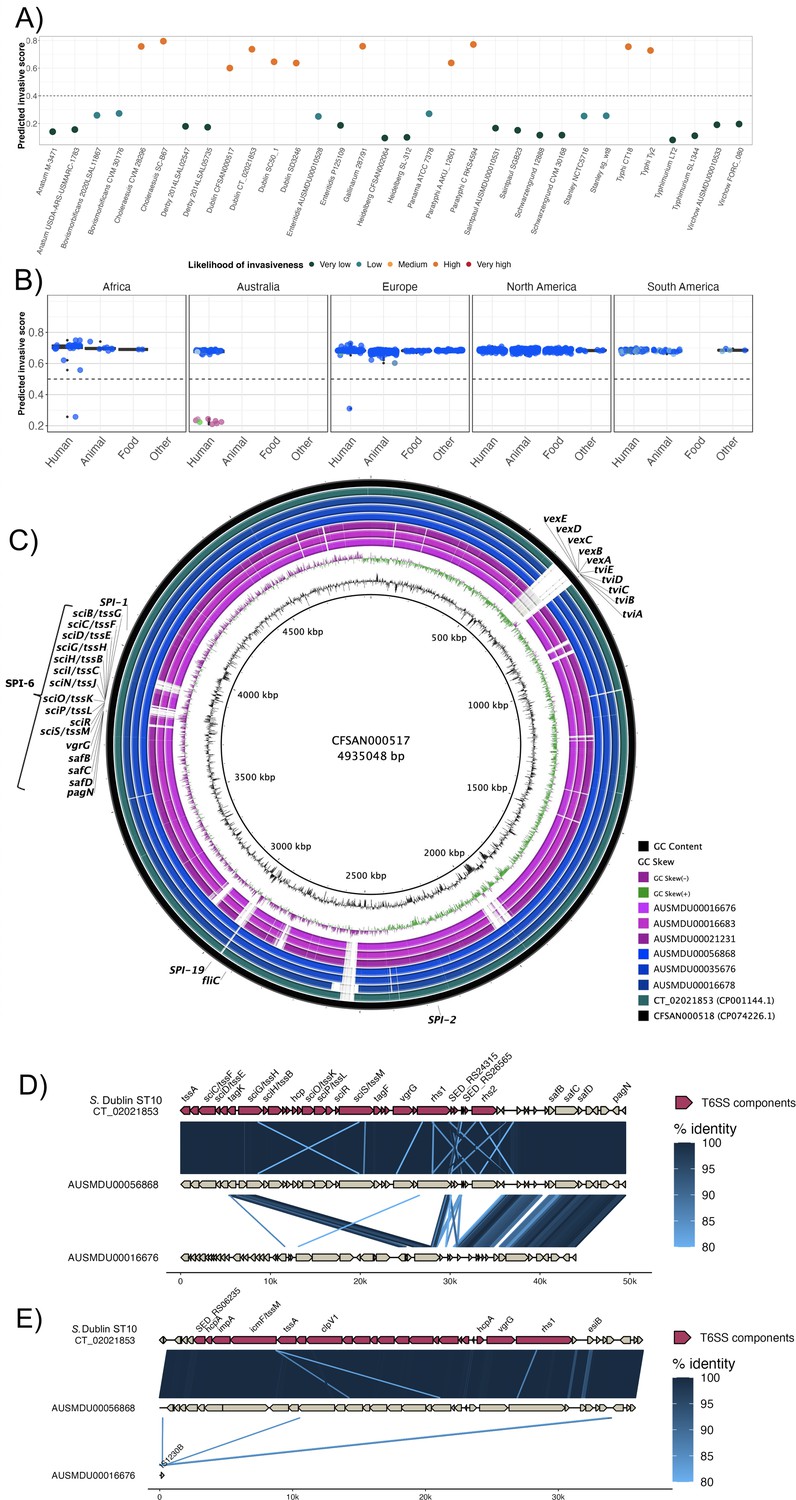
Invasive factors associated with S. Dublin genomes.
Correlation of Salmonella pathogenicity islands (SPIs) to S. Dublin’s invasiveness. (A) Validation of the likelihood of invasiveness prediction tool using a variety of publicly available genomes consisting of non-invasive and invasive Salmonella serovars (Supplementary file 1H). (B) The correlation of index scores to the source and its sequence type based on the region. * indicates a statistically significant p-value between the index scores of two sources. (C) Chromosomal assemblies of sequence type 10 (ST10) (blue) and ST74 (pink) genomes aligned to S. Dublin chromosomal reference CT_02021853 (CP001144.1) with a lower limit of 80% identity. (D) Aligned sequence of SPI-6 region of an ST10, AUSMDU00056868, and an ST74, AUSMDU00016676, in comparison to SPI-6 region of reference CT_02021853. (E) Aligned sequence of SPI-19 region of an ST10, AUSMDU00056868, and an ST74, AUSMDU00016676 in comparison to SPI-19 region of reference CT_02021853.
Figure 4—figure supplement 1
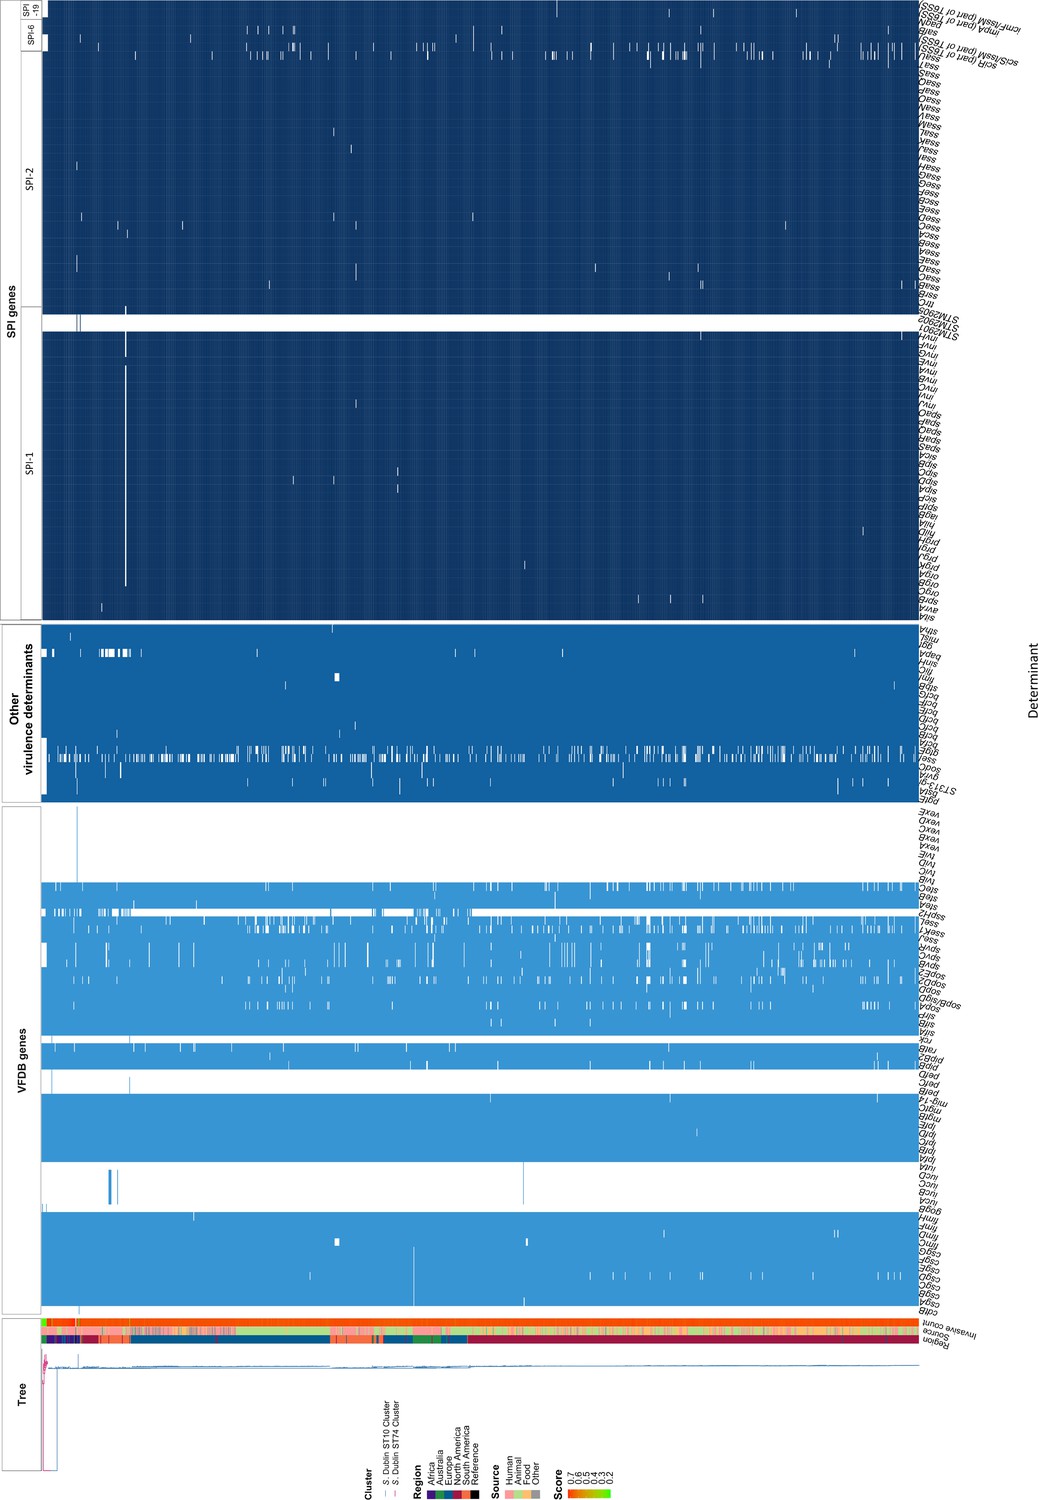
Population structure of S. Dublin genomes with genotypic invasive profiles.
Maximum likelihood (ML) tree of the 1303 is shown on the left. The invasive index score for each isolate is shown on the right of the tree. The presence of virulence determinants detected in individual genomes at a 90% coverage and 90% identity threshold is then shown to the right in a heatmap. These determinants are grouped based on whether they are from the VFDB, are curated from the literature as putative virulence determinants, or are SPI-related genes. The type VI secretion system (T6SS) region in SPI-6 includes four genes and intergenic region, and the T6SS region in SPI-19 includes two genes and the intergenic region. SPI, Salmonella pathogenicity island; VFDB, virulence factor database.
Figure 4—figure supplement 2
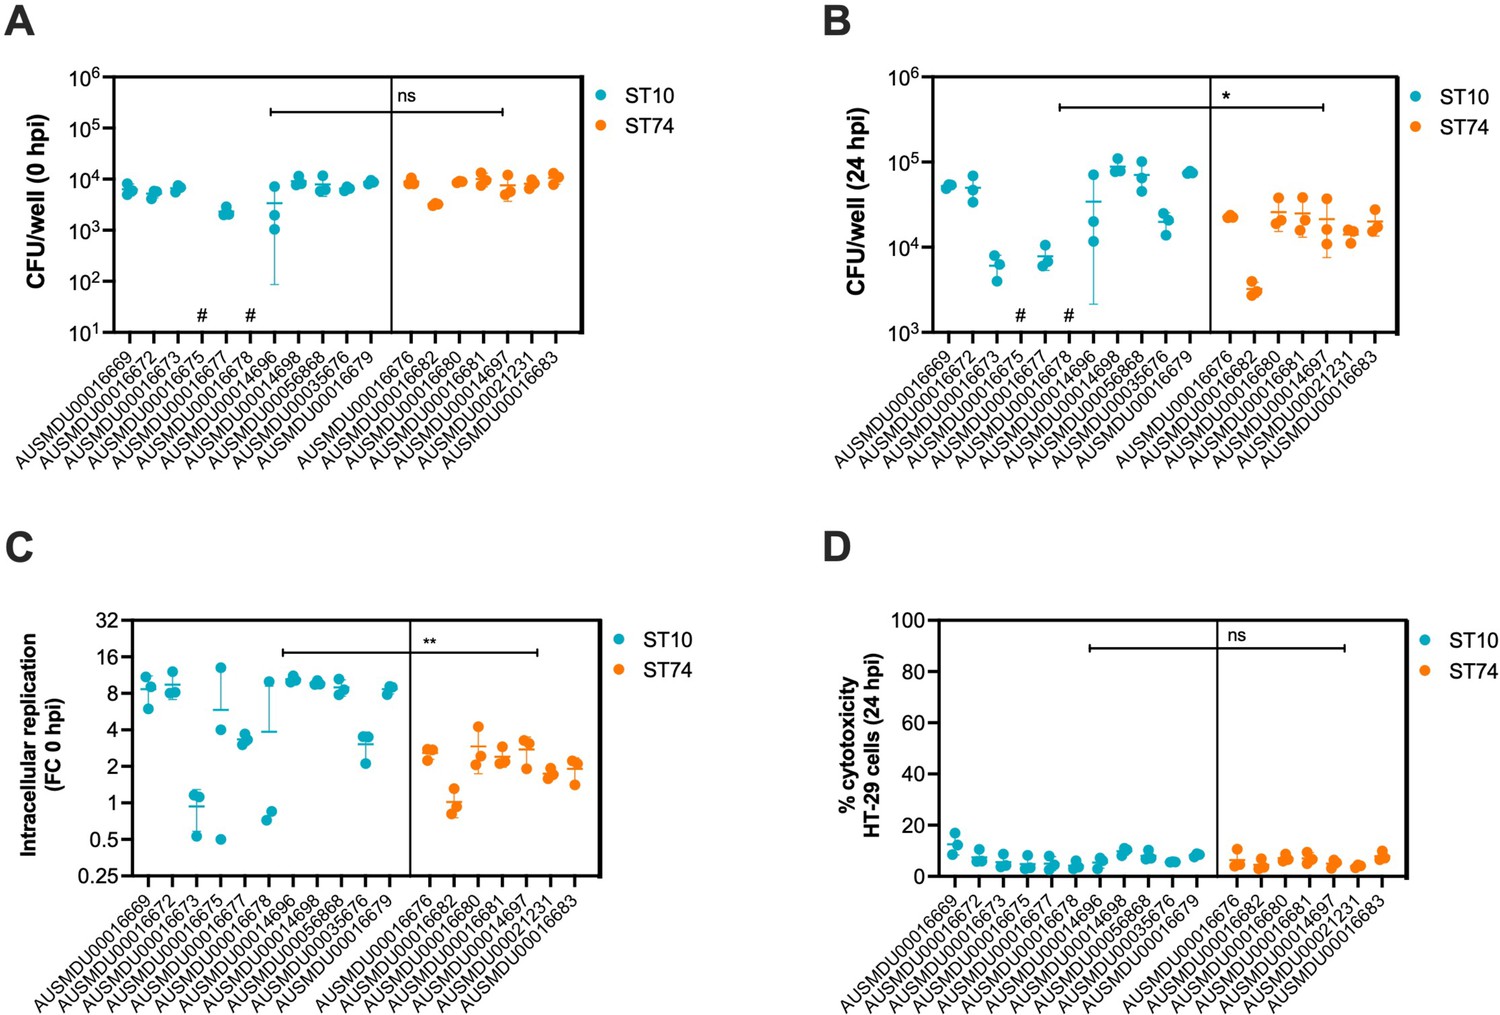
Replication dynamics and host cell cytotoxicity induced by S. Dublin ST74 and sequence type 10 (ST10) lineage isolates in HT-29 cells.
(A, B) HT-29 (human intestinal epithelial) cells were infected at an MOI of 10 with representative S. Dublin ST74 or ST10 lineage isolates (Supplementary file 1J). HT-29 cells were lysed, and intracellular bacteria enumerated as CFU/well at the start of infection (0 hpi) and 24 hpi. Each dot represents CFU/well of a biological replicate (performed in technical triplicate), with error bars indicating ±1 standard deviation of n=3 biological replicates. (C) Each dot represents fold change in CFU/well in HT-29 cells (compared to time = 0) of biological replicate (performed in technical duplicate), with error bars indicating ±1 standard deviation of n=3 biological replicates. (D) Cell supernatants were assayed for LDH as a measure of cytopathic effects of infection, and % cytotoxicity was calculated by comparison with 100% lysed uninfected control cells. Samples were collected from HT-29 cells at 24 hpi. Each point represents the % cytotoxicity of a biological replicate (performed in technical triplicate), with error bars indicating ±1 standard deviation of n=3 biological replicates. Statistical significance was determined by nested t-test. MOI, multiplicity of infection, hpi, hours post-infection, CFU, colony-forming units, LDH, lactate dehydrogenase, # represents bacterial counts that were below the limit of detection.
Figure 4—figure supplement 3
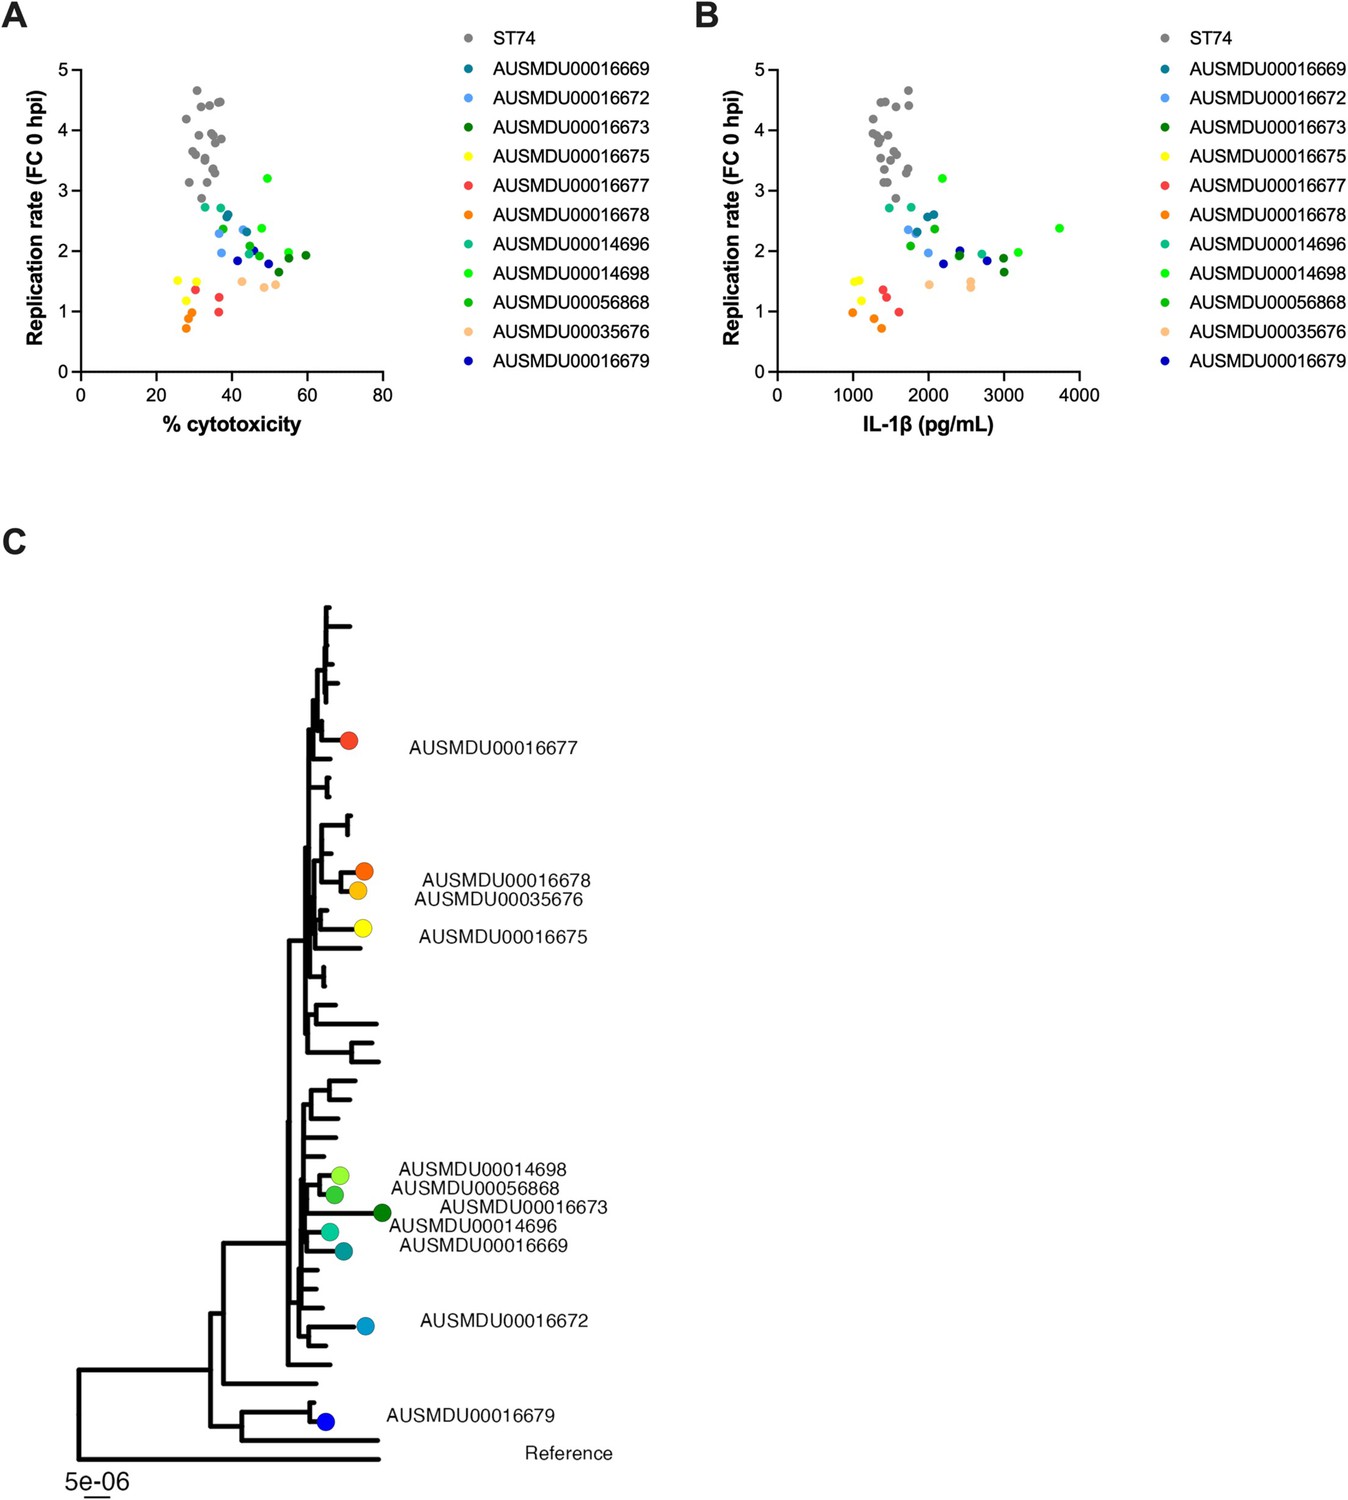
Dot plots comparing bacterial replication and cell death induced by S. Dublin ST74 and sequence type 10 (ST10) lineage isolates in THP-1 cells.
(A) Replication and % cytotoxicity data and (B) replication and IL-1β release data were compared on a scatter plot for all S. Dublin isolates assayed to show the variation in phenotypic characteristics within the ST10 lineage. Each dot represents one biological replicate (of three) and is coloured according to isolate shown in (C).
Figure 4—figure supplement 4
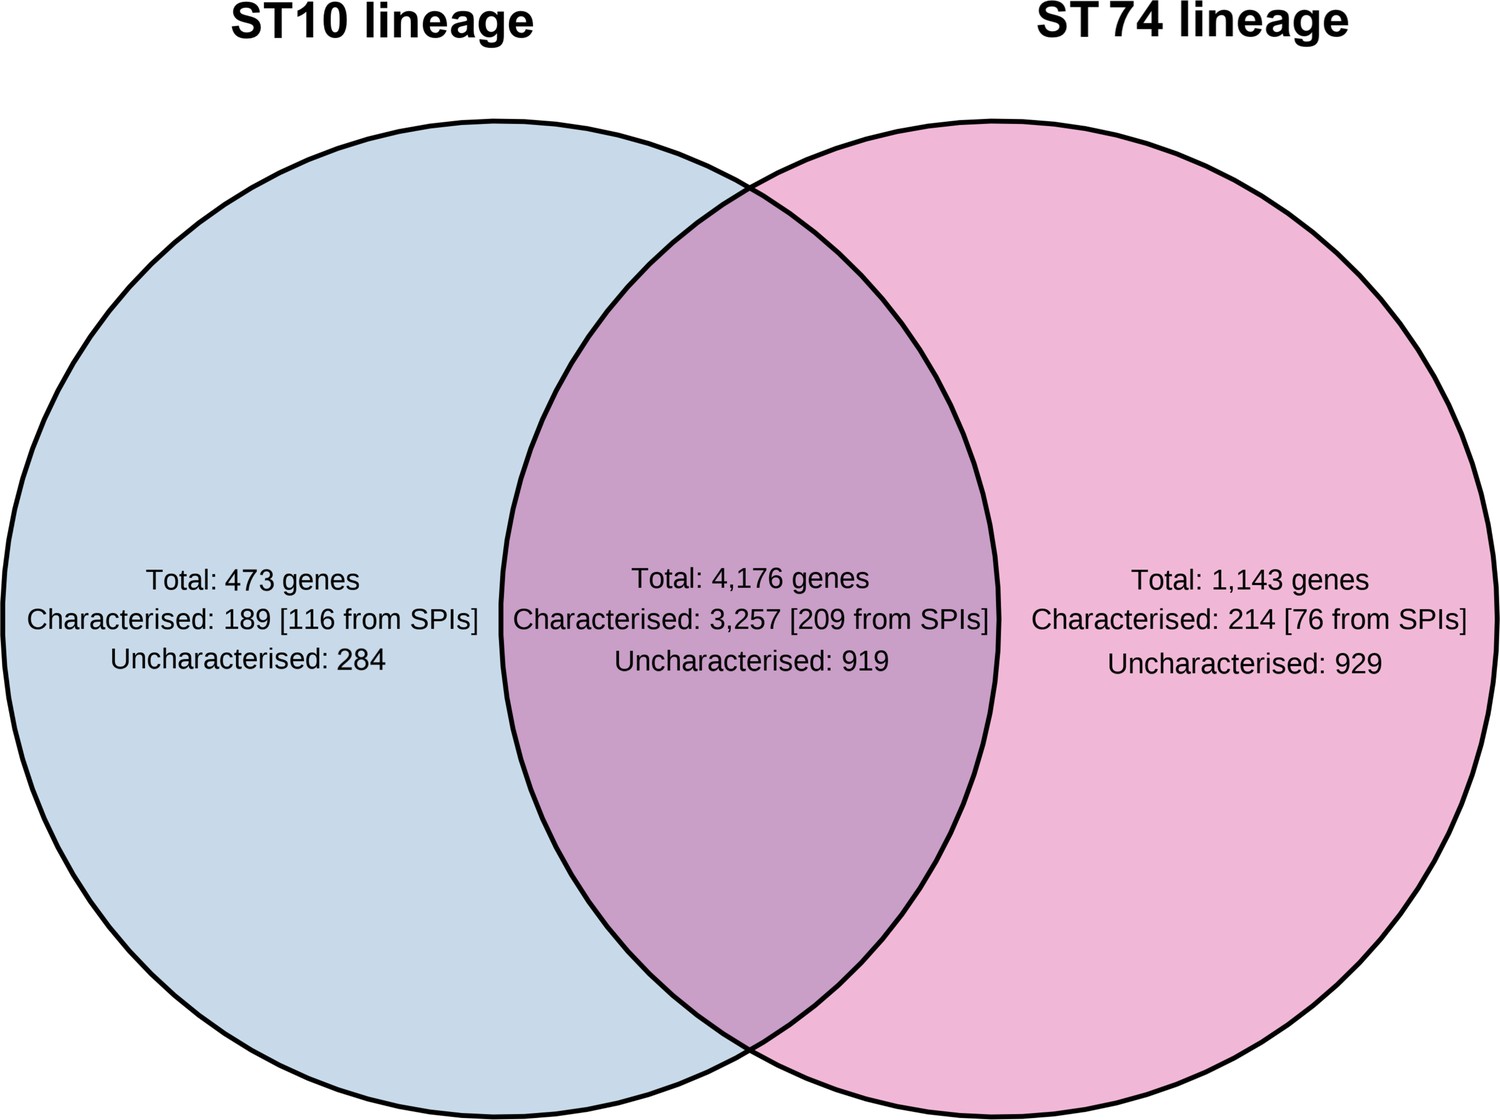
Pangenome visualisation of gene content of sequence type 10 (ST10) and ST74 lineages.
Venn diagram of gene content of two S. Dublin lineages, ST74 (n=7) and ST10 (clade 1) (n=10).
Figure 5

Dublin ST74 isolates demonstrate increased intracellular replication in human macrophages over sequence type 10 (ST10) isolates.
Differentiated THP-1 (human monocyte) cells were infected at an MOI of 10 with selected ST10 and ST74 S. Dublin isolates. (A, B) THP-1 cells were lysed, and intracellular bacteria enumerated as fold change in replication and (C–F) CFU/well at time 0, 3, 9, and 24 hpi. For (A), each measurement at times 3, 9, and 24 hpi represents the fold change in CFU/well compared to 0 hpi, the start of infection, recorded as a biological replicate (performed in technical triplicate), with error bars indicating ±1 standard deviation of n=3 biological replicates. For (C–D), each dot represents CFU/well of a biological replicate (performed in technical triplicate), with error bars indicating ±1 standard deviation of n=3 biological replicates. Statistical significance was determined by nested Student’s t-test. MOI, multiplicity of infection, hpi, hours post-infection, CFU, colony-forming units, FC, fold change.
Figure 6
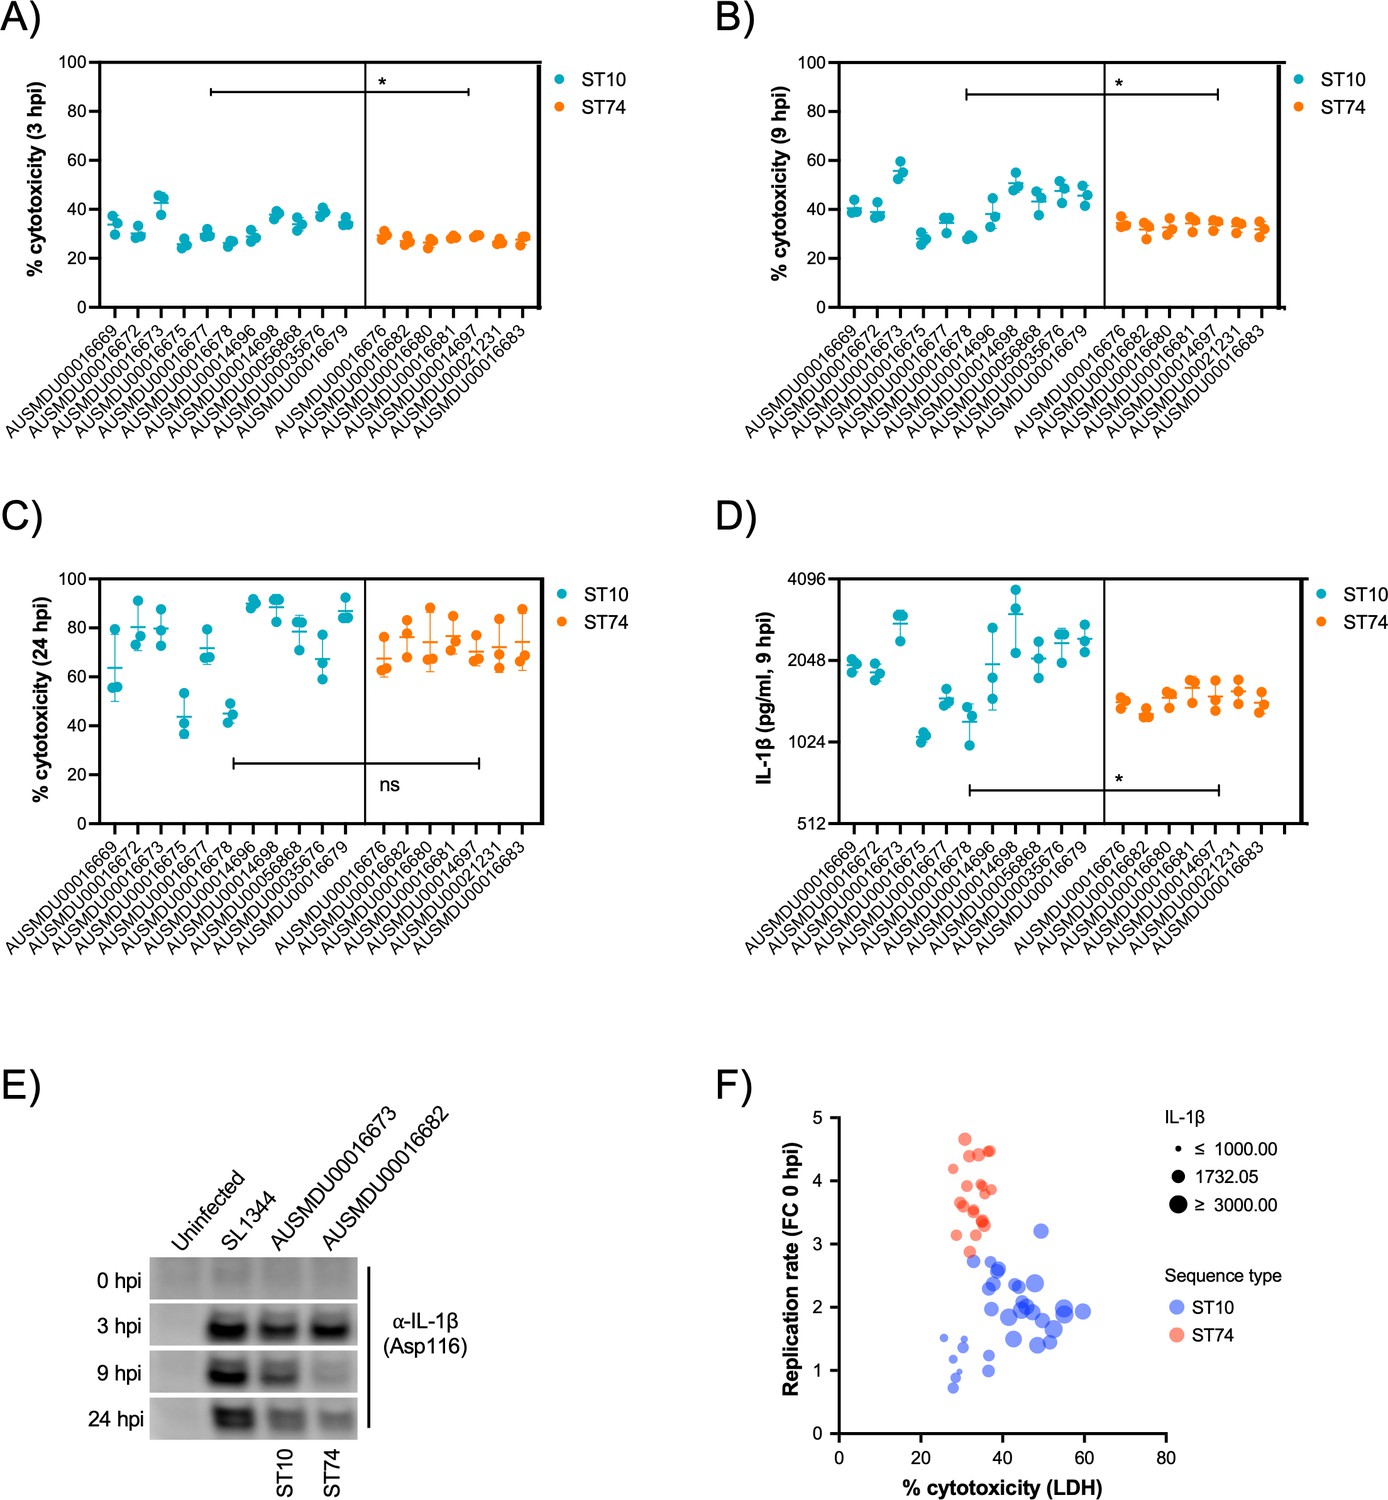
S. Dublin ST74 isolates induce comparable cytotoxicity to sequence type 10 (ST10) isolates in human macrophages, despite increased intracellular growth.
(A–C) Cell supernatants were assayed for LDH as a measure of cytopathic effects of infection, and % cytotoxicity was calculated by comparison with 100% lysed uninfected control cells. Samples were collected from THP-1 cells at 3, 9, and 24 hpi. Each point represents the % cytotoxicity of a biological replicate (performed in technical triplicate), with error bars indicating ±1 standard deviation of n=3 biological replicates. Statistical significance was determined by nested Student’s t-test. (D) IL-1β secretion from THP-1 cells infected for 9 hr with S. Dublin isolates. Error bars indicate ±1 standard deviation of n=3 biological replicates and statistical significance determined by Student’s t-test. (E) Immunoblot of cleaved IL-1β (Asp166) in THP-1 cell lysates infected with S. Typhimurium reference strain SL1344, S. Dublin ST10 (AUSMDU00016673), or S. Dublin ST74 (AUSMDU00016682) over 0, 3, 8, and 24 hr. (F) Scatter plot comparing replication rate, % cytotoxicity, and IL-1β secretion from THP-1 cells infected with S. Dublin isolates at 9 hpi. Each dot represents each biological replicate of three (averaged from three technical replicates). MOI, multiplicity of infection, hpi, hours post-infection, CFU, colony-forming units, LDH, lactate dehydrogenase.
-
Figure 6—source data 1
Uncropped TIFF image for Figure 6E immunoblots.
- https://cdn.elifesciences.org/articles/102253/elife-102253-fig6-data1-v1.tif
-
Figure 6—source data 2
Uncropped TIFF image for Figure 6E in PowerPoint format with labelling of cleaved caspase-8 bands and time course of infection indicated.
- https://cdn.elifesciences.org/articles/102253/elife-102253-fig6-data2-v1.pptx
Tables
Appendix 1—key resources table
| Reagent type (species) or resource | Designation | Source or reference | Identifiers | Additional information |
|---|---|---|---|---|
| Strain, strain background (Salmonella enterica serovar Dublin) | ST10 strain used in phenotypic assays - this study. | Microbiological Diagnostic Unit, University of Melbourne | AUSMDU00014696 | Sample type: blood |
| Strain, strain background (Salmonella enterica serovar Dublin) | ST10 strain used in phenotypic assays - this study. | Microbiological Diagnostic Unit, University of Melbourne | AUSMDU00014698 | Sample type: faeces |
| Strain, strain background (Salmonella enterica serovar Dublin) | ST10 strain used in phenotypic assays - this study. | Microbiological Diagnostic Unit, University of Melbourne | AUSMDU00016669 | Sample type: blood |
| Strain, strain background (Salmonella enterica serovar Dublin) | ST10 strain used in phenotypic assays - this study. | Microbiological Diagnostic Unit, University of Melbourne | AUSMDU00016672 | Sample type: blood |
| Strain, strain background (Salmonella enterica serovar Dublin) | ST10 strain used in phenotypic assays - this study. | Microbiological Diagnostic Unit, University of Melbourne | AUSMDU00016673 | Sample type: faeces |
| Strain, strain background (Salmonella enterica serovar Dublin) | ST10 strain used in phenotypic assays - this study. | Microbiological Diagnostic Unit, University of Melbourne | AUSMDU00016675 | Sample type: blood |
| Strain, strain background (Salmonella enterica serovar Dublin) | ST10 strain used in phenotypic assays - this study. | Microbiological Diagnostic Unit, University of Melbourne | AUSMDU00016677 | Sample type: blood |
| Strain, strain background (Salmonella enterica serovar Dublin) | ST10 strain used in phenotypic assays - this study. | Microbiological Diagnostic Unit, University of Melbourne | AUSMDU00016678 | Sample type: blood |
| Strain, strain background (Salmonella enterica serovar Dublin) | ST10 strain used in phenotypic assays - this study. | Microbiological Diagnostic Unit, University of Melbourne | AUSMDU00035676 | Sample type: blood |
| Strain, strain background (Salmonella enterica serovar Dublin) | ST10 strain used in phenotypic assays - this study. | Microbiological Diagnostic Unit, University of Melbourne | AUSMDU00056868 | Sample type: faeces |
| Strain, strain background (Salmonella enterica serovar Dublin) | ST4293 strain used in phenotypic assays - this study. | Microbiological Diagnostic Unit, University of Melbourne | AUSMDU00016679 | Sample type: urine |
| Strain, strain background (Salmonella enterica serovar Dublin) | ST74 strain used in phenotypic assays - this study. | Microbiological Diagnostic Unit, University of Melbourne | AUSMDU00014697 | Sample type: faeces |
| Strain, strain background (Salmonella enterica serovar Dublin) | ST74 strain used in phenotypic assays - this study. | Microbiological Diagnostic Unit, University of Melbourne | AUSMDU00016676 | Sample type: faeces |
| Strain, strain background (Salmonella enterica serovar Dublin) | ST74 strain used in phenotypic assays - this study. | Microbiological Diagnostic Unit, University of Melbourne | AUSMDU00016680 | Sample type: faeces |
| Strain, strain background (Salmonella enterica serovar Dublin) | ST74 strain used in phenotypic assays - this study. | Microbiological Diagnostic Unit, University of Melbourne | AUSMDU00016681 | Sample type: faeces |
| Strain, strain background (Salmonella enterica serovar Dublin) | ST74 strain used in phenotypic assays - this study. | Microbiological Diagnostic Unit, University of Melbourne | AUSMDU00016682 | Sample type: faeces |
| Strain, strain background (Salmonella enterica serovar Dublin) | ST74 strain used in phenotypic assays - this study. | Microbiological Diagnostic Unit, University of Melbourne | AUSMDU00021231 | Sample type: faeces |
| Strain, strain background (Salmonella enterica serovar Dublin) | ST1545 strain used in phenotypic assays - this study. | Microbiological Diagnostic Unit, University of Melbourne | AUSMDU00016683 | Sample type: faeces |
| Cell line (Homo sapiens) | THP-1, human monocyte | ATCC | ATCC TIB-202 | Cell line maintained in J. Pearson’s lab. |
| Cell line (Homo sapiens) | HT-29, human colonic epithelial | ATCC | ATCC HTB-38 | Cell line maintained in J. Pearson’s lab. |
| Antibody | anti-IL-1β (Asp 116), clone D3A3Z | Cell Signaling | Cat# 83186 | WB (1:1000) |
| Commercial assay or kit | CtyoTox 96 Non-radioactive Cytotoxicity Assay Kit | Promega | Cat#G1780 | |
| Commercial assay or kit | Pierce BCA Protein Assay Kit | Thermo Fisher Scientific | Cat#23225 | |
| Commercial assay or kit | DuoSet Human IL-1β/IL-1F2 ELISA | R&D Systems | Cat#DY201 | |
| Commercial assay or kit | Virus/Pathogen DSP midi kit | QIAGEN | Cat#937055 | |
| Commercial assay or kit | Ligation sequencing kit | Oxford Nanopore Technologies | Cat#SQK-LSK109 | |
| Software | Nullarbor pipeline | https://github.com/tseemann/nullarbor | v2.0.20191013 | |
| Software | Skesa | https://github.com/ncbi/SKESA | v2.4.0 skesa (RRID:SCR_024341) | |
| Software | mlst | https://github.com/tseemann/mlst | v2.19.0 MLST (RRID:SCR_010245) | |
| Software | Kraken | https://github.com/DerrickWood/kraken | v1.1.1 Kraken (RRID:SCR_005484) | |
| Software | Snippy | https://github.com/tseemann/snippy | v4.6.0 Snippy (RRID:SCR_023572) | |
| Software | Salmonella in silico Typing Resource (SISTR) | https://github.com/phac-nml/sistr_cmd | v1.1.1 sistr (RRID:SCR_024342) | |
| Software | Antimicrobial Resistance Identification by Assembly (ARIBA) | https://github.com/sanger-pathogens/ariba/tree/master | v2.14.5 Ariba (RRID:SCR_015976) | |
| Software | Prokka | https://github.com/tseemann/prokka | v1.14.6 Prokka (RRID:SCR_014732) | |
| Software | snippy-core | https://github.com/tseemann/snippy | v4.6.0 Snippy (RRID:SCR_023572) | |
| Software | Phaster | https://phaster.ca/ | v2020-12-22 | |
| Software | Gubbins | https://github.com/nickjcroucher/gubbins | v2.4.1 Gubbins (RRID:SCR_016131) | |
| Software | iqtree-calc_const_sites.sh | https://github.com/MDU-PHL/mdu-tools/blob/master/bin/iqtree-calc_const_sites.sh | IQ-TREE (RRID:SCR_017254) | |
| Software | IQ-TREE | http://www.iqtree.org/ | v2.1.0 IQ-TREE (RRID:SCR_017254) | |
| Software | ggtree | https://github.com/YuLab-SMU/ggtree | v2.3.3 ggtree (RRID:SCR_018560) | |
| Software | rhierBAPS | https://github.com/gtonkinhill/rhierbaps | v1.1.3 | |
| Software | AbriTAMR | https://github.com/MDU-PHL/abritamr | v0.2.2 | |
| Software | AMRFinder | https://github.com/ncbi/amr | v3.8.4 | |
| Software | ABRicate | https://github.com/tseemann/abricate | v1.0.1 Abricate (RRID:SCR_021093) | |
| Software | igraph | https://igraph.org/ | v1.2.4.1 igraph (RRID:SCR_019225) | |
| Software | invasive_Salmonella developed in 2018 | https://github.com/Gardner-BinfLab/invasive_salmonella | ||
| Software | BEAST | https://beast.community/ | v1.10.4 BEAST (RRID:SCR_010228) | |
| Software | TempEst | https://beast.community/ | v1.5.3 TempEst (RRID:SCR_017304) | |
| Software | BEAUti | https://beast.community/ | v1.10.4 BEAST2 (RRID:SCR_017307) | |
| Software | BEAGLE | https://beast.community/ | v3.0.2 BEAGLE (RRID:SCR_001789) | |
| Software | TreeAnnotator | https://beast.community/ | v1.10.4 BEAST2 (RRID:SCR_017307) | |
| Software | fastp | https://github.com/OpenGene/fastp | v0.20.1 fastp (RRID:SCR_016962) | |
| Software | Filtlong | https://github.com/rrwick/Filtlong | v0.2.1 Filtlong (RRID:SCR_024020) | |
| Software | Trycycler | https://github.com/rrwick/Trycycler | v0.4.1 | |
| Software | Medaka | https://github.com/nanoporetech/medaka | v1.4.3 | |
| Software | Unicycler | https://github.com/rrwick/Unicycler | v0.4.4 Unicycler (RRID:SCR_024380) | |
| Software | Bandage | https://github.com/rrwick/Bandage | v0.8.1 Bandage (RRID:SCR_022772) | |
| Software | Prokka | https://github.com/tseemann/prokka | v1.14.6 Prokka (RRID:SCR_014732) | |
| Software | Bakta | https://github.com/oschwengers/bakta | v1.10.1 Bakta (RRID:SCR_026400) | |
| Software | Blast Ring Image Generator (BRIG) | https://github.com/happykhan/BRIG | v0.95 BRIG (RRID:SCR_007802) | |
| Software | mob-typer | https://github.com/phac-nml/mob-suite | v3.1.0 | |
| Software | Easyfig | https://mjsull.github.io/Easyfig/ | v2.2.2 Easyfig (RRID:SCR_013169) | |
| Software | gggenomes | https://github.com/thackl/gggenomes | v0.9.12.9000 | |
| Software | Prism software | GraphPad Software | v9.0 GraphPad (RRID:SCR_000306) | |
| Software | Panaroo | https://github.com/gtonkinhill/panaroo | v1.3.4 Panaroo (RRID:SCR_021090) | |
| Software | snp-dists | https://github.com/tseemann/snp-dists | v0.8.2 |
Additional files
-
Supplementary file 1
(A) Metadata with genotypic resistance profiles of 1303 S. Dublin genomes. (B) Distribution of genomes according to source and region. (C) Distribution of genomes according to sequence type and region. (D) fliC and Vi profiles of 1303S. Dublin isolates in study. (E) Sequence similarity to reference plasmids. (F) Genome annotations of plasmid AUSMDU00035676. (G) Genome annotations of plasmid AUSMDU00056868. (H) Validation of invasive index prediction tool. (I) Metadata with virulome profiles of 1303 S. Dublin genomes. (J) Representative ST10 and ST74 populations used in phenotypic assays. (K) Results from pangenome analysis of representative isolates from ST10 and ST74 lineages. (L) Single nucleotide polymorphisms (SNPs) distance matrix of representative isolates from ST10 and ST74 lineages. (M) Genomes sent for long-read sequencing assemblies. (N) Database of virulent determinants that have been associated with S. Dublin.
- https://cdn.elifesciences.org/articles/102253/elife-102253-supp1-v1.xlsx
-
MDAR checklist
- https://cdn.elifesciences.org/articles/102253/elife-102253-mdarchecklist1-v1.pdf
Download links
A two-part list of links to download the article, or parts of the article, in various formats.
Downloads (link to download the article as PDF)
Open citations (links to open the citations from this article in various online reference manager services)
Cite this article (links to download the citations from this article in formats compatible with various reference manager tools)
Distinct adaptation and epidemiological success of different genotypes within Salmonella enterica serovar Dublin
eLife 13:RP102253.
https://doi.org/10.7554/eLife.102253.4


