SARS-CoV-2 nsp16 is regulated by host E3 ubiquitin ligases, UBR5 and MARCHF7
- Department of Infectious Diseases, Infectious Diseases and Pathogen Biology Center, Institute of Virology and AIDS Research, Key Laboratory of Organ Regeneration and Transplantation of The Ministry of Education, The First Hospital of Jilin University, China
- Research Unit of Key Technologies for Prevention and Control of Virus Zoonoses, Chinese Academy of Medical Sciences, Changchun Veterinary Research Institute, Chinese Academy of Agricultural Sciences, China
Figures
Figure 1 with 1 supplement
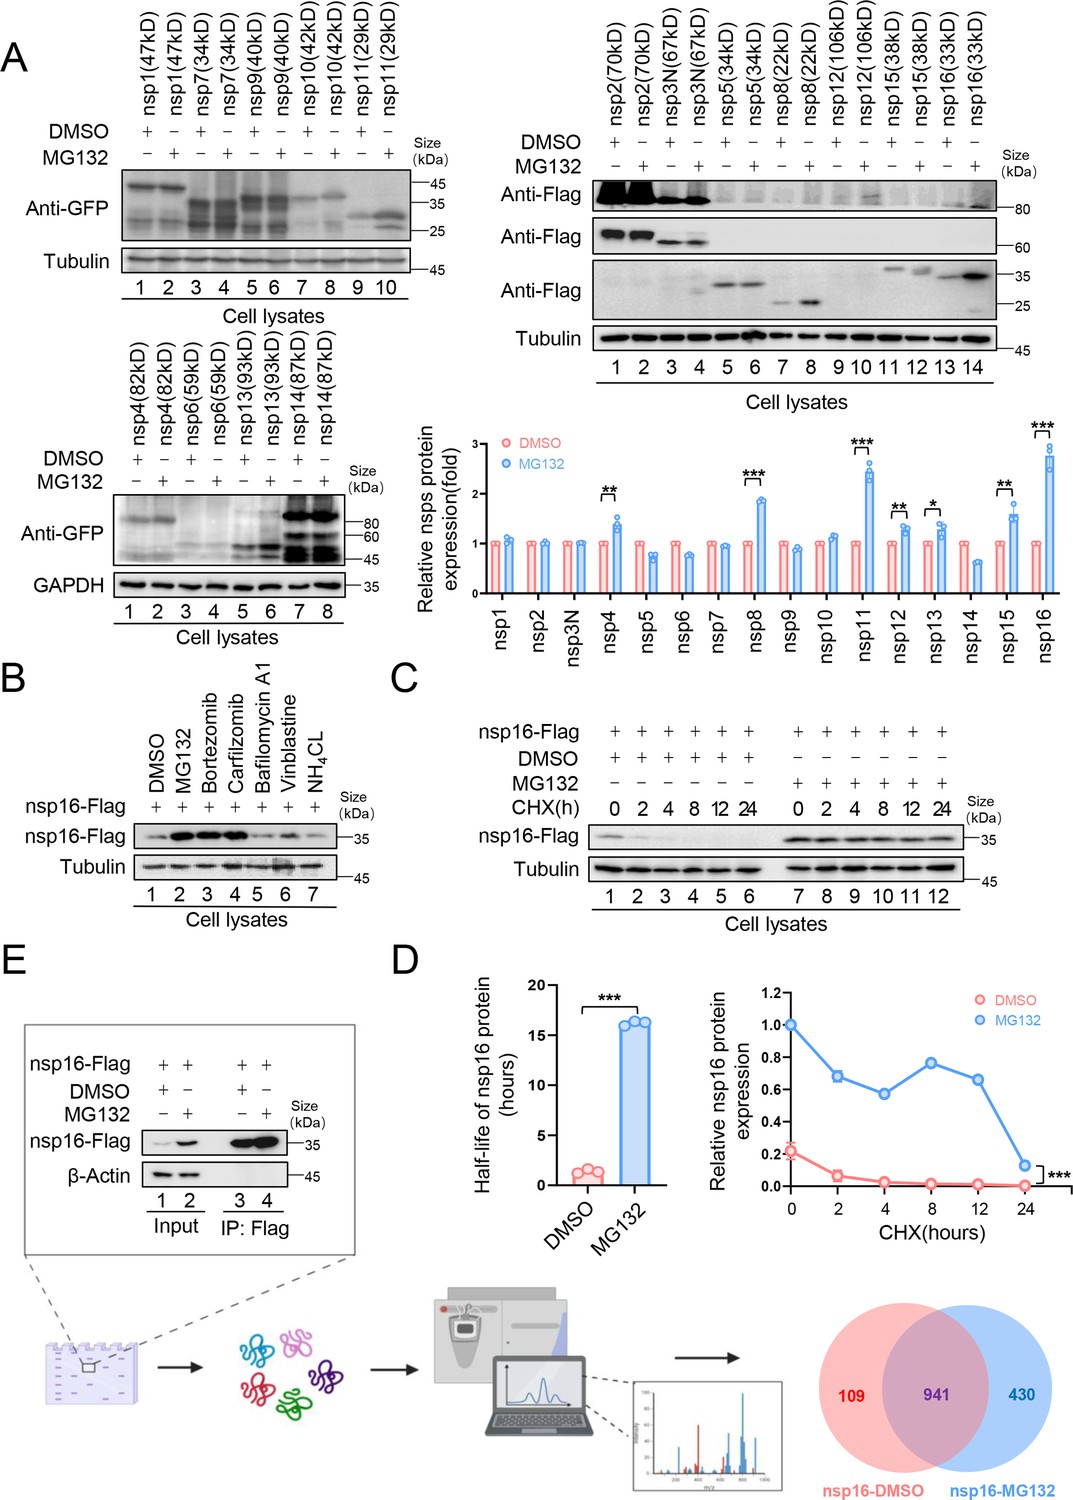
The nonstructural protein nsp16 of severe acute respiratory syndrome coronavirus 2 (SARS-CoV-2) was identified that can be degraded through the proteasome pathway.
(A) The nonstructural proteins nsp8, nsp11, and nsp16 could be restored by the proteasome inhibitor MG132. HEK293T cells in 12-well plates were transfected with the plasmids of 16 nonstructural proteins (nsp1–16) encoded by SARS-CoV-2. Thirty-six hours later, the cells were treated with MG132 (10 µM) or DMSO for 12 hr before collection. The protein level was detected by immunoblotting (IB). Quantification of nsp protein levels relative to the control protein is shown. Data are representative of three independent experiments and shown as average ± SD (n=3). Significance was determined by a two-tailed t-test: *p<0.05; **p<0.01; ***p<0.001. (B) Proteasomal inhibitors but no other inhibitors stabilized nsp16 protein. HEK293T cells transfected with the nsp16-Flag expression vector were treated with dimethyl sulfoxide (DMSO), MG132 (10 µM), Bortezomib (10 µM), Carfilzomib (10 µM), Bafilomycin A1 (5 µM), Vinblastine (2.5 µM), or NH4Cl (2.5 µM) for 12 hr prior to harvest. The cell lysates were analyzed by anti-Flag antibody. (C, D) The half-life of nsp16 was prolonged by the proteasome inhibitor MG132. (C) HEK293T cells were transfected with the nsp16-Flag-expressing plasmids. 12 hr later, the cells were treated with DMSO or MG132 (10 µM) for 12 hr, then 50 µg/ml cycloheximide (CHX) was added. Cells were harvested at the indicated times to detect the level of viral protein by anti-Flag antibody. (D) Quantification of nsp16 protein levels relative to tubulin at different time points is shown. The half-life of the nsp16 protein was determined based on protein quantification using ImageJ, combined with the protein half-life formula for calculation. Results are shown as mean ± SD (n = 3 independent experiments). ***p<0.001 by a two-tailed t-test. (E) Samples were prepared for mass spectrometry, and nsp16 interacting proteins were obtained by immunoprecipitation (IP) (created with BioRender.com and the agreement no. is XR281XWMTN). The plasmids were transfected into HEK293T cells for 48 hr. Treat cells with or without MG132 (10 µM) for 12 hr prior to harvest. The whole-cell lysates were incubated with protein G agarose beads conjugated with anti-Flag antibodies and used for IB with anti-Flag antibodies to detect the nsp16 protein. Samples enriched for proteins were analyzed by mass spectrometry.
-
Figure 1—source data 1
PDF file containing original western blots for Figure 1A, B, C, and E, indicating the relevant bands and treatments.
- https://cdn.elifesciences.org/articles/102277/elife-102277-fig1-data1-v1.zip
-
Figure 1—source data 2
Original files for western blot analysis displayed in Figure 1A, B, C, and E.
- https://cdn.elifesciences.org/articles/102277/elife-102277-fig1-data2-v1.zip
-
Figure 1—source data 3
Numerical data obtained during experiments represented in Figure 1.
- https://cdn.elifesciences.org/articles/102277/elife-102277-fig1-data3-v1.zip
Figure 1—figure supplement 1
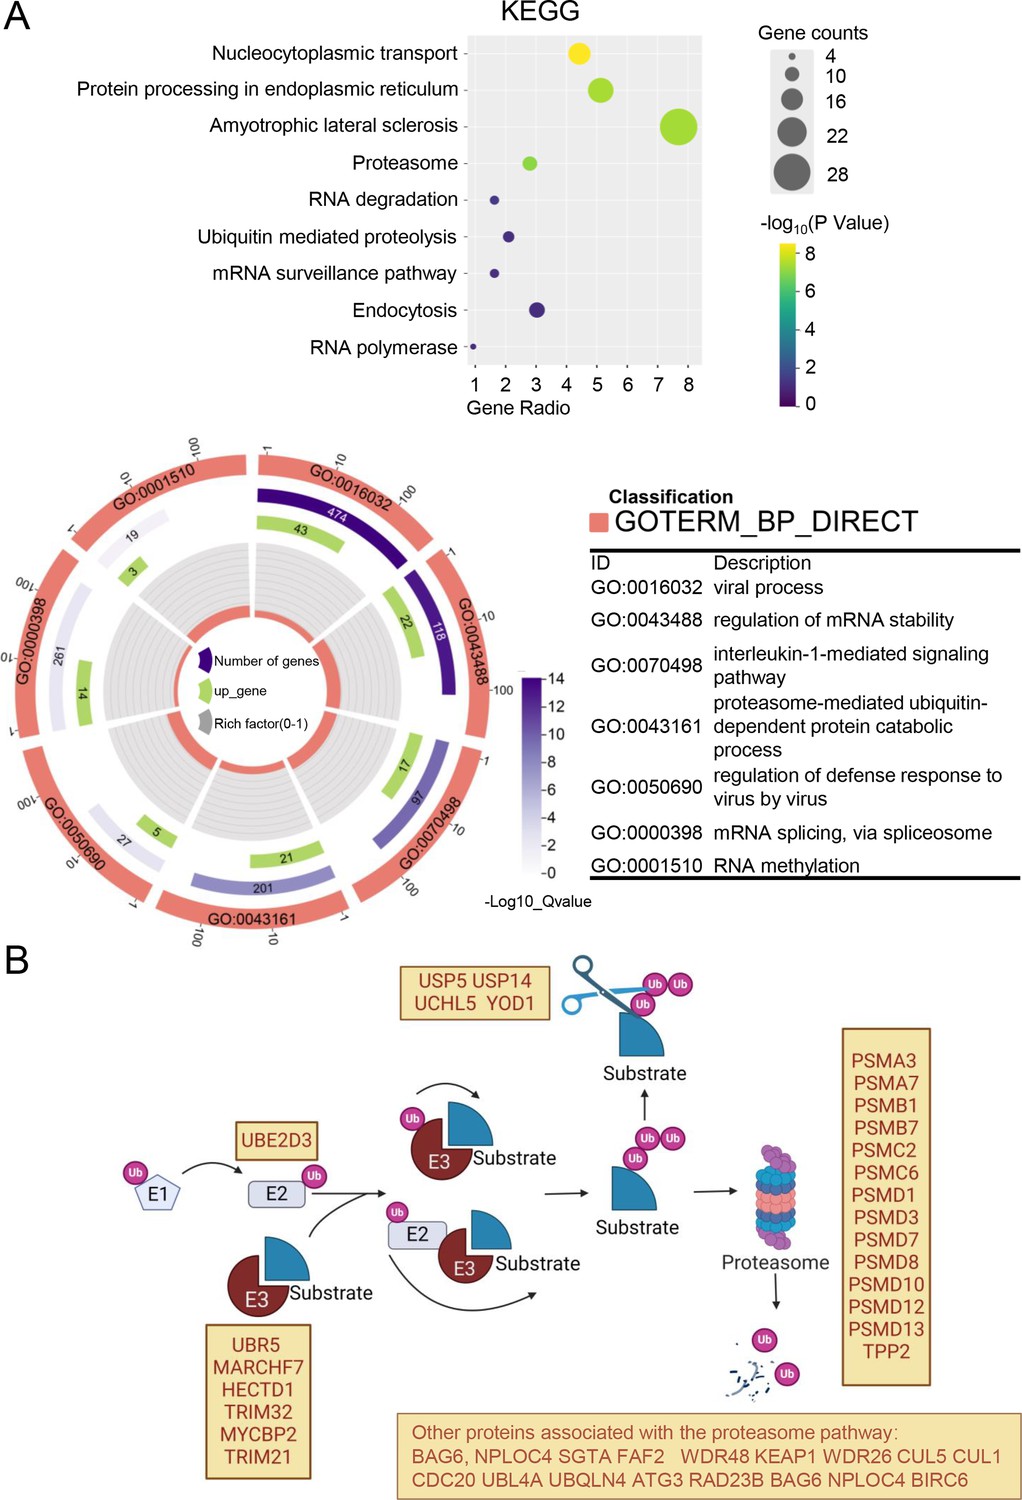
Analysis of mass spectrometry (MS) results.
(A) The DAVID bioinformatics website (https://david.ncifcrf.gov/tools.jsp) was used for Kyoto Encyclopedia of Genes and Genomes (KEGG) pathway analysis and Gene Ontology (GO) analysis of the differential proteins bound by nsp16 protein after treating with or without MG132. The bubble plots or circle diagrams depict the results of the analysis separately. In bubble plots, a change from yellow to purple indicates a decreased p-value, while the size of the circles indicates the number of enriched genes. In the circle plot, depicting the BP (Biological Process) analysis in the GO term, the length of the purple rectangle indicates the number of genes included in the term. The length of the green rectangle indicates the number of overlapping genes between the genes included in the term and the genes entered in the gene enrichment analysis, and a change from deep to shallow purple indicates a decreased p-value (created with chiplot.com). (B) Schematic representation of proteins degraded by the proteasome pathway, as well as proteins associated with the proteasome in the MS enrichment analysis, is shown (created with BioRender.com and the agreement no. is PT281XWUL2).
Figure 2 with 1 supplement
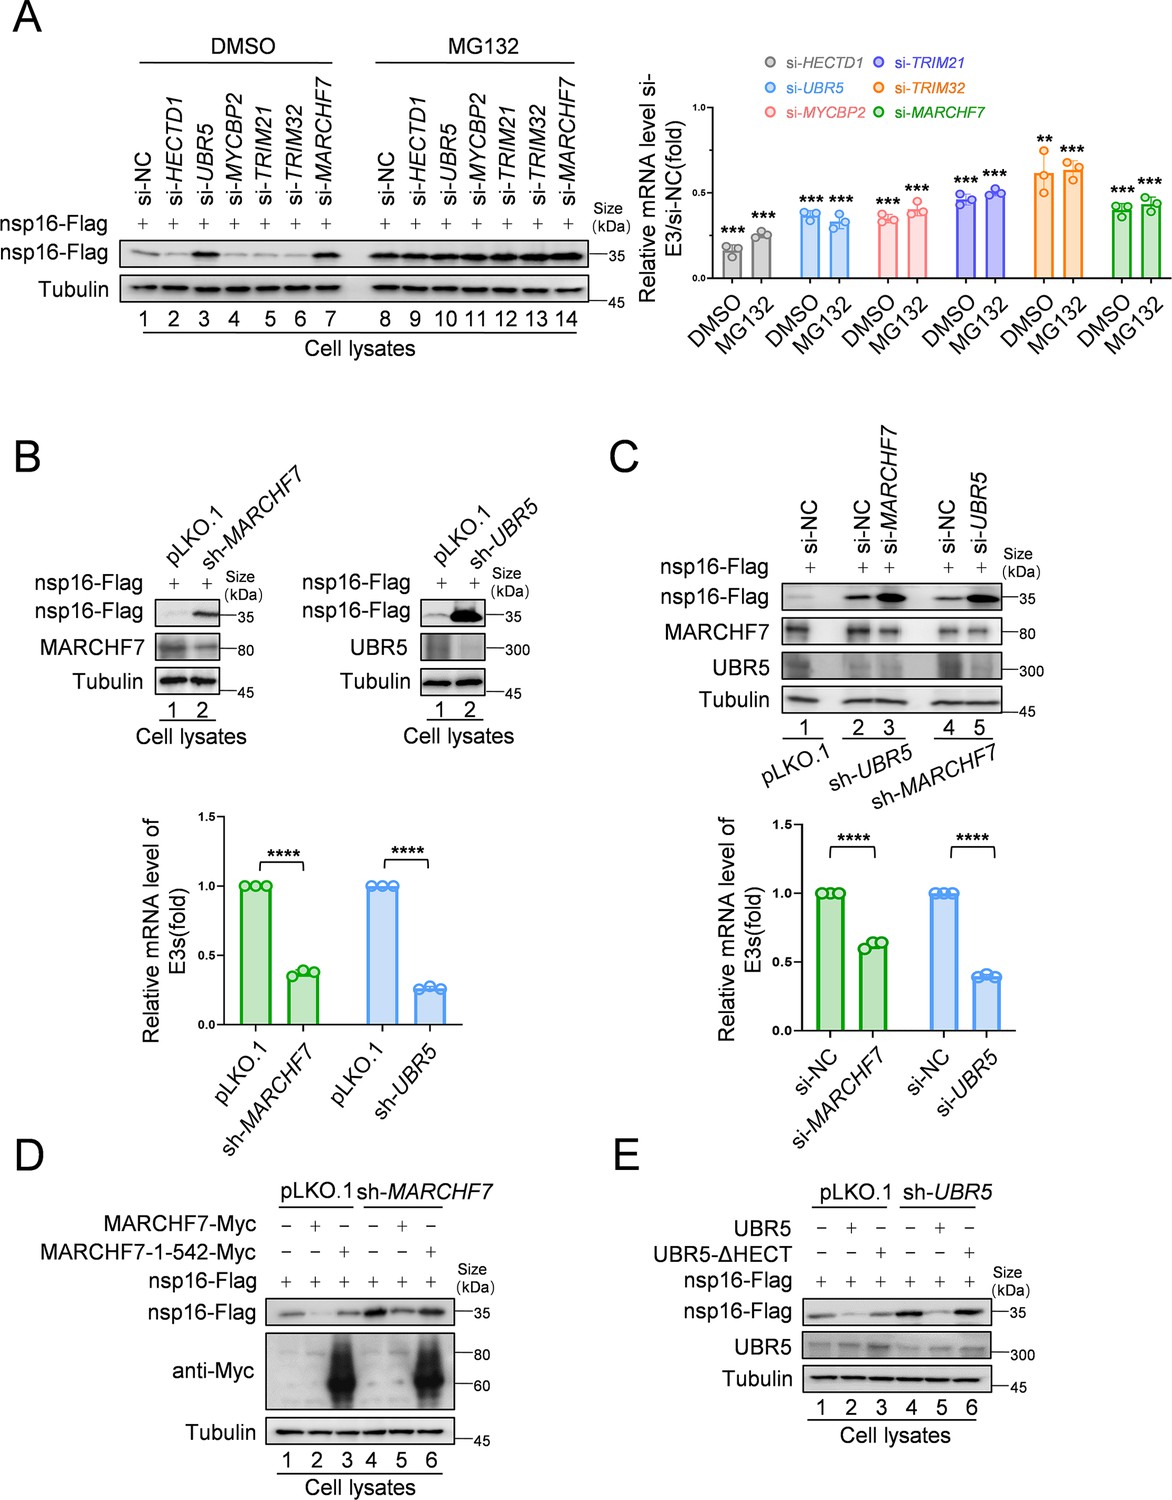
MARCHF7 and UBR5 identified as E3 ubiquitin ligases involved in nsp16 protein degradation.
(A) Knockdown of MARCHF7 or UBR5 resulted in nsp16 restoration. HEK293T cells were transfected with small interfering RNA (siRNA) of E3 ligase candidates for 24 hr, followed by co-incubation with the nsp16-Flag-expressing plasmids for 48 hr, treated with MG132 (10 µM) for 16 hr before harvesting, lysed, and subjected to immunoblotting (IB) assay using anti-Flag antibody. RT-qPCR was conducted to determine the mRNA expression levels of E3 ligase candidates. The siRNA targeting regions for the candidate E3 ubiquitin ligase proteins and the targeted regions for RT-qPCR are shown in Figure 2—figure supplement 1C. Data are representative of three independent experiments and shown as average ± SD (n=3). Significance was determined by a two-tailed t-test: ***p<0.001. (B) RNA levels of UBR5 or MARCHF7 from HEK293T cells infected with lentivirus containing control or shRNA targeting UBR5 or MARCHF7 for 48 hr and screened with antibiotics for 48 hr. Knockdown cell lines were transfected with plasmids expressing nsp16-Flag, collected at the indicated times, and the protein levels of nsp16, MARCHF7, and UBR5 were detected by IB. (C) MARCHF7 and UBR5 acted separately and did not depend on each other. HEK293T cells stably expressing UBR5 shRNA or MARCHF7 shRNA were transfected with siRNA of MARCHF7 or UBR5 for 24 hr, respectively, followed by co-incubation with the nsp16-Flag-expressing plasmids for 48 hr. The protein levels and the RNA levels of nsp16, UBR5, and MARCHF7 were measured by IB and RT-qPCR, respectively. Data are representative of three independent experiments and shown as average ± SD (n=3). Significance was determined by a two-tailed t-test: ***p<0.001. (D, E) In HEK293T cells stably expressing UBR5 shRNA or MARCHF7 shRNA, nsp16 was degraded by overexpressed UBR5 or MARCHF7, respectively, whereas the mutant failed to degrade nsp16. The cell lysates were analyzed by anti-Flag antibody.
-
Figure 2—source data 1
PDF file containing original western blots for Figure 2A–E, indicating the relevant bands and treatments.
- https://cdn.elifesciences.org/articles/102277/elife-102277-fig2-data1-v1.zip
-
Figure 2—source data 2
Original files for western blot analysis displayed in Figure 2A–E.
- https://cdn.elifesciences.org/articles/102277/elife-102277-fig2-data2-v1.zip
-
Figure 2—source data 3
Numerical data obtained during experiments represented in Figure 2.
- https://cdn.elifesciences.org/articles/102277/elife-102277-fig2-data3-v1.zip
Figure 2—figure supplement 1
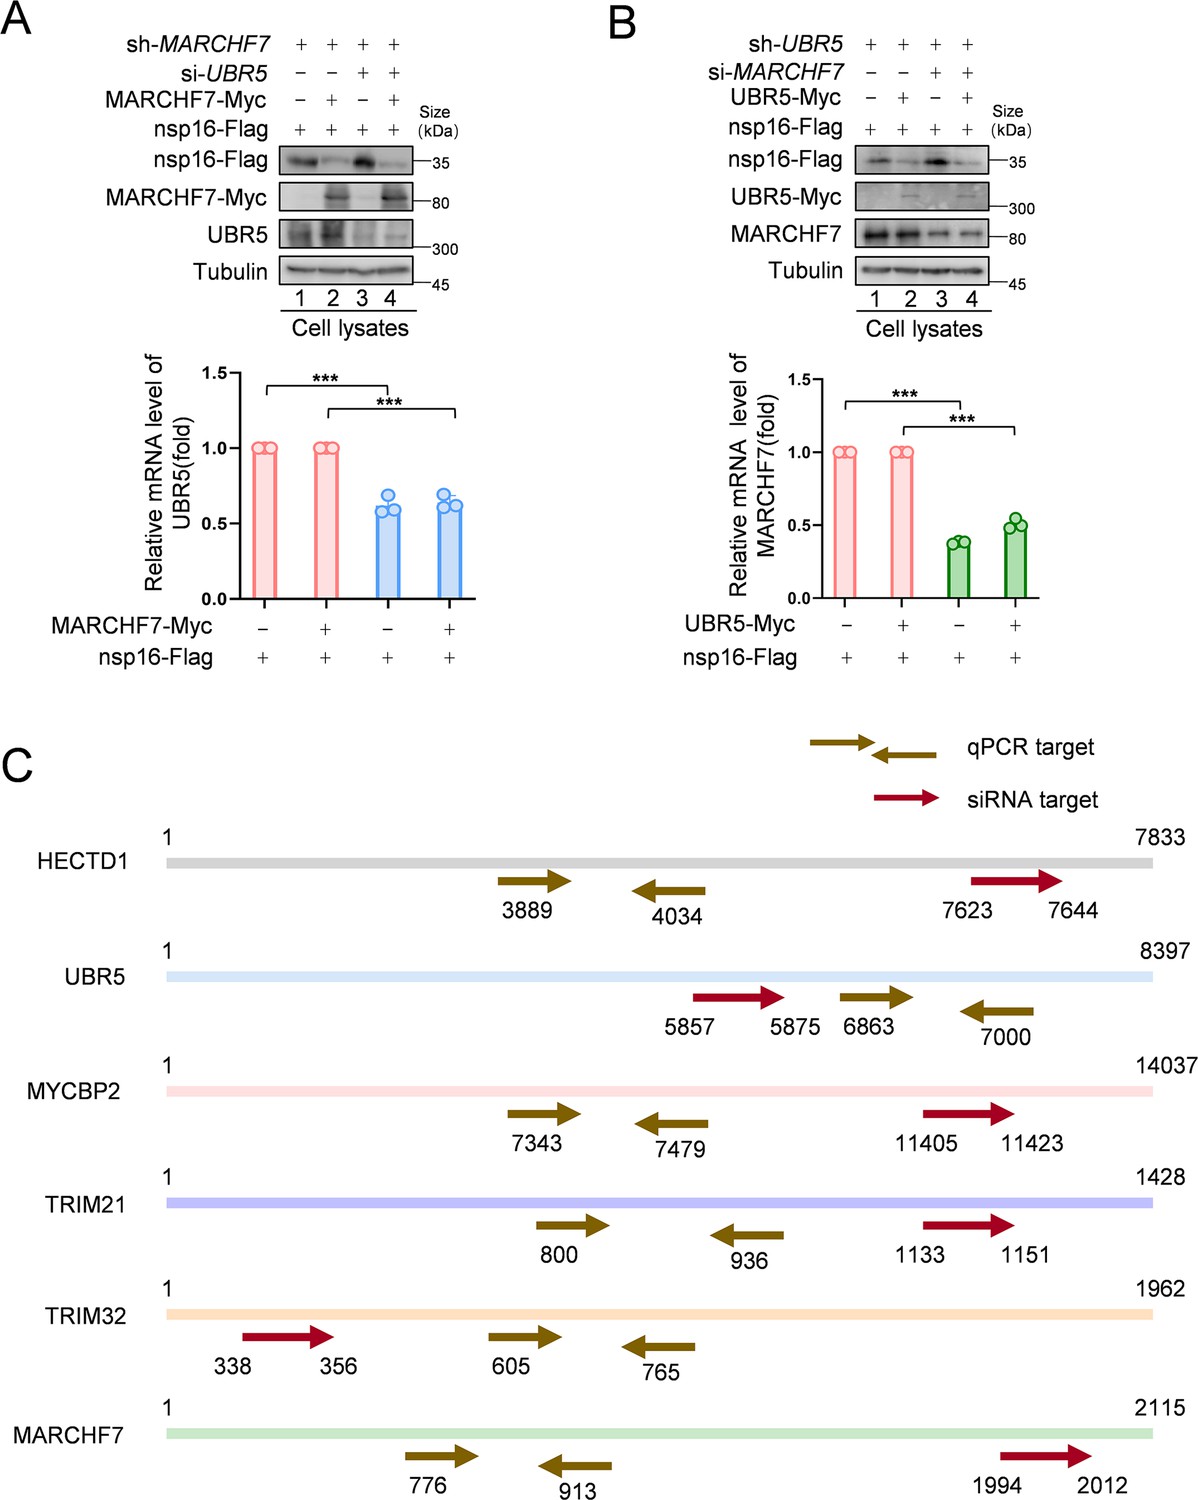
MARCHF7 and UBR5 degrade nsp16 independently.
(A, B) UBR5 small interfering RNA (siRNA) was transfected into shMARCHF7 cells to knock down UBR5. After 24 hr, MARCHF7 and nsp16 expression vectors were co-transfected, and the cells were harvested 72 hr later. The levels of nsp16 were characterized by immunoblotting (IB) with anti-Flag antibody. Whether MARCHF7 was dependent on UBR5 to degrade nsp16 was determined by further transfection of MARCHF7 siRNA into shUBR5 cells, followed by co-transfection of UBR5 and nsp16 expression vectors 24 hr later. The other operations are the same as above. Data are representative of three independent experiments and shown as average ± SD (n=3). Significance was determined by a two-tailed t-test. p>0.05; **p<0.01; ***p<0.001. (C) The siRNA targeting regions and RT-qPCR targeting regions for the E3 ubiquitin ligases—HECTD1, UBR5, MYCBP2, TRIM21, TRIM32, and MARCHF7—are shown.
-
Figure 2—figure supplement 1—source data 1
PDF file containing original western blots for Figure 2—figure supplement 1A and B, indicating the relevant bands and treatments.
- https://cdn.elifesciences.org/articles/102277/elife-102277-fig2-figsupp1-data1-v1.zip
-
Figure 2—figure supplement 1—source data 2
Original files for western blot analysis displayed in Figure 2—figure supplement 1A and B.
- https://cdn.elifesciences.org/articles/102277/elife-102277-fig2-figsupp1-data2-v1.zip
-
Figure 2—figure supplement 1—source data 3
Numerical data obtained during experiments represented in Figure 2—figure supplement 1.
- https://cdn.elifesciences.org/articles/102277/elife-102277-fig2-figsupp1-data3-v1.zip
Figure 3

MARCHF7 or UBR5 catalyze the formation of K27-type or K48-type ubiquitin chains of nsp16, respectively.
(A) Nsp16 can be ubiquitinated. HEK293T cells co-transfected with ubiquitin-Myc and nsp16-Flag or transfected with nsp16-Flag alone. The cells were treated with MG132 for 12 hr before collection. The whole-cell lysates were incubated with anti-Flag beads and used for immunoblotting (IB) with anti-Myc or anti-Flag antibodies to detect the polyubiquitination chain of nsp16. (B) Assess the endogenous ubiquitination level of nsp16 protein. Cells were transfected with nsp16-Flag or an empty vector and collected 48 hr later. Prior to harvesting, cells were treated with MG132 for 16 hr. Co-immunoprecipitation (Co-IP) experiments were then performed to analyze the endogenous ubiquitination level of nsp16. (C) The level of ubiquitination of nsp16 decreased with decreasing the protein levels of MARCHF7 or UBR5. E3 was knocked down by transfection with small interfering RNA (siRNA) targeting UBR5 or MARCHF7, and 24 hr later, ubiquitin-Myc and nsp16-HA were co-transfected or nsp16-HA alone. Cells were treated with MG132 for 16 hr before collection. Whole-cell lysates were incubated with anti-HA beads, and polyubiquitinated chains of nsp16 were detected by IB with anti-Myc or anti-HA antibodies. (D) Nsp16 can be modified by a variety of ubiquitin chains. HEK293T cells were transfected with either nsp16-HA alone or together with plasmids encoding various mutants of ubiquitin (K6 only, K11 only, K27 only, K29 only, K33 only, K48 only, K63 only). Thirty-six hours later, cells were treated with MG132 for 12 hr. Cell lysates were then subjected to immunoprecipitation, followed by IB to analysis. (E, F) MARCHF7 or UBR5 causes nsp16 to be modified by the K27-type or K48-type ubiquitin chain. 293T cell lines with or without MARCHF7 or UBR5 knockdown were co-transfected with plasmids encoding ubiquitin-WT or various mutants of ubiquitin (K6 only, K11 only, K27 only, K29 only, K33 only, K48 only, K63 only). The other experimental methods were the same as C.
-
Figure 3—source data 1
PDF file containing original western blots for Figure 3A–F, indicating the relevant bands and treatments.
- https://cdn.elifesciences.org/articles/102277/elife-102277-fig3-data1-v1.zip
-
Figure 3—source data 2
Original files for western blot analysis displayed in Figure 3A–F.
- https://cdn.elifesciences.org/articles/102277/elife-102277-fig3-data2-v1.zip
Figure 4 with 2 supplements
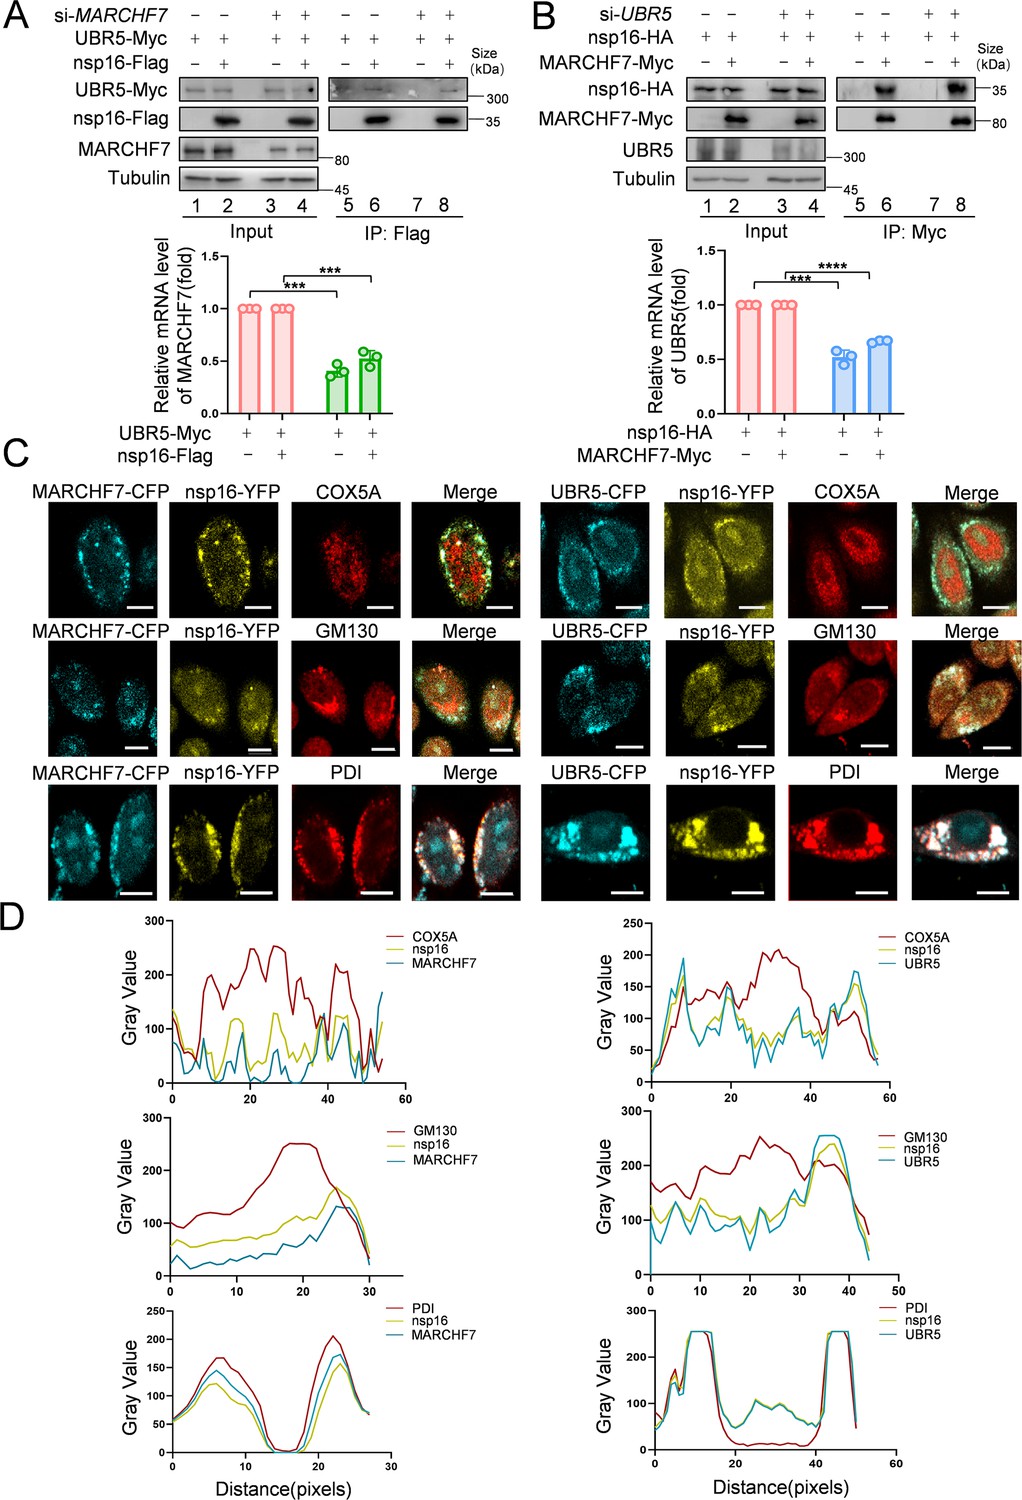
MARCHF7 and UBR5 directly interact with nsp16, respectively.
(A, B) The binding of MARCHF7 or UBR5 to nsp16 was not mutually dependent. The binding of nsp16 to UBR5 or MARCHF7 was identified by co-immunoprecipitation in HEK293T cells transfected into siMARCHF7 or siUBR5, respectively. The immunoprecipitates and input were analyzed by immunoblotting (IB). The knockdown efficiency was detected by RT-qPCR and IB. Data are representative of three independent experiments and shown as average ± SD (n=3). Significance was determined by a two-tailed t-test: ***p<0.001. (C, D) MARCHF7 or UBR5 colocalized with nsp16 in the endoplasmic reticulum. Hela cells were co-transfected with YFP-nsp16 (yellow) and CFP-UBR5 (cyan) or CFP-MARCHF7 (cyan). The organelles were labeled with antibodies against marker proteins of endoplasmic reticulum, Golgi apparatus, and mitochondria respectively (red). The cells were analyzed by confocal microscopy (C). Scale bars, 20 µm. The ratio of colocalization was quantified by measuring the fluorescence intensities using ImageJ (D).
-
Figure 4—source data 1
PDF file containing original western blots for Figure 4A and B, indicating the relevant bands and treatments.
- https://cdn.elifesciences.org/articles/102277/elife-102277-fig4-data1-v1.zip
-
Figure 4—source data 2
Original files for western blot analysis displayed in Figure 4A and B.
- https://cdn.elifesciences.org/articles/102277/elife-102277-fig4-data2-v1.zip
-
Figure 4—source data 3
Numerical data obtained during experiments represented in Figure 4.
- https://cdn.elifesciences.org/articles/102277/elife-102277-fig4-data3-v1.zip
Figure 4—figure supplement 1
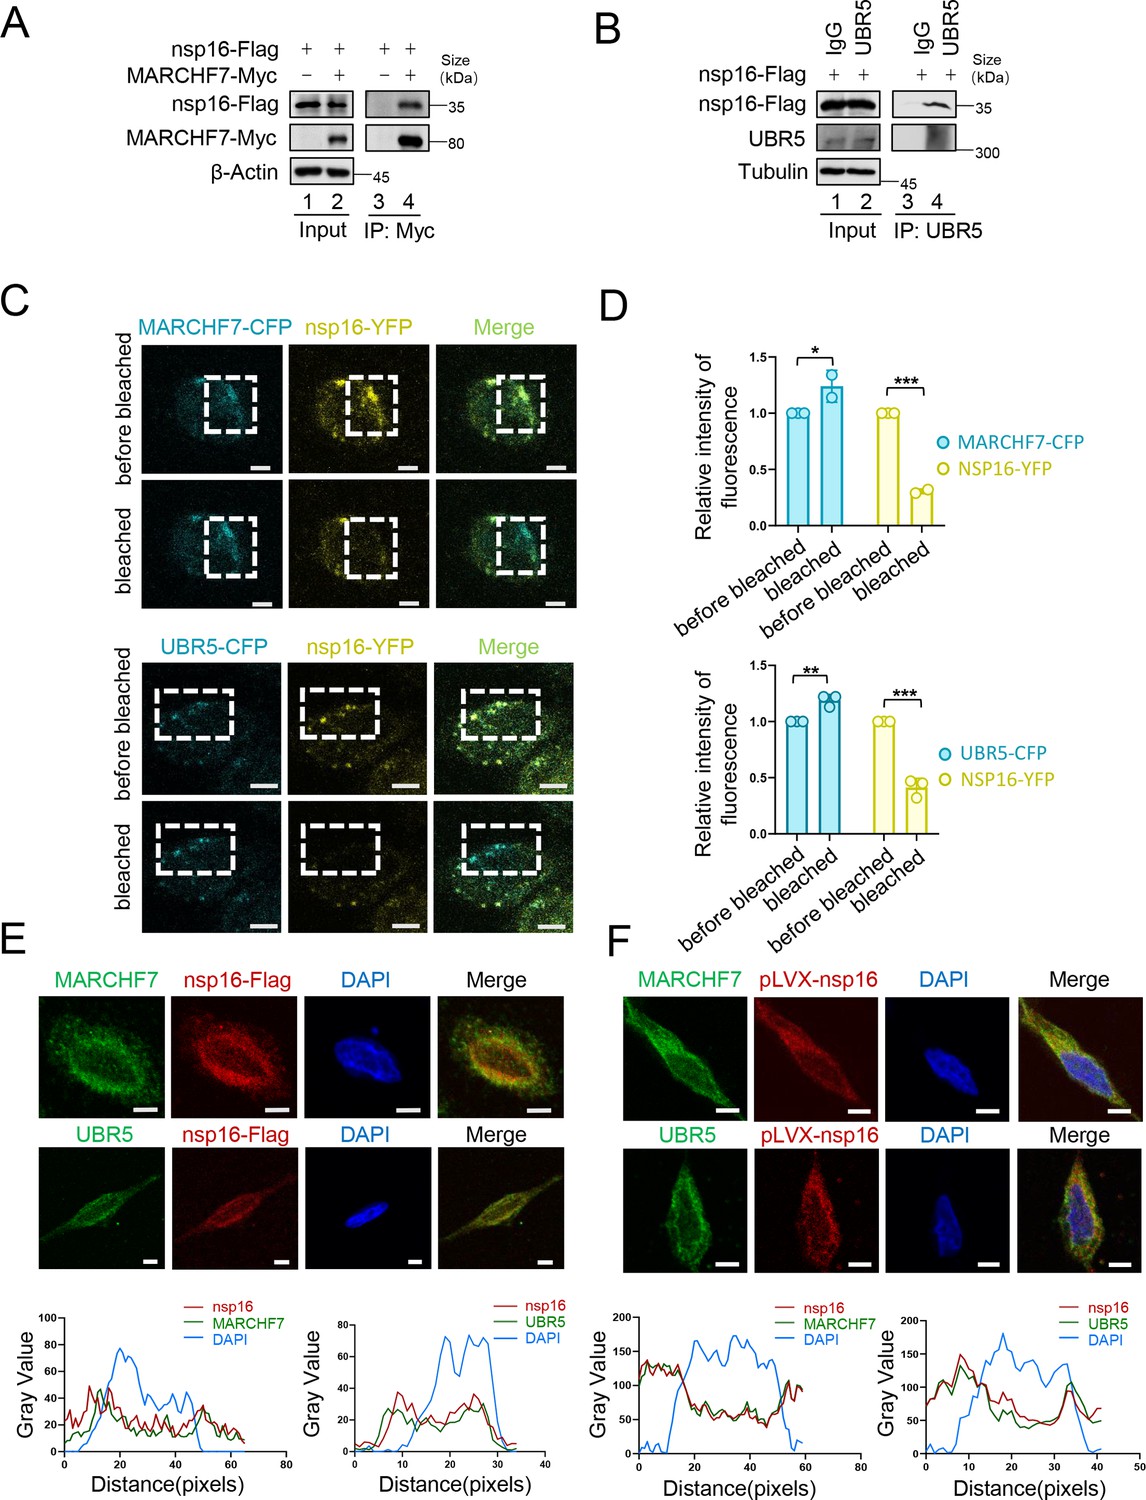
Interaction of MARCHF7 or UBR5 with nsp16.
(A) HEK293T cells were transfected with either nsp16-Flag alone or together with MARCHF7-Myc. Thirty-six hours after transfection, the cells were treated with MG132 (10 µM) for 12 hr. Cell lysates were subjected to immunoprecipitation with anti-Flag antibody. Using immunoblotting (IB) to analyze the precipitates and input. (B) HEK293T cells were transfected with nsp16-Flag. Cell lysates were subjected to immunoprecipitation with anti-UBR5 or IgG antibody. (C, D) HeLa cells were co-transfected with YFP-nsp16 and CFP-UBR5 or CFP-MARCHF7. A representative image of YFP-nsp16 (yellow) and ECFP-MARCHF7 (cyan) or ECFP-UBR5 (cyan) expressing cells before and after photobleaching the acceptor fluorophore, YFP. The region chosen for photobleaching is marked (white open box). Scale bars, 10 µm. The quantization of fluorescence brightness was analyzed by ImageJ. Data are representative of three independent experiments and shown as average ± SD (n=3). Significance was determined by a two-tailed t-test. p>0.05; **p<0.01; ***p<0.001. (E) HeLa cells transfected with nsp16-Flag were analyzed by confocal microscopy. The Flag-tagged nsp16 labeled with anti-Flag antibody (red). MARCHF7 or UBR5 were labeled with endogenous antibodies (green). Cell nuclei were stained using DAPI (4′,6-diamidino-2-phenylindole) (blue). Representative images were shown. Scale bars, 20 µm. The ratio of colocalization was quantified by measuring the fluorescence intensities using ImageJ. (F) nsp16 was stably transfected into HEK293T cells. The cells were analyzed by confocal microscopy. The other operations are the same as above.
-
Figure 4—figure supplement 1—source data 1
PDF file containing original western blots for Figure 4—figure supplement 1A and B, indicating the relevant bands and treatments.
- https://cdn.elifesciences.org/articles/102277/elife-102277-fig4-figsupp1-data1-v1.zip
-
Figure 4—figure supplement 1—source data 2
Original files for western blot analysis displayed in Figure 4—figure supplement 1A and B.
- https://cdn.elifesciences.org/articles/102277/elife-102277-fig4-figsupp1-data2-v1.zip
-
Figure 4—figure supplement 1—source data 3
Numerical data obtained during experiments represented in Figure 4—figure supplement 1.
- https://cdn.elifesciences.org/articles/102277/elife-102277-fig4-figsupp1-data3-v1.zip
Figure 4—figure supplement 2
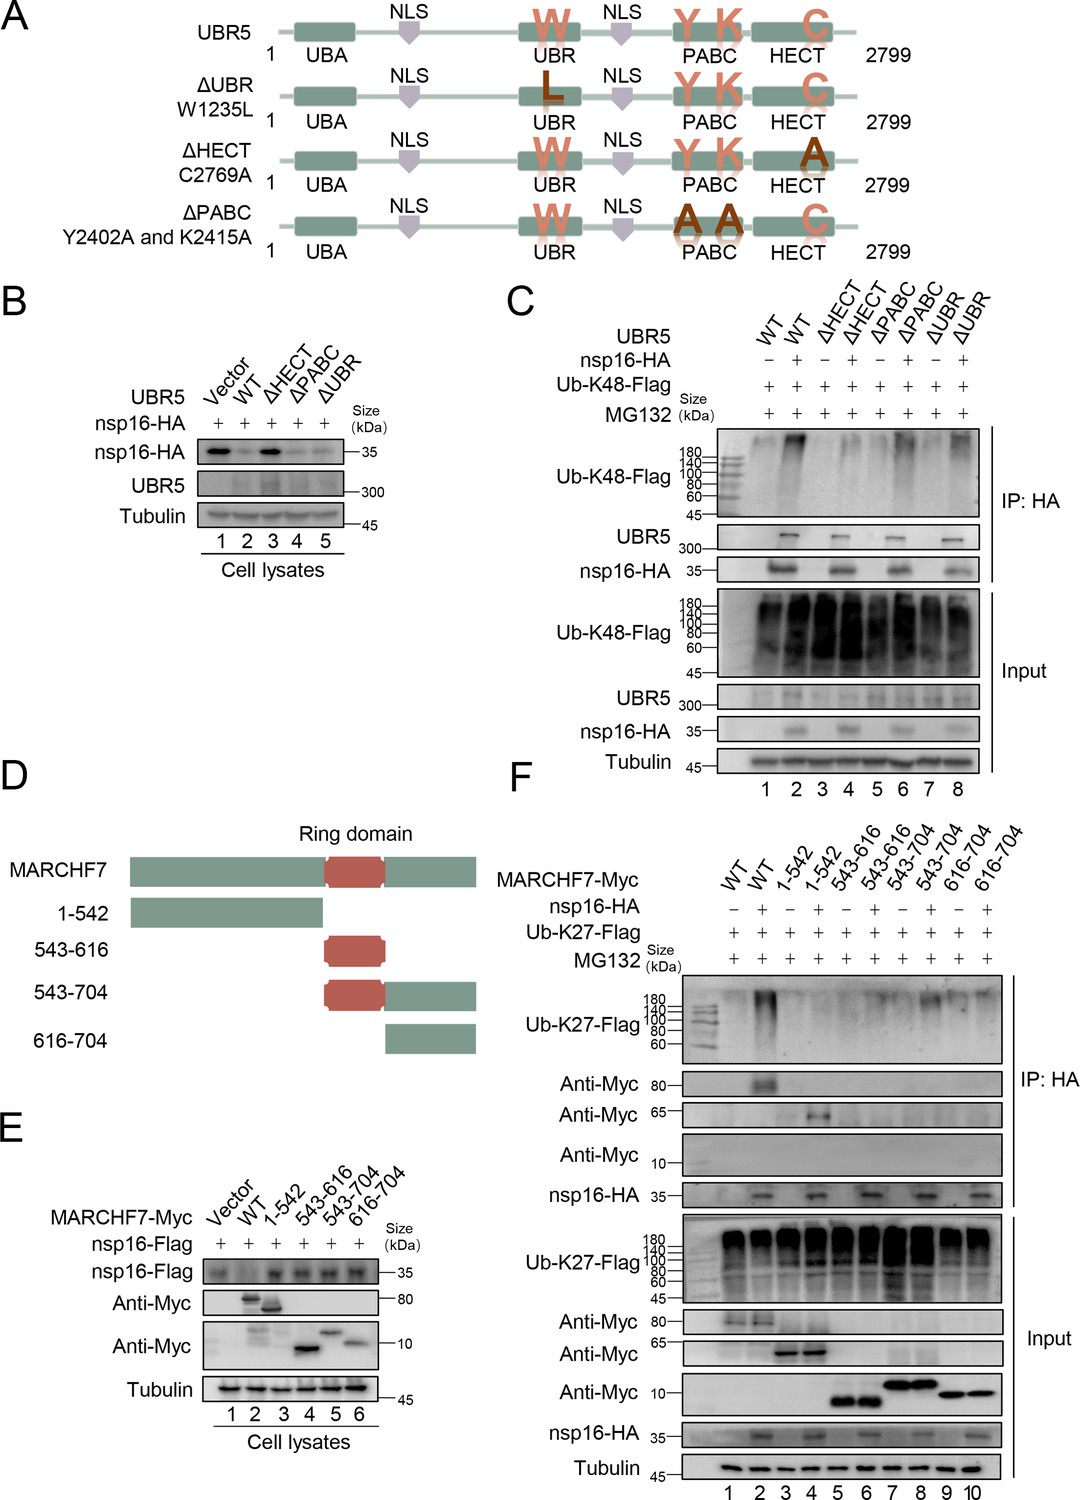
Domains in which MARCHF7 or UBR5 functions.
(A) The schematic represents UBR5 wild-type (WT) or mutants used in the study. (B) The homologous to the E6AP carboxyl terminus (HECT) domain of UBR5 is required for nsp16 degradation. After co-transfection with UBR5 WT or mutants and nsp16-HA, cells were harvested 48 hr later, and cell lysates were examined by immunoblotting (IB). (C) The HECT domain of UBR5 affects K48-type ubiquitin chain of nsp16. HEK293T cells were transfected with the assigned plasmids. After 36 hr, cells were treated with 10 µM MG132 for 12 hr, harvested, and cell lysates were incubated with protein G agarose beads conjugated with anti-HA antibodies. Cell lysates and precipitated samples were analyzed by IB. (D) The schematic represents WT and truncated forms of MARCHF7 used in the study. (E) Only MARCHF7 WT degraded nsp16. (F) The N-terminal region of MARCHF7 interacted with nsp16, and only the WT could catalyze the K27-type ubiquitin chain of nsp16.
-
Figure 4—figure supplement 2—source data 1
PDF file containing original western blots for Figure 4—figure supplement 2B, C, E, and F, indicating the relevant bands and treatments.
- https://cdn.elifesciences.org/articles/102277/elife-102277-fig4-figsupp2-data1-v1.zip
-
Figure 4—figure supplement 2—source data 2
Original files for western blot analysis displayed in Figure 4—figure supplement 2B, C, E, and F.
- https://cdn.elifesciences.org/articles/102277/elife-102277-fig4-figsupp2-data2-v1.zip
Figure 5 with 1 supplement
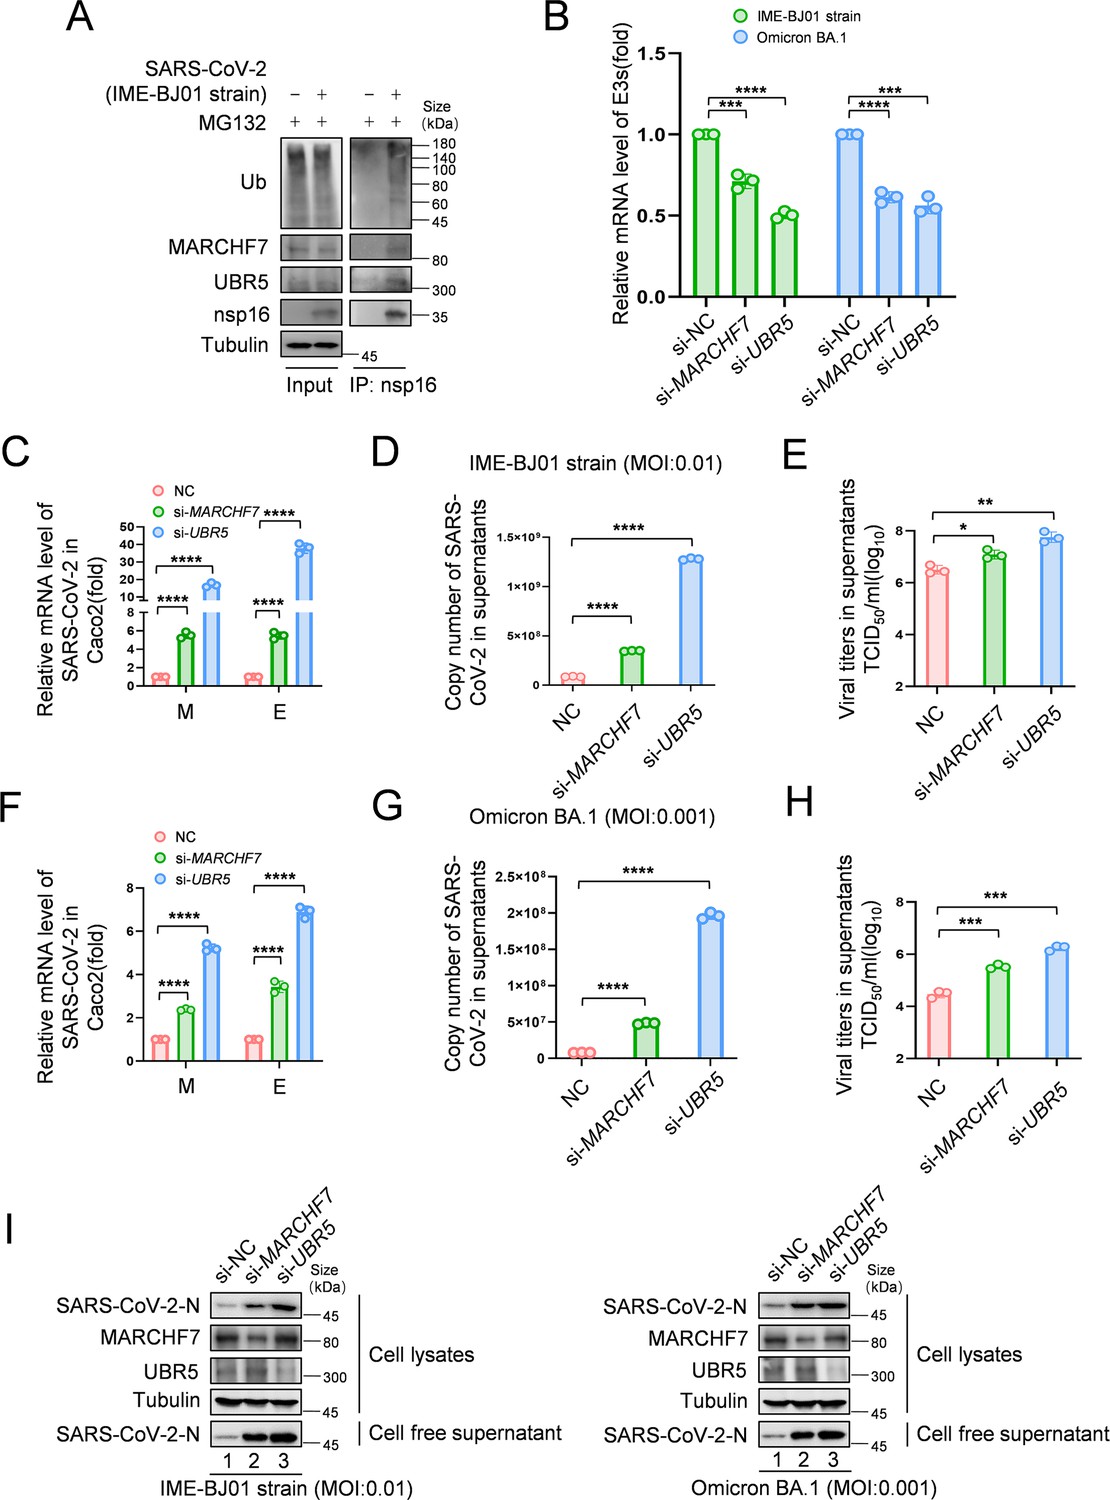
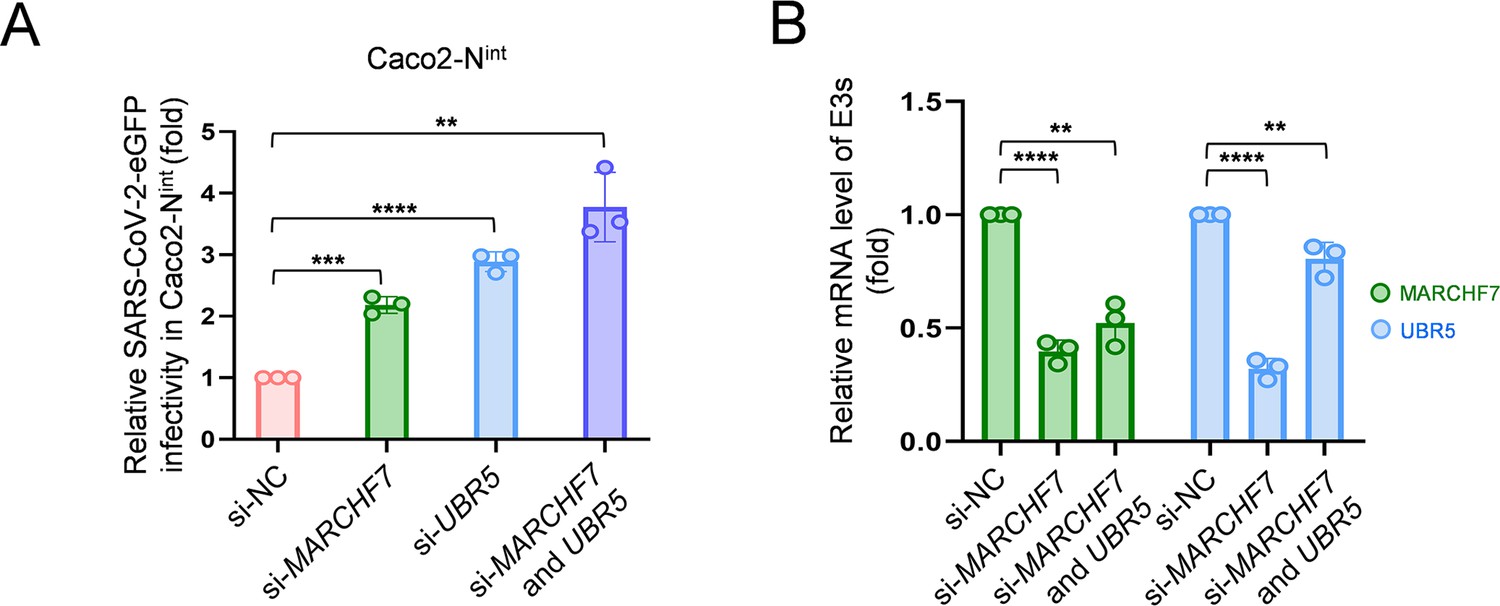
Knockdown of MARCHF7 or UBR5 promotes viral replication.
(A) The virus-encoded nsp16 protein interacts with endogenous MARCHF7 and UBR5 and undergoes ubiquitination modification. In 293T-ACE2 cells, with or without IME-BJ01 strain infection (MOI: 0.01), the medium was changed 2 hr post-infection, and cells were harvested 48 hr later, with MG132 treatment added 16 hr before harvesting. nsp16 protein was enriched using protein G beads coupled with the nsp16 antibody, and interactions and ubiquitination were analyzed by immunoblotting (IB) with endogenous antibodies against MARCHF7, UBR5, and ubiquitination. (B–I) MARCHF7 and UBR5 were knocked down by small interfering RNA (siRNA) in Caco2 cells. 24 hr after transfection, the cells were infected with IME-BJ01 strain (MOI: 0.01) (C–E) or Omicron BA.1 strain (MOI: 0.001) (F–H), respectively. 2 hr post-infection, the supernatant was discarded, and the cells were cultured in Dulbecco’s modified Eagle’s medium (DMEM) containing 3% fetal bovine serum for 48 hr. The mRNA levels of severe acute respiratory syndrome coronavirus 2 (SARS-CoV-2) M and E genes in the cells (C, F) and E genes in supernatant (D, G) were detected by RT-qPCR, and the viral titers in supernatant (E, H) were measured. The N protein levels of IME-BJ01 or Omicron viruses were detected by IB (I). Knockdown efficiencies of MARCHF7 and UBR5 were detected by RT-qPCR or IB (B, I). Data are representative of three independent experiments and shown as average ± SD (n=3). Significance was determined by one-way ANOVA, followed by a Tukey’s multiple comparisons posttest: *p<0.05; **p<0.01; ***p<0.001.
-
Figure 5—source data 1
PDF file containing original western blots for Figure 5A and I, indicating the relevant bands and treatments.
- https://cdn.elifesciences.org/articles/102277/elife-102277-fig5-data1-v1.zip
-
Figure 5—source data 2
Original files for western blot analysis displayed in Figure 5A and I.
- https://cdn.elifesciences.org/articles/102277/elife-102277-fig5-data2-v1.zip
-
Figure 5—source data 3
Numerical data obtained during experiments represented in Figure 5.
- https://cdn.elifesciences.org/articles/102277/elife-102277-fig5-data3-v1.zip
Figure 5—figure supplement 1
Effect of MARCHF7 or UBR5 on severe acute respiratory syndrome coronavirus 2 (SARS-CoV-2) trVLP.
(A, B) Knocking down MARCHF7 or UBR5 enhances SARS-CoV-2 trVLP infectivity. MARCHF7 or UBR5 was knocked down by small interfering RNA (siRNA) in Caco2 cells with stable expression of SARS-CoV-2 N protein. Twenty-four hours later, cells were infected with SARS-CoV-2 virus-like particles (MOI: 0.1), the medium was changed 2 hr after infection, and the eGFP-positive cells were detected by flow cytometry 48 hr later (A). Protein content was determined by RT-qPCR (B). Data are representative of three independent experiments and shown as average ± SD (n=3). Significance was determined by one-way ANOVA, followed by a Tukey’s multiple comparisons posttest: *p<0.05; **p<0.01; ***p<0.001.
-
Figure 5—figure supplement 1—source data 1
Numerical data obtained during experiments represented in Figure 5—figure supplement 1.
- https://cdn.elifesciences.org/articles/102277/elife-102277-fig5-figsupp1-data1-v1.zip
Figure 6 with 4 supplements
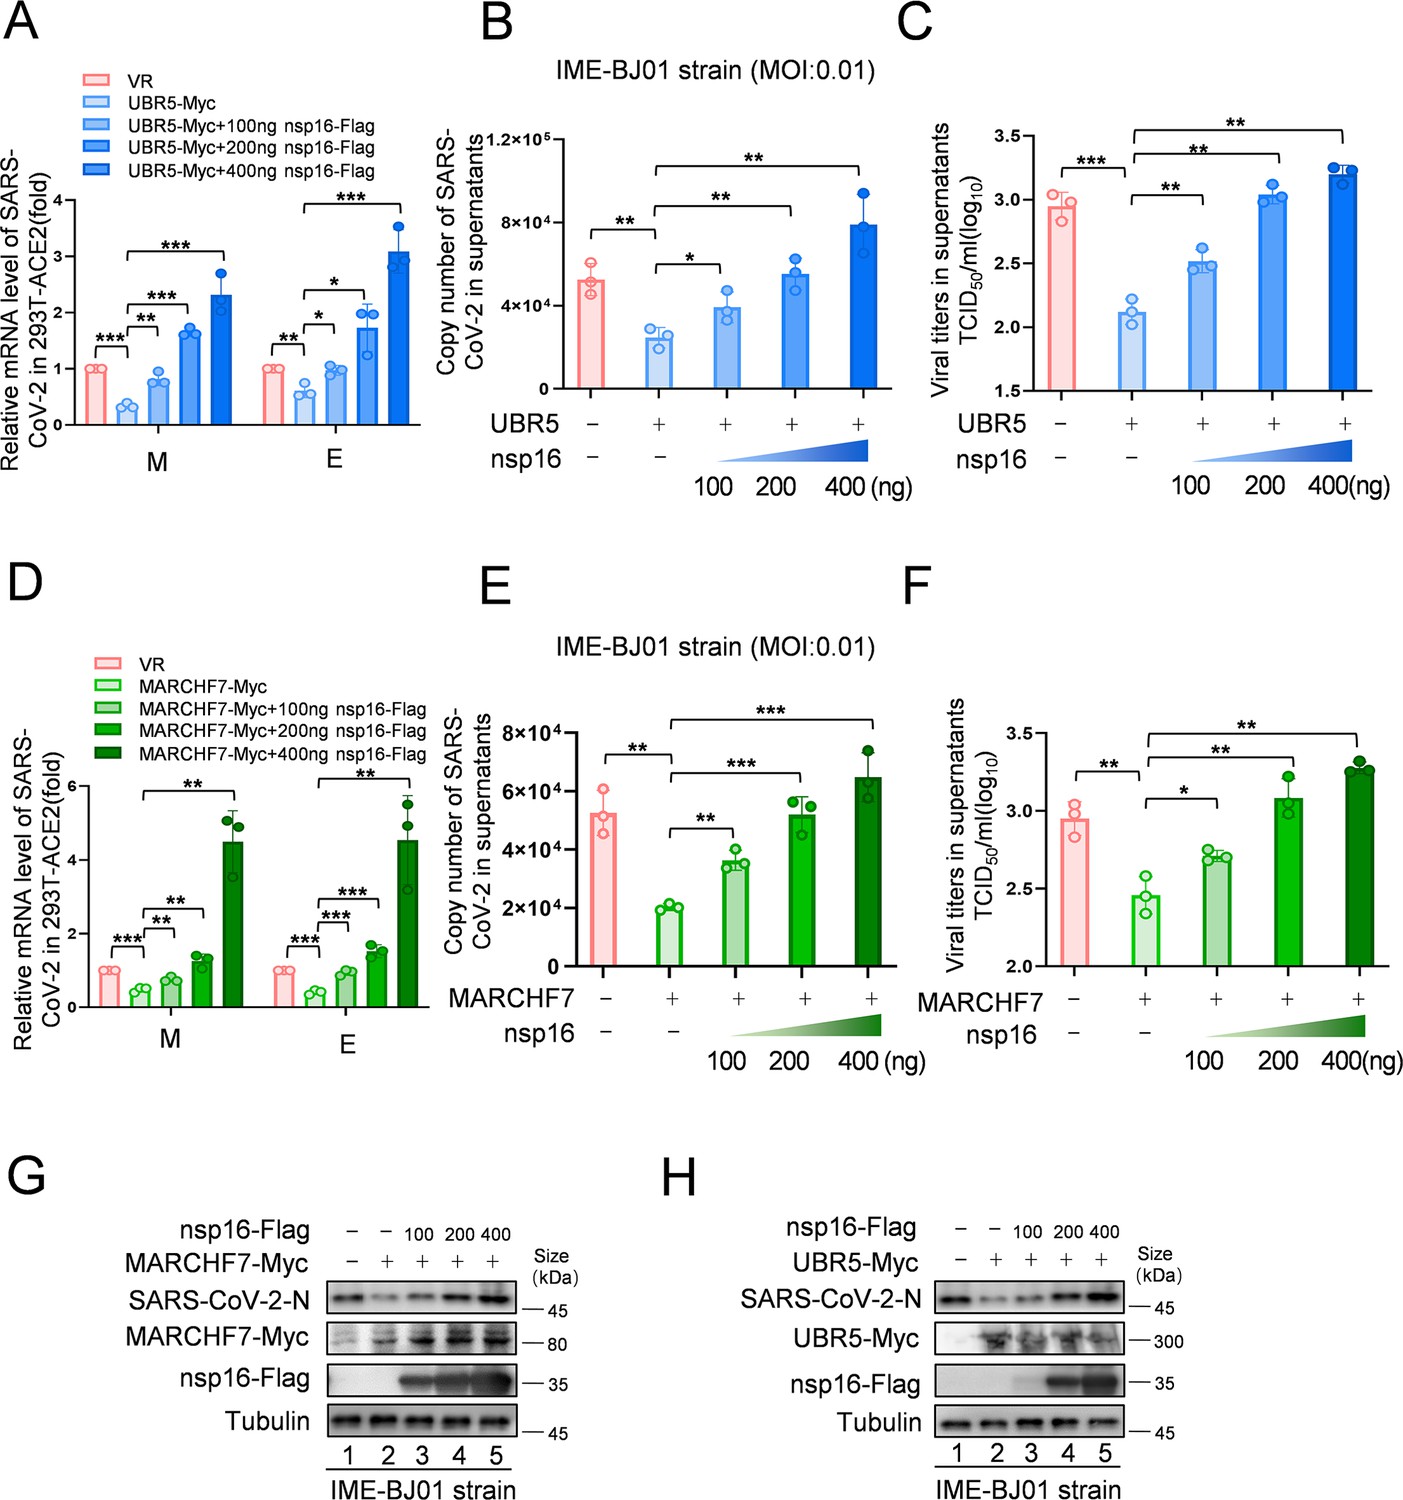
Increased levels of nsp16 rescued viral inhibition by UBR5 or MARCHF7.
(A–H) UBR5 or MARCHF7 was transfected in 293T cells stably overexpressed with ACE2, and the increased doses of nsp16-Flag were transfected simultaneously. After 24 hr, the cells were infected with IME-BJ01 strains. The mRNA levels of M and E genes of the IME-BJ01 strain in the cells (A, D) and E gene in supernatant (B, E) were detected by RT-qPCR, as well as the detection of viral titers in supernatant (C, F). The N protein of the virus and the overexpression efficiency were detected by IB (G, H). Data are representative of three independent experiments and shown as average ± SD (n=3). Significance was determined by one-way ANOVA, followed by a Tukey’s multiple comparisons posttest. p>0.05; **p<0.01; ***p<0.001. Figure 6—figure supplement 1 shows data related to infection with Omicron BA.1.
-
Figure 6—source data 1
PDF file containing original western blots for Figure 6G and H, indicating the relevant bands and treatments.
- https://cdn.elifesciences.org/articles/102277/elife-102277-fig6-data1-v1.zip
-
Figure 6—source data 2
Original files for western blot analysis displayed in Figure 6G and H.
- https://cdn.elifesciences.org/articles/102277/elife-102277-fig6-data2-v1.zip
-
Figure 6—source data 3
Numerical data obtained during experiments represented in Figure 6.
- https://cdn.elifesciences.org/articles/102277/elife-102277-fig6-data3-v1.zip
Figure 6—figure supplement 1
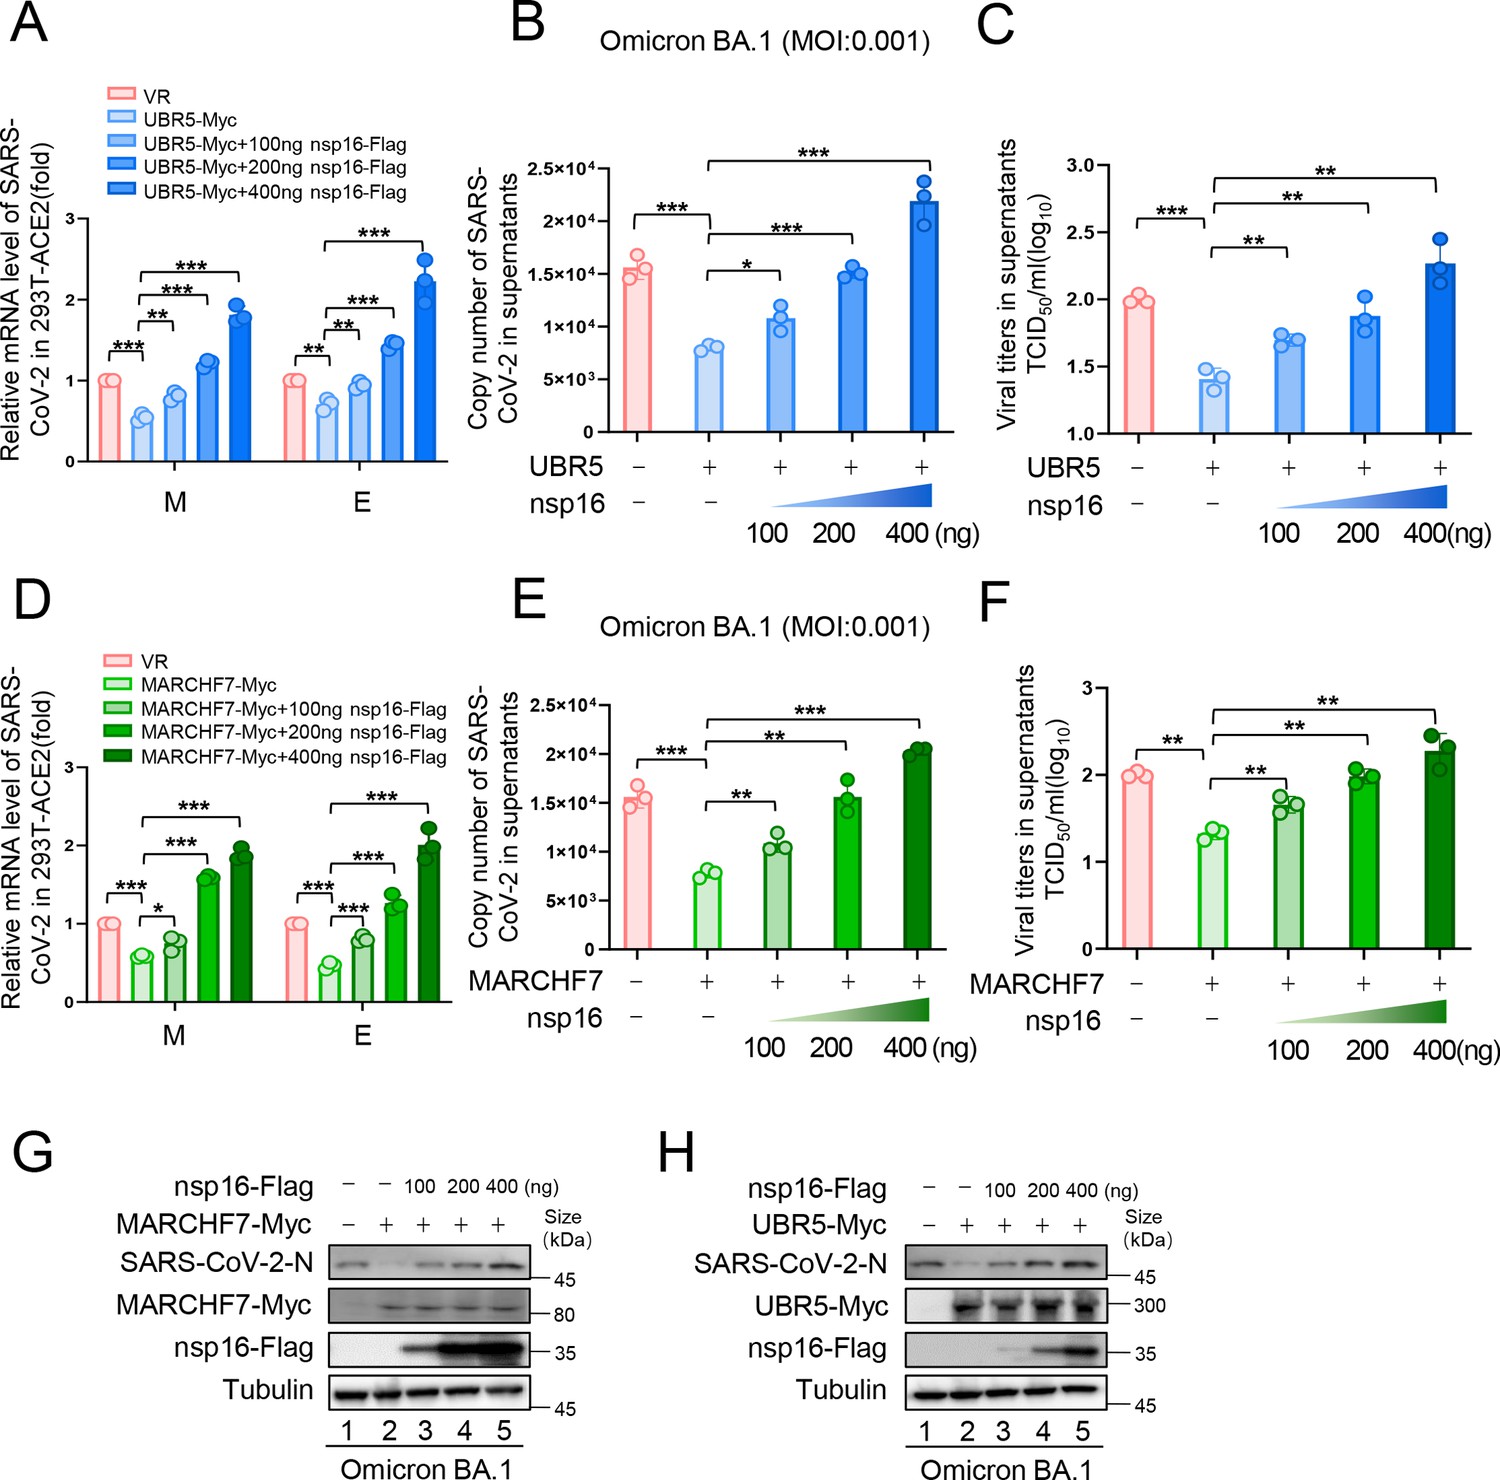
Effect of MARCHF7 or UBR5 on Omicron BA.1 infectivity.
(A–H) Showing data related to infection with Omicron BA.1. The experimental procedure was the same as in Figure 6. Data are representative of three independent experiments and shown as average ± SD (n=3). Significance was determined by one-way ANOVA, followed by a Tukey’s multiple comparisons posttest. p>0.05; **p<0.01; ***p<0.001.
-
Figure 6—figure supplement 1—source data 1
PDF file containing original western blots for Figure 6—figure supplement 1G and H, indicating the relevant bands and treatments.
- https://cdn.elifesciences.org/articles/102277/elife-102277-fig6-figsupp1-data1-v1.zip
-
Figure 6—figure supplement 1—source data 2
Original files for western blot analysis displayed in Figure 6—figure supplement 1G and H.
- https://cdn.elifesciences.org/articles/102277/elife-102277-fig6-figsupp1-data2-v1.zip
-
Figure 6—figure supplement 1—source data 3
Numerical data obtained during experiments represented in Figure 6—figure supplement 1.
- https://cdn.elifesciences.org/articles/102277/elife-102277-fig6-figsupp1-data3-v1.zip
Figure 6—figure supplement 2
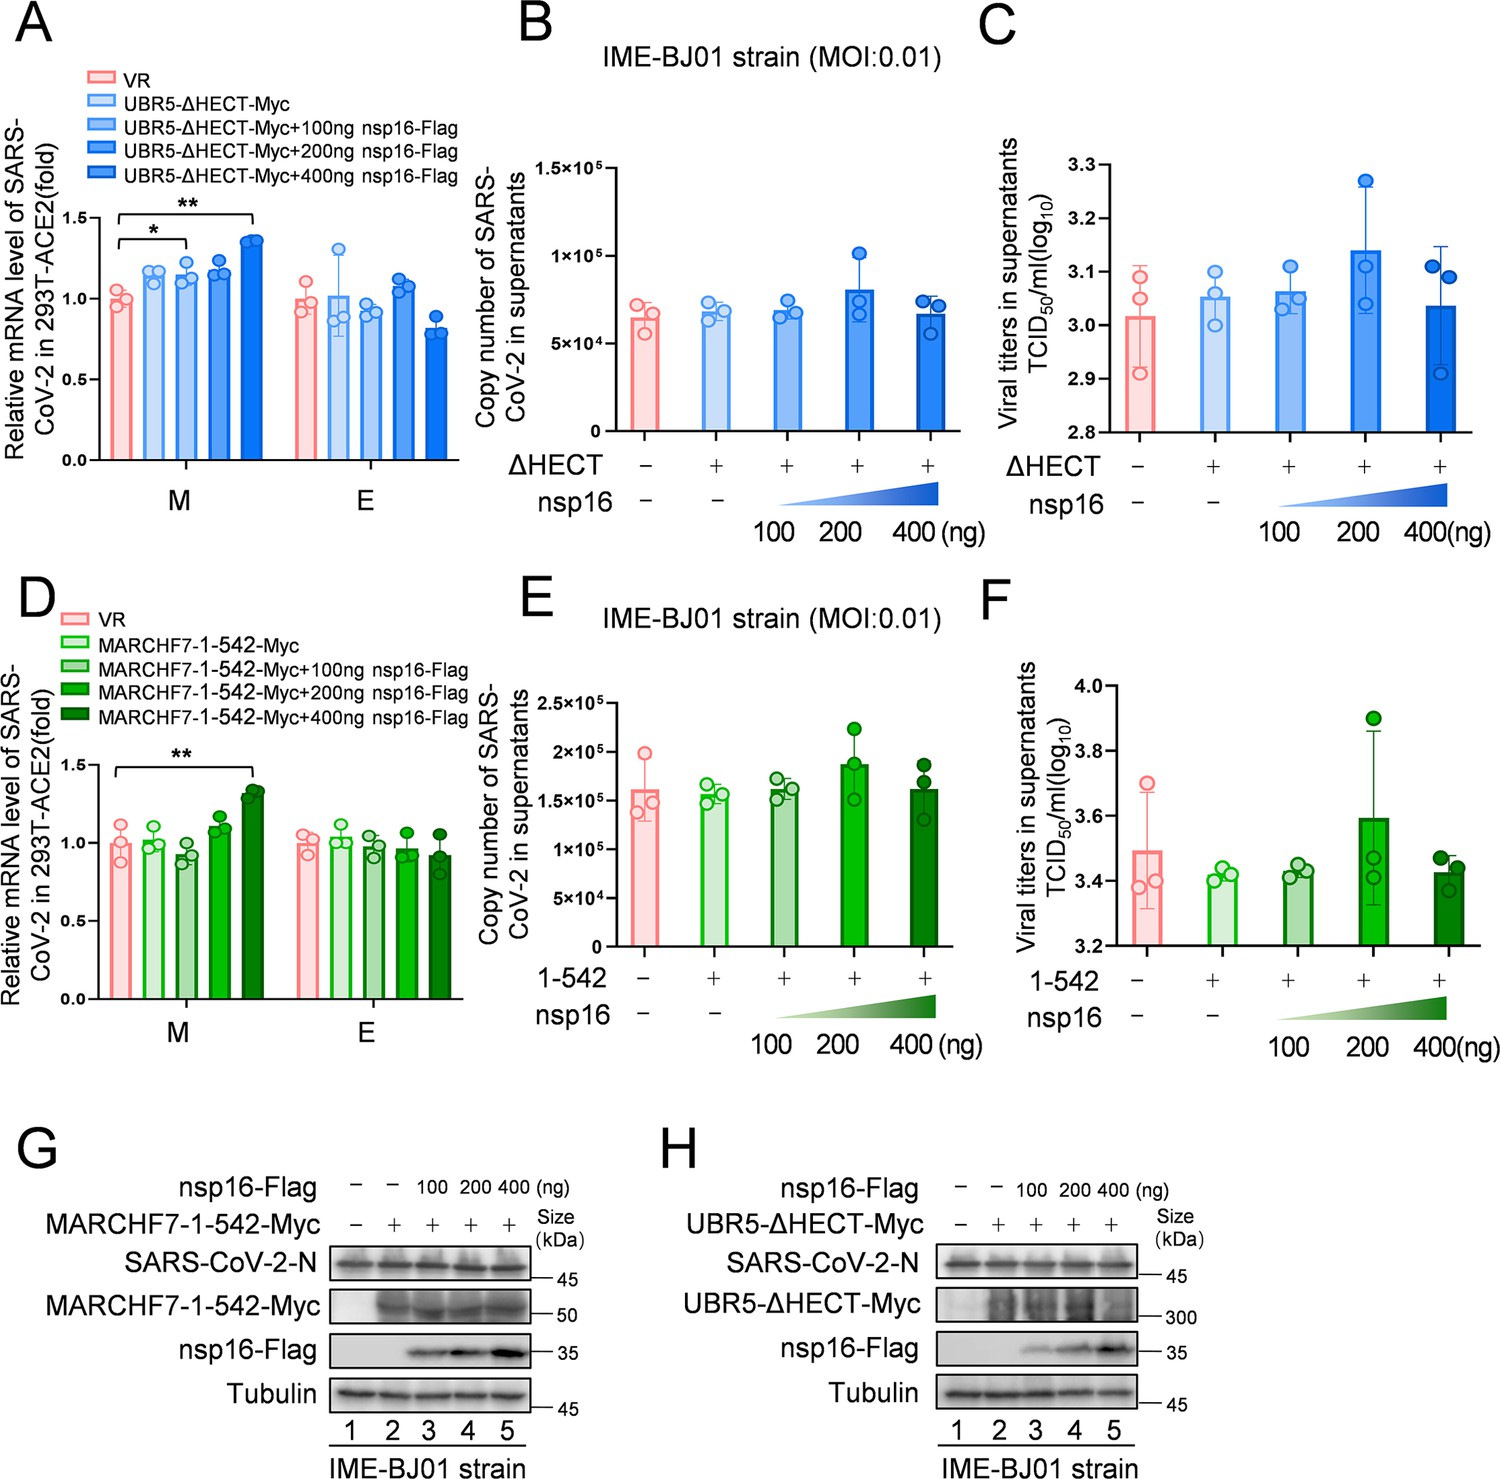
The enzyme activity-deficient mutants do not exhibit antiviral activity, and overexpression of nsp16 does not promote viral replication.
(A–H) In 293T-ACE2 cells, the Really Interesting New Gene (RING) domain deletion mutant of MARCHF7 (MARCHF7-aa 1–542) or the homologous to the E6AP carboxyl terminus (HECT) domain inactivated mutant of UBR5 (UBR5-ΔHECT) were transfected, along with a gradient of nsp16-Flag overexpression. The cells were infected with the IME-BJ01 strain (MOI: 0.01), medium was changed 2 hr post-infection, and cells and supernatants were collected 48 hr after infection. Data are representative of three independent experiments and shown as average ± SD (n=3). Significance was determined by one-way ANOVA, followed by a Tukey’s multiple comparisons posttest. p>0.05; **p<0.01; ***p<0.001.
-
Figure 6—figure supplement 2—source data 1
PDF file containing original western blots for Figure 6—figure supplement 2G and H, indicating the relevant bands and treatments.
- https://cdn.elifesciences.org/articles/102277/elife-102277-fig6-figsupp2-data1-v1.zip
-
Figure 6—figure supplement 2—source data 2
Original files for western blot analysis displayed in Figure 6—figure supplement 2G and H.
- https://cdn.elifesciences.org/articles/102277/elife-102277-fig6-figsupp2-data2-v1.zip
-
Figure 6—figure supplement 2—source data 3
Numerical data obtained during experiments represented in Figure 6—figure supplement 2.
- https://cdn.elifesciences.org/articles/102277/elife-102277-fig6-figsupp2-data3-v1.zip
Figure 6—figure supplement 3
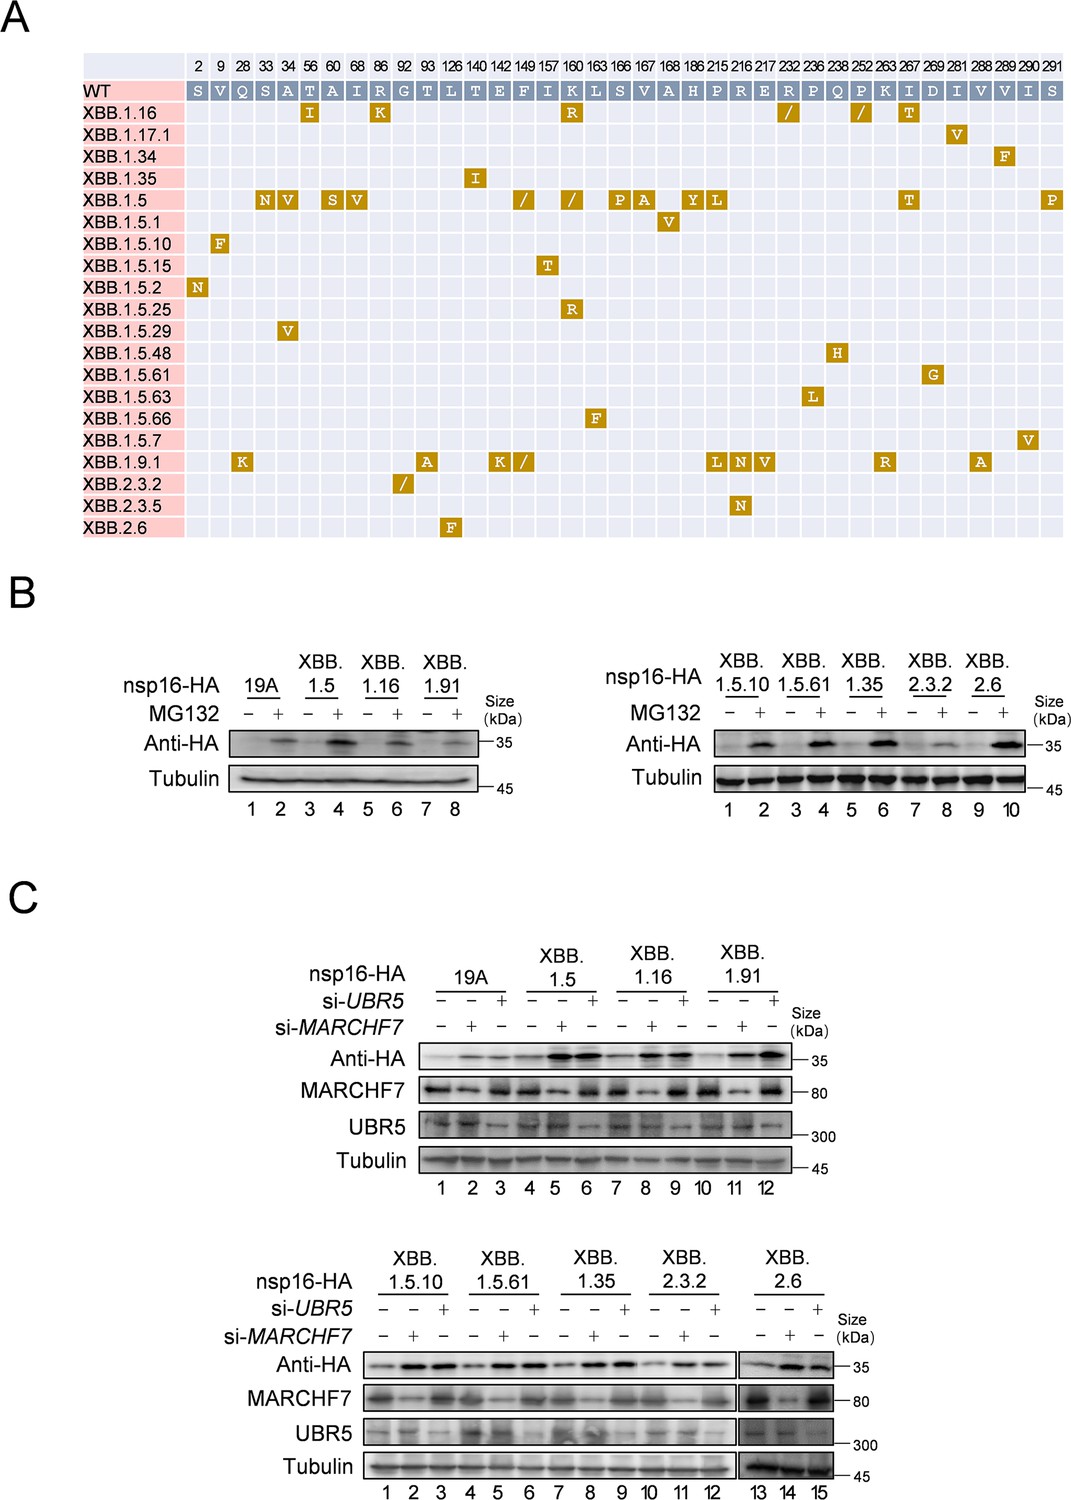
MARCHF7 or UBR5 has effects on the mutant of nsp16 in different subtypes of severe acute respiratory syndrome coronavirus 2 (SARS-CoV-2).
(A) This diagram shows the mutation of nsp16 in different virus subtypes. The amino acid sequences of different SARS-CoV-2 strains were obtained from the National Center for Biotechnology Information (NCBI), and the amino acid sequences of nsp16 of different strains were compared by DNAMAN software. (B) Nsp16 mutants can still be regulated by MG132. The mutated nsp16 plasmids were transfected into HEK293T cells. After 36 hr of culture, cells were treated with 10 µm MG132 or DMSO, harvested 12 hr later, and cell lysates were examined by immunoblotting (IB). (C) MARCHF7 or UBR5 can degrade nsp16 mutants. After transfecting MARCHF7 or UBR5 small interfering RNA (siRNA) and the mutated nsp16 plasmids, the cells were harvested 48 hr later. The cell lysates were detected by IB.
-
Figure 6—figure supplement 3—source data 1
PDF file containing original western blots for Figure 6—figure supplement 3B and C, indicating the relevant bands and treatments.
- https://cdn.elifesciences.org/articles/102277/elife-102277-fig6-figsupp3-data1-v1.zip
-
Figure 6—figure supplement 3—source data 2
Original files for western blot analysis displayed in Figure 6—figure supplement 3B and C.
- https://cdn.elifesciences.org/articles/102277/elife-102277-fig6-figsupp3-data2-v1.zip
Figure 6—figure supplement 4
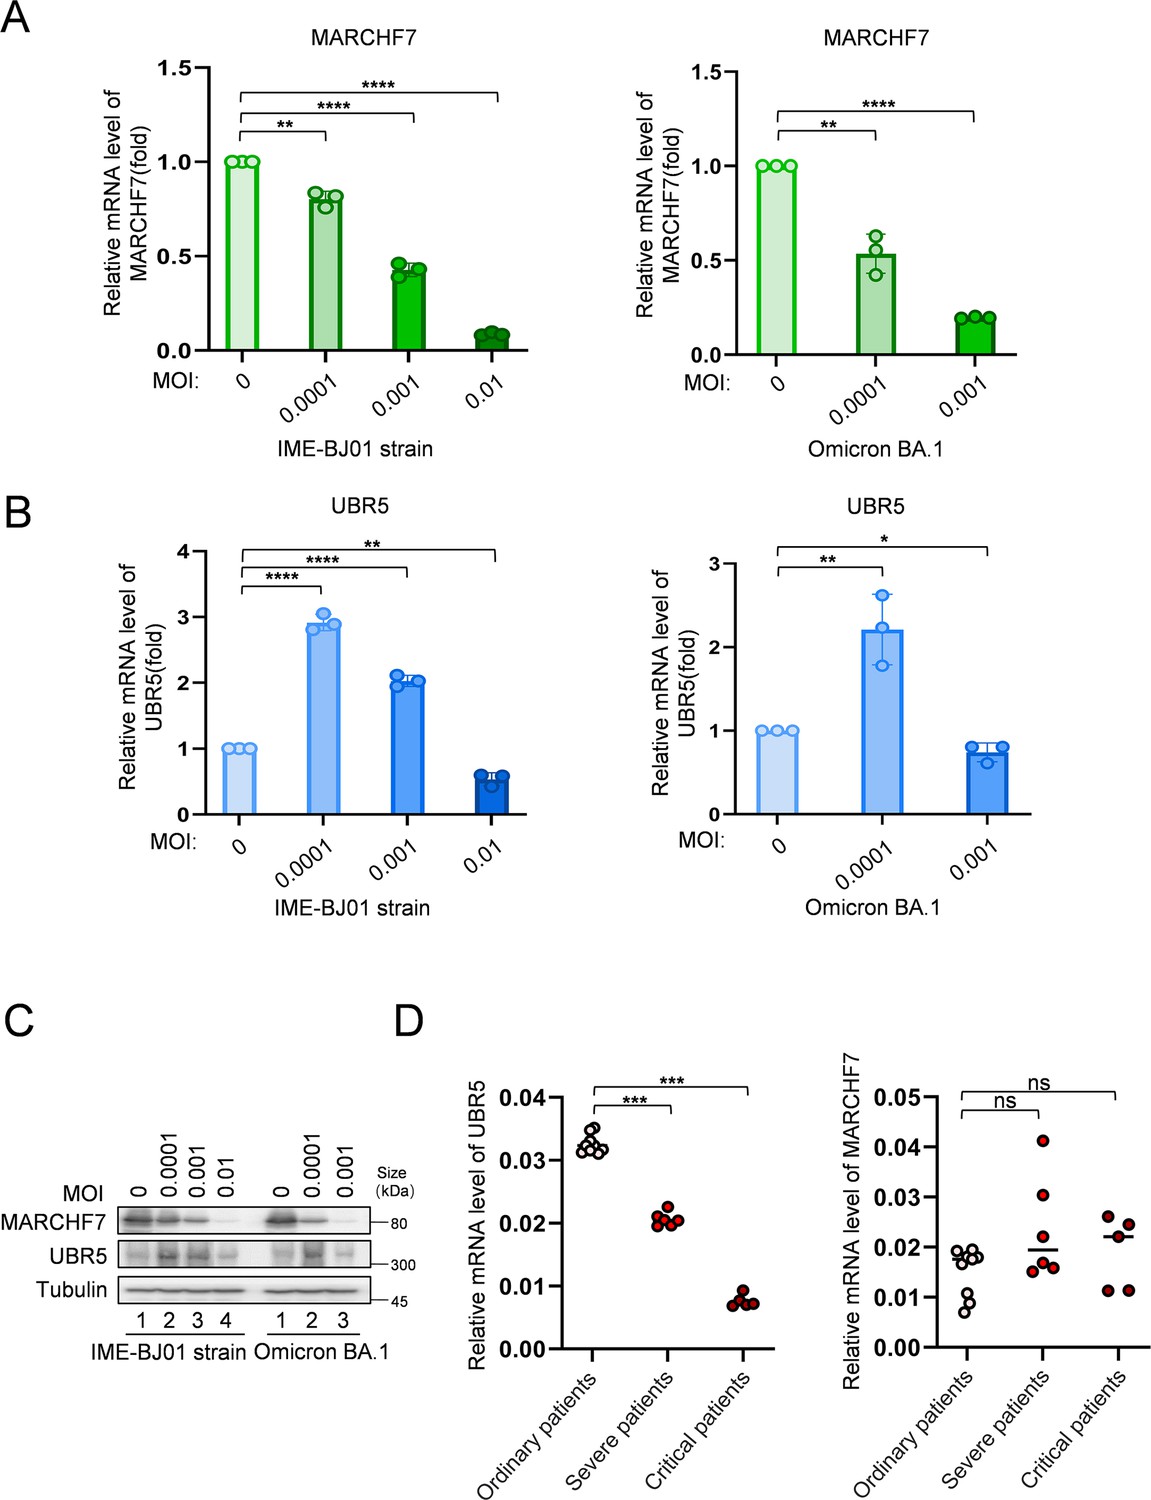
The expression level of MARCHF7 was negatively correlated with the viral titer, while the expression level of UBR5 was increased at low titer and decreased at high titer.
(A–C) The protein and mRNA levels of MARCHF7 or UBR5 upon infection with different titers. Endogenous MARCHF7 and UBR5 RNA levels were detected by RT-qPCR 48 hr after infection with different titers of IME-BJ01 strain (MOI: 0, 0.0001, 0.001, 0.01) or Omicron BA.1 strain (MOI: 0, 0.0001, 0.001). Protein levels were examined by immunoblotting (IB). (D) The expression level of UBR5 was negatively correlated with the severity of the disease, but MARCHF7 expression levels were not. Peripheral blood mononuclear cells (PBMCs) were extracted from common, severe, and critical coronavirus disease 2019 (COVID-19) patients. RT-qPCR was used to detect the mRNA level of UBR5 or MARCHF7 in patients. Significance was determined by one-way ANOVA, followed by a Tukey’s multiple comparisons posttest. ns, p>0.05; **p<0.01; ***p<0.001.
-
Figure 6—figure supplement 4—source data 1
PDF file containing original western blots for Figure 6—figure supplement 4C, indicating the relevant bands and treatments.
- https://cdn.elifesciences.org/articles/102277/elife-102277-fig6-figsupp4-data1-v1.zip
-
Figure 6—figure supplement 4—source data 2
Original files for western blot analysis displayed in Figure 6—figure supplement 4C.
- https://cdn.elifesciences.org/articles/102277/elife-102277-fig6-figsupp4-data2-v1.zip
-
Figure 6—figure supplement 4—source data 3
Numerical data obtained during experiments represented in Figure 6—figure supplement 4.
- https://cdn.elifesciences.org/articles/102277/elife-102277-fig6-figsupp4-data3-v1.zip
Figure 7
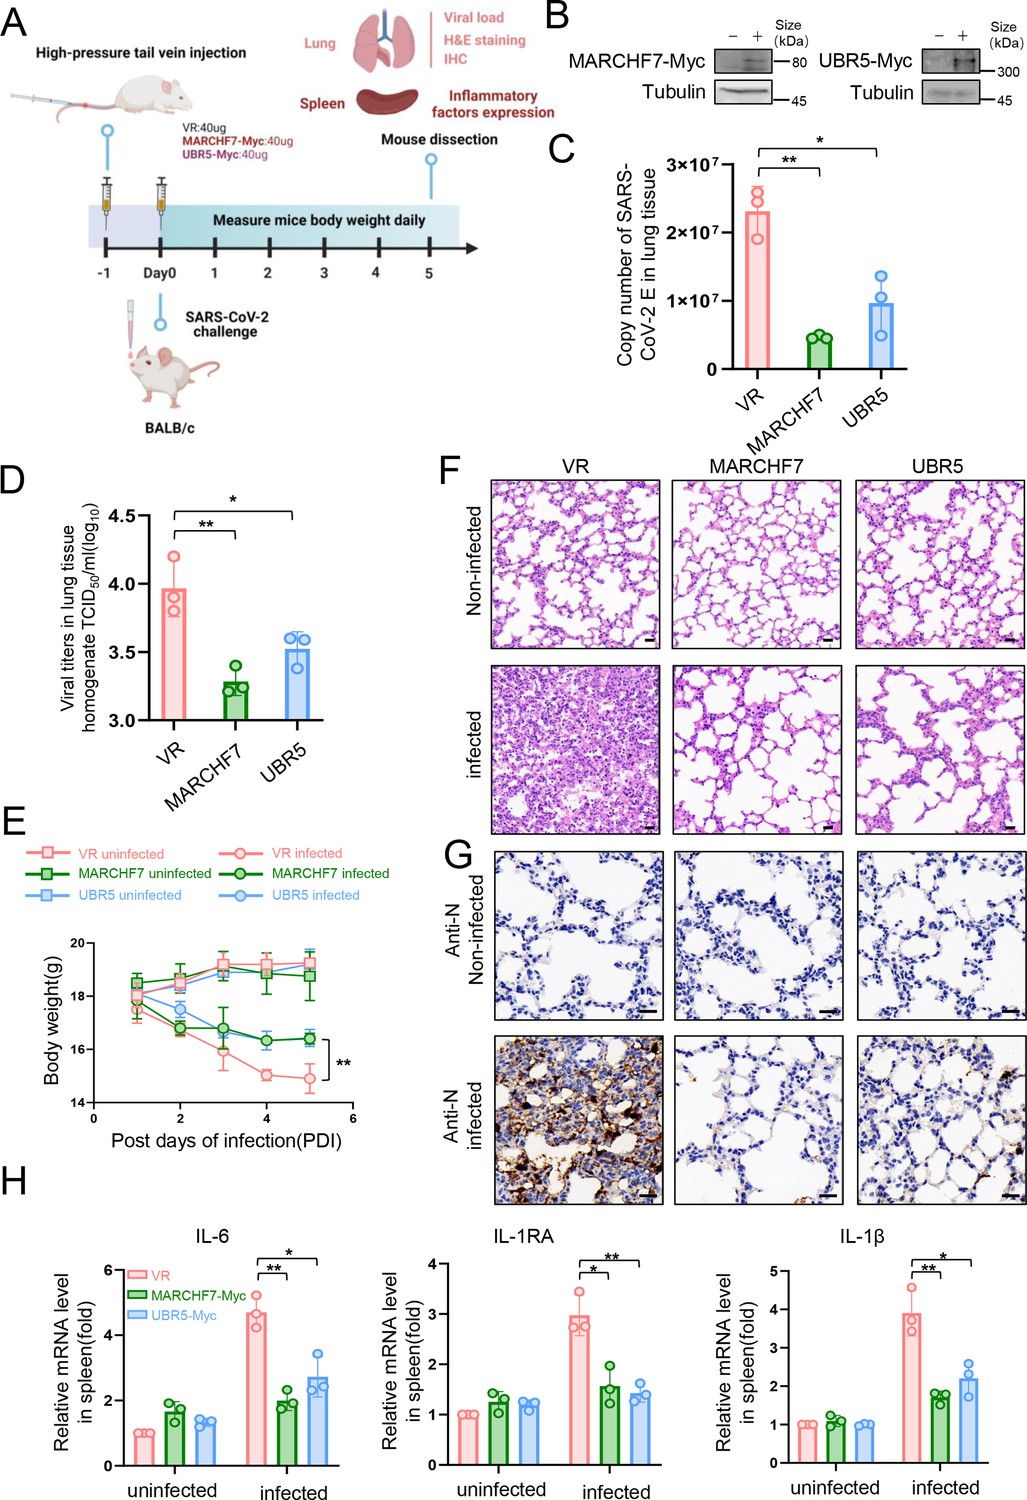
In a mouse infection model, overexpression of MARCHF7 or UBR5 exerted inhibitory effects on the virus.
(A–G) BLAB/C mice were injected with the corresponding plasmids at 40 µg/500 µl via the high-pressure tail vein, followed by nasal inoculation with 50 µl severe acute respiratory syndrome coronavirus 2 (SARS-CoV-2) virus at a dosage of 105.5 TCID50/ml (created with BioRender.com and the agreement no. is OO281XWHNA). Immunoblotting (IB) was used to detect the expression of MARCHF7 or UBR5 in the lung tissues (B). Viral RNA loads in mouse lung tissues were detected by measuring the mRNA levels of the E genes by RT-qPCR (C). Lung tissue was collected, homogenized, and the residue was removed by centrifugation to collect the supernatant. The viral titer was then measured using the TCID50 method (D). Mouse body weight was monitored during the experimental period (E). Representative images of hematoxylin and eosin (H&E) staining of lungs of mice with different treatments. Magnification, ×40. Scale bars, 20 µm (F). The staining of viral N proteins. Magnification, ×63. Scale bars, 20 µm. n=3 in each group (G). RT-qPCR was used to measure the expression of cytokines and chemokines in the spleens of mice in each group (H). Statistical significance was analyzed using a one-way analysis of variance with Tukey’s multiple comparisons test (NS, no significance, *p<0.05, **p<0.01, ***p<0.001).
-
Figure 7—source data 1
PDF file containing original western blots for Figure 7B, indicating the relevant bands and treatments.
- https://cdn.elifesciences.org/articles/102277/elife-102277-fig7-data1-v1.zip
-
Figure 7—source data 2
Original files for western blot analysis displayed in Figure 7B.
- https://cdn.elifesciences.org/articles/102277/elife-102277-fig7-data2-v1.zip
-
Figure 7—source data 3
Numerical data obtained during experiments represented in Figure 7.
- https://cdn.elifesciences.org/articles/102277/elife-102277-fig7-data3-v1.zip
Figure 8 with 1 supplement
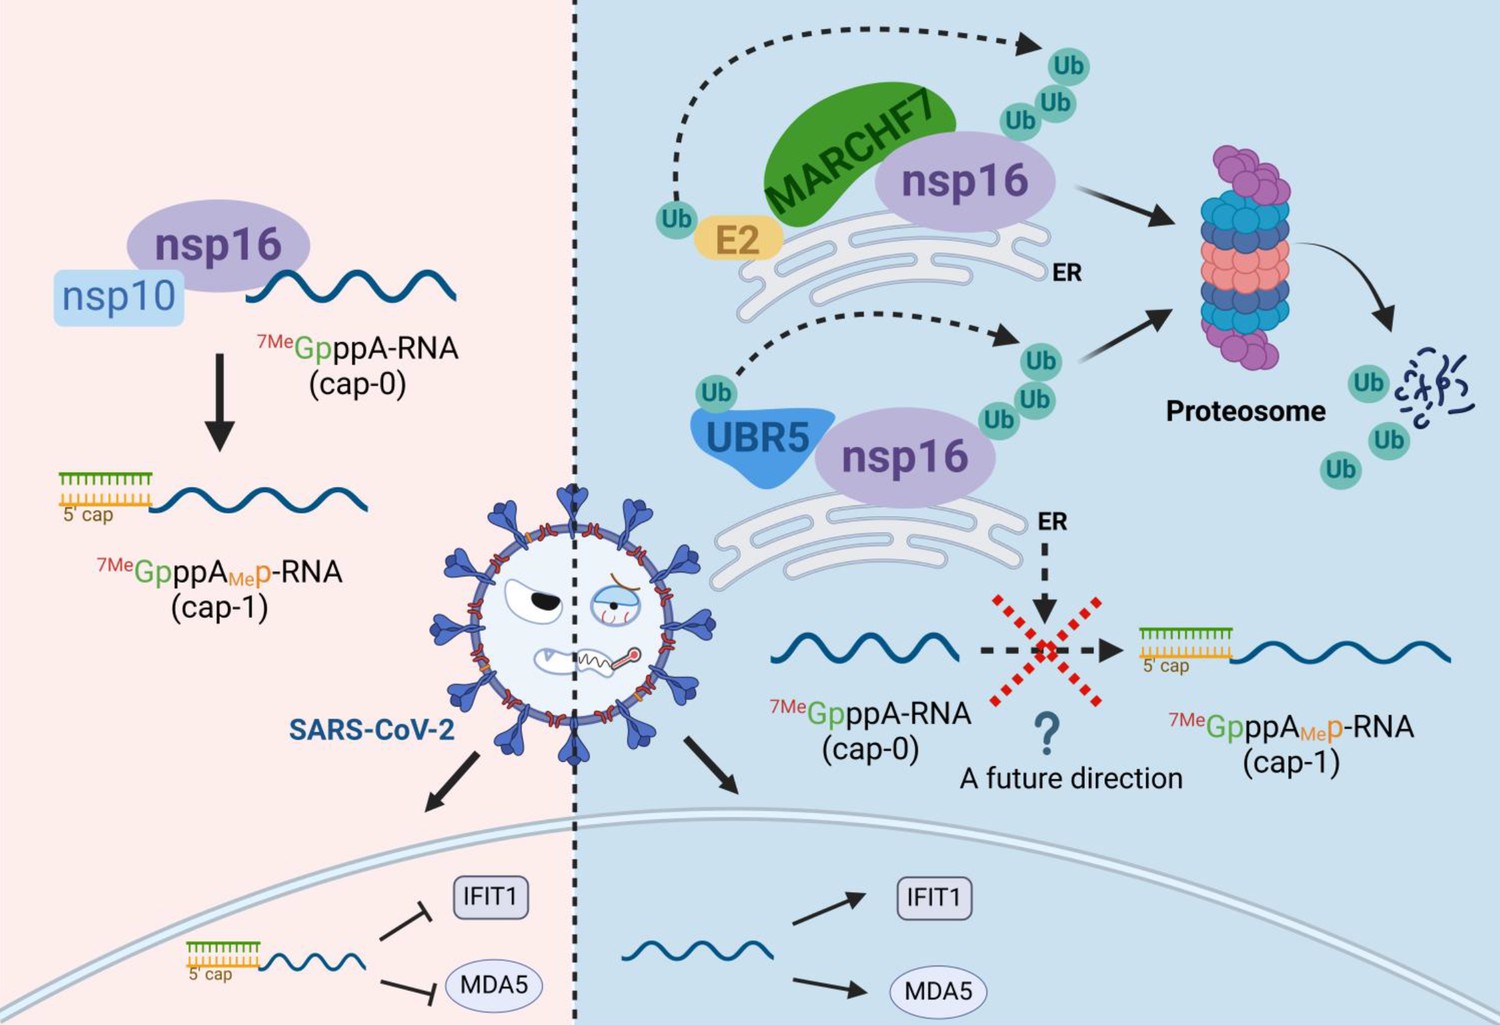
Schematic diagram of MARCHF7 and UBR5 ubiquitinate the severe acute respiratory syndrome coronavirus 2 (SARS-CoV-2) nonstructural protein nsp16, leading to its degradation via the proteasomal pathway, thereby affecting viral replication (created with BioRender.com and the agreement no. is EV281XWATL).
Figure 8—figure supplement 1
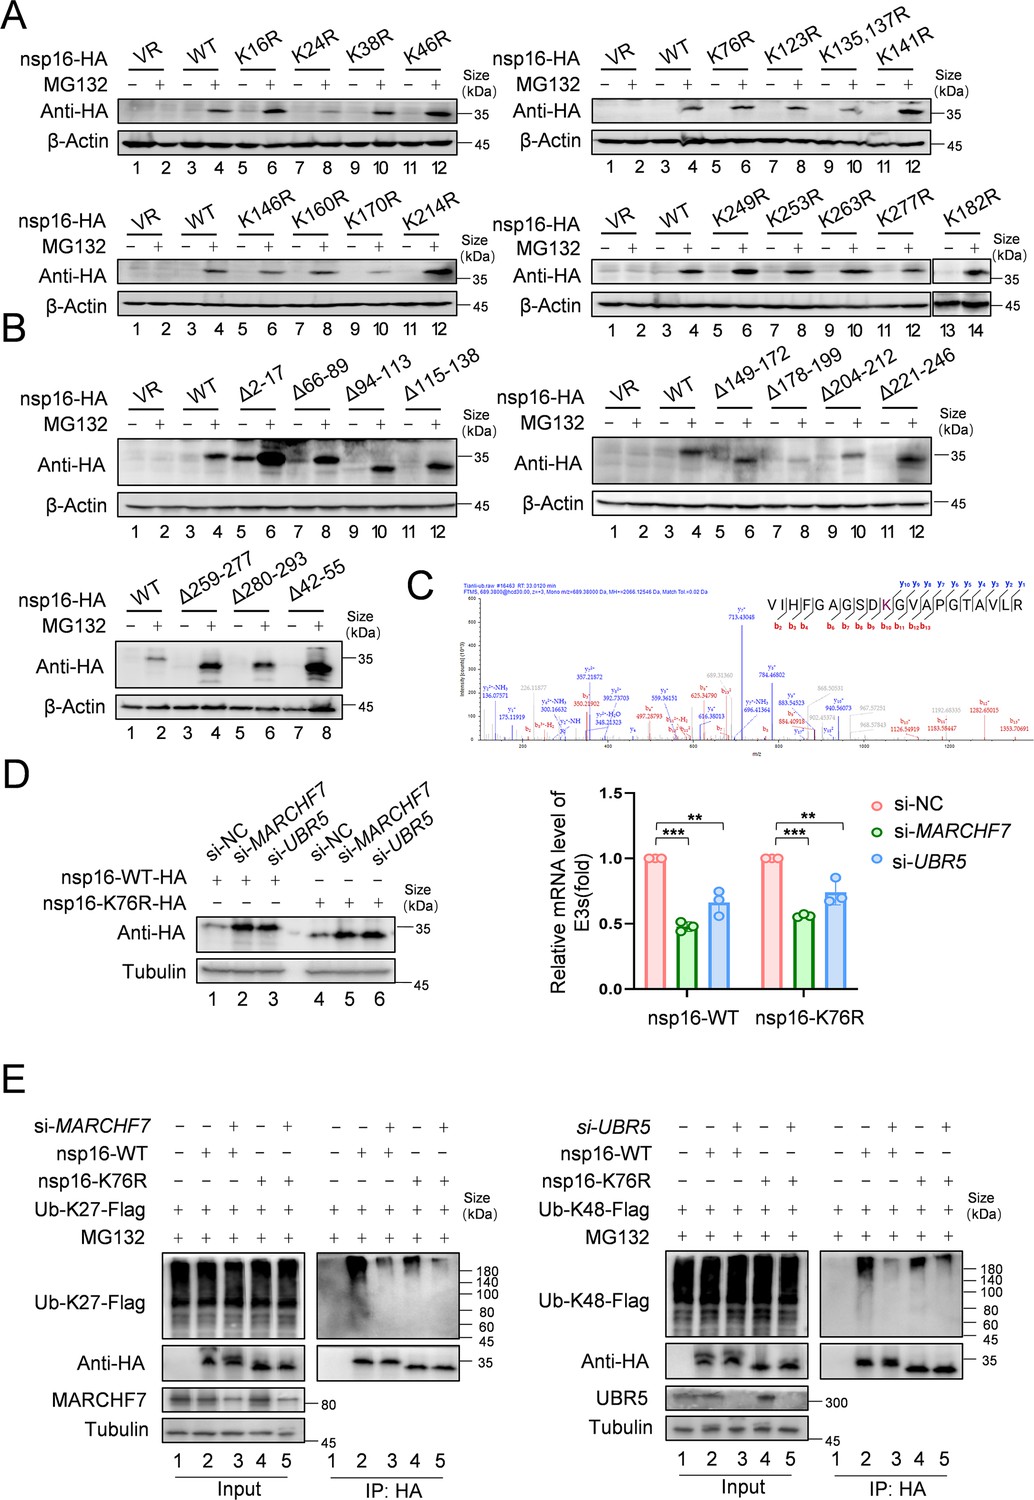
Identification of the ubiquitination modification site of nsp16 protein.
(A) Single-lysine mutation of nsp16 protein can be restored by MG132. Single-lysine mutants of nsp16 protein were obtained through mutagenesis and overexpressed in 293T cells. After 36 hr, cells were treated with either MG132 or DMSO for 16 hr and then harvested. Protein levels were detected by immunoblotting (IB) using the HA antibody. (B) nsp16 protein truncates can be restored by MG132. nsp16 protein truncates were obtained through structural analysis and mutations. IB was performed to determine whether the truncates could be restored by MG132. (C) The mass spectrometry analysis identified the ubiquitination modification site at lysine 76. nsp16-Flag was overexpressed in 293T cells, followed by MG132 treatment and cell harvest. nsp16 protein was enriched using Flag antibody-conjugated protein G beads. Flag-peptide competition was used to obtain the nsp16-containing solution. The protein and ubiquitination status were visualized by SDS-PAGE and Coomassie staining. Mass spectrometry was used for further analysis. (D) Degradation of nsp16-K76R is still regulated by MARCHF7 or UBR5. A plasmid with a mutation at lysine 76 of nsp16 to arginine (nsp16-K76R) was constructed. MARCHF7 or UBR5 was knocked down by small interfering RNA (siRNA) in 293T cells. nsp16-WT or nsp16-K76R was transfected the next day, and cells were harvested 48 hr later. Protein levels were detected by IB. (E) Ubiquitination levels of nsp16-K76R are reduced but still regulated by MARCHF7 or UBR5. MARCHF7 or UBR5 was knocked down using siRNA in 293T cells. The cells were co-transfected with Ub-K27 or K48, and nsp16-WT or nsp16-K76R mutant. Cells were harvested 48 hr later, with MG132 treatment 16 hr before harvesting. Co-immunoprecipitation (Co-IP) experiments were performed to analyze the ubiquitination status of nsp16-WT or its mutant. Data are representative of three independent experiments and shown as average ± SD (n=3). Significance was determined by one-way ANOVA, followed by a Tukey’s multiple comparisons posttest. p>0.05; **p<0.01; ***p<0.001.
-
Figure 8—figure supplement 1—source data 1
PDF file containing original western blots for Figure 8—figure supplement 1A, B, D, and E, indicating the relevant bands and treatments.
- https://cdn.elifesciences.org/articles/102277/elife-102277-fig8-figsupp1-data1-v1.zip
-
Figure 8—figure supplement 1—source data 2
Original files for western blot analysis displayed in Figure 8—figure supplement 1A, B, D, and E.
- https://cdn.elifesciences.org/articles/102277/elife-102277-fig8-figsupp1-data2-v1.zip
-
Figure 8—figure supplement 1—source data 3
Numerical data obtained during experiments represented in Figure 8—figure supplement 1.
- https://cdn.elifesciences.org/articles/102277/elife-102277-fig8-figsupp1-data3-v1.zip
Additional files
-
Supplementary file 1
Primers used in this study.
- https://cdn.elifesciences.org/articles/102277/elife-102277-supp1-v1.xls
-
Supplementary file 2
Patients’ clinical information in this study.
- https://cdn.elifesciences.org/articles/102277/elife-102277-supp2-v1.xls
-
MDAR checklist
- https://cdn.elifesciences.org/articles/102277/elife-102277-mdarchecklist1-v1.docx
Download links
A two-part list of links to download the article, or parts of the article, in various formats.
Downloads (link to download the article as PDF)
Open citations (links to open the citations from this article in various online reference manager services)
Cite this article (links to download the citations from this article in formats compatible with various reference manager tools)
SARS-CoV-2 nsp16 is regulated by host E3 ubiquitin ligases, UBR5 and MARCHF7
eLife 13:RP102277.
https://doi.org/10.7554/eLife.102277.4


