Planar cell polarity-mediated induction of neural stem cell expansion during axolotl spinal cord regeneration
- Deutsche Forschungsgemeinschaft – Center for Regenerative Therapies Dresden, Germany
- Max Planck Institute of Molecular Cell Biology and Genetics, Germany
- Technische Universität Dresden, Germany
- University of La Plata, Argentina
Figures
Figure 1
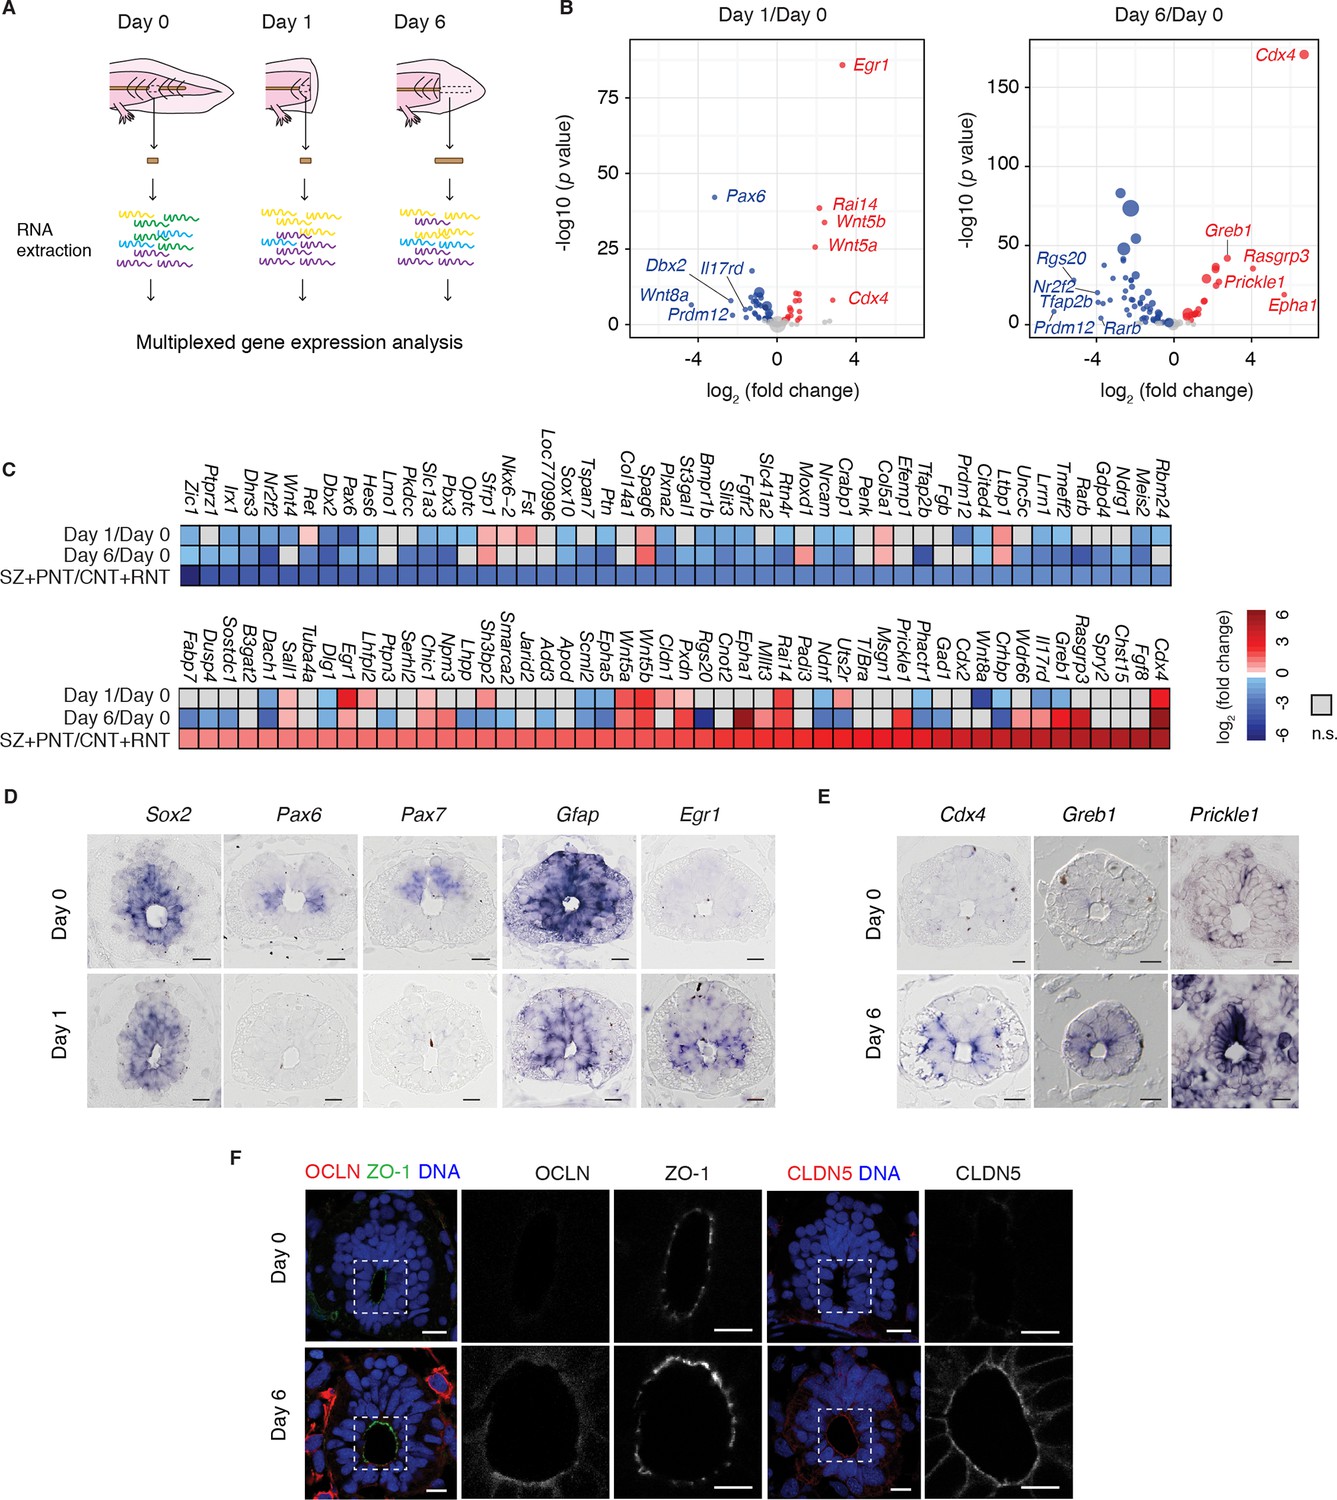
Neural stem cells in the axolotl spinal cord reactivate molecular features associated with embryonic neuroepithelial cells upon injury.
(A) Schematic of the distinct regions microdissected for NanoString expression profiling. 48–50 pieces of spinal cord were pooled together for each of the 3 biological replicates per group. (B) Changes in gene expression (log2 fold change) in cells of the source zone at day 1 (left) and regenerating spinal cord at day 6 (right) versus cells in the uninjured spinal cord (day 0). Y-axis shows the statistical significance of these changes (−log10 p value). Red dots, upregulated genes; blue dots, downregulated genes; grey dots, genes that are not significantly regulated in regenerating versus uninjured samples. N=3 samples per group. P values indicate the results of negative binomial tests. p<0.05 (FDR < 0.07) was considered significant. Dot area is proportional to the number of transcripts counted for that gene. Names are the top five upregulated (red) and top five downregulated (blue) genes in the dataset. (C) Heat map of fold change in gene expression values in regenerating spinal cord versus uninjured spinal cord, side by side with the reported fold change values in the stem zone and pre-neural tube (SZ+PNT) compared to more advanced rostral and caudal neural tube (CNT+RNT) of the embryonic chick spinal cord, as described in (Olivera-Martinez et al., 2014). Dataset used to generate the volcano plots and heat maps can be found in Figure 1—source data 1. (D) In situ hybridization on spinal cord cross-sections at day 0 (top) and of the regeneration source zone at day 1 (bottom). (E) In situ hybridization on spinal cord cross-sections at day 0 (top) and regenerating spinal cord at day 6 (bottom). (F) Immunofluorescence on cross-sections of uninjured (top) and regenerating spinal cord at day 6 (bottom) for the apical junctional proteins ZO-1, OCLN, and CLDN5. DNA is labeled with Hoechst. Insets show the apical surface of the spinal cord at higher magnification. Images are single optical sections using the same acquisition parameters on sections from the same slide. Observations were consistent in more than 5 axolotls. Scale bars, 20 μm.
-
Figure 1—source data 1
Gene expression changes in the regenerating axolotl spinal cord compared to the uninjured axolotl spinal cord.
- https://doi.org/10.7554/eLife.10230.004
Figure 2
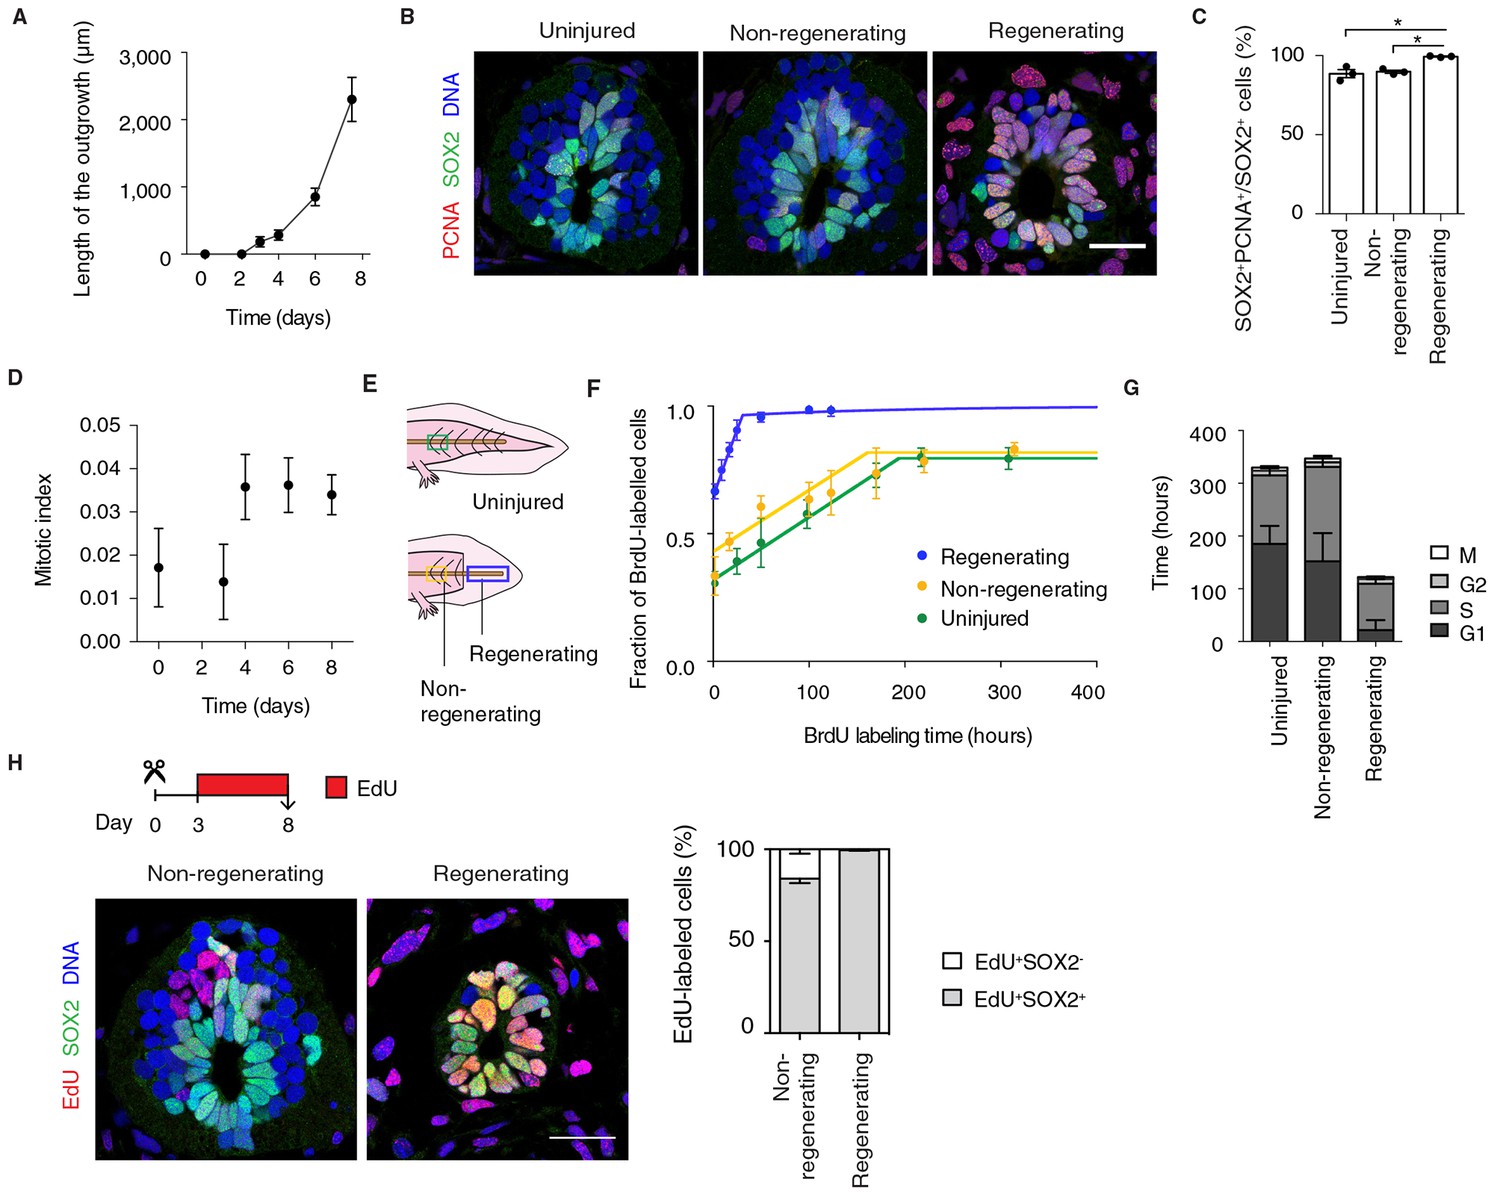
Fast, proliferative divisions underlie the expansion of neural stem cells in the regenerating spinal cord.
(A) Length of spinal cord outgrowth during the first 8 days of regeneration. Data, mean ± s.d. of n=3 tails/time-point. (B) Immunofluorescence for the neural stem cell marker SOX2 and the proliferation marker PCNA on cross-sections of uninjured spinal cord and regenerating and non-regenerating regions of the spinal cord at day 6 after amputation. DNA is labeled with Hoechst. Scale bar, 50 μm. (C) Percentage of SOX2+PCNA+/SOX2+ cells per cross-section in regenerative and non-regenerative settings, from images as in B. Error bars, mean ± s.e.m of n=3 tails/region. P=0.691, uninjured versus non-regenerating; P=0.014, uninjured versus regenerating; p=0.001, non-regenerating versus regenerating (two-tailed unpaired Student's t-test). Asterisks indicate statistical significance at p<0.05. (D) Mitotic index during the first 8 days of regeneration. Error bars, mean ± propagated errors of n=3 tails/time-point. (E) Schematic of the distinct cell populations considered in the cell cycle analysis. The uninjured neural stem cell population (green) was analyzed from uninjured tails; the non-regenerating cell population, from 1,500 μm anterior to the amputation plane (yellow); and the regenerating cell population from the regenerating spinal cord, posterior to the amputation plane (blue). (F) Fraction of BrdU-labeled cells at different times of continuous BrdU labeling. Curves are the least-squares fit of a mathematical model of BrdU incorporation to the experimental data (see Materials and methods). Colors indicate the neural stem cell populations as in Figure 2E. Error bars, mean ± s.d. of n≥5 tails/time-point. (G) Cell cycle parameters of uninjured, non-regenerating, and regenerating neural stem cell populations, calculated from data in D and F. Error bars, mean ± 1σ confidence intervals. Data can be found in Supplementary file 1 and http://nbviewer.jupyter.org/gist/fabianrost84/3cc58a27b5688f4e2eba. (H) EdU was injected daily from day 3 to day 8 of regeneration, when tails were collected for analysis. Representative images of non-regenerating and regenerating regions of the spinal cord. SOX2 labels neural stem cells, EdU labels cells that underwent DNA synthesis and their progeny, and Hoechst labels DNA. Quantification of the percentage of EdU+ cells that remain as neural stem cells (SOX2+) or differentiatiate (SOX2-) over total EdU+ cells after the six-day chase. Error bars, mean ± s.e.m. of n=4 tails/region. Scale bar, 50 μm. A supplementary IPython notebook (Pérez and Granger, 2007) containing all the raw data and the code used for the estimations of mitotic index, cell cycle length and cell cycle parameters is available at http://nbviewer.jupyter.org/gist/fabianrost84/3cc58a27b5688f4e2eba.
Figure 3
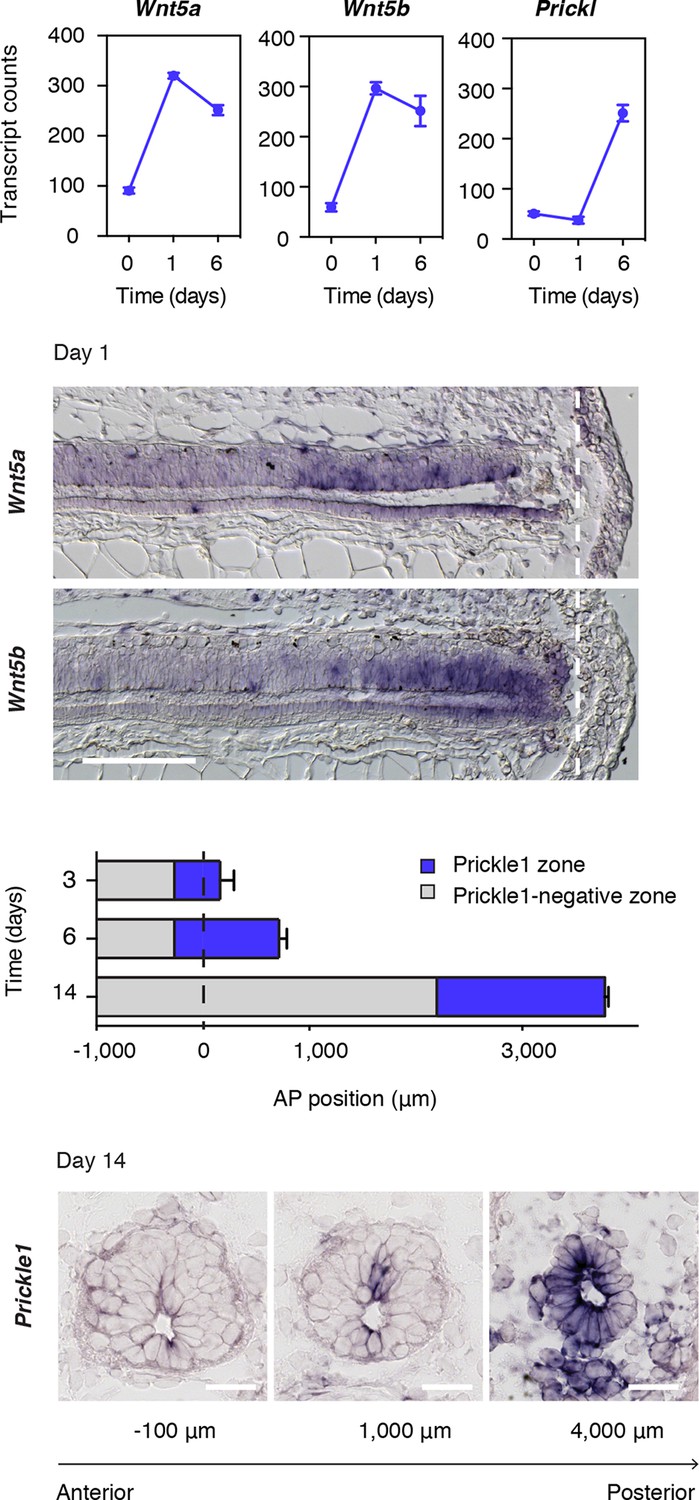
Wnt5 genes and the PCP gene Prickle1 are upregulated during spinal cord regeneration.
(A) Mean ± s.d. of transcript counts of Wnt5a, Wnt5b, and Prickle1 in uninjured and regenerating spinal cord as measured by NanoString (see also Figure 1). N=3 samples/time-point. (B) Wnt5a and Wnt5b in situ on longitudinal sections of axolotl tails 1 day after amputation. Note that Wnt5a and Wnt5b transcripts are precisely upregulated in the source zone. Dashed lines, amputation plane. Scale bar, 400 μm. (C) Quantification of the Prickle1 zone (blue boxes) on cross-sections along the AP axis of regenerating spinal cords at day 3 (429 μm ± 32 μm), day 6 (981 μm ± 74 μm), and day 14 (1579 μm ± 129 μm). Data, mean ± s.d. of n=3 tails/time-point. (D) Representative images of Prickle1 in situ at different AP levels of a 14 days regenerating spinal cord. The numbers below each image indicate its AP position from the amputation plane. Negative numbers are anterior and positive numbers posterior to the amputation plane. Note that Prickle1 is highly expressed in the caudal-most portion of the regenerating spinal cord that remains as a simple neuroepithelium but undetectable close to the amputation plane, in the more advanced spinal cord tissue. Scale bars, 50 μm.
Figure 4
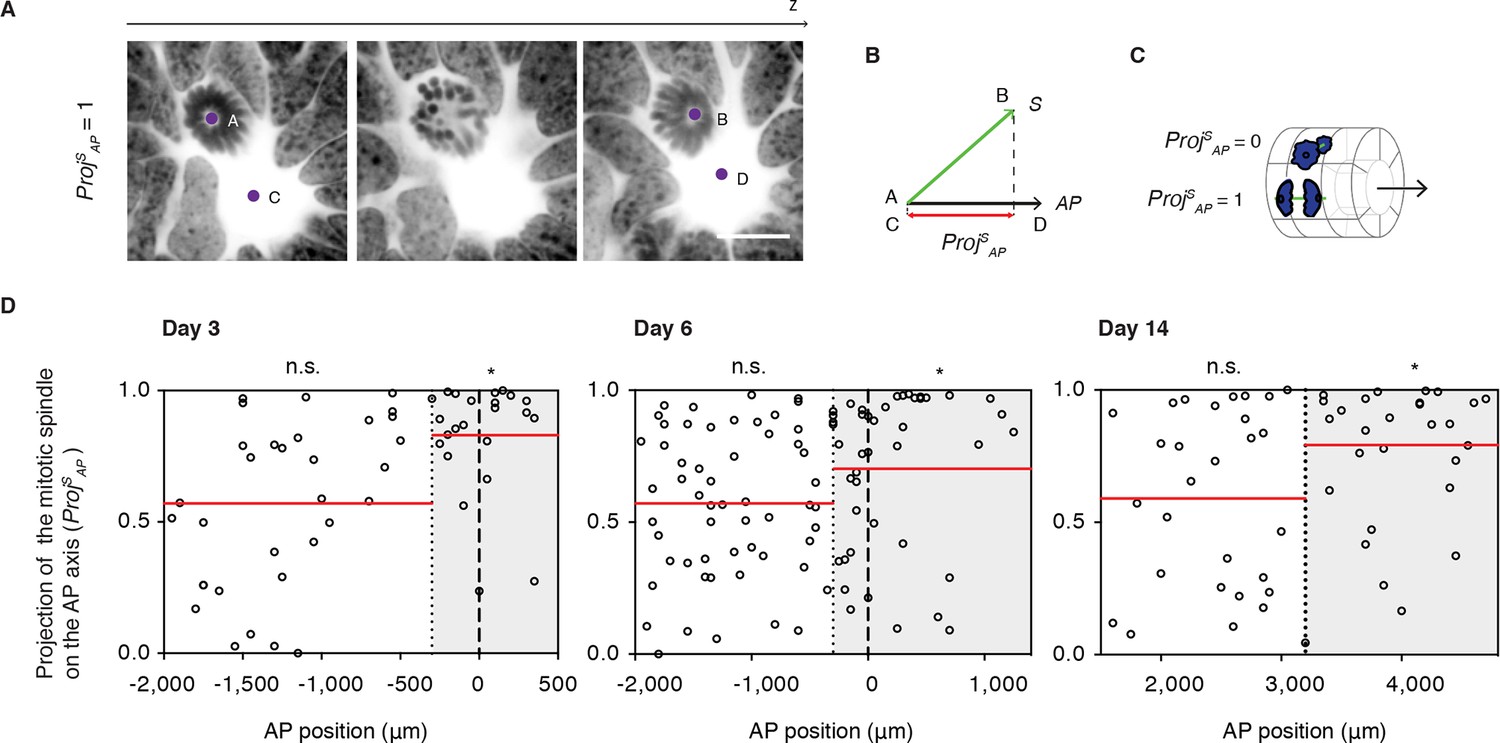
Cell divisions orient along the AP axis in the Prickle1 zone of the regenerating spinal cord.
(A) Images show single optical confocal sections through a cell dividing along the AP axis regenerating axolotl spinal cord (from Video 1). DNA is labeled with Hoechst (inverted grayscale). Scale bar, 10 μm (A,B) The spindle vector (S) is defined by two points (A and B) obtained from the spindle poles, and the AP axis vector (AP) is defined by two points (C and D) in the center of the spinal cord central canal in the first and last optical slice of the z-stack. The projection of S on the AP vector (ProjSAP) was used as a proxy of cell division orientation. (C) ProjSAP ranges from a value of 0, for divisions orthogonal to the AP axis, to 1, for divisions parallel to the AP axis. (D) Distribution of the projection of mitotic spindles on the AP axis at day 3, day 6, and day 14 after amputation. Each dot represents a cell division. Dotted lines mark the boundaries of the Prickle1 zone (gray boxes) as calculated in Figure 3C. Dashed lines mark the amputation planes. Red lines mark the mean value of the ProjSAP along the AP axis within the Prickle1 zone and the Prickle1-negative zone. Note that cells divide preferentially oriented along the AP axis within the Prickle1 zone of the regenerating spinal cord (day 3 n=23 cells, day 6 n=43 cells, day 14 n=27 cells) but not in the Prickle-negative zone (day 3 n=32 cells, day 6 n=53, day 14 n=29 cells). Cells pooled from at least 4 tails/group. Statistics within the Prickle1 zone and the Prickle1-negative zone to test whether the distribution deviates from uniform more than two standard deviations. * p<0.05, n.s. is not significant.
Figure 5 with 2 supplements
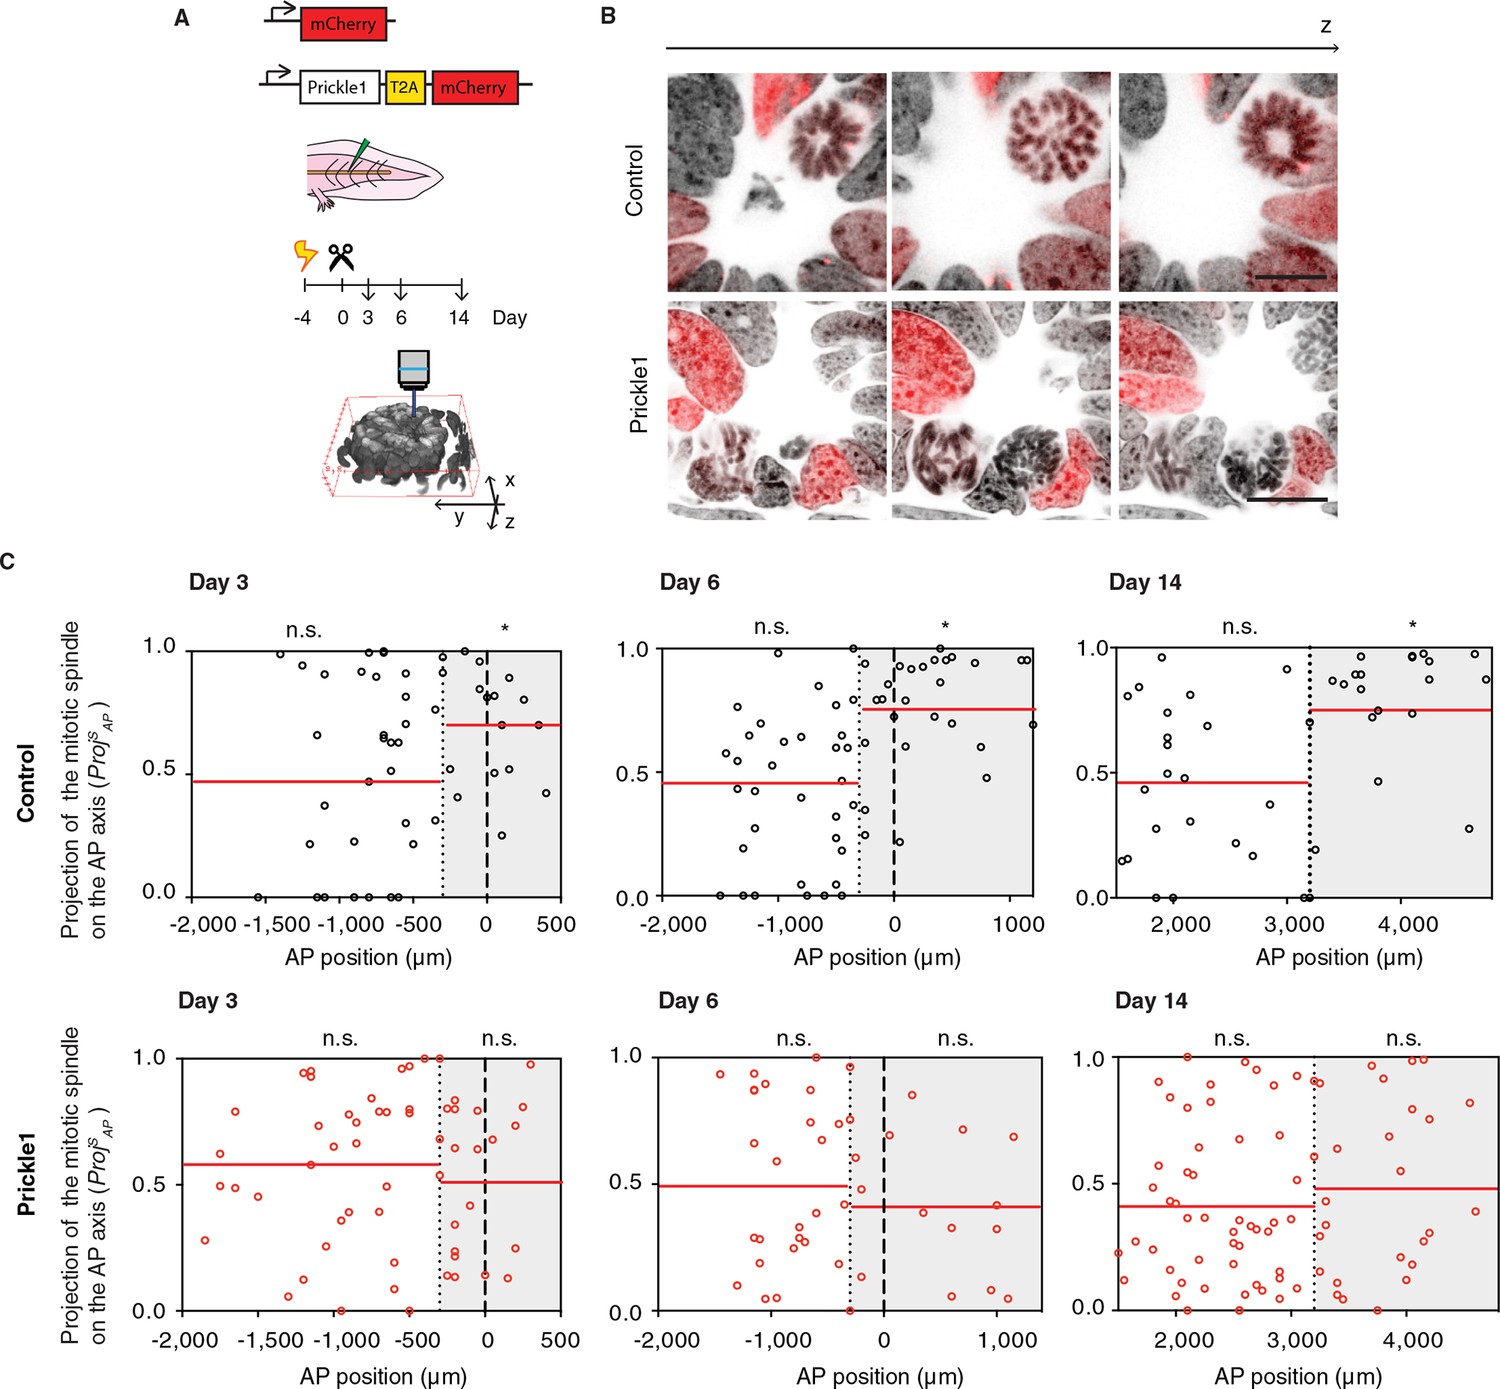
Prickle1 overexpression randomizes cell division orientation in the regenerating spinal cord.
(A) Spinal cord cells were electroporated either with a construct encoding for axolotl Prickle1, the T2A self-cleavage peptide, and mCherry, or mCherry alone. Amputated tails were allowed to regenerate 3, 6, and 14 days. Confocal z-stacks of electroporated cells in late anaphase or telophase were acquired for analysis. (B) Images show single optical confocal sections through representative dividing control cell (top, and Video 2) and Prickle1-overexpressing cell (bottom, and Video 3). Electroporated cells express nuclear mCherry (red). DNA is labeled with Hoechst (inverted grayscale). Scale bar, 10 μm. (C,D) Distribution of the projection of mitotic spindles on the AP axis in control (C and Prickle1-overexpressing cells (D) at day 3, day 6, and day 14 after amputation. Each dot represents a cell division. Dotted lines mark the boundaries of the Prickle1 zone (gray boxes) as calculated in Figure 3C. Dashed lines mark amputation planes. Red lines mark the mean value of ProjSAP. Note that control cells divide randomly within the Prickle1-negative zone (day 3 n=22 cells, day 6 n=34, day 14 n=22 cells), but show significant bias towards the AP axis within the Prickle1 zone (day 3 n=17 cells, day 6 n=27, day 14 n=21 cells). The bias to divide along the AP axis is lost in cells overexpressing Prickle1 within the Prickle1 zone (day 3 n=22 cells, day 6 n=18 cells, day 14=28 cells). Cells pooled from at least 4 tails/group. Statistics within the Prickle1 zone and the Prickle1-negative zone to test whether the distribution deviates from uniform more than two standard deviations. * p < 0.05, n.s. is not significant.
Figure 5—figure supplement 1
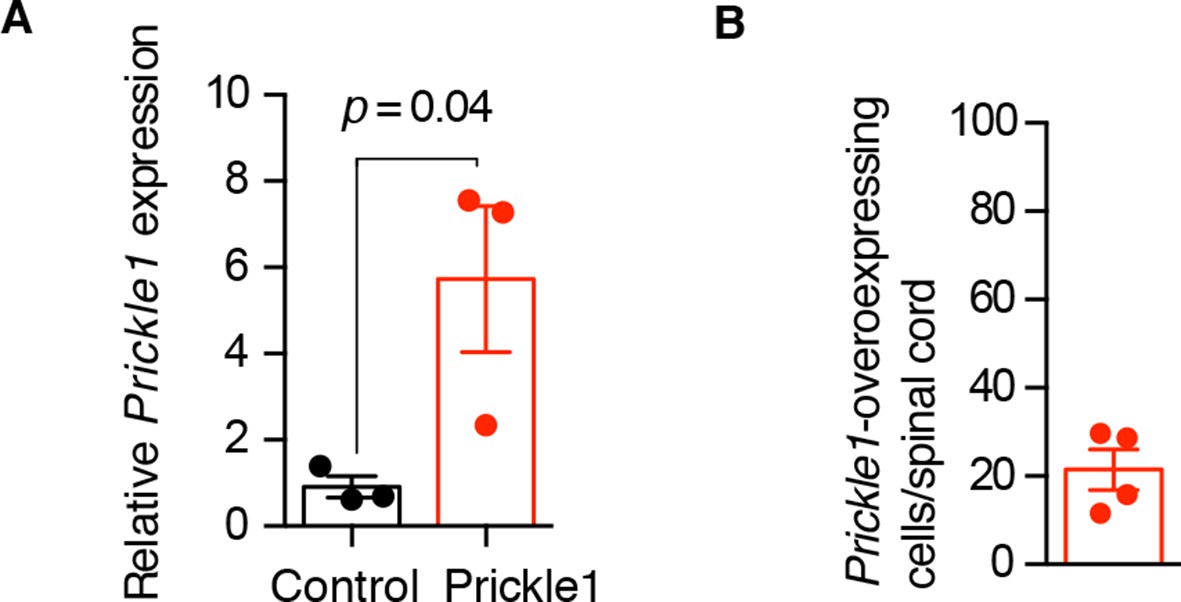
Characterization of Prickle1 expression in control and Prickle1-overexpressing spinal cords.
(A) Quantitative RT-PCR of Prickle1 expression in the regenerating region (day 6) of control and Prickle1-electroporated spinal cords. Relative Prickle1 expression is normalized to Rpl4 expression. Data are mean ± s.e.m of 3 pools of 3 spinal cords each. P value indicates the result of a two-tailed, unpaired Student's t-test. (B) Percentage of Prickle1-overexpressing cells in Prickle1-electroporated spinal cords at day 6 after amputation. Data are mean ± s.e.m. of 4 axolotls.
Figure 5—figure supplement 2
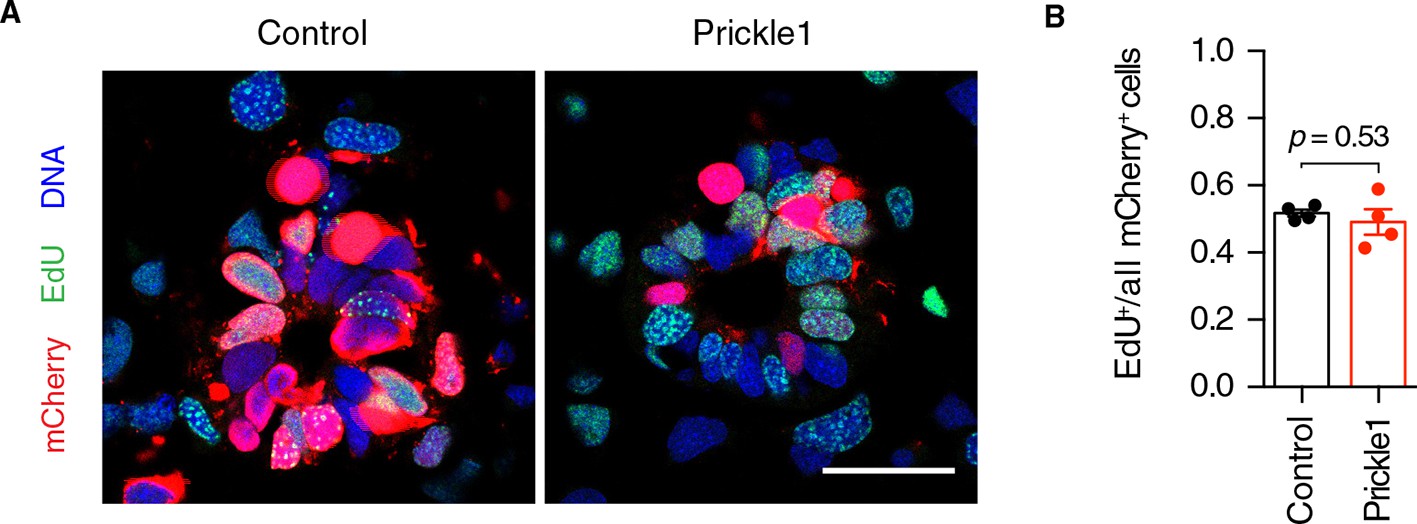
Prickle1 overexpression does not alter the cell cycle kinetics of regenerating neural stem cells.
(A) Representative images of control and Prickle1-overexpressing spinal cords after receiving a two-hour EdU pulse, 6 days after tail amputation. mCherry (red) labels electroporated cells, EdU (green) labels cells that underwent DNA synthesis during the labeling time, and Hoechst (blue) labels DNA. (B) Quantification of EdU+/mCherry+ cells along the six-day regenerating spinal cord of control and Prickle1-overexpressing axolotls. Data are mean ± s.e.m. of 4 spinal cords/group. P-value indicates the result of two-tailed unpaired Student's t-tests. Scale bar, 50 µm.
Figure 6
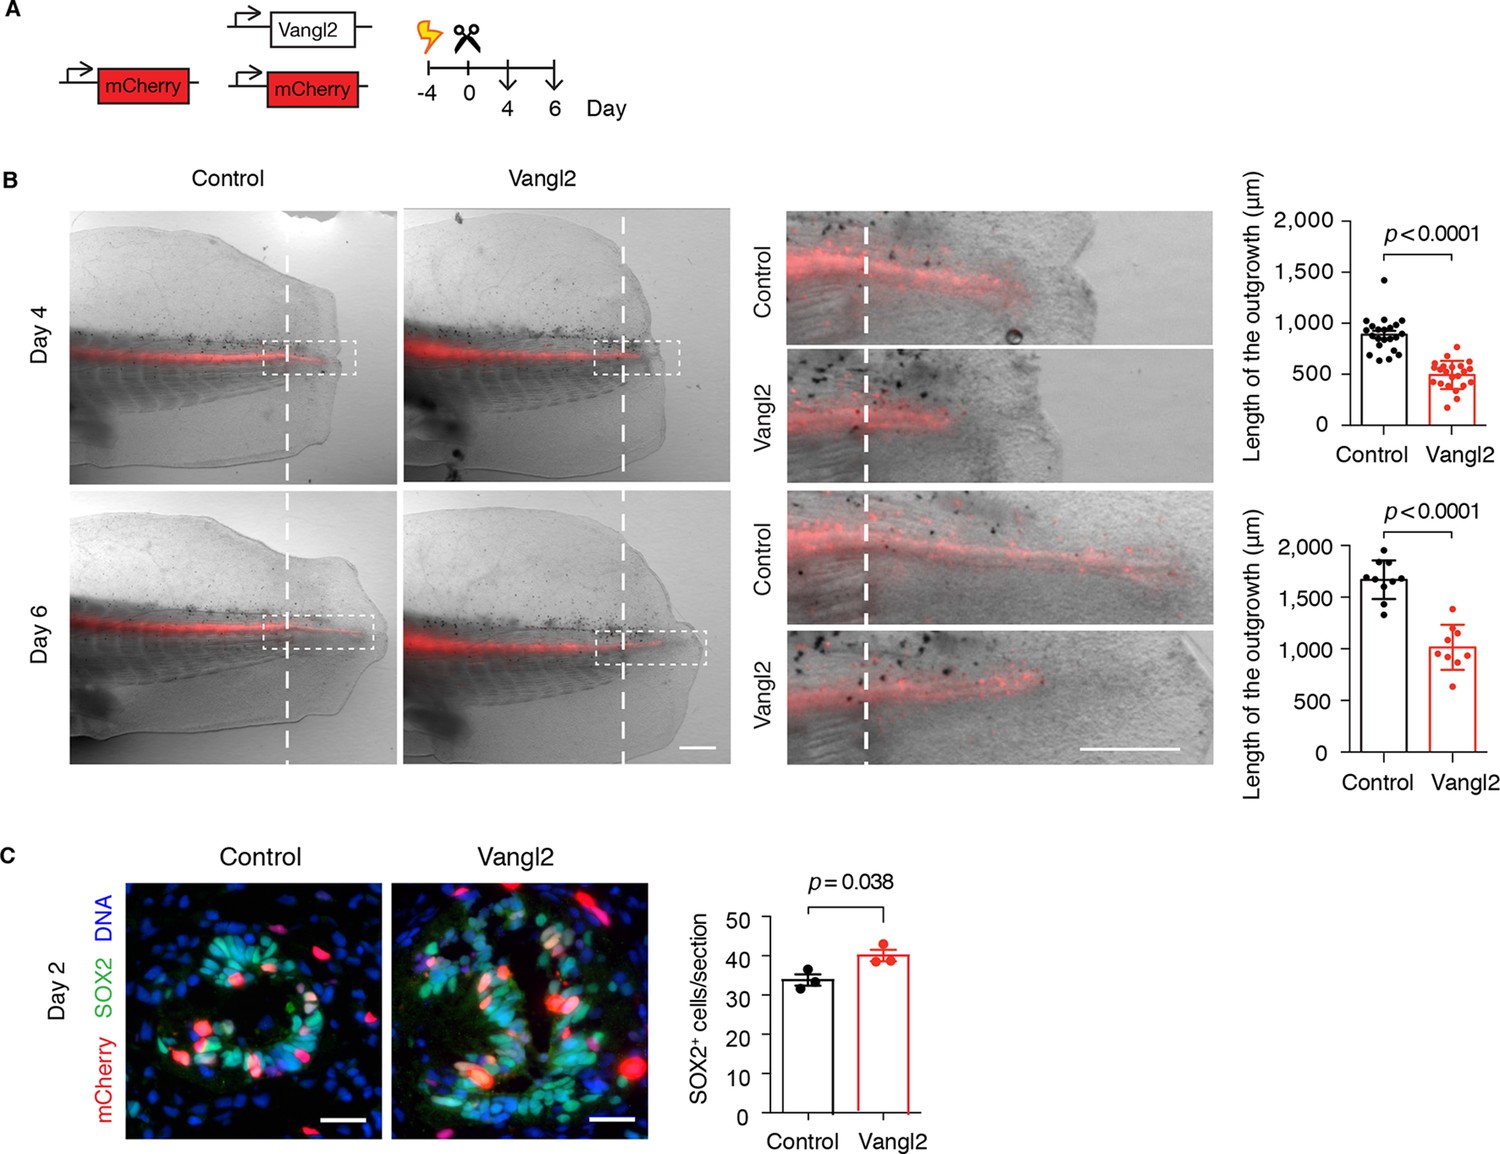
Vangl2 overexpression yields shorter and broader spinal cord outgrowth.
(A) Axolotl spinal cords were co-electroporated with Vangl2 and mCherry or mCherry alone as control, tails were amputated, and monitored during regeneration. (B) Representative images of control and Vangl2-overexpressing spinal cords at day 4 and day 6. Insets show spinal cord outgrowths. Dashed lines mark the amputation planes. Mean ± s.e.m. of spinal cord length on the right. Dots represent individual axolotls, pooled from two independent experiments. P values indicate the result of two-tailed unpaired Student's t-tests. Scale bars, 500 µm. (C) Immunofluorescence on cross-sections across the source zone of control and Vangl2-overexpressing spinal cords 2 days after amputation. SOX2 labels neural stem cells, mCherry labels electroporated cells, and Hoechst labels DNA. Mean ± s.e.m. of the number of SOX2+ cells per cross-section on the right. N=3 tails/group. P value indicates the result of two-tailed unpaired Student's t-test. Scale bars, 20 μm.
Figure 7 with 1 supplement
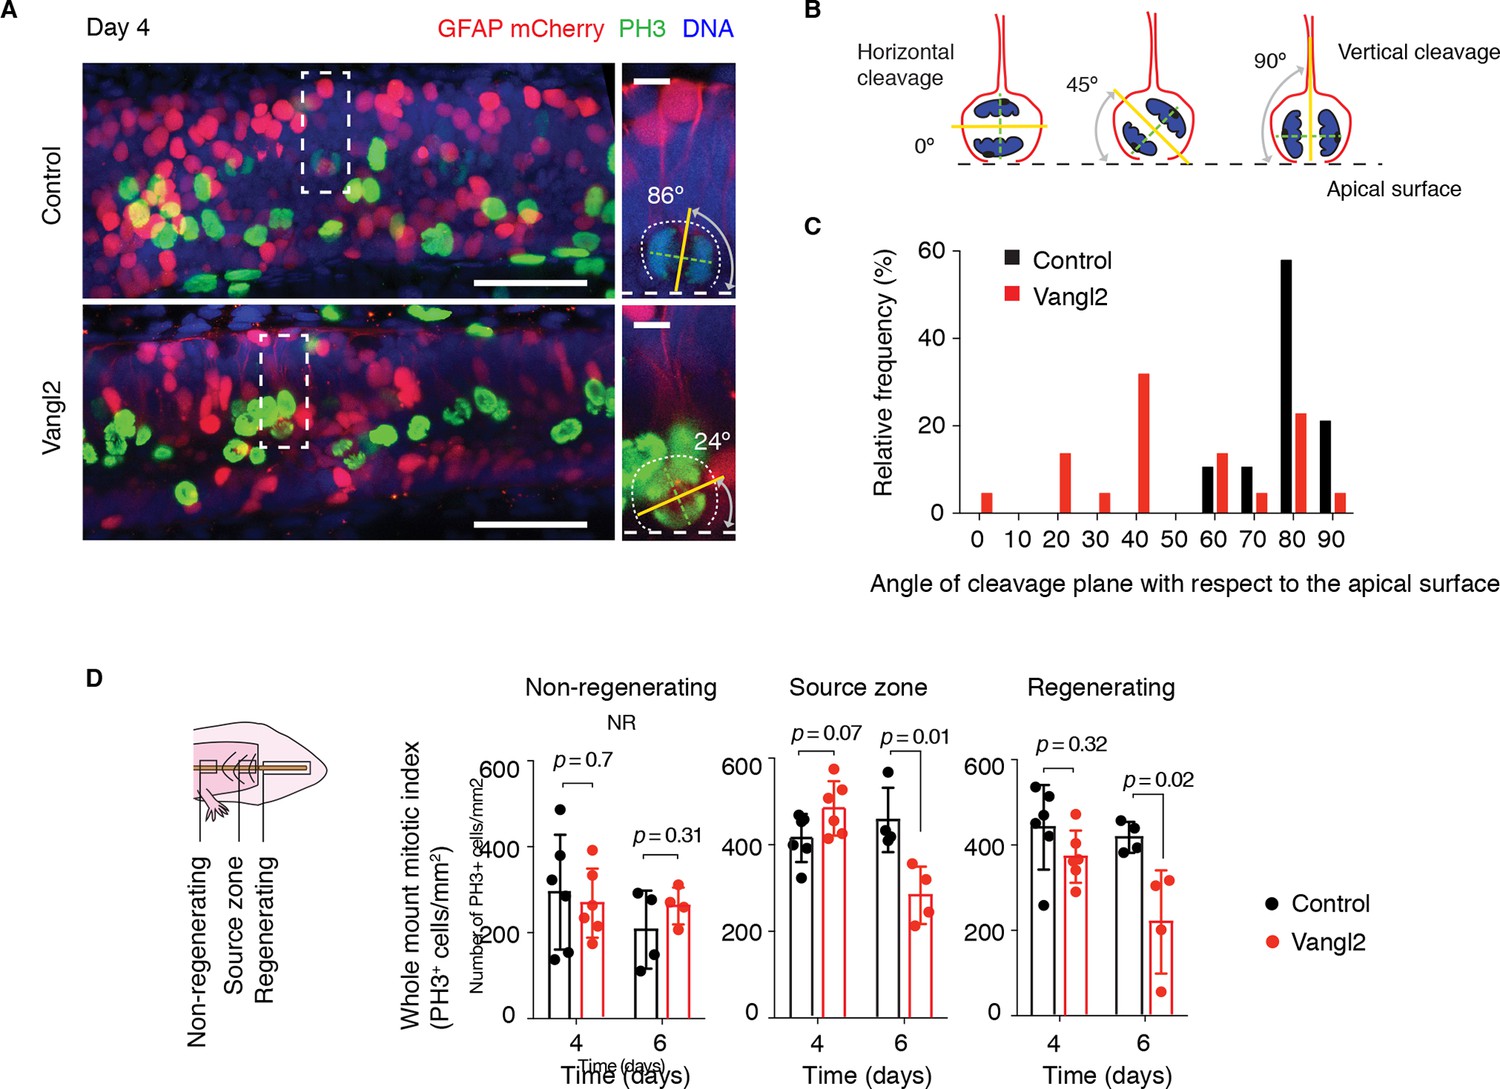
Vangl2 overexpression randomizes cleavage planes and halts the expansion of the regenerating neural stem cell pool.
(A) Longitudinal optical sections of the source zone from control and Vangl2-overexpressing spinal cords at day 4 after amputation. PH3 labels late G2 and mitotic cells in green, GFAP labels the basolateral membrane of neural stem cells in red, nuclear mCherry labels electroporated cells in red, Hoechst labels DNA in blue. Insets show representative PH3+mitotic cells within each group. Dashed white lines mark the apical surface of the spinal cord. Dotted lines outline cells. Scale bars, 100 μm. Insets, 10 μm. (A,B) The mitotic spindle (green dashed lines) was deduced from late anaphase or telophase cells (see Materials and methods). A vector orthogonal to the mitotic spindle was drawn as cleavage plane (yellow lines). The angle of cleavage plane was determined as the angle between the cleavage plane and apical surface of the spinal cord. (C) Distribution of cleavage plane angles within the source zone in control (n=19 cells from 4 tails) and Vangl2-electroporated spinal cords (n=22 cells from 4 tails). The distribution of cleavage angles in Vangl2-electroporated spinal cords is more variable and significantly differs from the tighter distribution of control cells (p<0.0001, Mann-Whitney U test). (D) Quantification of PH3+ cells in non-regenerating and regenerating regions of control and Vangl2-electroporated spinal cords, 4 and 6 days after amputation (see Materials and methods). Dots denote individual tails. Data, mean ± s.e.m of n=6 tails at day 4 and n=4 tails at day 6 per group. P values indicate the result of two-tailed unpaired Student's t-tests (Vangl2 versus control, for each region).
Figure 7—figure supplement 1
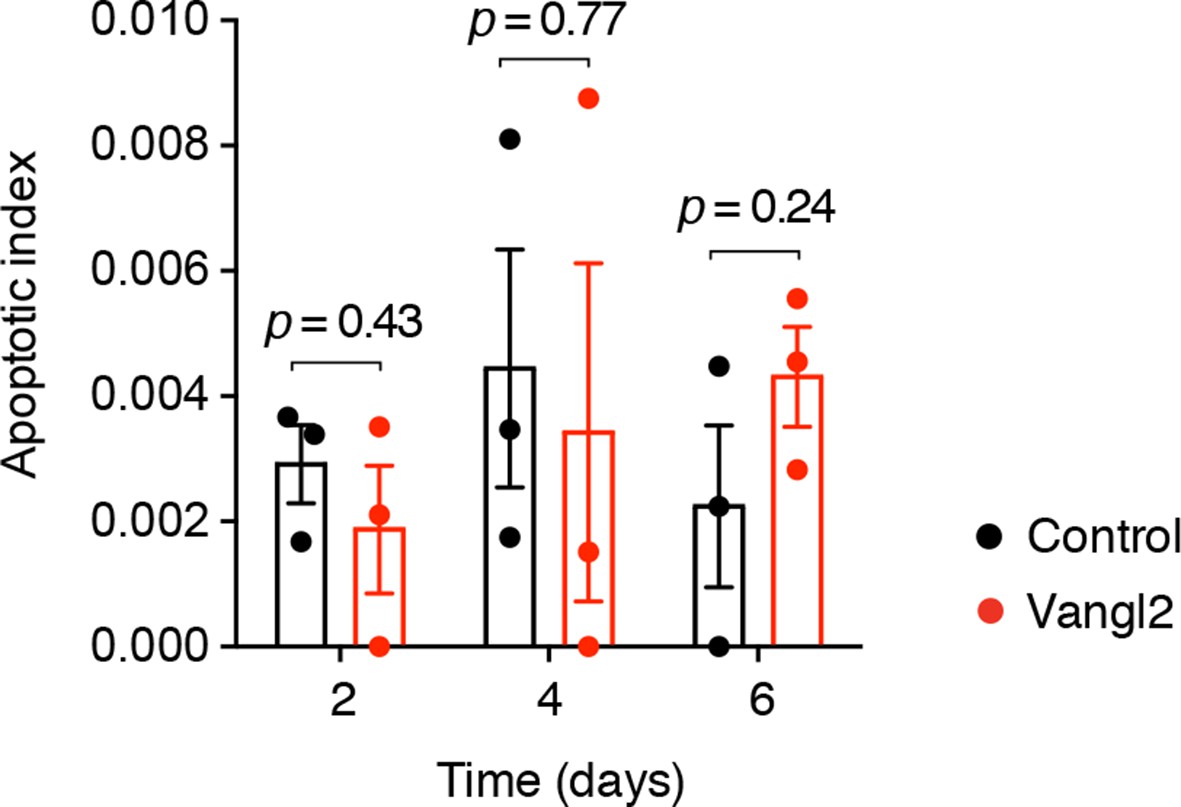
Quantification of apoptotic cells in control and Vangl2-electroporated spinal cords during regeneration.
Bar graphs represent the fraction of active caspase-3+ cells within the regenerating spinal cord. Error bars indicate s.e.m. of 3 tails per group and time-point. P values indicate the result of two-tailed unpaired Student's t-tests (Vangl2 versus control, for each time-point).
Figure 8
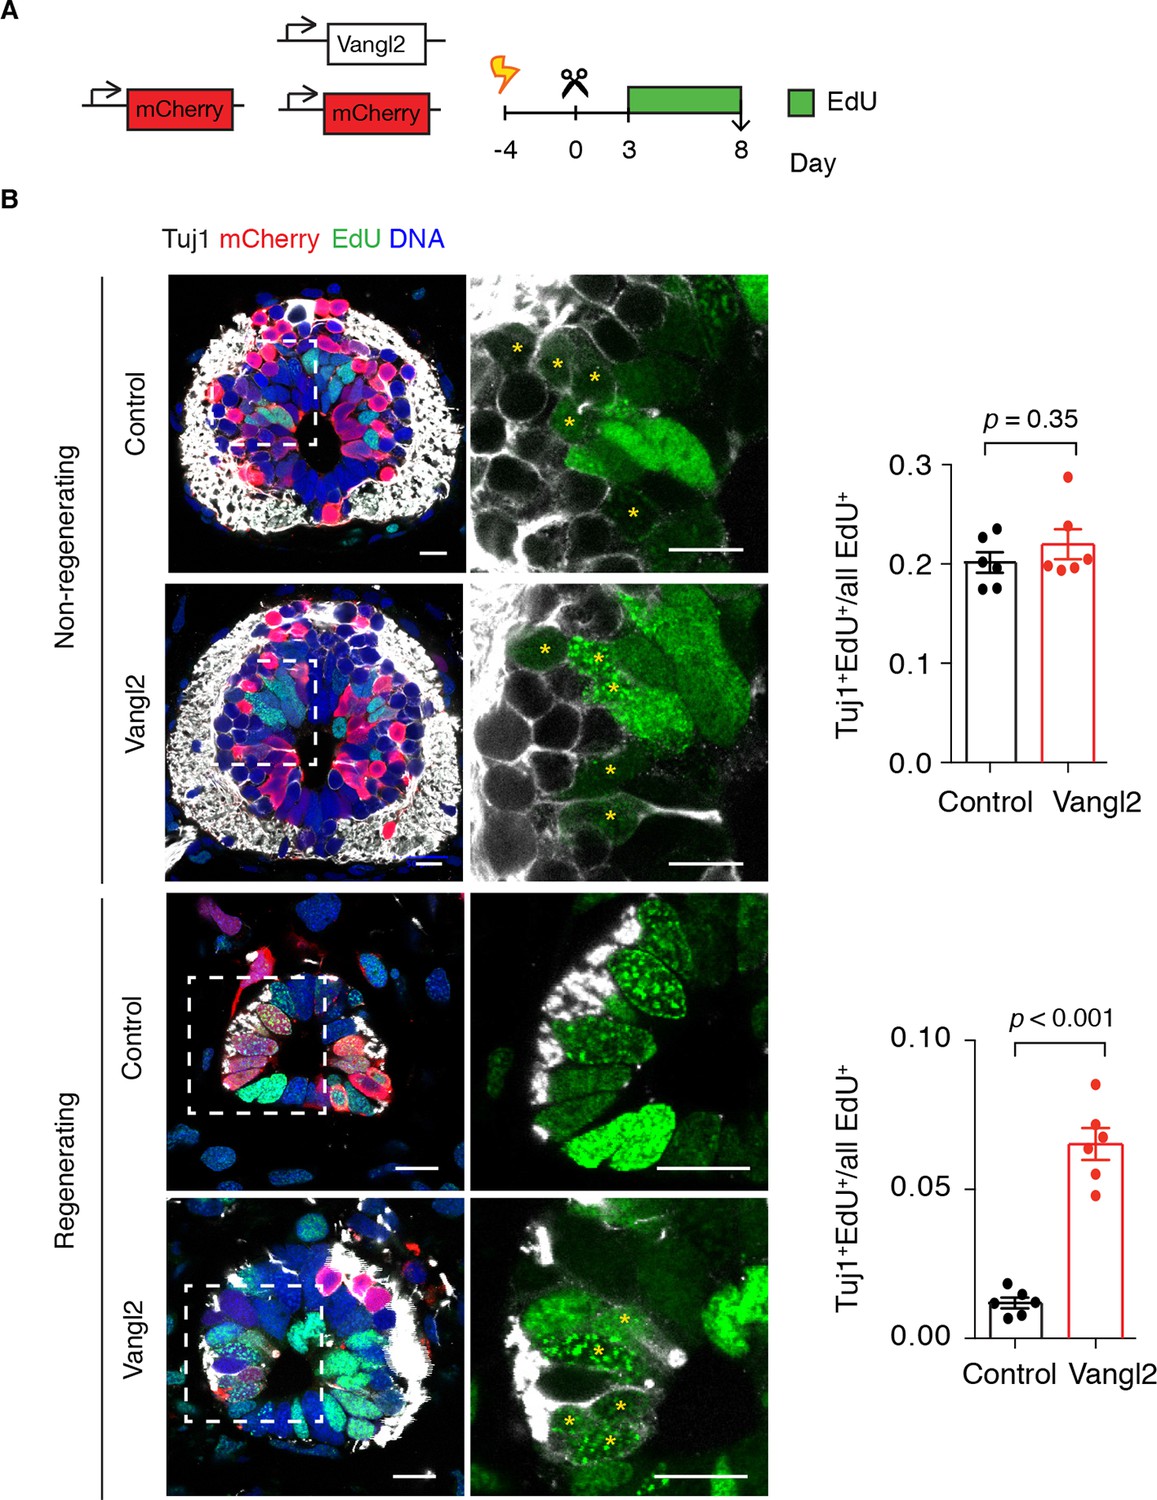
Vangl2 overexpression leads to premature neurogenesis in the regenerating spinal cord.
(A) Axolotls with mCherry or mCherry and Vangl2 electroporated spinal cords were injected with EdU daily, from day 3 to 8, to label proliferating cells and trace their progeny. (B) Representative images of non-regenerating and regenerating regions of control and Vangl2-overexpressing spinal cords. Tuj1 (in white) labels early-born neurons, EdU (green) labels cells that underwent DNA synthesis and their progeny, mCherry (red) labels electroporated cells and Hoechst (blue) labels DNA. Asterisks mark neurons generated during the EdU labeling time. Quantification of the fraction of EdU+ cells that differentiated into neurons (Tuj1+EdU+) over total EdU+ cells is shown on the right. Note that in non-regenerating regions there is no significant difference in the fraction of EdU+ cells that differentiate into neurons between control and Vangl2-overexpressing spinal cords (0.20 ± 0.01 and 0.22 ± 0.02 respectively, P=0.345). However, the overexpression of Vangl2 leads to premature neurogenesis in the regenerating portion of the spinal cord compared to controls (0.07 ± 0.01 in Vangl2 versus 0.01 ± 0.01 in controls, P<0.001). Data, mean ± s.e.m. of n=6 tails, pooled from two independent experiments. Statistics, two-tailed unpaired Student's t-test (Vangl2 versus control, for each region). Scale bars, 20 μm.
Videos
Video 1
Cell dividing parallel to the AP axis of the spinal cord.
Confocal images through a mitotic cell in a 14-days regenerating axolotl spinal cord. DNA is labeled with Hoechst and shown as inverted grayscale. 1 μm z-steps. Images are displayed at 4 fps. Scale bar, 20 μm.
Video 2
Control cell dividing parallel to the AP axis of the spinal cord.
Confocal images through a mitotic cell expressing nuclear mCherry (red) in the regenerating spinal cord, 14 days after amputation. DNA is labeled with Hoechst and shown as inverted grayscale. 1 μm z-steps. Images are displayed at 4 fps. Scale bar, 20 μm.
Video 3
Prickle1-overexpressing cell dividing orthogonal to the AP axis of the spinal cord.
Confocal images through a mitotic cell electroporated with a construct encoding for axolotl Prickle1, the self-cleavage peptide T2A, and nuclear mCherry (red) in the regenerating spinal cord, 14 days after amputation. DNA is labeled with Hoechst and shown as inverted grayscale. 1 μm z-steps. Images are displayed at 4 fps. Scale bar, 20 μm.
Additional files
-
Supplementary file 1
Cell cycle parameters of uninjured, non-regenerating, and regenerating neural stem cell populations in the axolotl spinal cord.
The numbers indicate the average length (in hours) of the total cell cycle (TC), G1 phase (TG1), S phase (TS), G2 phase (TG2), and M phase (M), extracted from the cumulative BrdU data using a modeling approach (see Materials and methods). Errors, 1σ confidence intervals.
- https://doi.org/10.7554/eLife.10230.018
-
Supplementary file 3
List of genes and target sequences used for NanoString gene expression analysis.
- https://doi.org/10.7554/eLife.10230.019
-
Supplementary file 2
Primer sequences used for plasmid construction in this study.
- https://doi.org/10.7554/eLife.10230.020
Download links
A two-part list of links to download the article, or parts of the article, in various formats.
Downloads (link to download the article as PDF)
Open citations (links to open the citations from this article in various online reference manager services)
Cite this article (links to download the citations from this article in formats compatible with various reference manager tools)
Planar cell polarity-mediated induction of neural stem cell expansion during axolotl spinal cord regeneration
eLife 4:e10230.
https://doi.org/10.7554/eLife.10230


