Evolutionary and functional analyses reveal a role for the RHIM in tuning RIPK3 activity across vertebrates
- Department of Molecular Biology, School of Biological Sciences, University of California, San Diego, United States
Figures
Figure 1 with 4 supplements
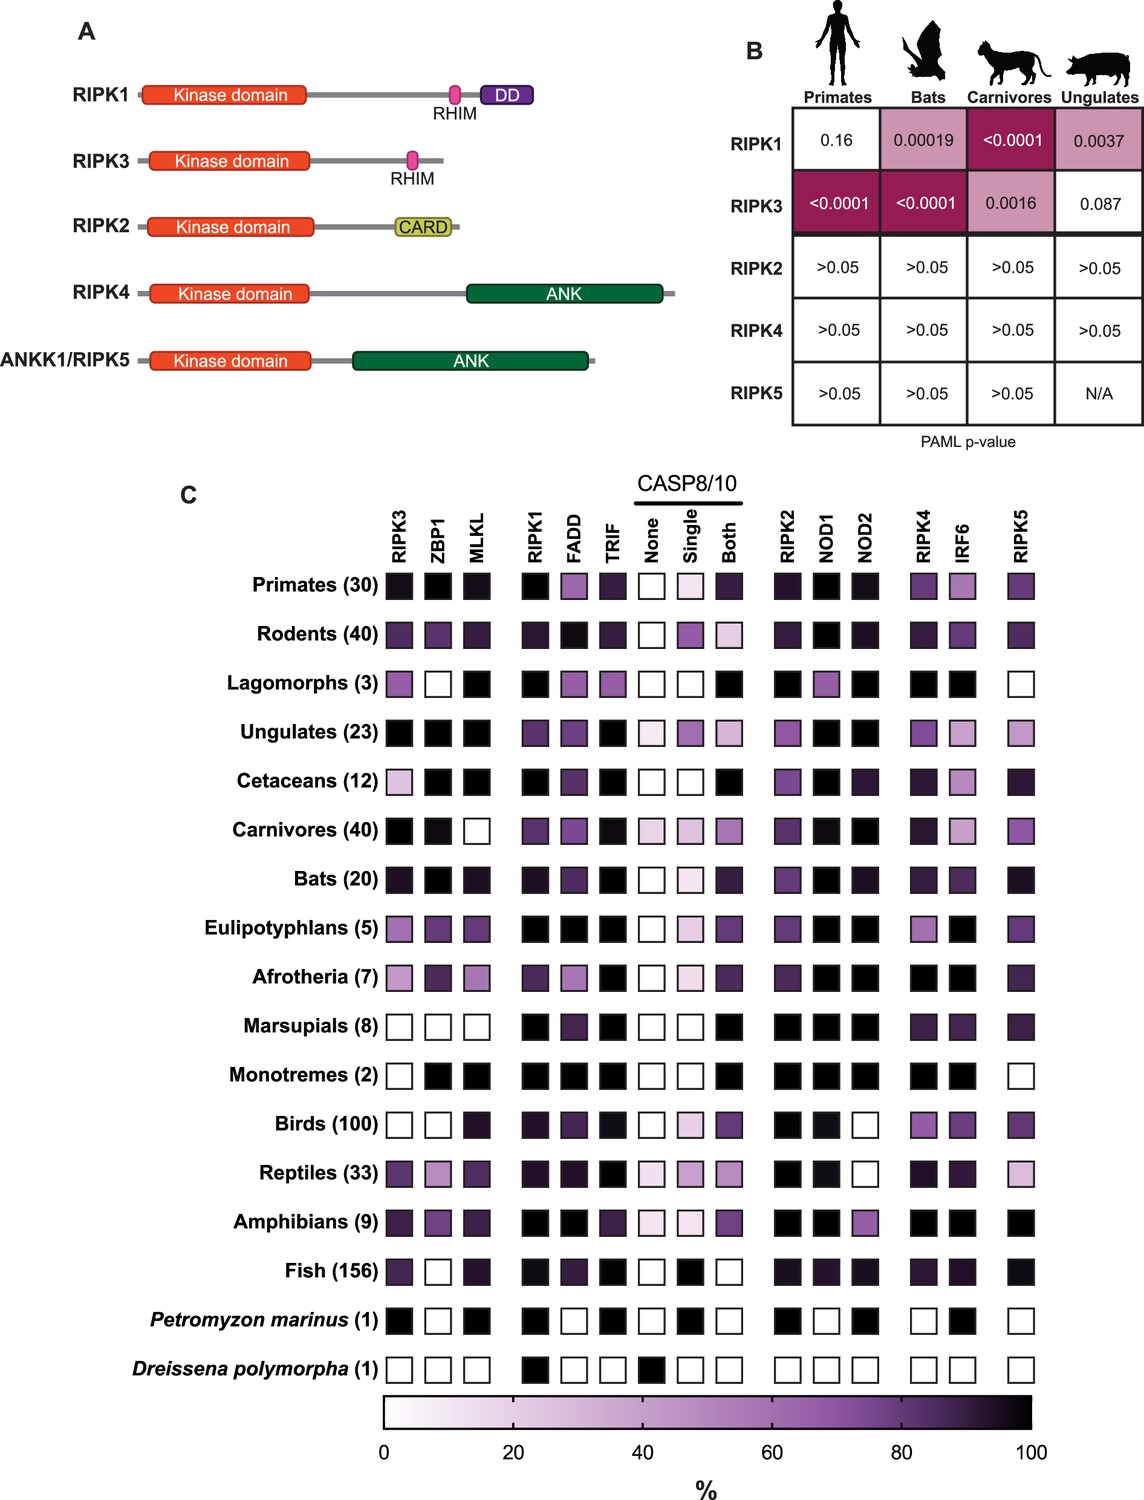
Comparative evolutionary analysis of RIPK1–5.
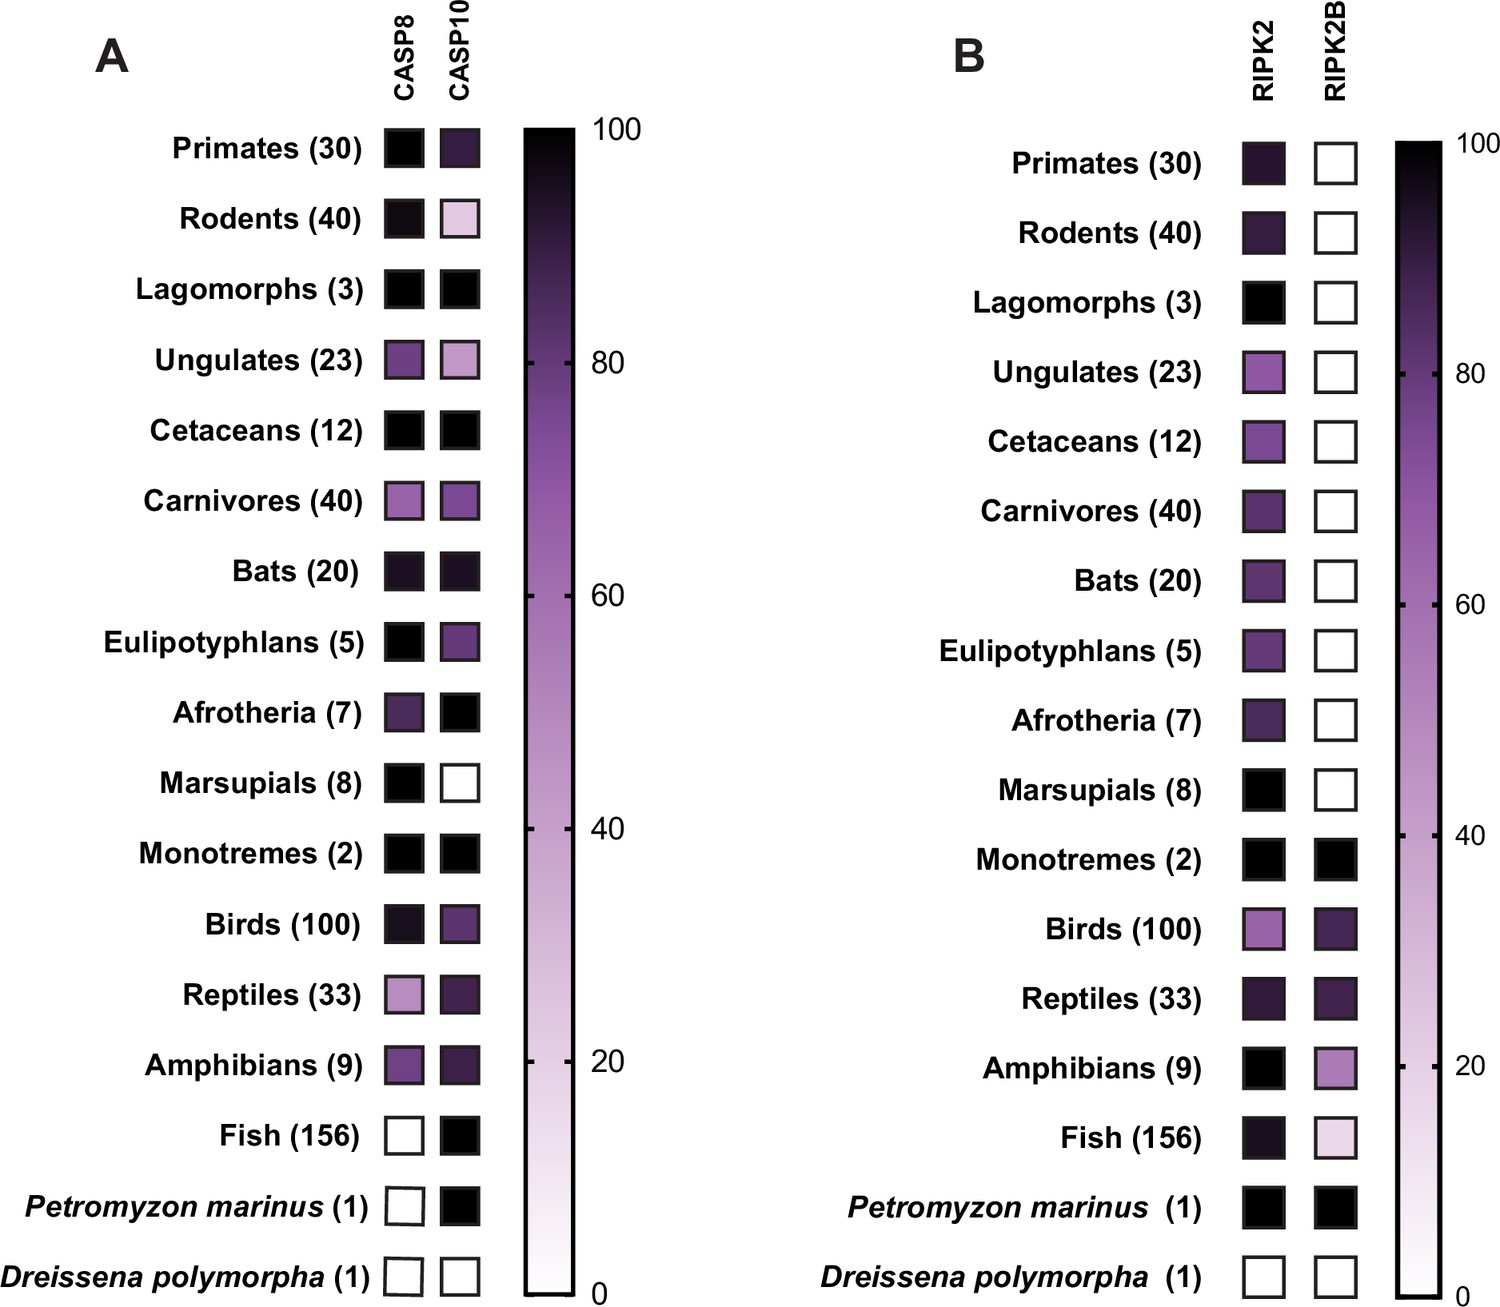
(A) Domain structures of human RIP kinases. RHIM = RIP homotypic interaction motif, DD = death domain, CARD = caspase activation and recruitment domain, ANK = ankyrin repeats. (B) Positive selection analysis of RIPK1–5 in the indicated mammalian order. Input sequences and PAML p-values can be found in Supplementary files 1 and 2. Images of model species were generated using BioRender.com. (C) Heat map showing the percentage of species within a clade that have the indicated protein. The clades and the number of species within each clade are indicated on the left. Complete lists of proteins and species in each group can be found in Supplementary files 4 and 5. Lancelet species were not queried for all proteins and are not included in this graph.
Figure 1—figure supplement 1
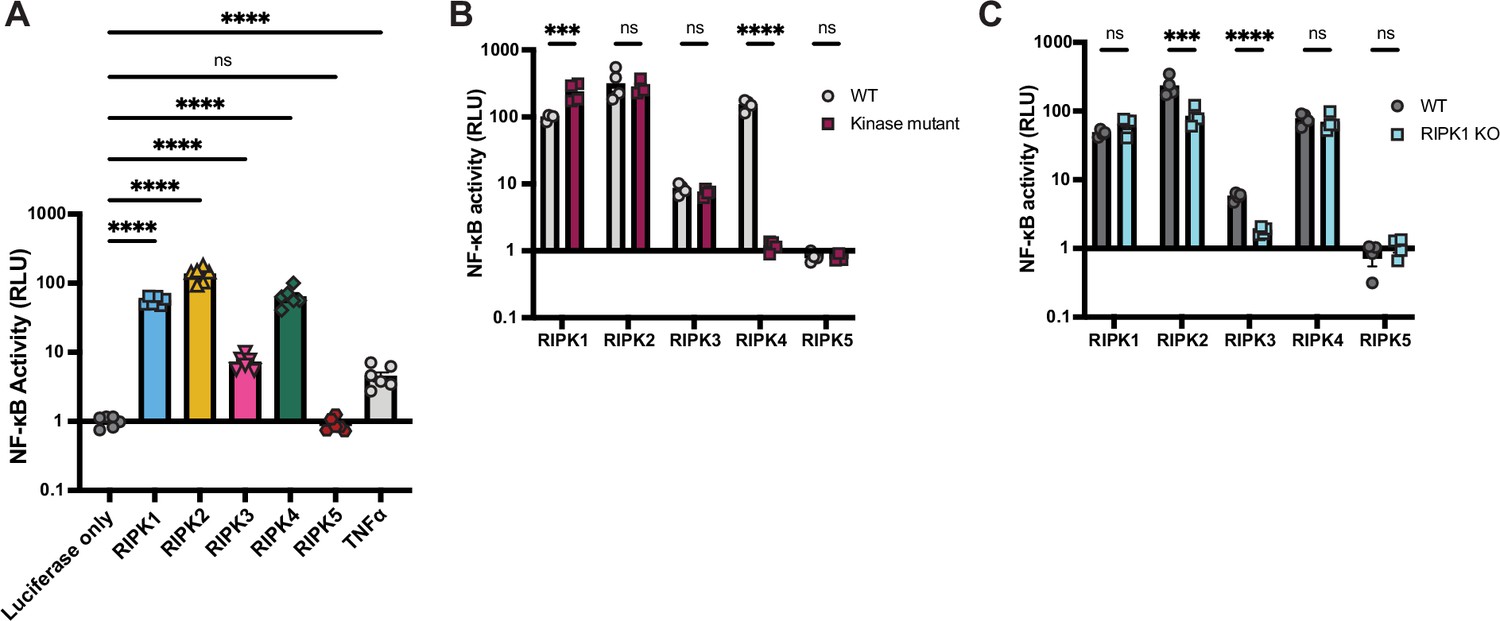
Human RIPK1–4 activate NF-κB.
Human V5-RIPK1–5 proteins were transfected into WT (A–C) or RIPK1 KO (C) HEK293T cells, along with NF-κB firefly luciferase and control renilla luciferase reporter plasmids (see Materials and methods), and NF-κB activity was measured at 18 hr post-transfection. (A) Human RIPK1–5 activation of NF-κB in WT 293T cells. (B) Activation of NF-κB by catalytically active versus kinase-mutant RIPK1–5 in WT HEK293T cells. (C) Activation of NF-κB by RIPK1–5 in WT versus RIPK1 KO HEK293T cells. Data are representative of 3 independent experiments with n=3–6 biological replicates per group. Data were analyzed using one-way ANOVA with Dunnett’s multiple comparisons test (A) or two-way ANOVA with Šidák’s multiple comparisons test (B, C). ns = not significant, ***=p<0.001, ****=p<0.0001.
-
Figure 1—figure supplement 1—source data 1
Raw data for the bar graphs in Figure 1—figure supplement 1 depicting NF-κB activation by various human RIPK proteins.
- https://cdn.elifesciences.org/articles/102301/elife-102301-fig1-figsupp1-data1-v1.xlsx
Figure 1—figure supplement 2
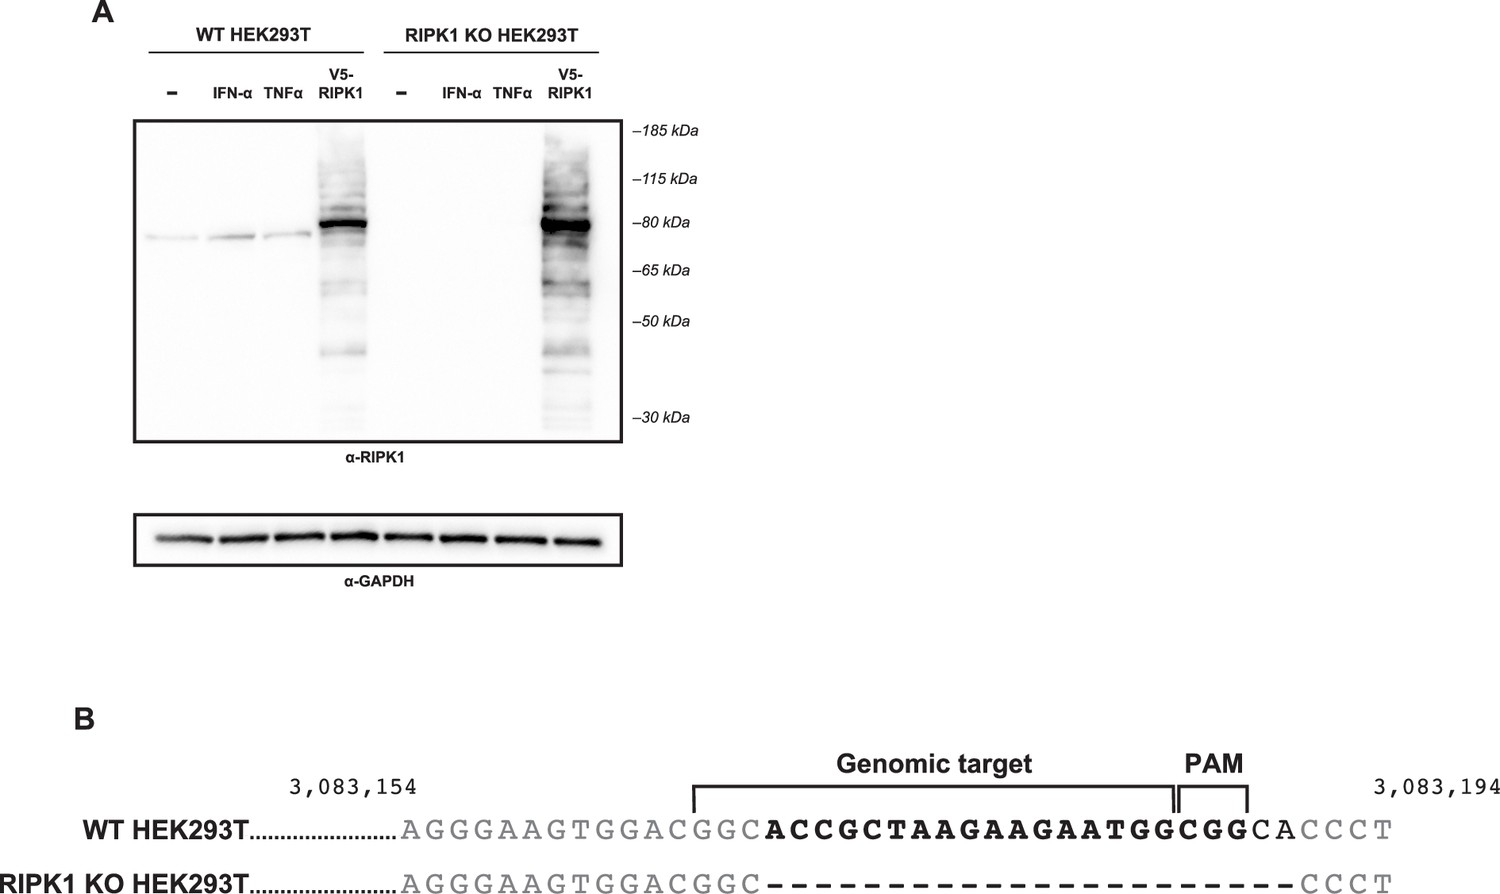
Generation of RIPK1 KO HEK293T cells.
(A) WT and RIPK1 KO HEK293T cells were treated with 5000 U IFN-α for 24 hr or 160 ng/mL TNFα for 6 hr, and expression of RIPK1 protein was analyzed by western blot using the indicated antibodies. Untreated cells were used as a negative control. Cells were transfected with V5-RIPK1 as a positive control. (B) Genomic DNA was isolated from WT HEK293T (top) or RIPK1 KO HEK293T (bottom) cells, and the target region of exon 5 of RIPK1 was amplified and analyzed by Sanger sequencing. Nucleotide numbers indicate genomic location.
-
Figure 1—figure supplement 2—source data 1
Original western blots for Figure 1—figure supplement 2.
- https://cdn.elifesciences.org/articles/102301/elife-102301-fig1-figsupp2-data1-v1.zip
-
Figure 1—figure supplement 2—source data 2
PDF file containing original western blots for Figure 1—figure supplement 2, indicating the relevant bands and treatments.
- https://cdn.elifesciences.org/articles/102301/elife-102301-fig1-figsupp2-data2-v1.zip
Figure 1—figure supplement 3
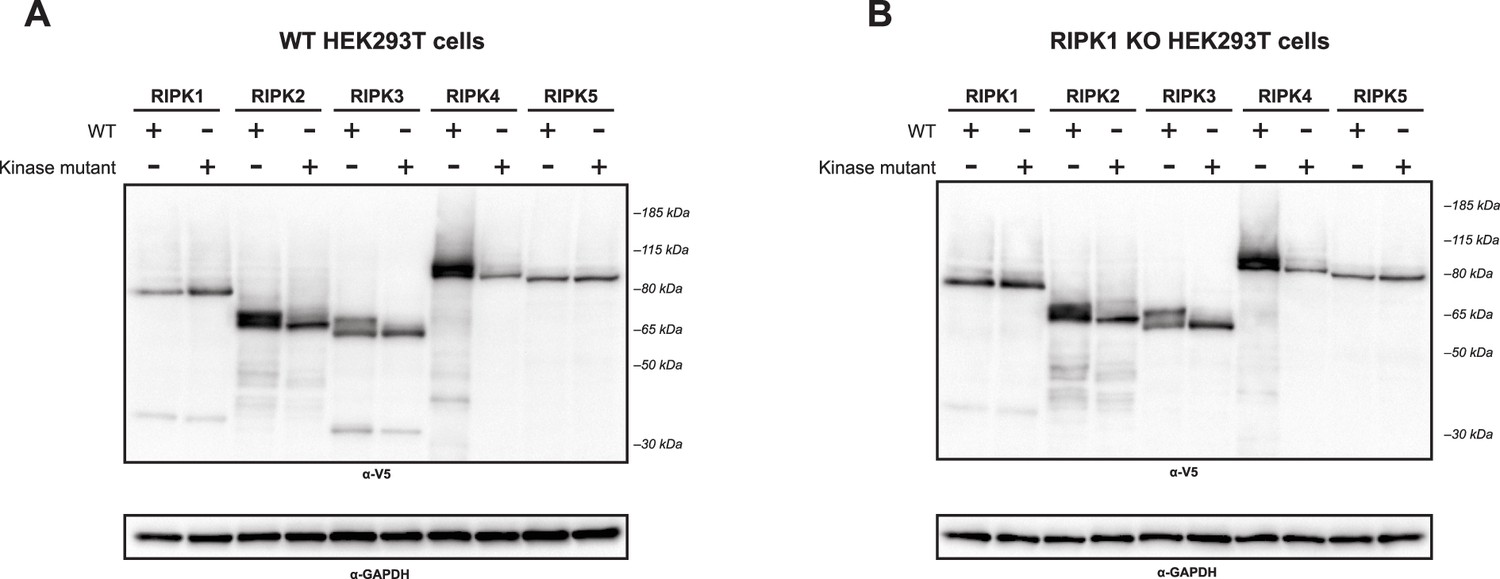
Expression of RIPK1–5 constructs.
WT (A) and RIPK1 KO (B) HEK293T cells were transfected with WT or kinase mutant V5-RIPK1–5. Protein expression was analyzed at 18 hr post-transfection by western blot using the indicated antibodies.
-
Figure 1—figure supplement 3—source data 1
Original western blots for Figure 1—figure supplement 3.
- https://cdn.elifesciences.org/articles/102301/elife-102301-fig1-figsupp3-data1-v1.zip
-
Figure 1—figure supplement 3—source data 2
PDF file containing original western blots for Figure 1—figure supplement 3, indicating the relevant bands and treatments.
- https://cdn.elifesciences.org/articles/102301/elife-102301-fig1-figsupp3-data2-v1.zip
Figure 1—figure supplement 4
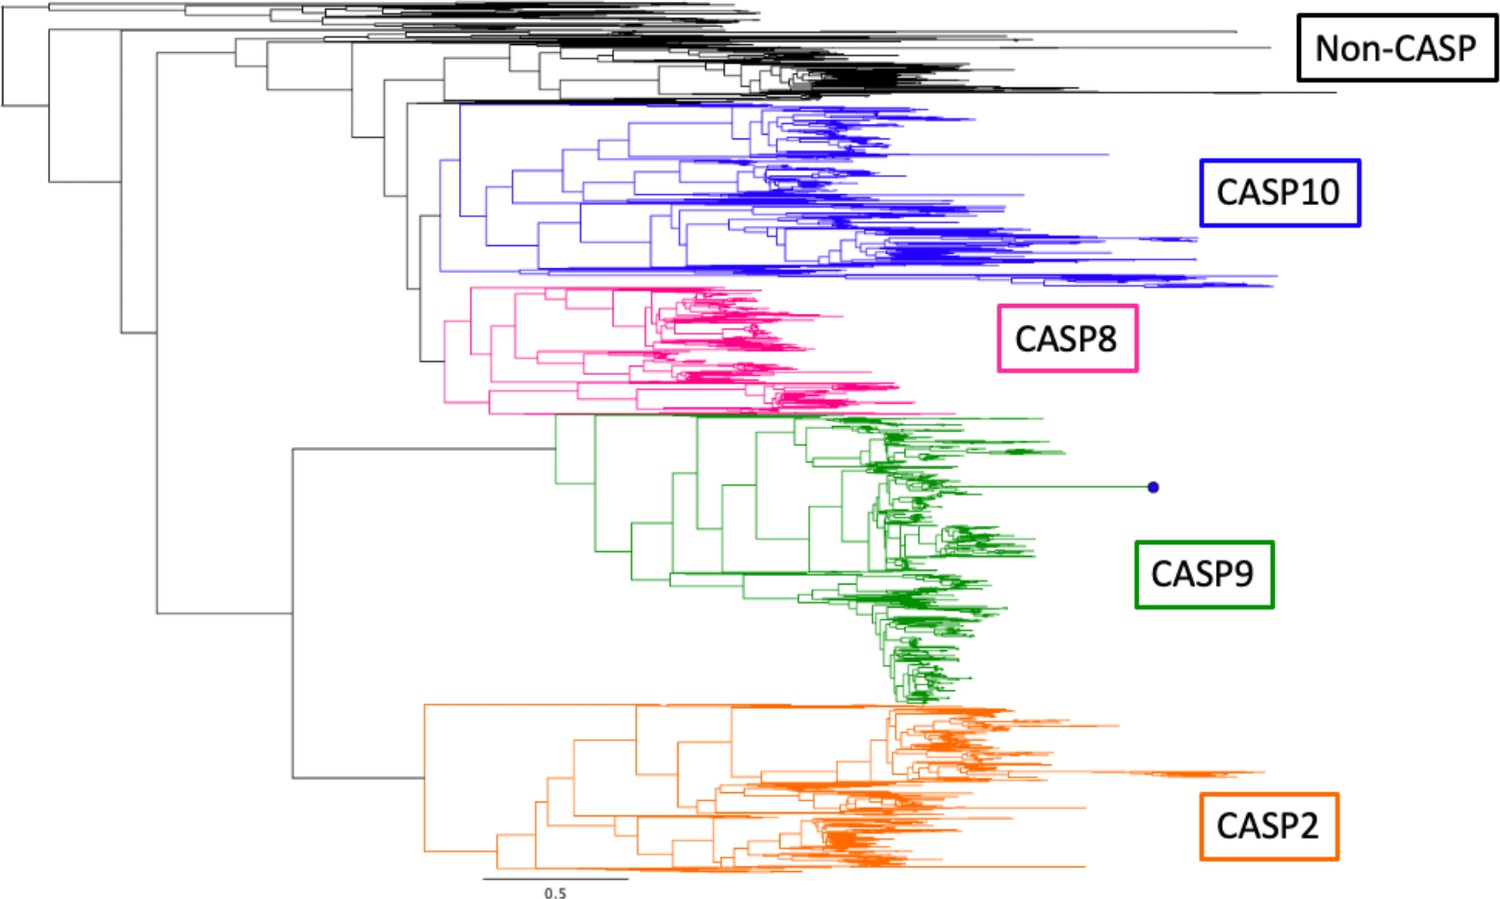
Phylogenomic analysis of RIPK and associated proteins.
(A) Delineation between CASP8 and CASP10 as determined by phylogeny (see Materials and methods). (B) Presence of RIPK2 and RIPK2B in vertebrates. Accession numbers for proteins analyzed, and list of species can be found in Supplementary files 3 and 4.
Figure 2 with 3 supplements
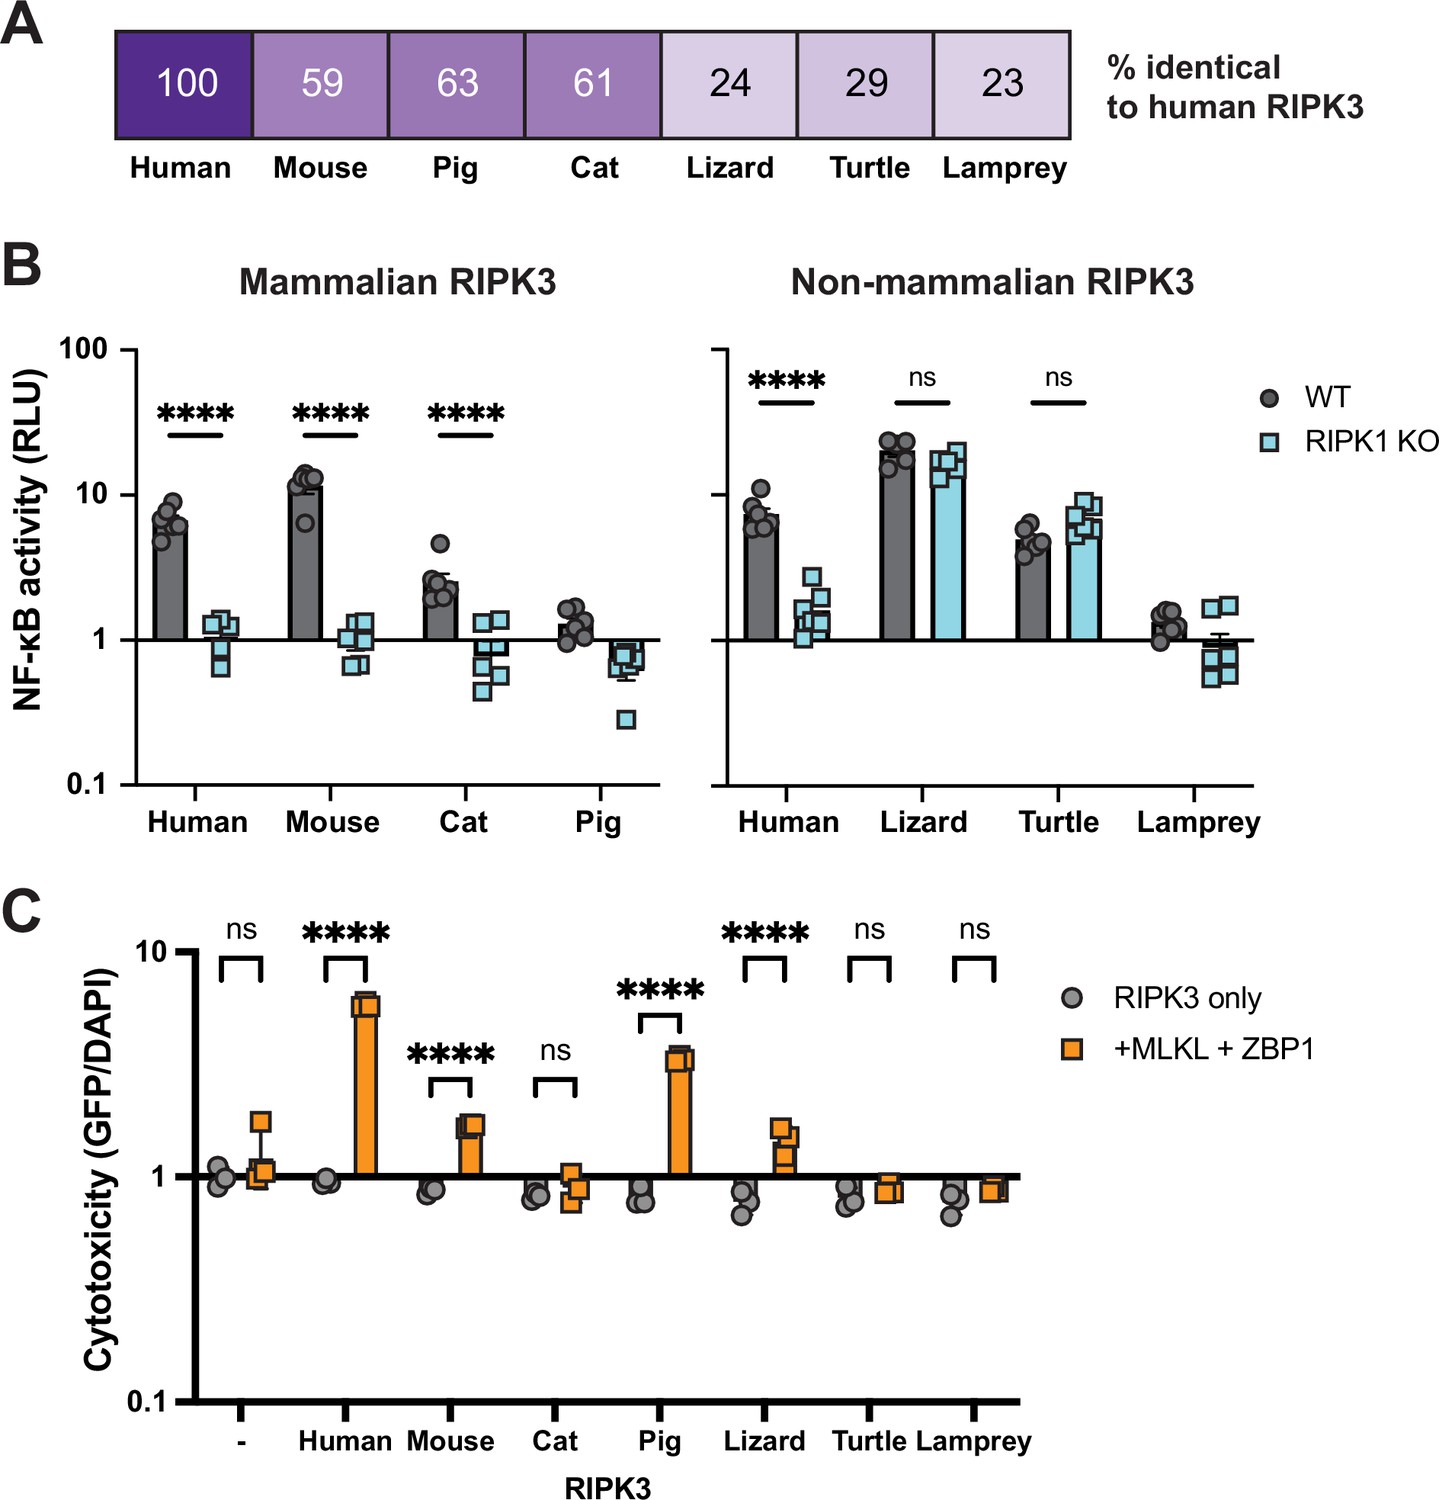
Diverse vertebrate RIPK3 proteins activate NF-κB.
(A) Percent similarity of RIPK3 from the indicated species compared to humans. (B) RIPK3 proteins were transfected into WT or RIPK1 KO HEK293T cells, along with NF-κB firefly luciferase and control renilla luciferase reporter plasmids (see Materials and methods), and NF-κB activity was measured at 18 hr post-transfection. (C) RIPK3 proteins were transfected into HEK293T cells with and without human ZBP1 and MLKL. At 18 hr post-transfection, cells were stained using the ReadyProbe Cell Viability kit, and fluorescence was measured using a plate reader. Species shown are mouse (M. musculus), cat (F. catus), pig (S. scrofa), lizard (A. carolinensis), turtle (C. mydas), and lamprey (P. marinus). Data are representative of 3–5 independent experiments with n=3–6 replicates per group. Data were analyzed using two-way ANOVA with Šidák’s multiple comparisons test. ns = not significant, ****=p<0.0001.
-
Figure 2—source data 1
Raw data for the bar graphs in Figure 2 depicting NF-κB (B) and cell death (C) activation by various vertebrate RIPK3 proteins.
- https://cdn.elifesciences.org/articles/102301/elife-102301-fig2-data1-v1.xlsx
Figure 2—figure supplement 1

Expression of nonhuman RIPK3 proteins.
WT or RIPK1 KO HEK293T cells were transfected with the indicated protein. Protein expression was analyzed at 18 hr post-transfection by western blot using the indicated antibodies.
-
Figure 2—figure supplement 1—source data 1
Original western blots for Figure 2—figure supplement 1.
- https://cdn.elifesciences.org/articles/102301/elife-102301-fig2-figsupp1-data1-v1.zip
-
Figure 2—figure supplement 1—source data 2
PDF files containing original western blots for Figure 2—figure supplement 1, indicating the relevant bands and treatments.
- https://cdn.elifesciences.org/articles/102301/elife-102301-fig2-figsupp1-data2-v1.zip
Figure 2—figure supplement 2
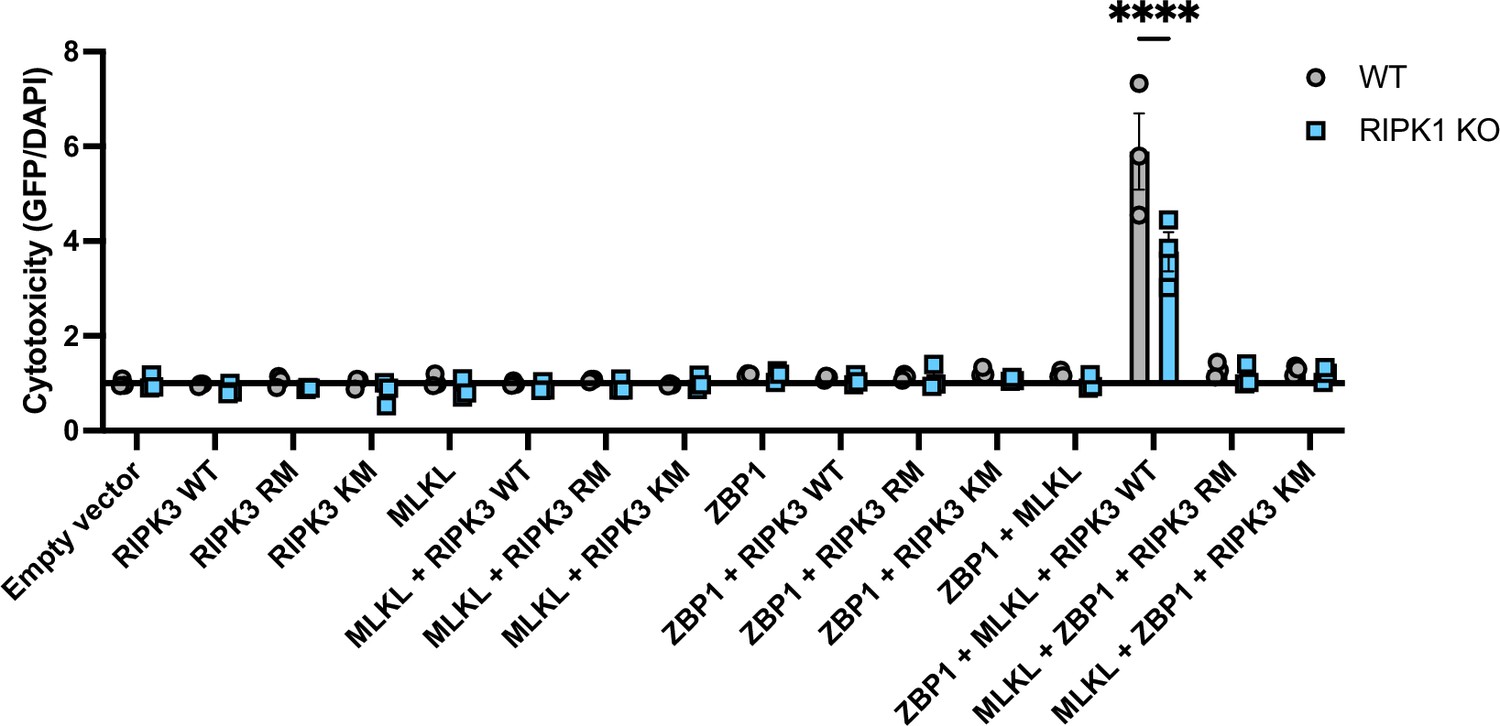
MLKL- and ZBP1-dependent cell death activation by RIPK3.
WT and RIPK1 KO cells were transfected with the indicated plasmids, and cell death was analyzed by ReadyProbes assay at 18 hr post-transfection. RM = RHIM mutant, KM = kinase mutant. Data indicative of 1–2 independent experiments with n=3 biological replicates per group. Data were analyzed by two-way ANOVA with Šidák’s multiple comparisons test. ****=p<0.0001.
-
Figure 2—figure supplement 2—source data 1
Raw data for the bar graph in Figure 2—figure supplement 2 depicting cell death activation by human MLKL, ZBP1, and/or RIPK3.
- https://cdn.elifesciences.org/articles/102301/elife-102301-fig2-figsupp2-data1-v1.xlsx
Figure 2—figure supplement 3

Loss of RIPK3 catalytic site in carnivores.
RIPK3 sequences from carnivore species highlighting the catalytic site in the kinase domain. Residue numbers refer to the human sequence. Carnivore species include dog (Canis lupus familiaris), ferret (Mustela putorius furo), bear (Ursus americanus), lynx (Lynx canadensis), tiger (Panthera tigris), lion (Panthera leo), cat (F. catus), cheetah (Acinonyx jubatus).
Figure 3 with 2 supplements
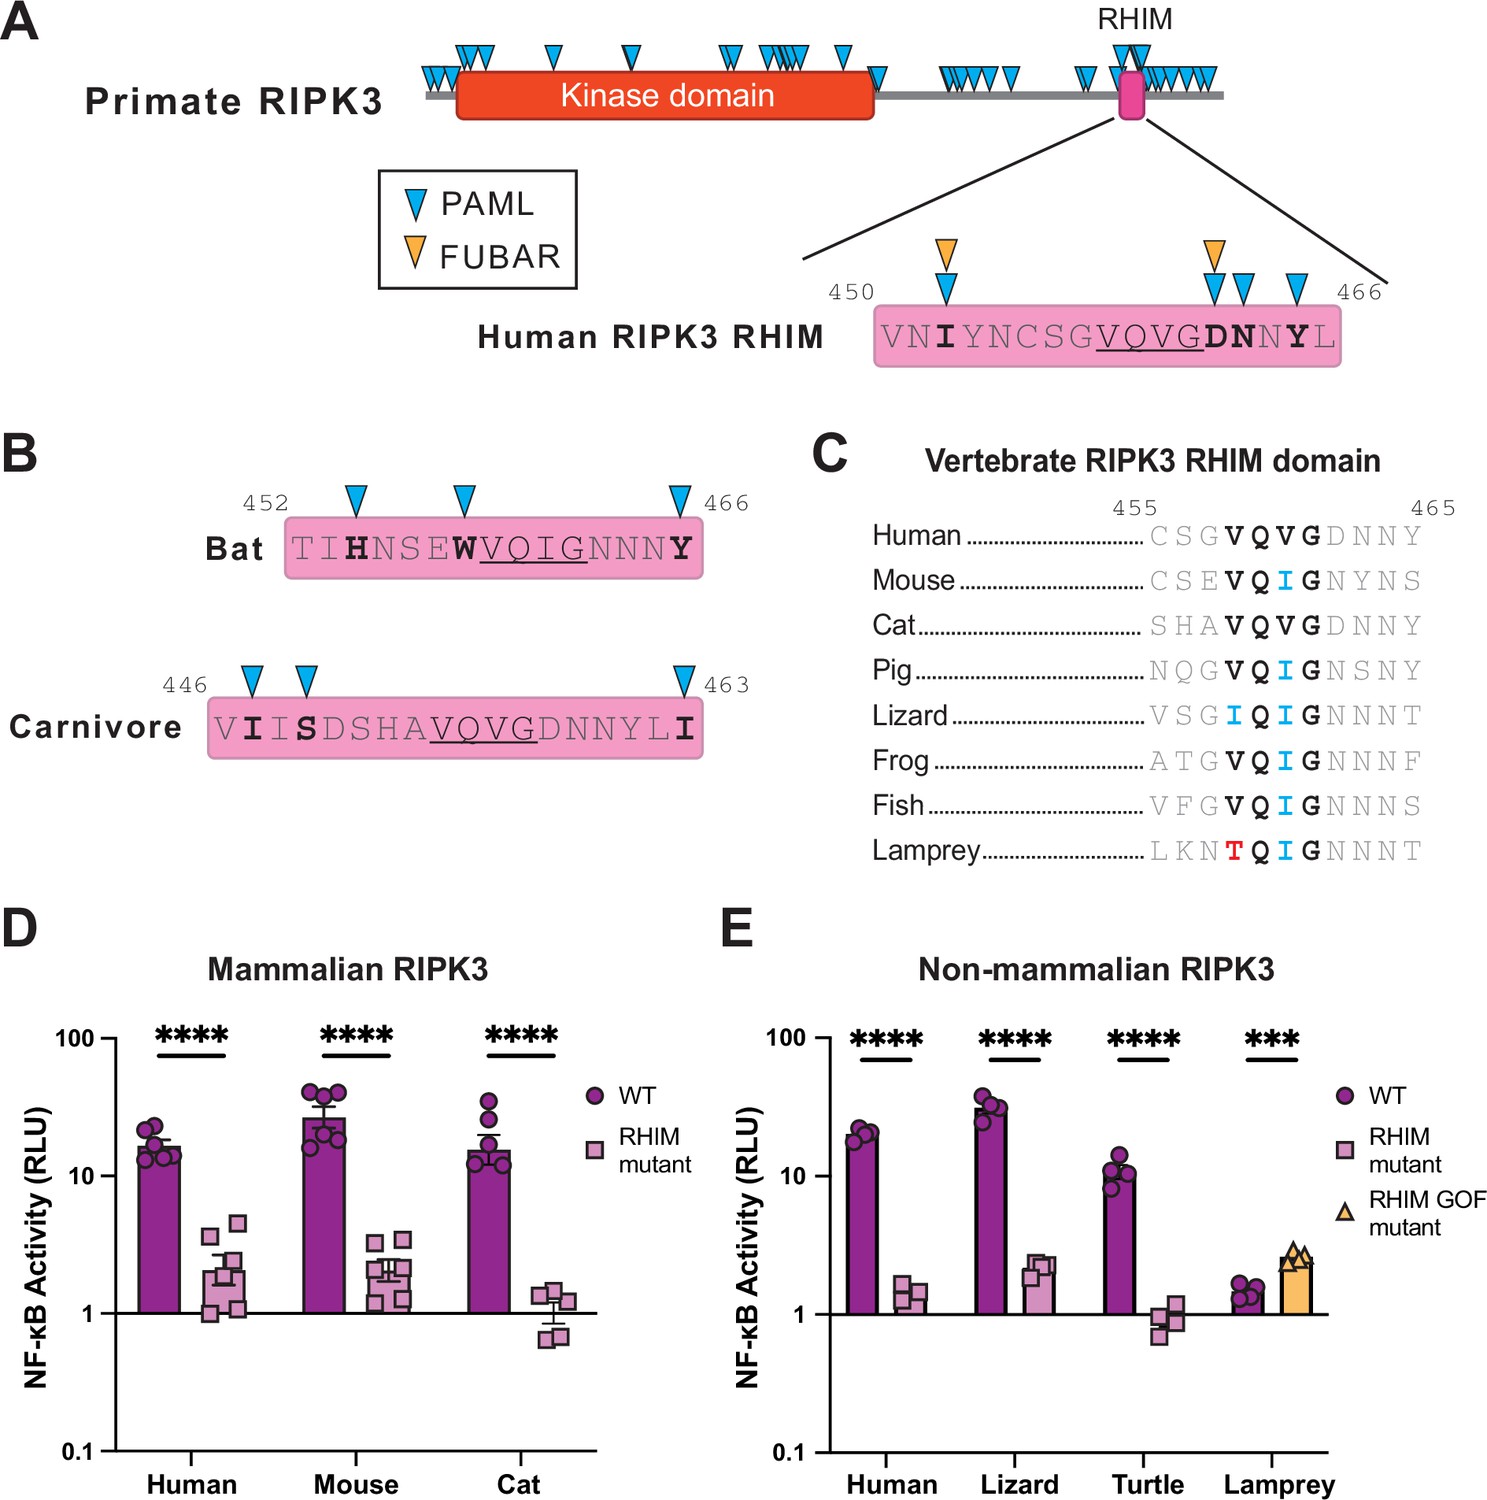
Conservation of the RHIM sequence determines RIPK3 NF-κB activation.
(A) Residues evolving under positive selection as identified using PAML and FUBAR (see Materials and methods) in primate RIPK3 and the primate RIPK3 RHIM domain mapped on to the human sequence. (B) Residues evolving under positive selection in bat and carnivore RIPK3, mapped on to the Sturnira hondurensis and F. catus sequences, respectively. (C) Alignments of the RIPK3 RHIM across diverse vertebrates. Residue numbers refer to the human sequence. (D–E) Mammalian (D) and nonmammalian (E) RIPK3 proteins were transfected into WT HEK293T cells along with NF-κB firefly luciferase and control renilla luciferase reporter plasmids (see Materials and methods). NF-κB activity was measured at 18 hr post-transfection. Species shown are mouse (M. musculus), cat (F. catus), pig (S. scrofa), lizard (A. carolinensis), turtle (C. mydas), and lamprey (P. marinus). Data are representative of 3–5 independent experiments with n=3–6 replicates per group. Data were analyzed using two-way ANOVA with Šidák’s multiple comparisons test. ns = not significant, ****=p<0.0001.
-
Figure 3—source data 1
Raw data for the bar graphs in Figure 3 depicting cell death activation by various wild-type and RHIM mutant vertebrate RIPK3 proteins.
- https://cdn.elifesciences.org/articles/102301/elife-102301-fig3-data1-v1.xlsx
Figure 3—figure supplement 1
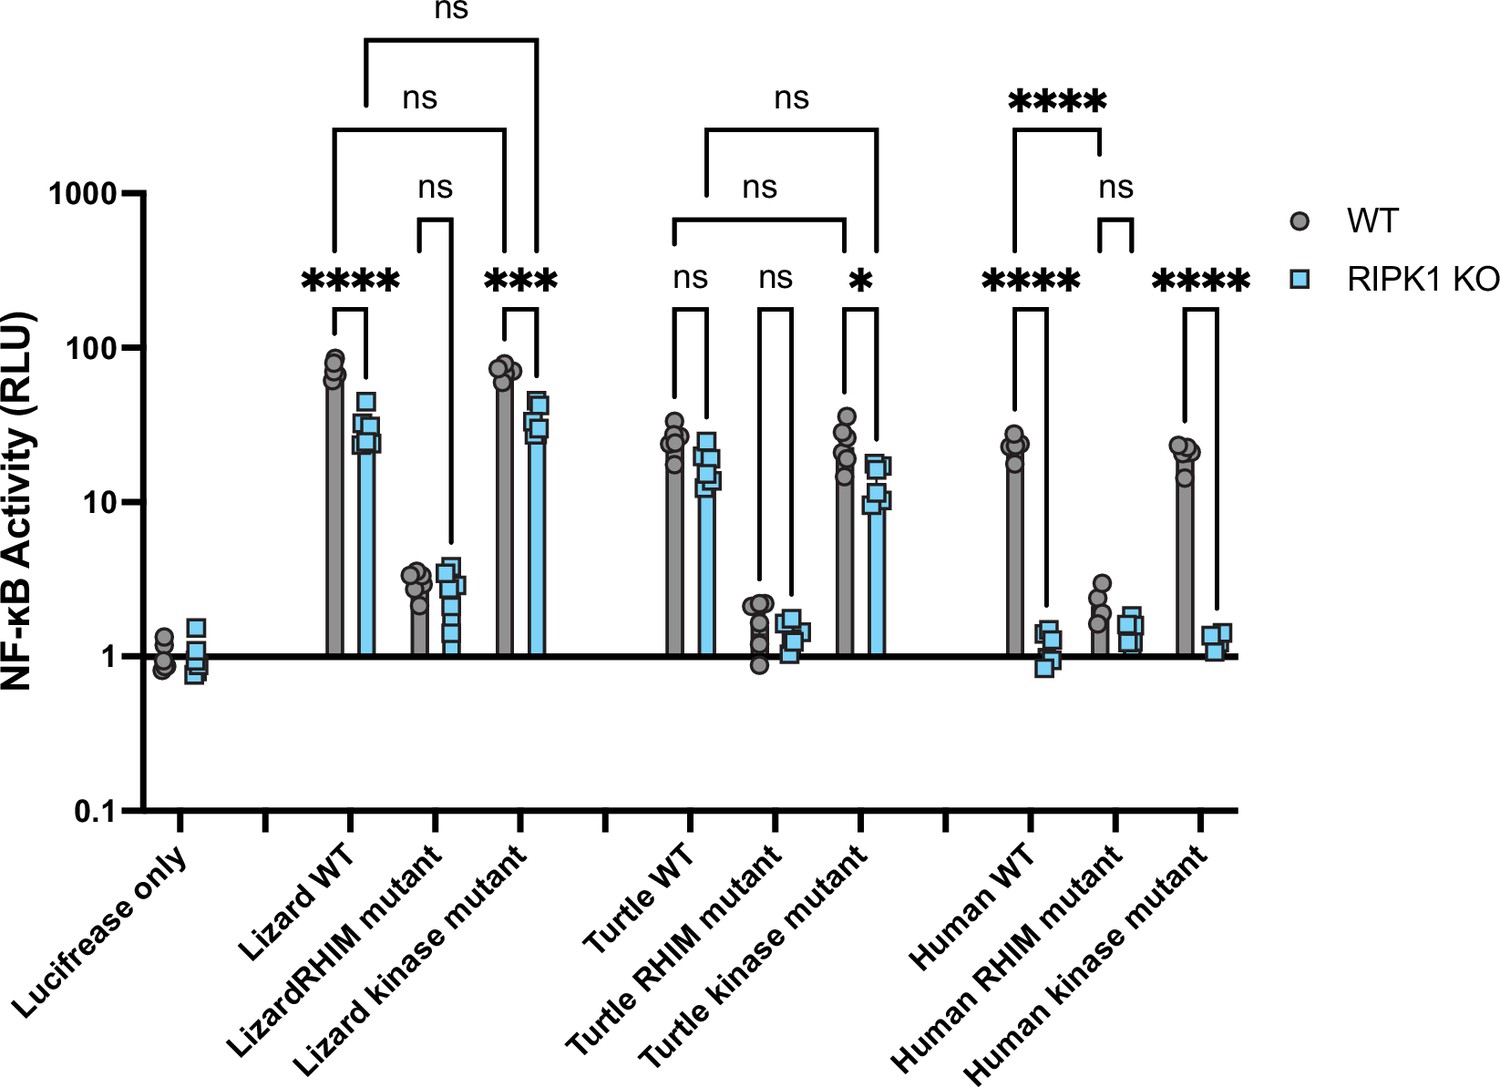
RIPK1-independent activation of reptile RIPK3 is independent of kinase activity.
The indicated RIPK3 proteins were transfected into WT or RIPK1 KO HEK293T cells, along with NF-κB firefly luciferase and control renilla luciferase reporter plasmids (see Materials and methods), and NF-κB activity was measured at 18 hr post-transfection. Data are representative of 2 independent experiments with n=4–6 biological replicates per group. Data were analyzed using two-way ANOVA with Tukey’s multiple comparison test. ns = not significant, *p<0.05, ***p <0.001, ****p<0.0001.
-
Figure 3—figure supplement 1—source data 1
Raw data for the bar graphs in Figure 3—figure supplement 1 depicting cell death activation by wild-type, kinase mutant, and RIPK3 proteins.
- https://cdn.elifesciences.org/articles/102301/elife-102301-fig3-figsupp1-data1-v1.xlsx
Figure 3—figure supplement 2
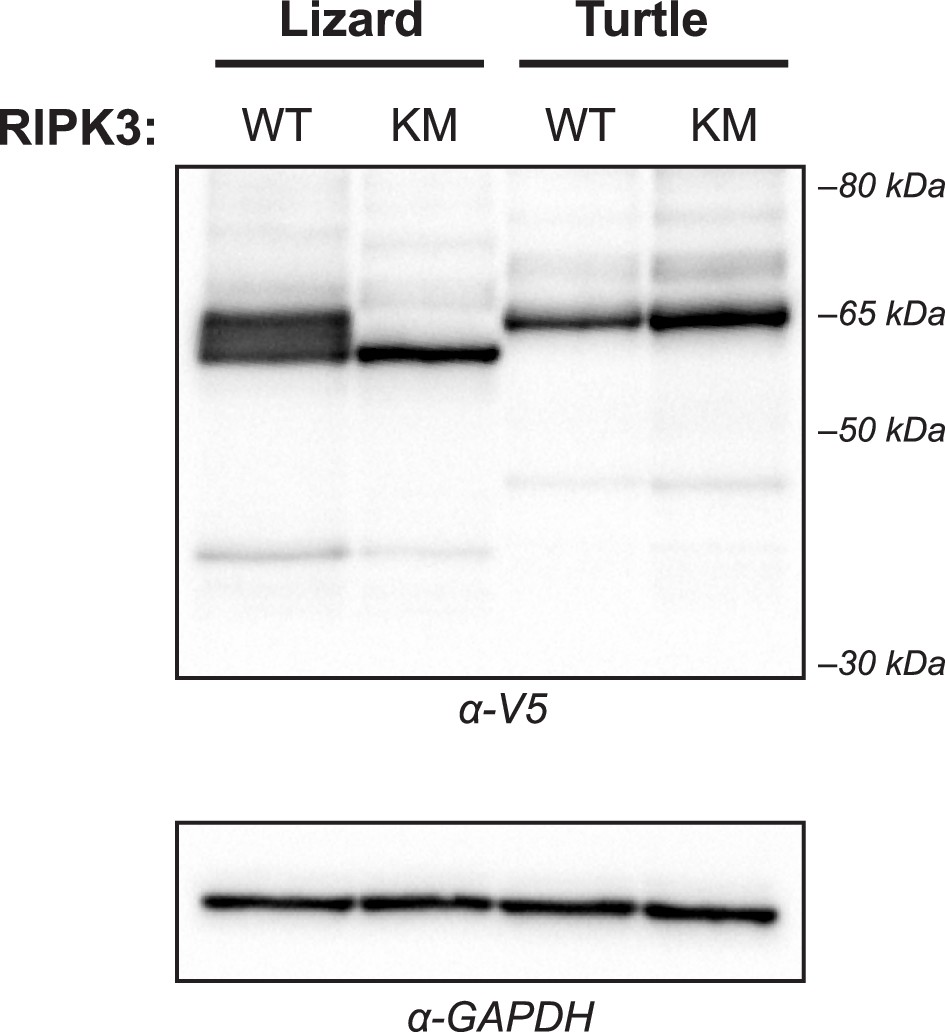
Expression of reptile RIPK3 kinase mutants.
WT HEK293T cells were transfected with the indicated V5-RIPK3 protein. Protein expression was analyzed at 18 hr post-transfection by western blot using the indicated antibodies. WT = wild-type, KM = kinase mutant.
-
Figure 3—figure supplement 2—source data 1
Original western blots for Figure 3—figure supplement 2.
- https://cdn.elifesciences.org/articles/102301/elife-102301-fig3-figsupp2-data1-v1.zip
-
Figure 3—figure supplement 2—source data 2
PDF file containing original western blots for Figure 3—figure supplement 2, indicating the relevant bands and treatments.
- https://cdn.elifesciences.org/articles/102301/elife-102301-fig3-figsupp2-data2-v1.zip
Figure 4 with 6 supplements

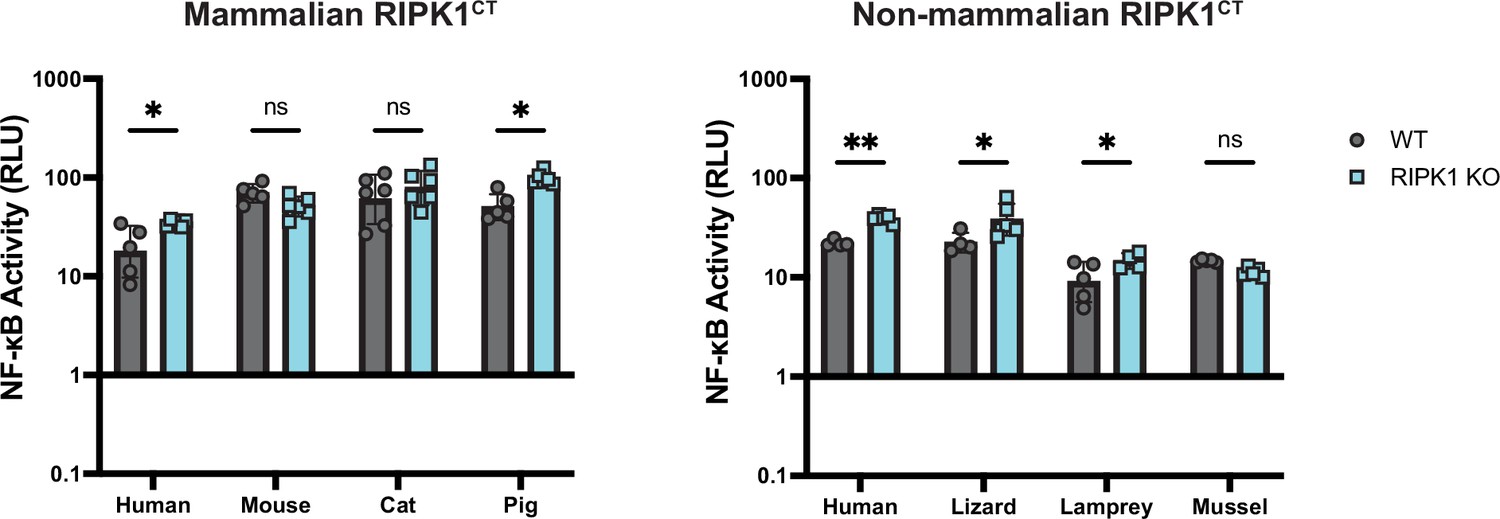
NF-κB activation is a shared function of RHIM-containing proteins and can be tuned by the RHIM.
(A) Alignment of RIPK1 RHIM across diverse vertebrates. Residue numbers refer to the human sequence. Lancelet species is Branchiostoma floridae. (B) Diverse vertebrate RIPK1CT proteins were transfected into HEK293T cells along with NF-κB firefly luciferase and control renilla luciferase reporter plasmids (see Materials and methods), and NF-κB activity was measured at 18 hr post-transfection. (C) Alignment of ZBP1 RHIMs across diverse vertebrates. Residue numbers refer to the human sequence. (D) Activation of NF-κB by WT and RHIM mutant ZBP1 proteins. (E) NF-κB activation by human RIPK3 with the indicated RHIM tetrad variant. (F) Human RIPK3 proteins with the indicated RHIM tetrad variants were transfected into HEK293T cells with MLKL (gray circles) or MLKL and ZBP1 (orange squares), and viability was measured at 18 hr post-transfection. Data are representative of 2–5 independent experiments with n=3–6 replicates per group. Data were analyzed using two-way ANOVA with Šidák’s multiple comparisons test (A, D), one-way ANOVA with Tukey’s multiple comparisons test (E), or two-way ANOVA with Tukey’s multiple comparisons test (F). ns = not significant, ****=p<0.0001.
-
Figure 4—source data 1
Raw data for the bar graphs in Figure 4 depicting NF-κB (B, D, E) and cell death (F) activation by various RHIM-containing proteins.
- https://cdn.elifesciences.org/articles/102301/elife-102301-fig4-data1-v1.xlsx
Figure 4—figure supplement 1
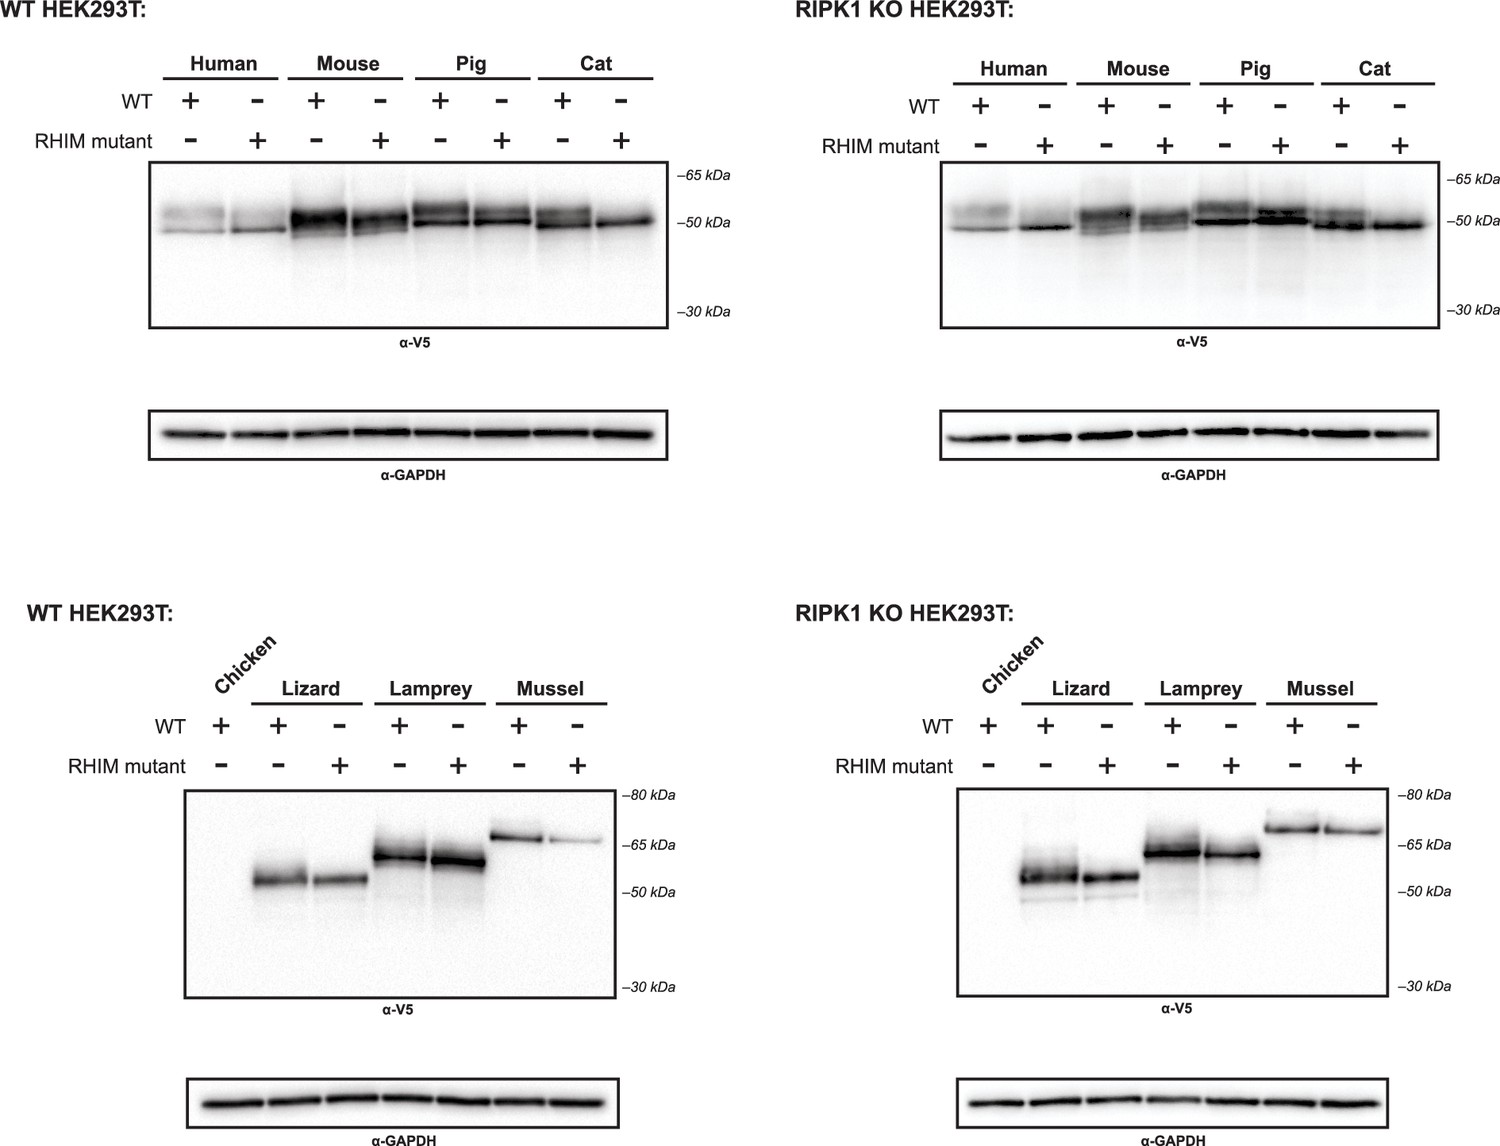
Expression of nonhuman RIPK1CT proteins.
WT or RIPK1 KO HEK293T cells were transfected with the indicated protein. Protein expression was analyzed at 18 hr post-transfection by western blot using the indicated antibodies.
-
Figure 4—figure supplement 1—source data 1
Original western blots for Figure 4—figure supplement 1.
- https://cdn.elifesciences.org/articles/102301/elife-102301-fig4-figsupp1-data1-v1.zip
-
Figure 4—figure supplement 1—source data 2
PDF files containing original western blots for Figure 4—figure supplement 1, indicating the relevant bands and treatments.
- https://cdn.elifesciences.org/articles/102301/elife-102301-fig4-figsupp1-data2-v1.zip
Figure 4—figure supplement 2
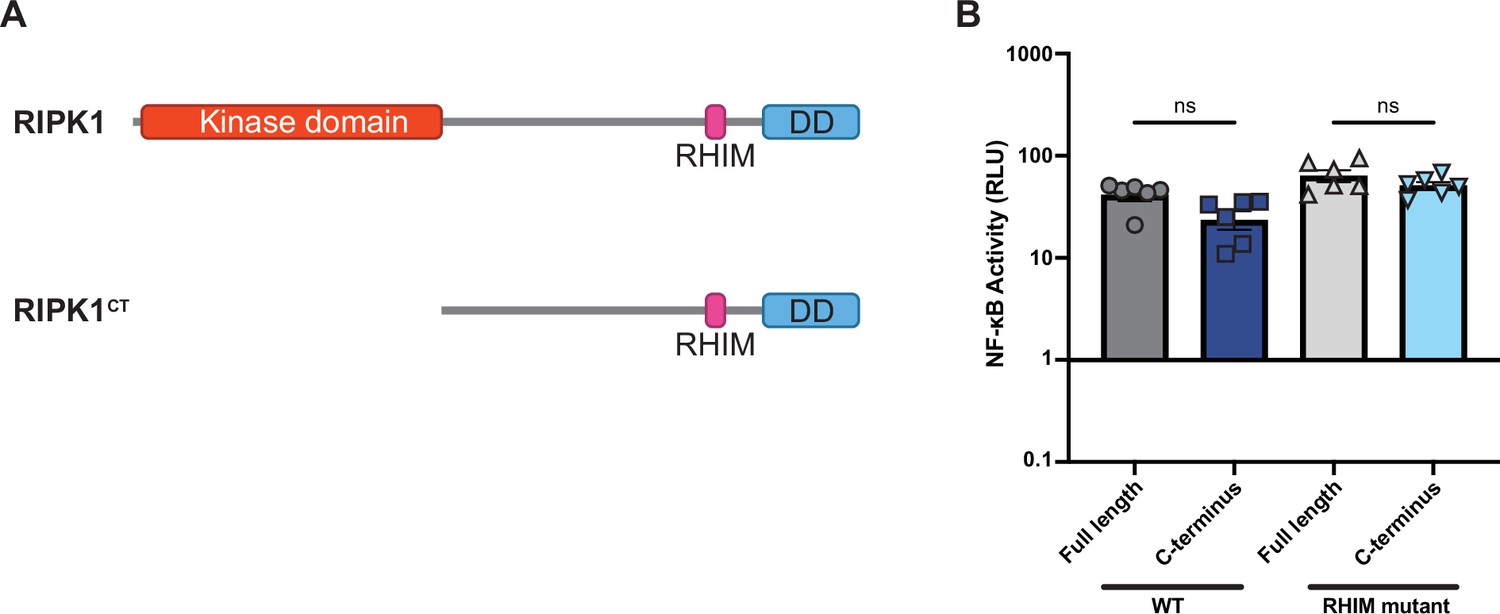
RIPK1CT activates NF-κB similar to full-length RIPK1.
(A) Schematic of RIPK1CT compared to full-length RIPK1. (B) WT and RHIM mutant RIPK1 full length and RIPK1CT were transfected into HEK293T cells along with Dual-Glo plasmids (see Materials and methods). NF-κB activation was analyzed at 18 hr post-transfection. Data were analyzed using one-way ANOVA with Tukey’s multiple comparison test. ns = not significant.
-
Figure 4—figure supplement 2—source data 1
Raw data for the bar graphs in Figure 4—figure supplement 2 depicting NF-κB activation by human RIPK1 proteins.
- https://cdn.elifesciences.org/articles/102301/elife-102301-fig4-figsupp2-data1-v1.xlsx
Figure 4—figure supplement 3
Activation of NF-κB by diverse vertebrate RIPK1CT is independent of endogenous human RIPK1.
WT and RIPK1 KO HEK293T cells were transfected with the indicated RIPK1CT along with Dual-Glo plasmids (see Materials and methods). NF-κB activation was analyzed at 18 hr post-transfection. Data are representative of 3 independent experiments with 3–6 biological replicates per group. Data were analyzed using two-way ANOVA with Šidák’s multiple comparisons test. ns = not significant, *=p<0.05, **=p<0.01.
-
Figure 4—figure supplement 3—source data 1
Raw data for the bar graphs in Figure 4—figure supplement 3 depicting NF-κB activation by various vertebrate RIPK1CT proteins in wild-type and RIPK1 KO HEK293T cells.
- https://cdn.elifesciences.org/articles/102301/elife-102301-fig4-figsupp3-data1-v1.xlsx
Figure 4—figure supplement 4
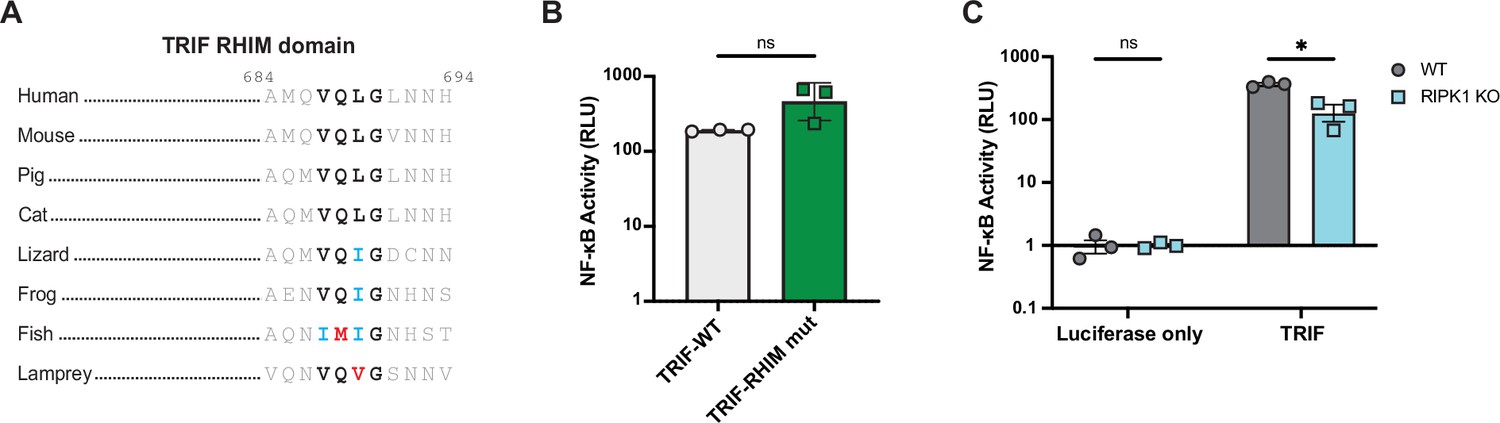
Activation of NF-κB by TRIF.
(A) TRIF sequences from vertebrate species highlighting the RHIM core tetrad. Residue numbers refer to the human sequence. Vertebrate species shown include mouse (M. musculus), pig (S. scrofa), cat (F. catus), lizard (A. carolinensis), frog (Xenopus laevis), fish (Danio rerio), and lamprey (P. marinus). (B–C) WT (B–C) and RIPK1 KO (C) HEK293T cells were transfected with the indicated plasmids along with Dual-Glo plasmids (see Materials and methods). NF-κB activation was analyzed at 18 hr post-transfection. Data are representative of 3 independent experiments with 3 biological replicates per group. Data were analyzed using a t-test (B) or a two-way ANOVA with Šidák’s multiple comparisons test (C). ns = not significant, *=p<0.05.
-
Figure 4—figure supplement 4—source data 1
Raw data for the bar graphs in Figure 4—figure supplement 4 depicting NF-κB activation by human TRIF proteins.
- https://cdn.elifesciences.org/articles/102301/elife-102301-fig4-figsupp4-data1-v1.xlsx
Figure 4—figure supplement 5

Activation of NF-κB by human RIPK3 RHIM variants.
The indicated human RIPK3 RHIM tetrad variants were transfected into HEK293T cells along with NF-κB firefly luciferase and control renilla luciferase reporter plasmids (see Materials and methods), and NF-κB activity was measured at 18 hr post-transfection. Data were analyzed using one-way ANOVA with Tukey’s multiple comparisons test. **=p<0.01, ****=p<0.0001. Data are representative of 2 independent experiments with n=5–6 biological replicates per group.
-
Figure 4—figure supplement 5—source data 1
Raw data for the bar graphs in Figure 4—figure supplement 5 depicting NF-κB activation by human RIPK3 proteins.
- https://cdn.elifesciences.org/articles/102301/elife-102301-fig4-figsupp5-data1-v1.xlsx
Figure 4—figure supplement 6

Expression of human RIPK3 RHIM variants.
WT HEK293T cells were transfected with the indicated V5-RIPK3 protein. Protein expression was analyzed at 18 hr post-transfection by western blot using the indicated antibodies.
-
Figure 4—figure supplement 6—source data 1
Original western blots for Figure 4—figure supplement 6.
- https://cdn.elifesciences.org/articles/102301/elife-102301-fig4-figsupp6-data1-v1.zip
-
Figure 4—figure supplement 6—source data 2
PDF file containing original western blots for Figure 4—figure supplement 6, indicating the relevant bands and treatments.
- https://cdn.elifesciences.org/articles/102301/elife-102301-fig4-figsupp6-data2-v1.zip
Author response image 1
Author response image 2

Additional files
-
Supplementary file 1
Accession numbers for genes used in PAML analysis.
- https://cdn.elifesciences.org/articles/102301/elife-102301-supp1-v1.xlsx
-
Supplementary file 2
p-Values calculated by PAML.
- https://cdn.elifesciences.org/articles/102301/elife-102301-supp2-v1.xlsx
-
Supplementary file 3
RIPK3 sites identified by PAML, FUBAR, and MEME as evolving under positive selection.
- https://cdn.elifesciences.org/articles/102301/elife-102301-supp3-v1.xlsx
-
Supplementary file 4
Accession numbers for proteins analyzed in Figure 1C.
- https://cdn.elifesciences.org/articles/102301/elife-102301-supp4-v1.xlsx
-
Supplementary file 5
List of species included in analysis in Figure 1C.
- https://cdn.elifesciences.org/articles/102301/elife-102301-supp5-v1.xlsx
-
Supplementary file 6
List of proteins used as outgroups for analysis in Figure 1C.
- https://cdn.elifesciences.org/articles/102301/elife-102301-supp6-v1.xlsx
-
Supplementary file 7
Expression of CASP8 and ZBP1 in reptile species.
- https://cdn.elifesciences.org/articles/102301/elife-102301-supp7-v1.xlsx
-
Supplementary file 8
List of RHIM variants identified in vertebrate RIPK3 proteins.
- https://cdn.elifesciences.org/articles/102301/elife-102301-supp8-v1.xlsx
-
Supplementary file 9
Primers used to generate plasmid DNA constructs used in this study.
- https://cdn.elifesciences.org/articles/102301/elife-102301-supp9-v1.xlsx
-
MDAR checklist
- https://cdn.elifesciences.org/articles/102301/elife-102301-mdarchecklist1-v1.docx
Download links
A two-part list of links to download the article, or parts of the article, in various formats.
Downloads (link to download the article as PDF)
Open citations (links to open the citations from this article in various online reference manager services)
Cite this article (links to download the citations from this article in formats compatible with various reference manager tools)
Evolutionary and functional analyses reveal a role for the RHIM in tuning RIPK3 activity across vertebrates
eLife 13:RP102301.
https://doi.org/10.7554/eLife.102301.3


