The conserved ATPase PCH-2 controls the number and distribution of crossovers by antagonizing their formation in Caenorhabditis elegans
- Department of Molecular, Cell and Developmental Biology, University of California, Santa Cruz, United States
Figures
Figure 1
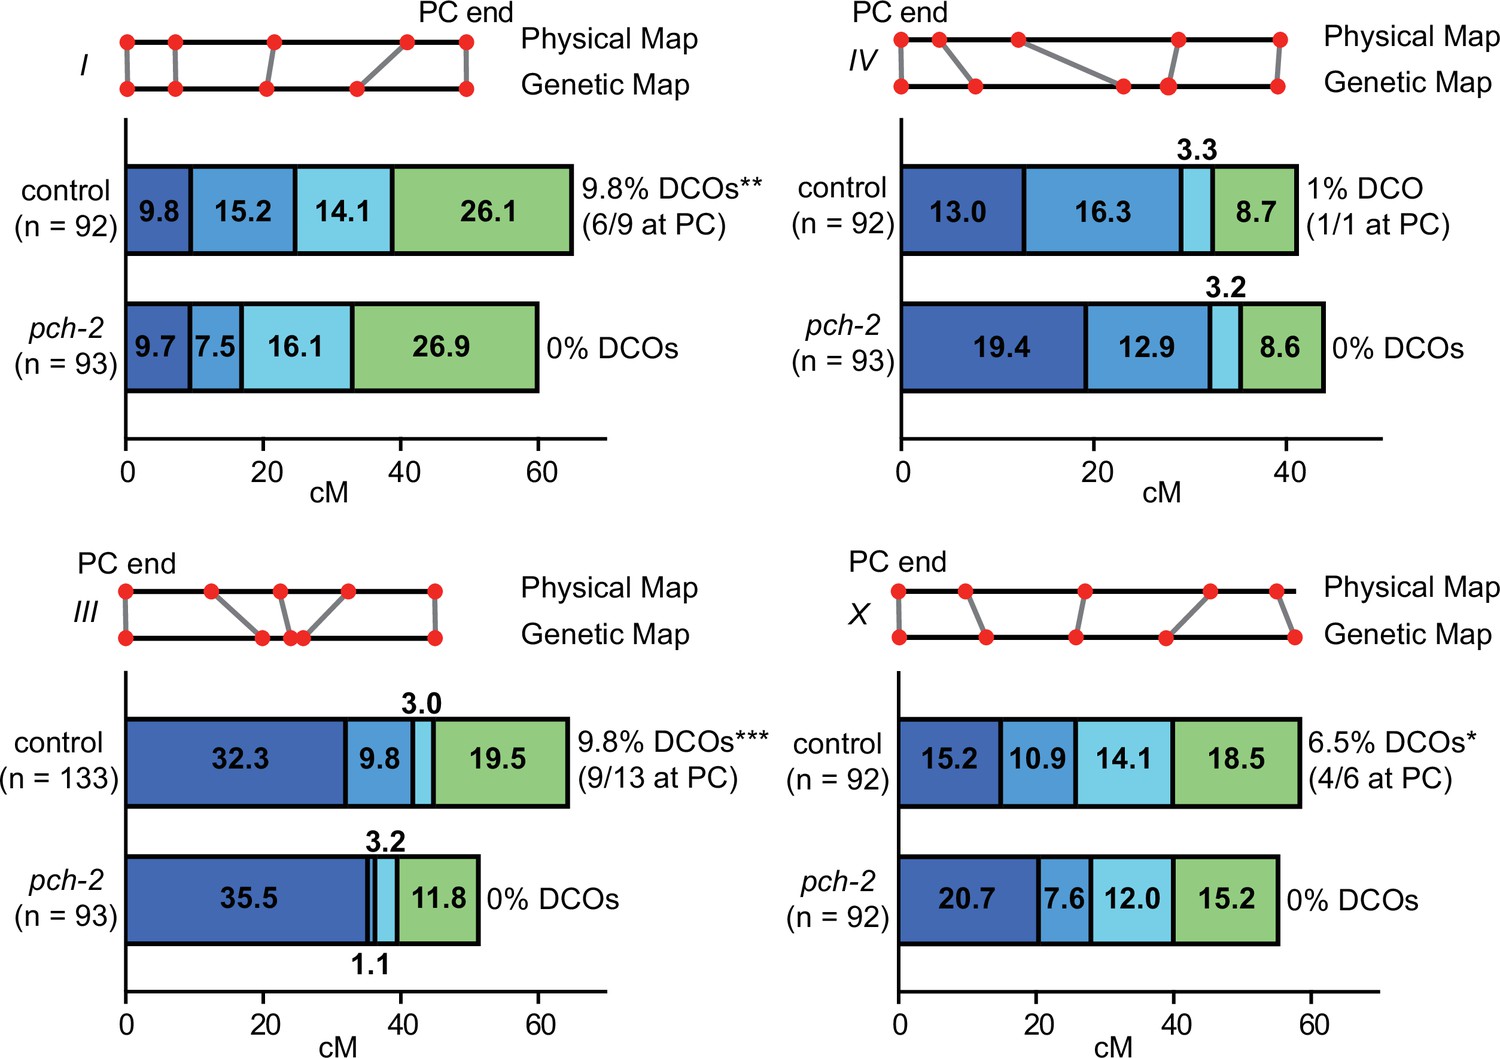
PCH-2 controls the number and distribution of crossovers in similar patterns on multiple chromosomes.
Genetic analysis of meiotic recombination in wildtype and pch-2 mutants. DCO indicates double crossovers. Physical and genetic maps of chromosomes I, III, IV and the X chromosome are depicted to scale. Genetic distance is shown in centimorgans. *p<0.05, **p<0.01, and ***p<0.001.
-
Figure 1—source data 1
Numerical data depicted in Figure 1.
- https://cdn.elifesciences.org/articles/102409/elife-102409-fig1-data1-v1.xlsx
Figure 2
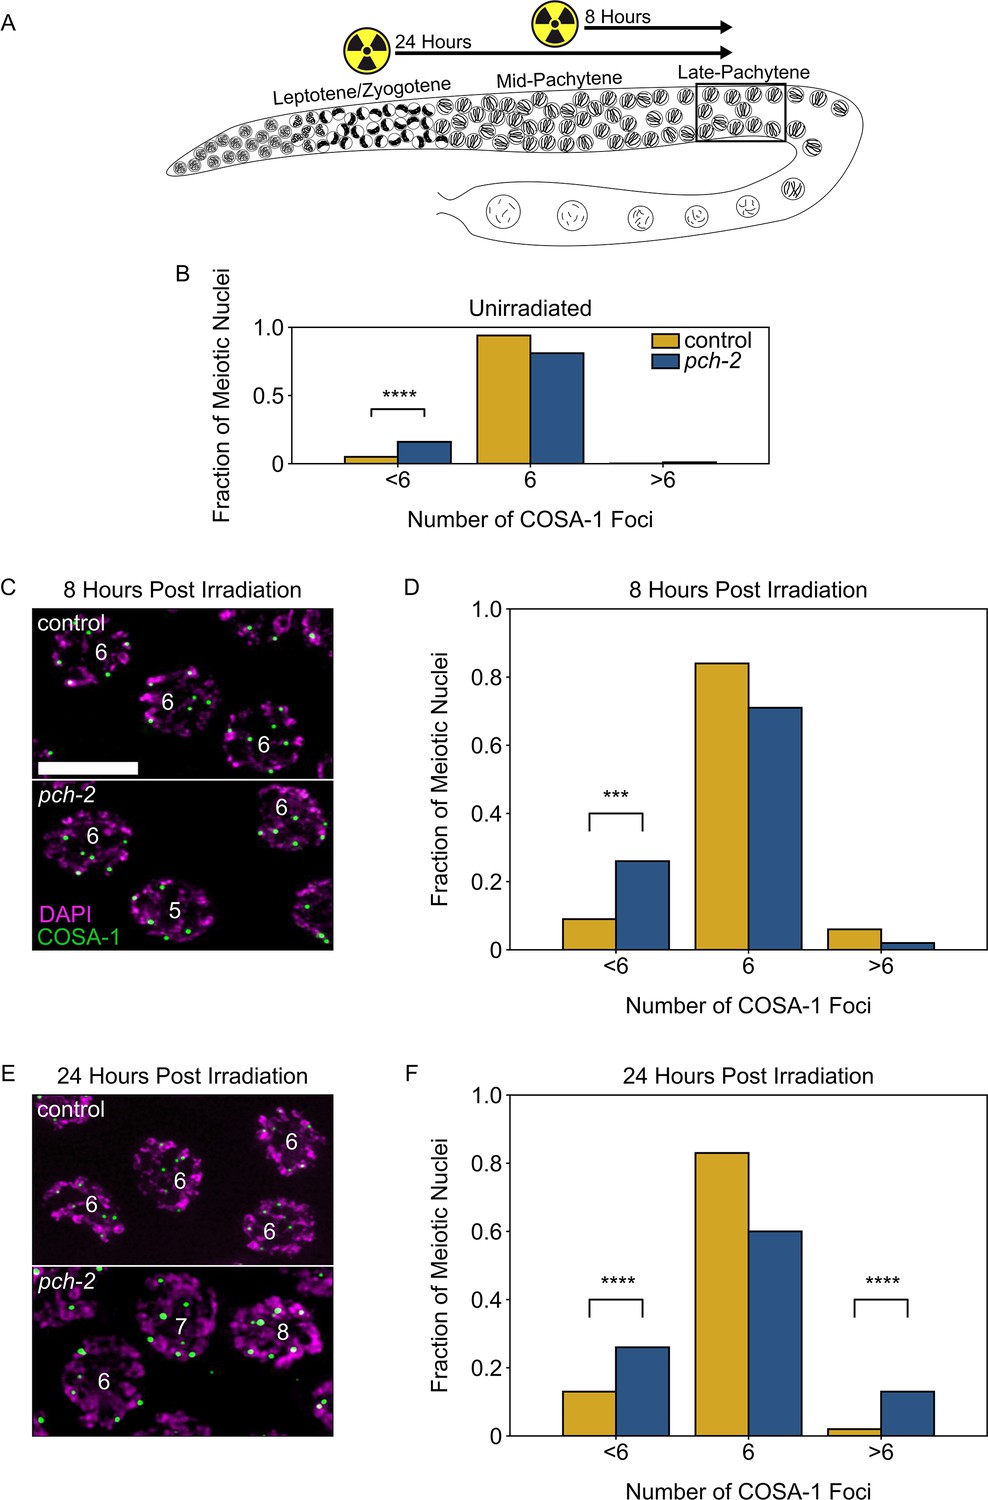
PCH-2 prevents exogenous double strand breaks from becoming crossovers in early meiotic prophase.
(A) Illustration of the irradiation experiments in control and pch-2 mutants. Box indicates late pachytene, the area where GFP::COSA-1 foci are analyzed. (B) Fraction of meiotic nuclei with less than six, six, or greater than six GFP::COSA-1 foci in control animals (yellow, n = 446) and pch-2 mutants (blue, n = 552). (C) Meiotic nuclei in control animals and pch-2 mutants 8 hours post irradiation stained for DAPI (magenta) and GFP::COSA-1 (green). Scale bar is 4 um. (D) Fraction of meiotic nuclei with less than six, six, or greater than six GFP::COSA-1 foci in control animals (yellow, n = 143) and pch-2 mutants (blue, n = 125) 8 hours post irradiation. (E) Meiotic nuclei in control animals and pch-2 mutants 24 hours post irradiation with DAPI (magenta) and GFP::COSA-1 (green). (F) Fraction of meiotic nuclei with less than six, six, or greater than six GFP::COSA-1 foci in control animals (n = 179) and pch-2 mutants (n = 378) 24 hours post irradiation. ***p<0.001, ****p<0.0001.
-
Figure 2—source data 1
Numerical data depicted in Figure 2.
- https://cdn.elifesciences.org/articles/102409/elife-102409-fig2-data1-v1.xlsx
Figure 3
PCH-2 prevents SPO-11-induced double-strand breaks from becoming crossovers in early meiotic prophase.
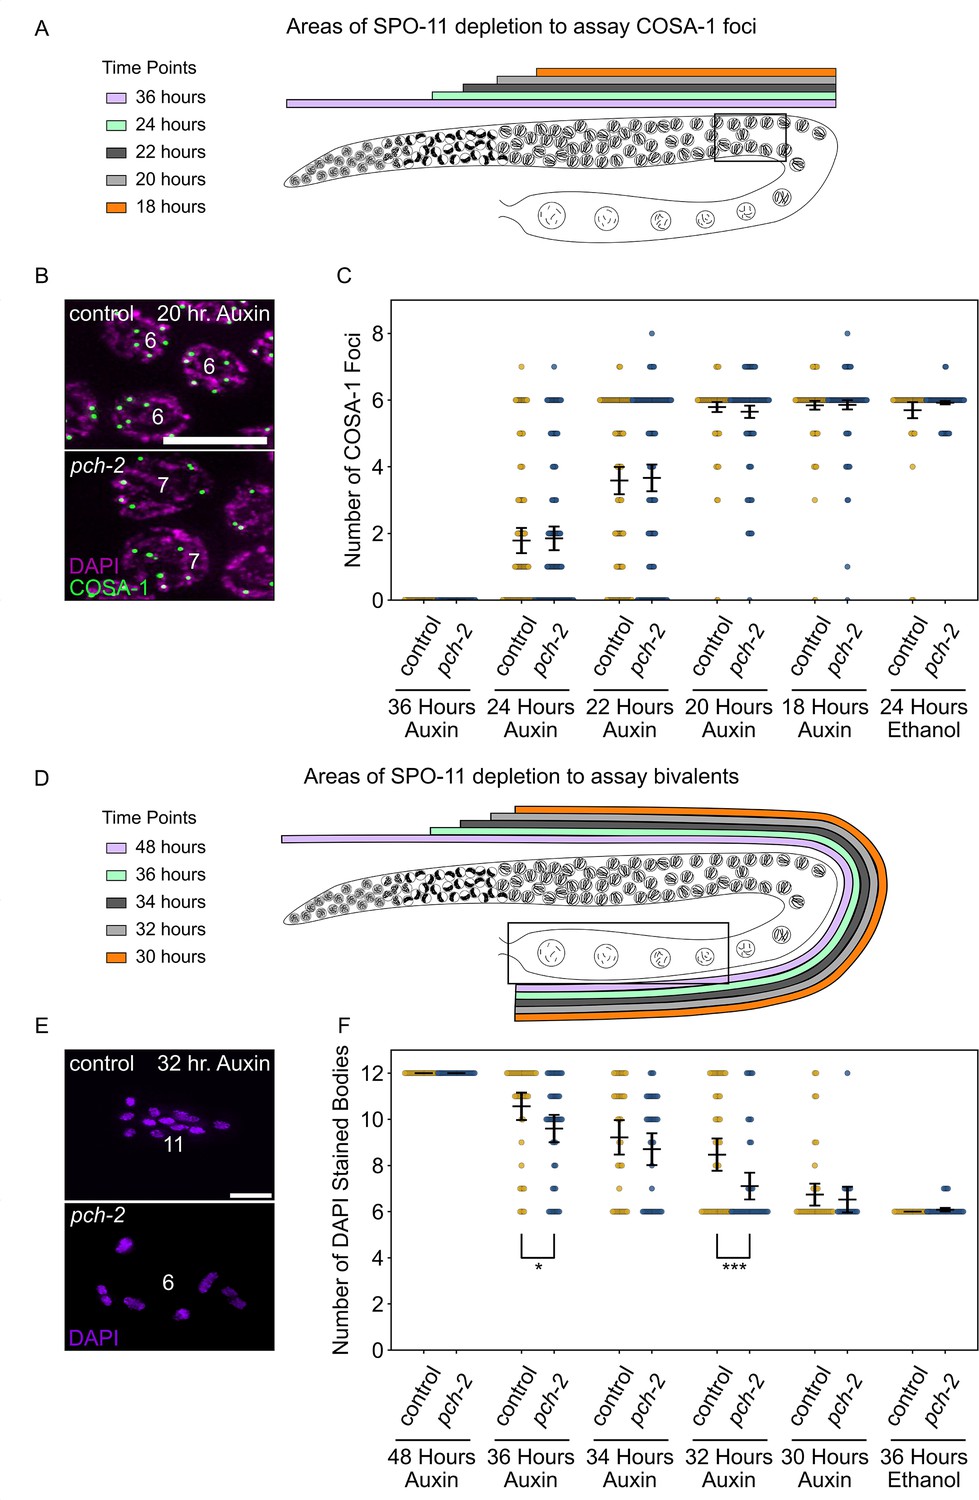
(A) Illustration of the SPO-11 depletion experiment to assay GFP::COSA-1 in control animals and pch-2 mutants at different timepoints of auxin treatment. Each timepoint indicates when SPO-11 is depleted in the germline with auxin-induced degradation. Box indicates late pachytene, the area where GFP::COSA-1 foci are analyzed. (B) Representative images of meiotic nuclei in control animals and pch-2 mutants treated with auxin for 20 hours, stained for DAPI (magenta) and GFP::COSA-1 (green). Scale bar is 5 um. (C) Number of GFP::COSA-1 foci in meiotic nuclei at different timepoints of auxin treatment in control (blue) and pch-2 mutants (yellow). Error bars represent SEM. N values are as follows: 36 hours on auxin, control (78 nuclei), and pch-2 (83 nuclei); 24 hours on auxin, control (132 nuclei), and pch-2 (155 nuclei); 22 hours on auxin, control (152 nuclei), and pch-2 (168 nuclei); 20 hours on auxin, control (139 nuclei), and pch-2 (157 nuclei); 18 hours on auxin, control (154 nuclei), and pch-2 (154 nuclei); and 24 hours on ethanol, control (86 nuclei), and pch-2 (143 nuclei). (D) Illustration of the SPO-11 depletion experiment to assay bivalents in control animals and pch-2 mutants at different timepoints of auxin treatment. Each timepoint indicates when SPO-11 is depleted in the germline with auxin-induced degradation. Box indicates diakinesis, where DAPI-stained bodies are analyzed. (E) Oocytes from control animals and pch-2 mutants stained for DAPI (magenta). Scale bar is 4 um. (F) Number of DAPI-stained bodies in meiotic nuclei at different timepoints of auxin treatment in control animals and pch-2 mutants. N values are as follows: 48 hours on auxin, control (47 nuclei), and pch-2 (43 nuclei); 36 hours on auxin, control (46 nuclei), and pch-2 (50 nuclei); 34 hours on auxin, control (41 nuclei), and pch-2 (41 nuclei); 32 hours on auxin, control (51 nuclei), and pch-2 (47 nuclei); 30 hours on auxin, control (46 nuclei), and pch-2 (21 nuclei); and 36 hours on ethanol, control (52 nuclei), and pch-2 (48 nuclei). Error bars represent SEM and *<0.05, ***p<0.001.
-
Figure 3—source data 1
Numerical data depicted in Figure 3.
- https://cdn.elifesciences.org/articles/102409/elife-102409-fig3-data1-v1.xlsx
Figure 4 with 2 supplements
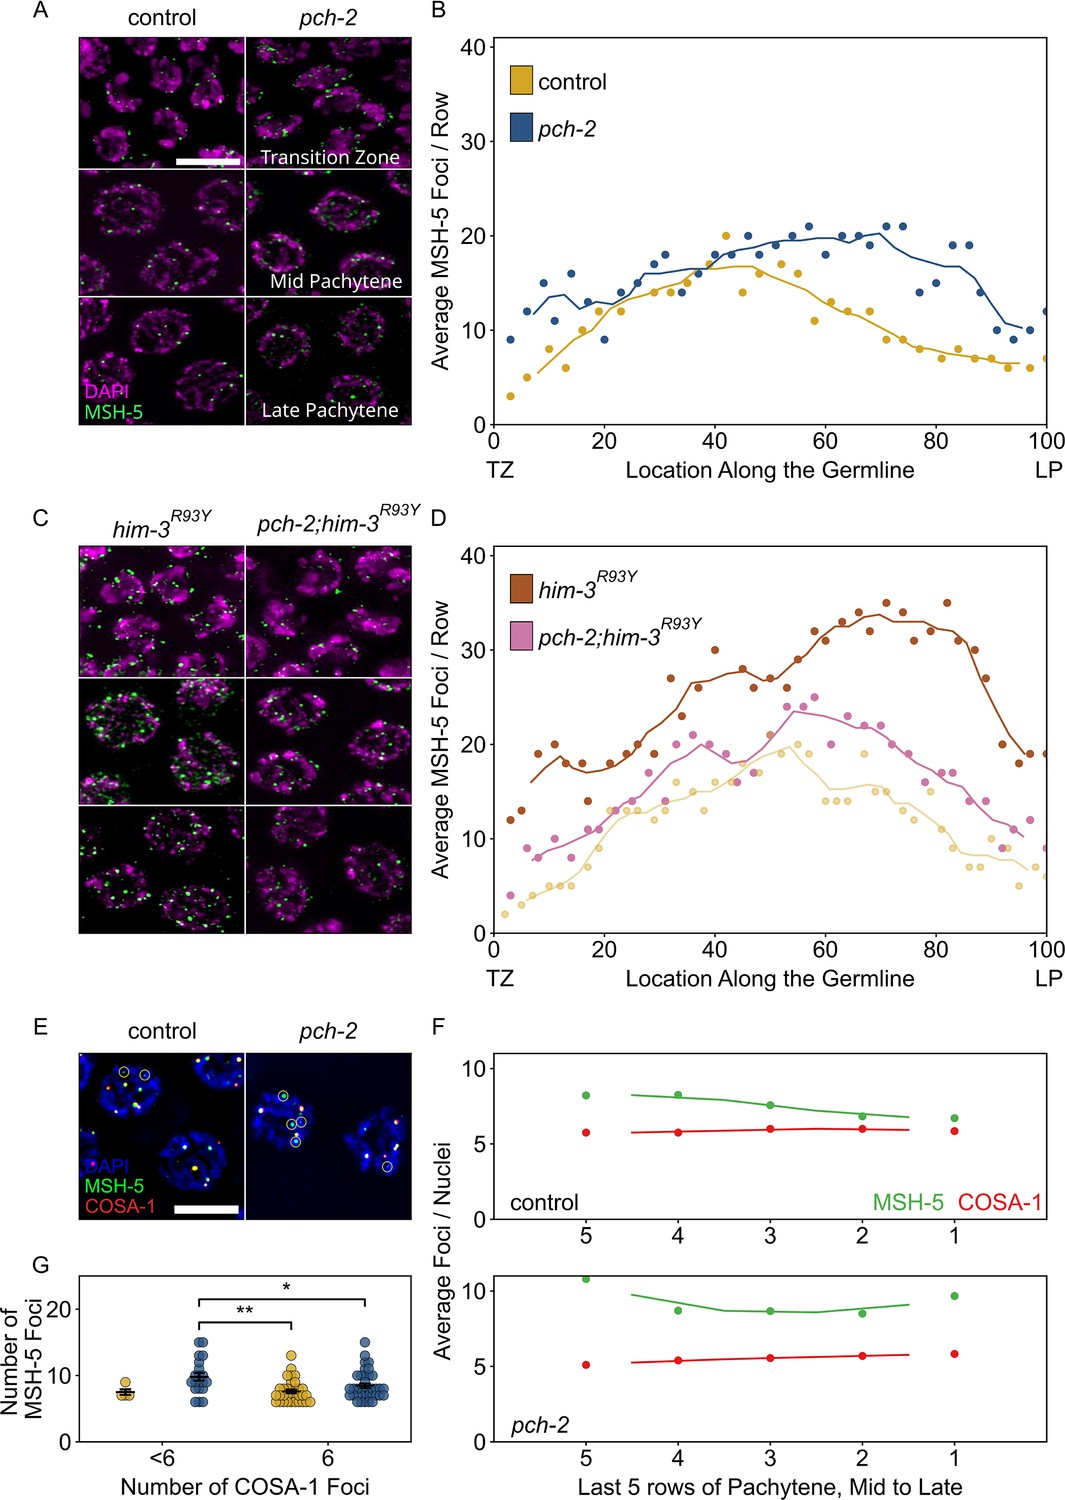
PCH-2 is required for timely loading and removal of MSH-5 on meiotic chromosomes through its regulation of HIM-3.
(A) Representative images of nuclei in different stages of meiotic prophase in control animals and pch-2 mutants stained for DAPI (magenta) and GFP::MSH-5 (green) Scale bar is 5 um. (B) Scatter plot showing average GFP::MSH-5 foci per row of germline nuclei in control animals (yellow, 163 nuclei) and pch-2 mutants (blue, 195 nuclei) from the transition zone (TZ) to late pachytene (LP), normalized to 100. The line represents a rolling average of four rows. (C) Representative images of nuclei in different stages of meiotic prophase in him-3R93Y mutants (left) and pch-2;him-3R93Y double mutants (right), stained for DAPI (magenta) and GFP::MSH-5 (green). (D) Scatter plot showing average GFP::MSH-5 foci per row in him-3R93Y (brown, 183 nuclei) and pch-2;him-3R93Y mutants (pink, 163 nuclei) from the TZ to LP, normalized to 100. The line represents a rolling average of four rows. Similar data is provided for a control germline (opaque yellow, 236 nuclei) for comparison. (E) Representative images of meiotic nuclei in control animals and pch-2 mutants stained for DAPI (blue), GFP::MSH-5 (green), and OLLAS::COSA-1 (red). Yellow circles indicate GFP::MSH-5 without OLLAS::COSA-1. Scale bar is 4 um. (F) Scatter plot showing average GFP::MSH-5 (green) and OLLAS::COSA-1 (red) foci per row in the last five rows of the germline in control animals (36 nuclei) and pch-2 mutants (45 nuclei). The line represents a rolling average of two rows. (G) Swarm plot showing number of GFP::MSH-5 foci in control (yellow, 14 nuclei) and pch-2 mutant (blue, 29 nuclei) nuclei with less than six OLLAS::COSA-1 foci (left) and six OLLAS::COSA-1 foci (right). Error bars represent SEM. *p<0.05, **p<0.01.
-
Figure 4—source data 1
Numerical data depicted in Figure 4 and Figure 4—figure supplement 1.
- https://cdn.elifesciences.org/articles/102409/elife-102409-fig4-data1-v1.xlsx
Figure 4—figure supplement 1
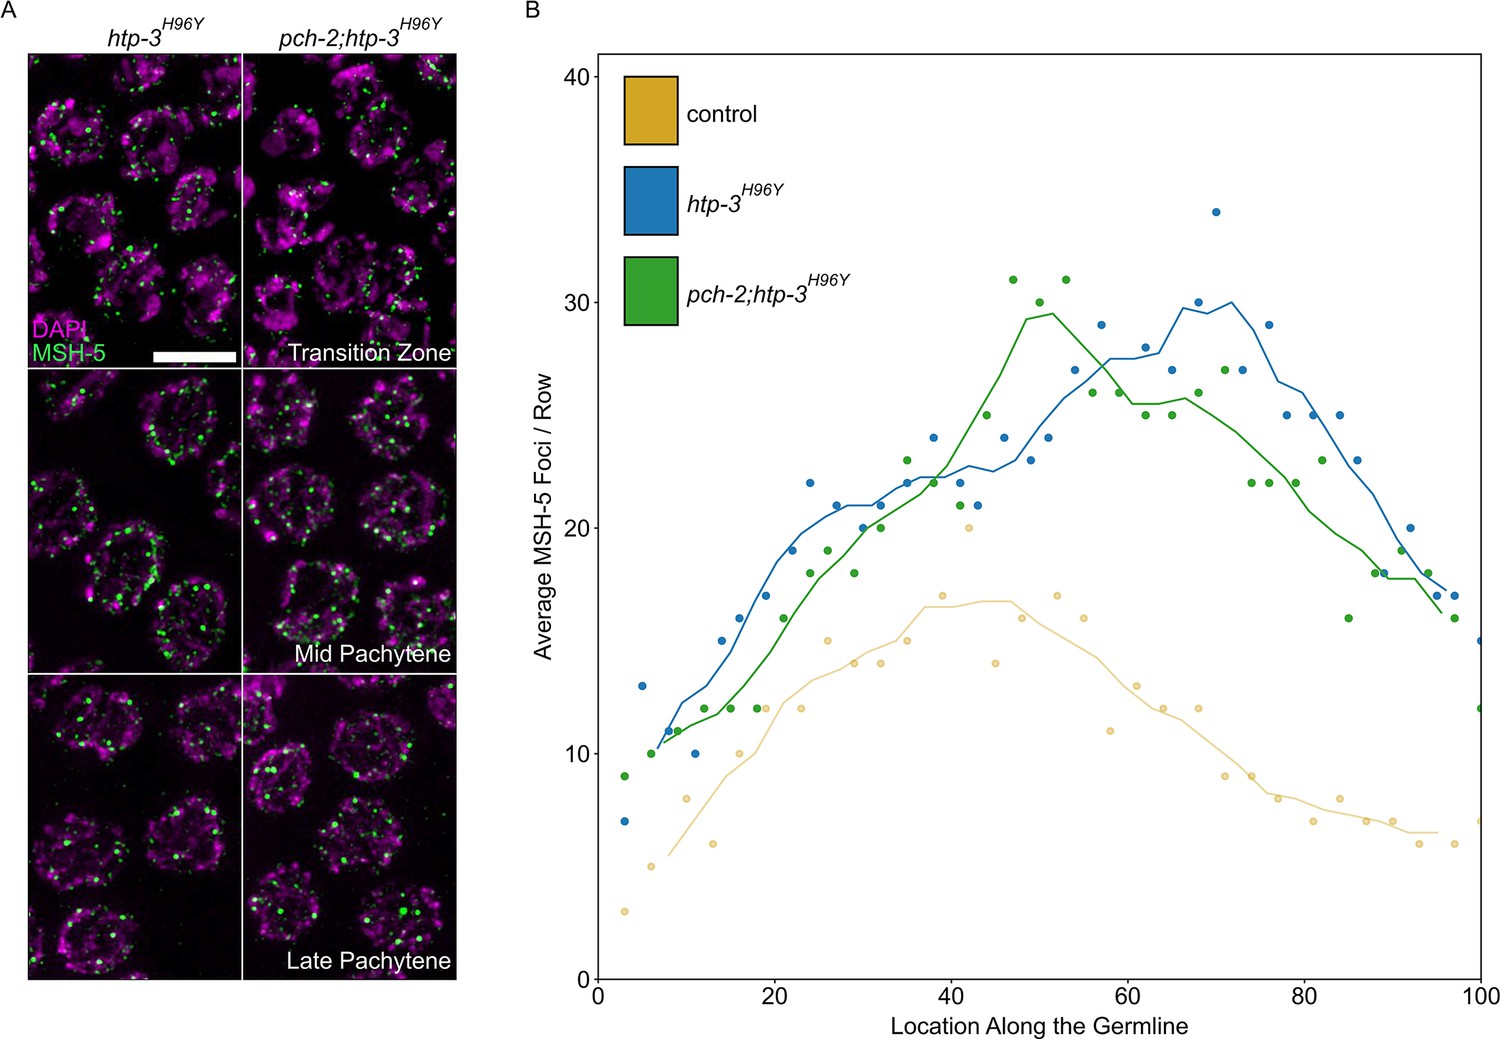
PCH-2 does not regulate GFP::MSH-5 loading and removal through HTP-3.
(A) Representative images of nuclei in different stages of meiotic prophase in htp-3H96Y and pch-2; htp-3H96Y mutants stained for DAPI (magenta) and GFP::MSH-5 (green). Scale bar in all images is 5 um. (B) Scatter plot showing average GFP::MSH-5 foci per row of germline nuclei in htp-3H96Y (blue, 132 nuclei) and pch-2; htp-3H96Y (green, 161 nuclei) mutants from the transition zone to late pachytene, normalized to 100. The line represents a rolling average of four rows. Similar data is provided for a control germline (opaque yellow, 163 nuclei) for comparison.
Figure 4—figure supplement 2
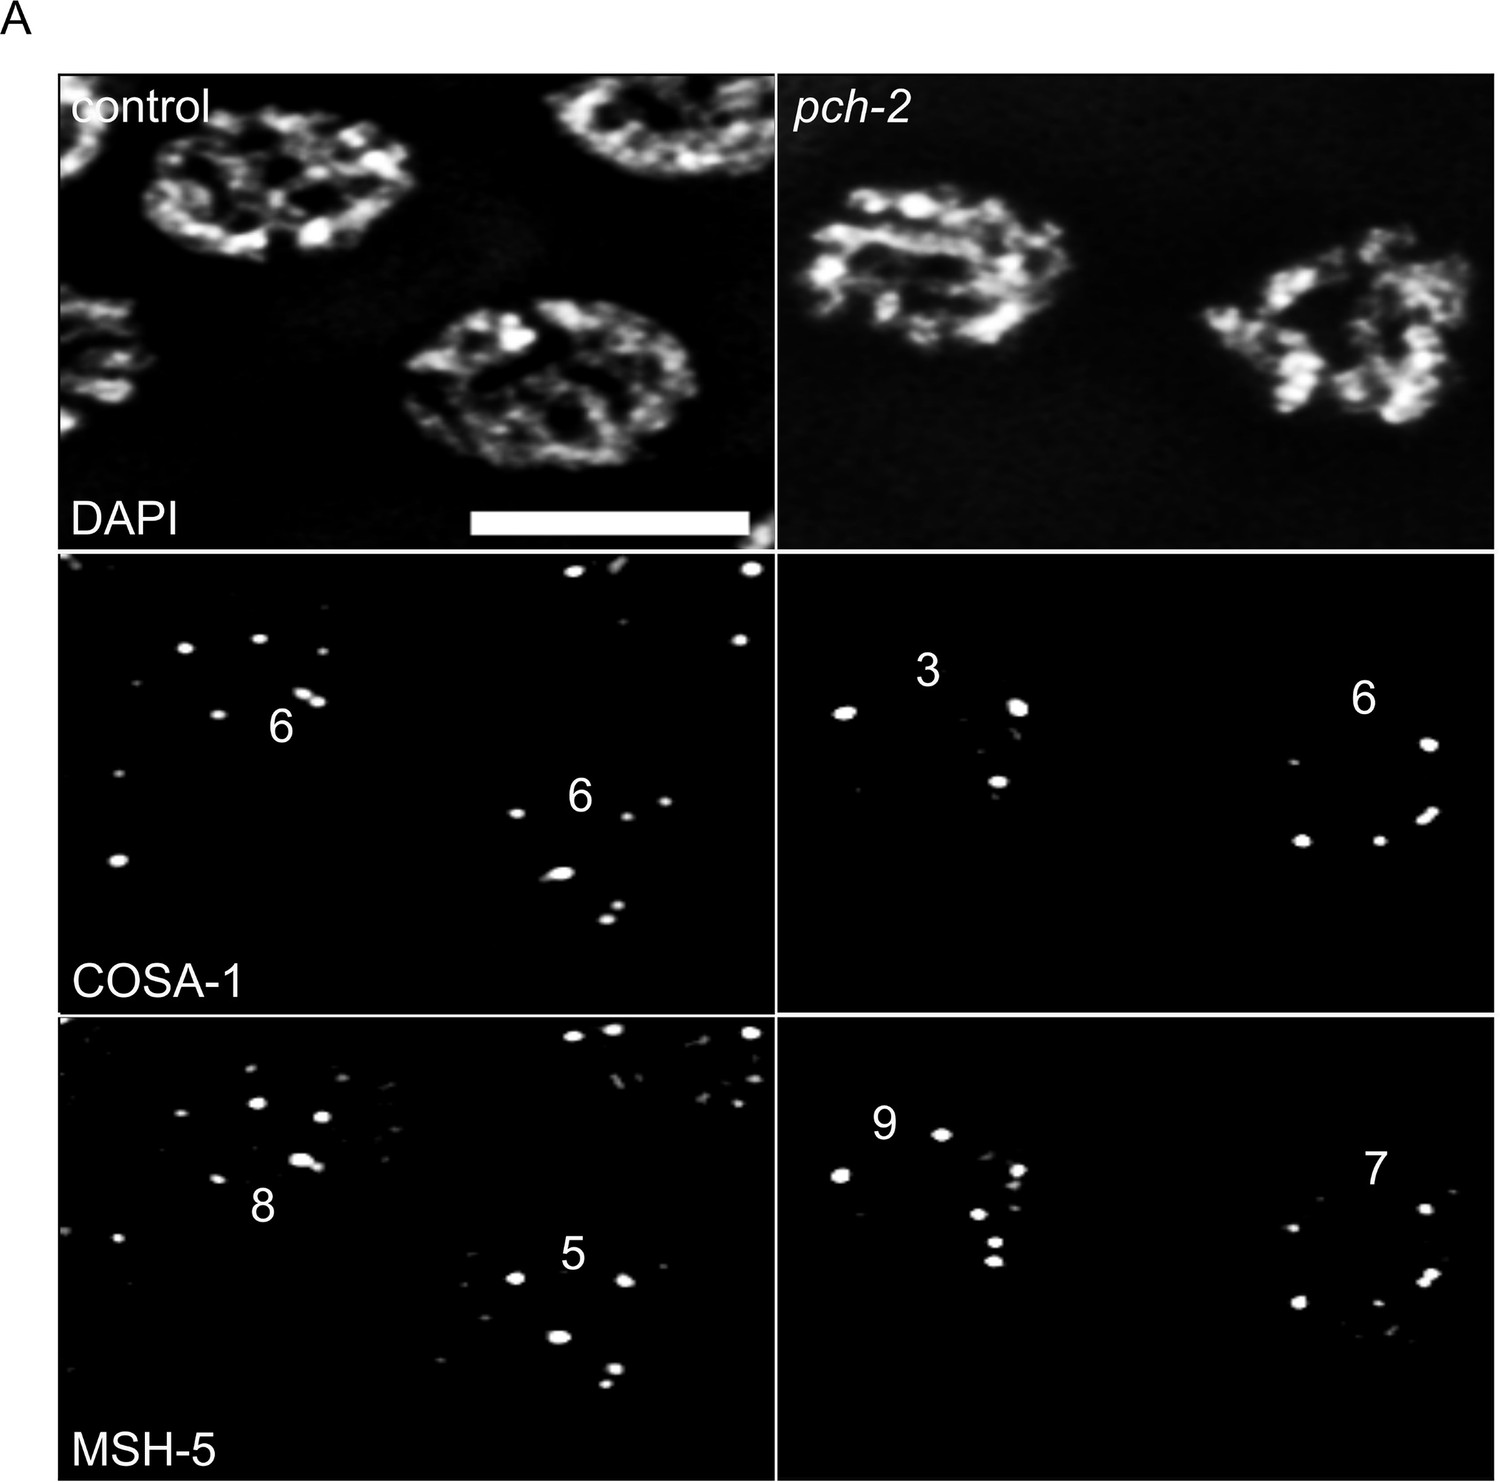
pch-2 meiotic nuclei with elevated numbers of GFP::MSH-5 foci show defects in crossover assurance.
(A) Gray scale images of control and pch-2 mutant nuclei stained for DAPI, GFP::MSH-5 and OLLAS::COSA-1. Scale bar in image is 4 um.
Figure 5
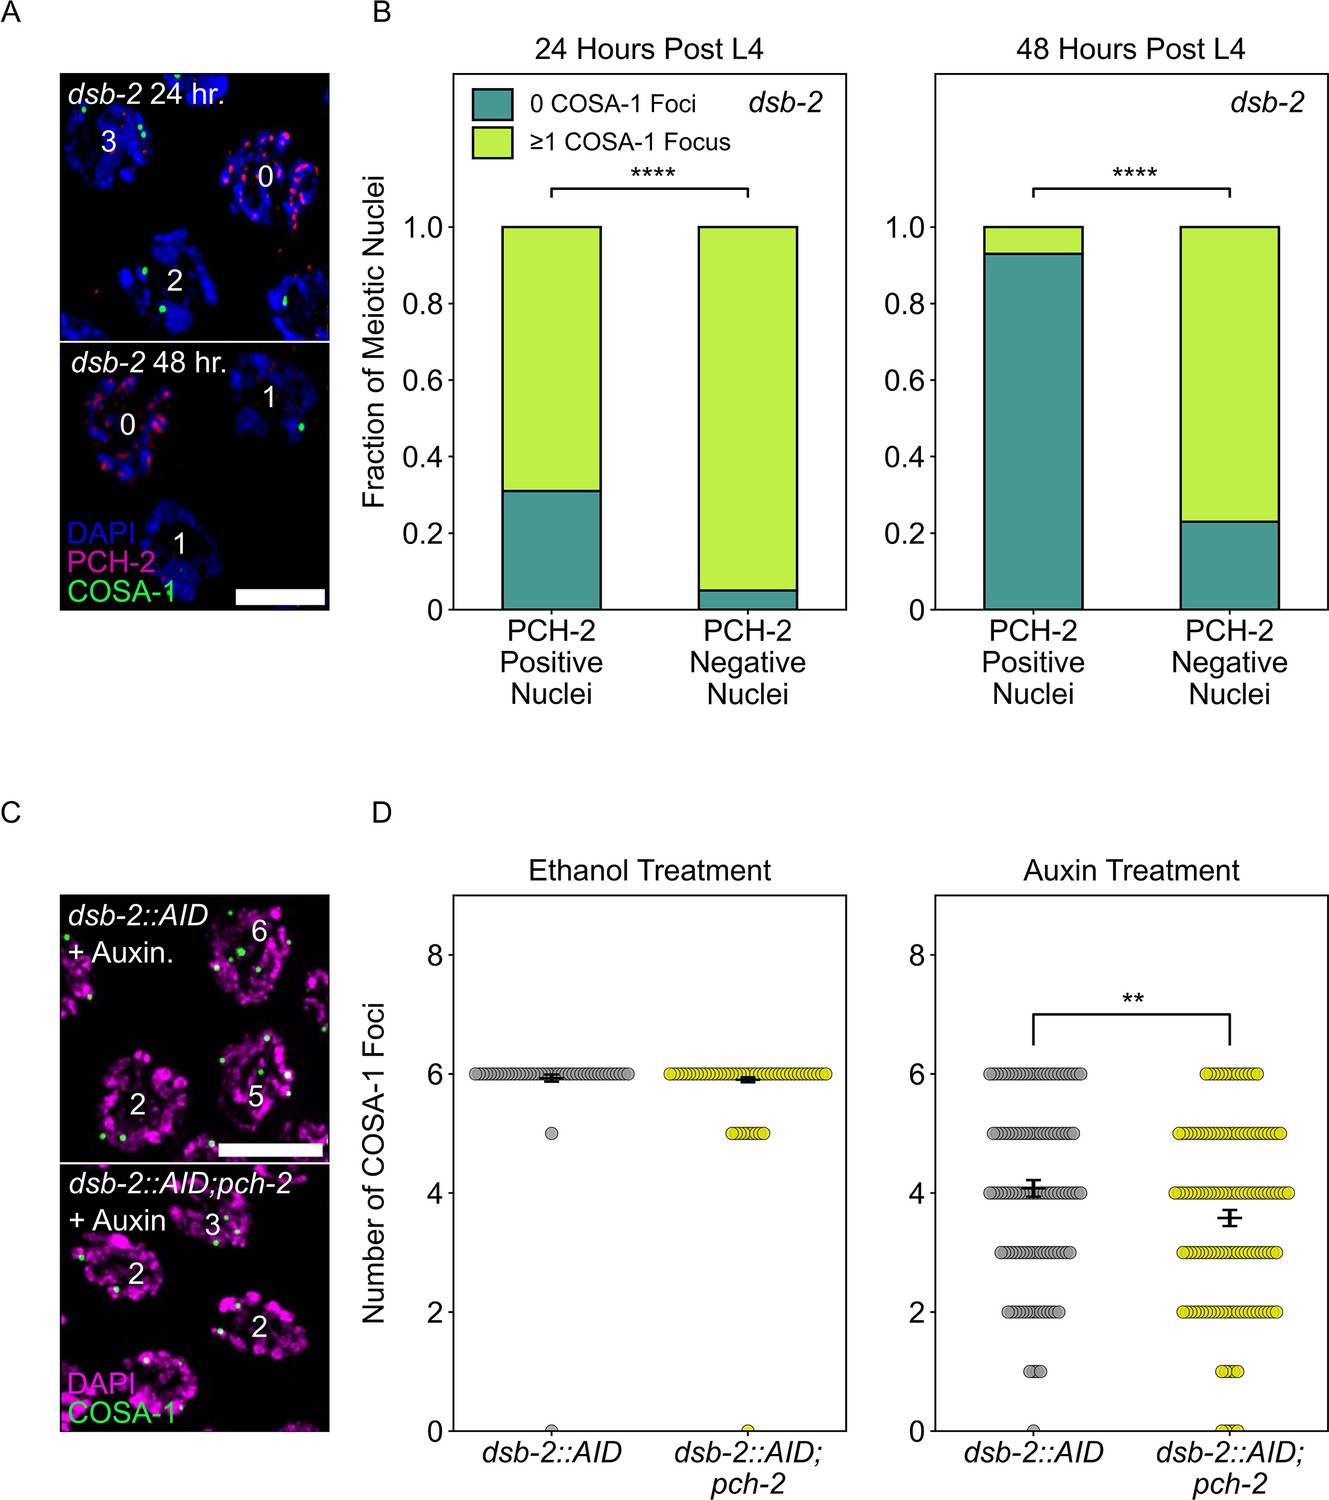
PCH-2 is removed when crossovers are designated.
(A) Representative images of meiotic nuclei in dsb-2 animals 24 hours post L4 and 48 hours post L4 stained for DAPI (magenta), PCH-2 (red), and GFP::COSA-1 (green). Scale bar is 4 um. (B) Stacked histograms showing percentage of PCH-2 positive (n = 43 at 24 hours, n = 42 at 48 hours) and negative (n = 194 at 24 hours, n = 130 at 48 hours) nuclei with (lime) and without (dark green) GFP::COSA-1 foci in dsb-2 mutants at 24 hours post L4 and 48 hours post L4. (C) Representative images of meiotic nuclei in dsb-2::AID and dsb-2::AID;pch-2 mutants treated with auxin and stained for DAPI (magenta) and GFP::COSA-1 (green). Scale bar is 5 um. (D) Swarm plot showing the number of GFP::COSA-1 foci in dsb-2::AID (gray) and dsb-2::AID;pch-2 (lemon) mutants when treated with ethanol or auxin. N values are as follows: dsb-2::AID (101 nuclei) and dsb-2::AID;pch-2 (154 nuclei) on ethanol, dsb-2::AID (136 nuclei) and dsb-2::AID;pch-2 (131 nuclei) on auxin. Error bars represent the SEM. **p<0.01, ****p<0.0001.
-
Figure 5—source data 1
Numerical data depicted in Figure 5.
- https://cdn.elifesciences.org/articles/102409/elife-102409-fig5-data1-v1.xlsx
Figure 6 with 1 supplement
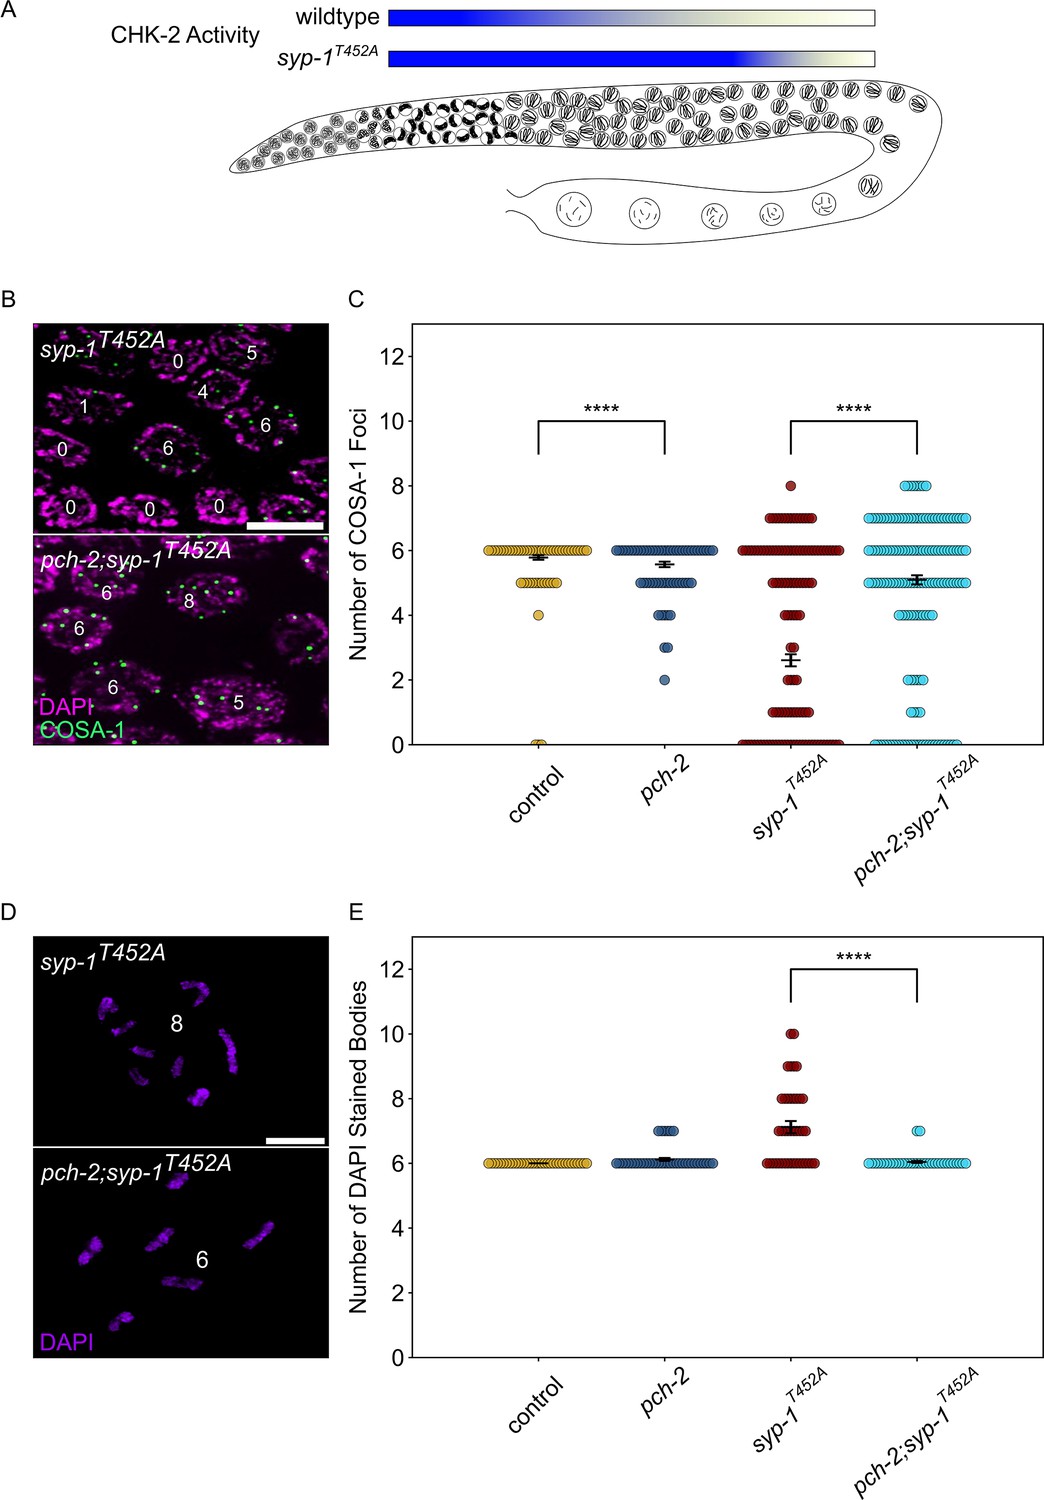
PCH-2 and high CHK-2 activity control the fate of early double-strand breaks.
(A) Illustration of CHK-2 activity in wildtype and syp-1T452A germlines. (B) Representative images of meiotic nuclei late pachytene in syp-1T452A and pch-2;syp-1T452A mutants stained for DAPI (magenta) and GFP::COSA-1 (green). Scale bar is 5 um. (C) Swarm plot showing number of GFP::COSA-1 foci in control animals (blue), pch-2 (yellow), syp-1T452A (maroon), and pch-2;syp-1T452A (light blue) mutants. Error bars represent SEM. (D) Oocytes from syp-1T452A and pch-2;syp-1T452A mutant worms stained for DAPI (magenta). Scale bar is 4 um. (D) Swarm plot showing number of DAPI-stained bodies in control animals (blue, n = 154), pch-2 (yellow, n = 89), syp-1T452A (maroon, n = 247), and pch-2;syp-1T452A (light blue, n = 242) mutants. Error bars represent SEM. ****p<0.0001.
-
Figure 6—source data 1
Numerical data depicted in Figure 6, Figure 6—figure supplement 1.
- https://cdn.elifesciences.org/articles/102409/elife-102409-fig6-data1-v1.xlsx
Figure 6—figure supplement 1
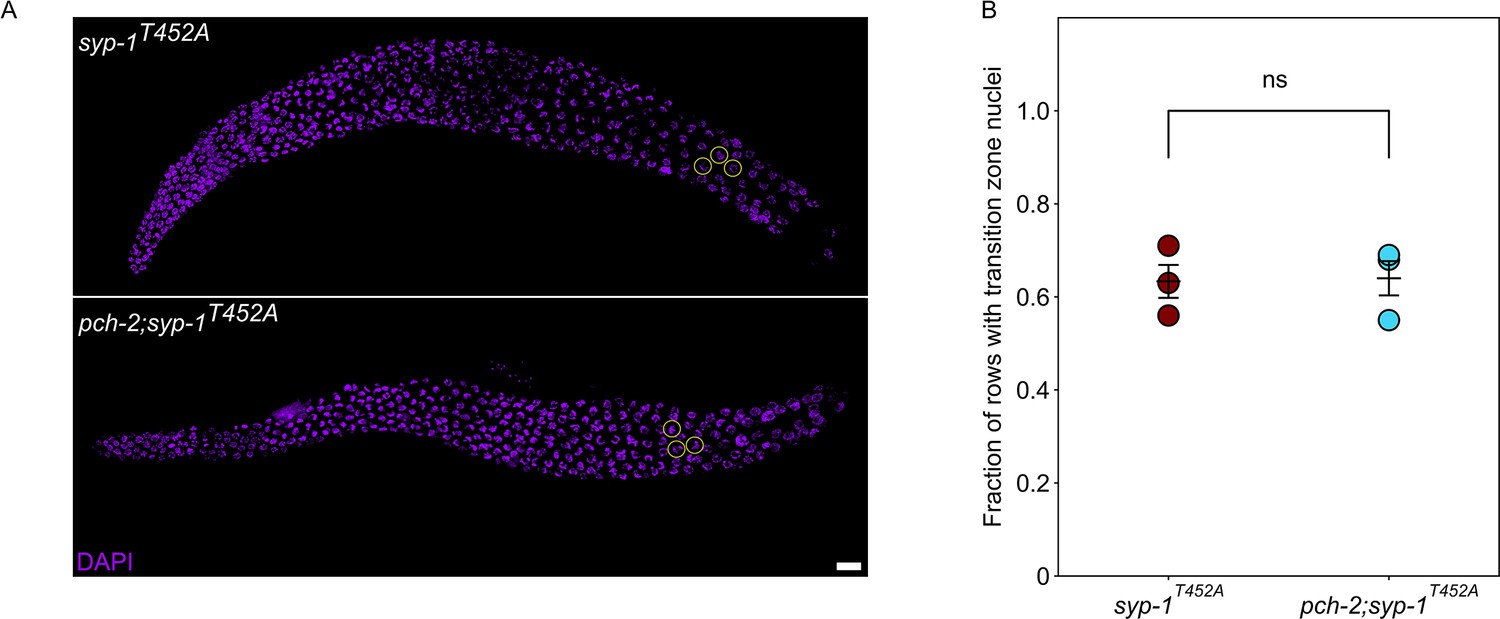
syp-1T452A and pch-2;syp-1T452A mutants display a similar defect in meiotic progression.
(A) Representative images of syp-1T452A and pch-2;syp-1T452A mutant germlines. Encircled nuclei indicate transition zone nuclei. Scale bar indicates 10 um. (B) Quantification of fraction of rows of transition zone nuclei in three germlines in syp-1T452A (maroon) and pch-2;syp-1T452A (light blue) mutants.
Figure 7
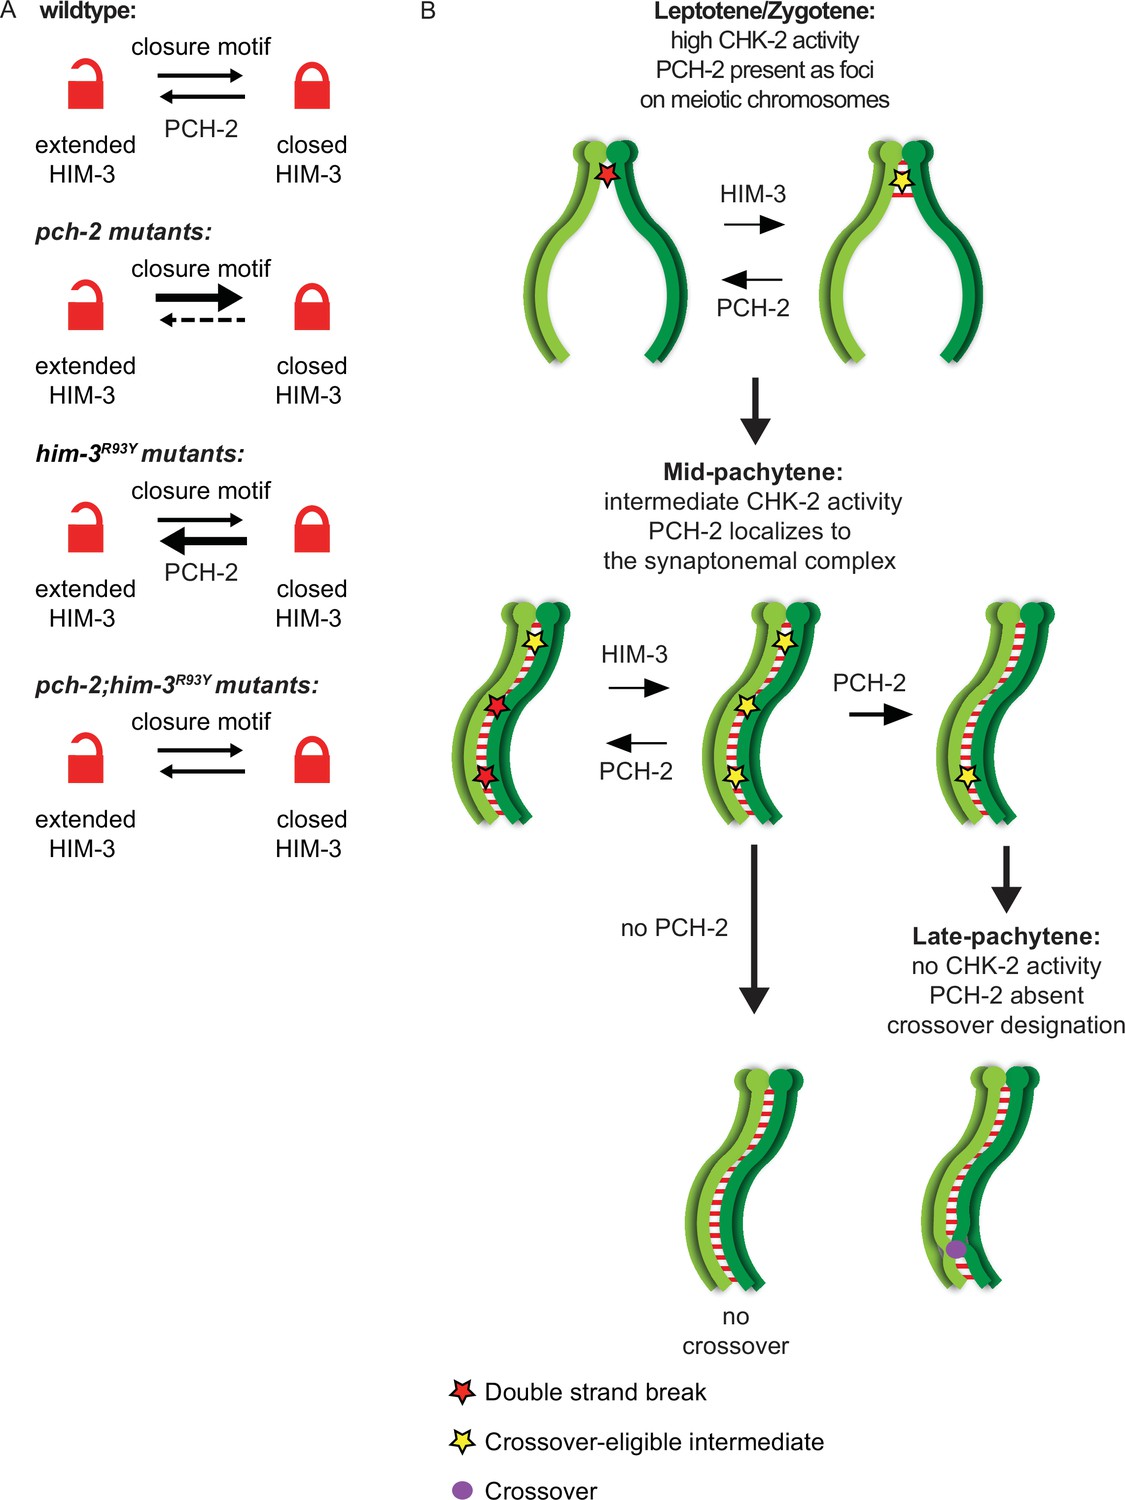
PCH-2 remodels HIM-3 to disassemble crossover-eligible intermediates, controlling crossover distribution and number.
(A) Model for how pch-2 and him-3R93Y mutations genetically interact to affect the progression of meiotic recombination. HIM-3 adopts the closed conformation upon binding an interacting protein with a closure motif and its conversion to the extended conformation is facilitated by PCH-2’s remodeling of its HORMA domain. (B) Model for how PCH-2 and HIM-3 progressively implement meiotic recombination during different stages of meiotic prophase.
Additional files
-
Supplementary file 1
Single-nucleotide polymorphisms (SNPs) used for recombination assay.
SNPs, primers, enzymes used for restriction digests, and expected fragment sizes used for the recombination assay.
- https://cdn.elifesciences.org/articles/102409/elife-102409-supp1-v1.docx
-
MDAR checklist
- https://cdn.elifesciences.org/articles/102409/elife-102409-mdarchecklist1-v1.docx
Download links
A two-part list of links to download the article, or parts of the article, in various formats.
Downloads (link to download the article as PDF)
Open citations (links to open the citations from this article in various online reference manager services)
Cite this article (links to download the citations from this article in formats compatible with various reference manager tools)
The conserved ATPase PCH-2 controls the number and distribution of crossovers by antagonizing their formation in Caenorhabditis elegans
eLife 13:RP102409.
https://doi.org/10.7554/eLife.102409.3


