Evaluating the transcriptional regulators of arterial gene expression via a catalogue of characterized arterial enhancers
- Institute of Developmental and Regenerative Medicine, Department of Physiology, Anatomy and Genetics, United Kingdom
- University Medical Centre Groningen, Netherlands
- Ludwig Institute for Cancer Research Ltd, Nuffield Department of Medicine, University of Oxford, United Kingdom
Figures
Figure 1 with 4 supplements
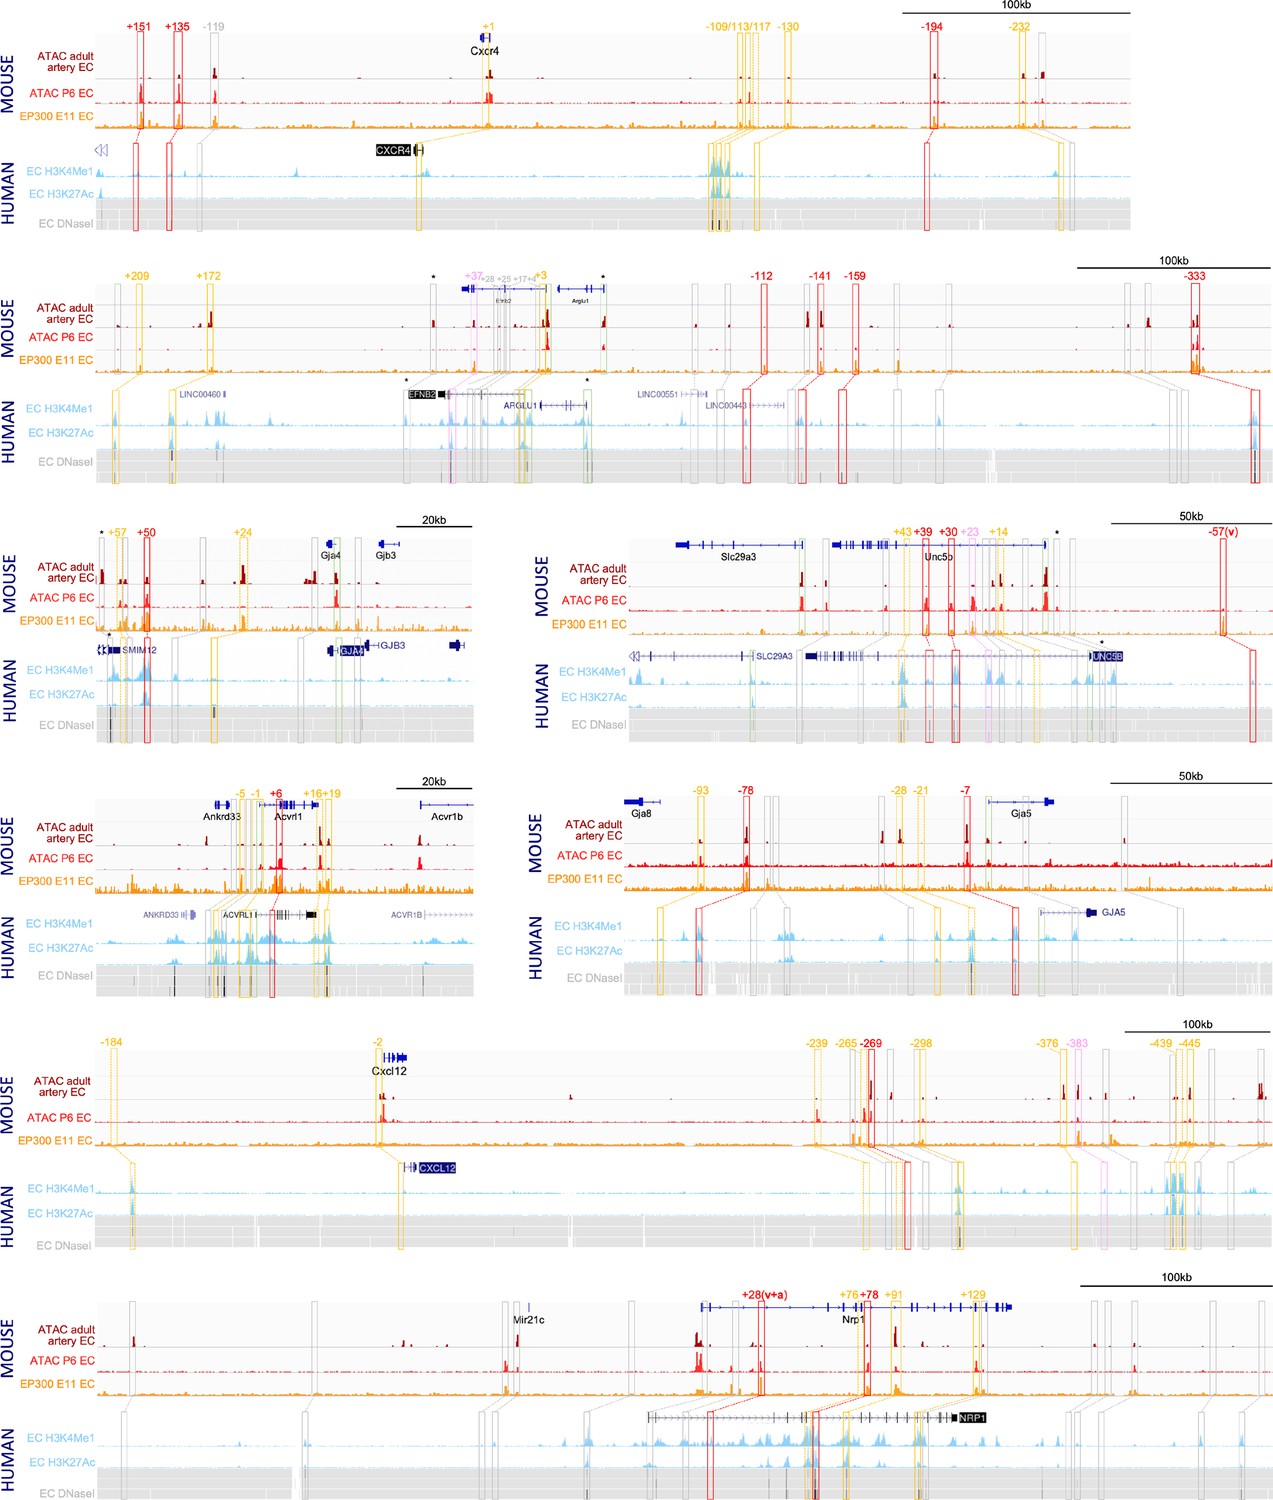
Analysis of enhancer marks around eight arterial-expressed genes identifies putative arterial enhancers.
Enhancer marks from mouse tissue include: dark red ‘ATAC adult artery EC’ denotes open chromatin assessed by ATAC-seq in primary adult aortic endothelial cells (ECs) Engelbrecht et al., 2020; bright red ‘ATAC P6 EC’ denotes open chromatin assessed by ATAC-seq in postnatal day 6 retinal ECs Yanagida et al., 2020; orange ‘EP300 E11 EC’ denotes enriched EP300 binding in Tie2Cre+ve cells in embryonic day 11.5 embryos (Zhou et al., 2017). Enhancer marks from human cells include: light blue peaks denotes enriched H3K27Ac and H3K4Me1 in human umbilical vein ECs (HUVECs) (UCSC Genome Browser; Rosenbloom et al., 2013); grey heat map denotes open chromatin regions assessed by DNAseI hypersensitivity in HUVECs (upper line) and dermal-derived neonatal and adult blood microvascular ECs (HMVEC-dBl-neo/ad, middle and bottom line) (UCSC Genome Browser). Red, pink, and orange solid boxes indicate regions fitting putative enhancers criteria and selected for analysis (red/pink/orange indicates strong/weak/silent EC activity in transgenic models, see Table 2 and Figures 2 and 3). Numbers represent approximate distance from TSS. Orange dashed boxes indicates regions below the putative enhancer threshold but included in transgenic assays as controls, grey boxes indicate regions below the putative enhancer threshold and not tested. * indicates that enhancer marks were not specific for ECs but rather found in many cell types.
Figure 1—figure supplement 1
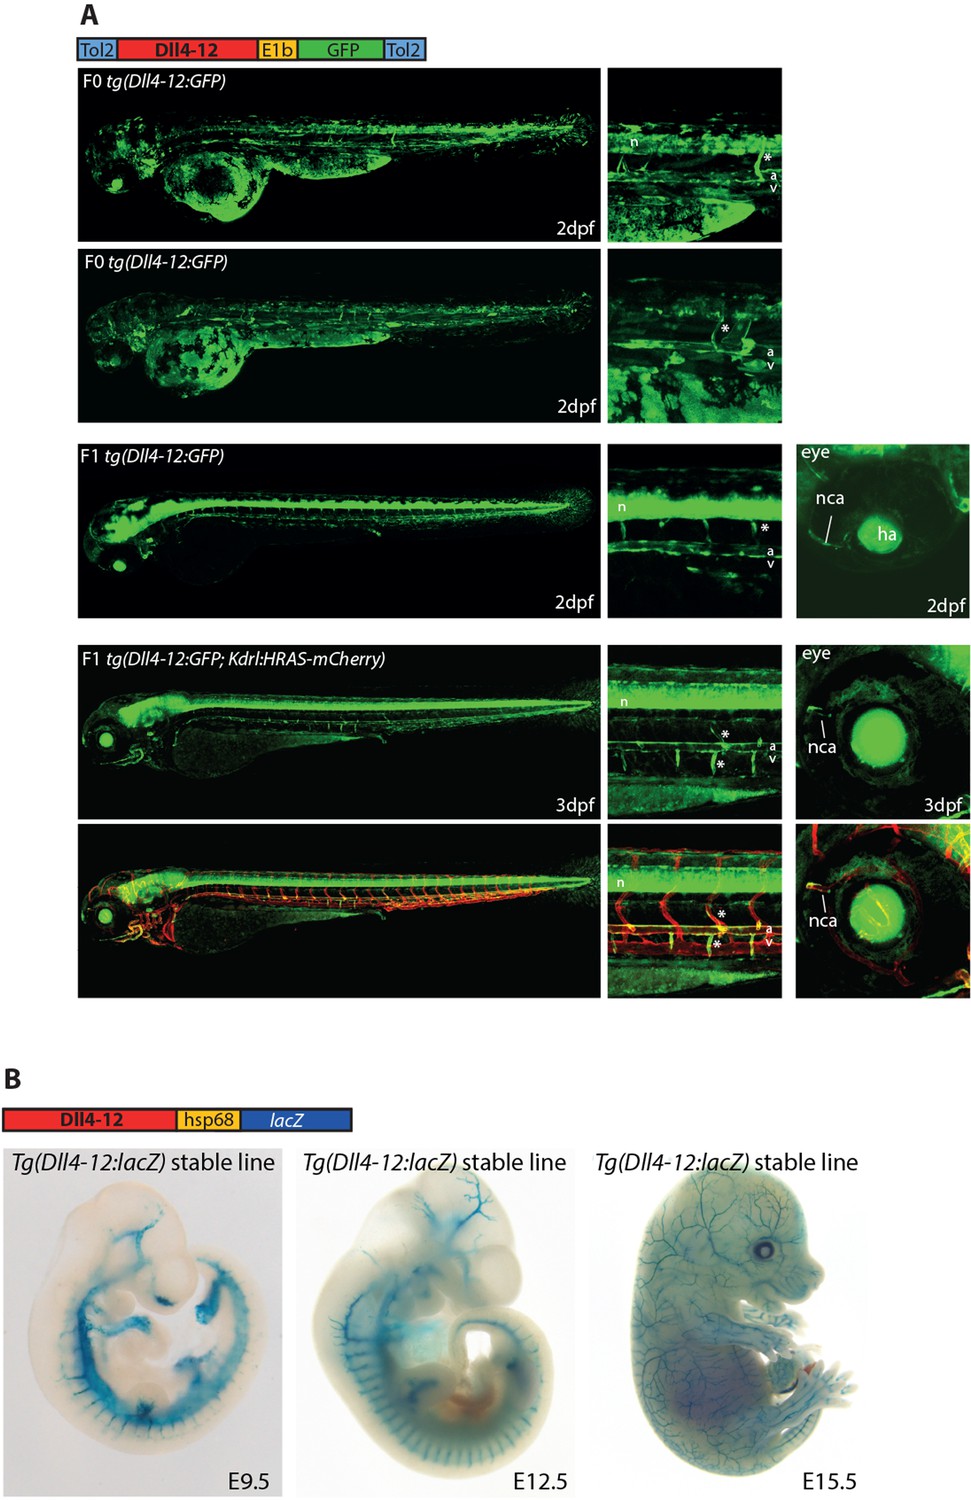
The mouse Dll4-12 enhancer directs arterial expression of reporter genes in the vasculature of transgenic zebrafish (A) and mice (B).
This enhancer was first reported in Sacilotto et al., 2013 but not tested in zebrafish. (A) The Dll4-12:GFP transgene directs arterial endothelial cell expression in mosaic F0 (upper) and stable F1 (middle) transgenic zebrafish at 2 days post fertilization (dpf), arterial specificity is confirmed at 3 dpf by crossing with tg(kdrl:HRAS-mCherry) (lower two panels). Grey dashed box specifies region of zoom, a indicates dorsal aorta, v indicates cardinal vein, * indicates intersegmental vessels, and n indicates neural tube expression. (B) The mouse Dll4-12:LacZ transgene directs arterial expression in a stable transgenic line. Representative whole-mount embryos from the Dll4-12:lacZ transgenic line show reporter gene expression (X-gal staining, blue) in the vasculature from embryonic day 9.5 (E9.5) to E15.5.
Figure 1—figure supplement 2
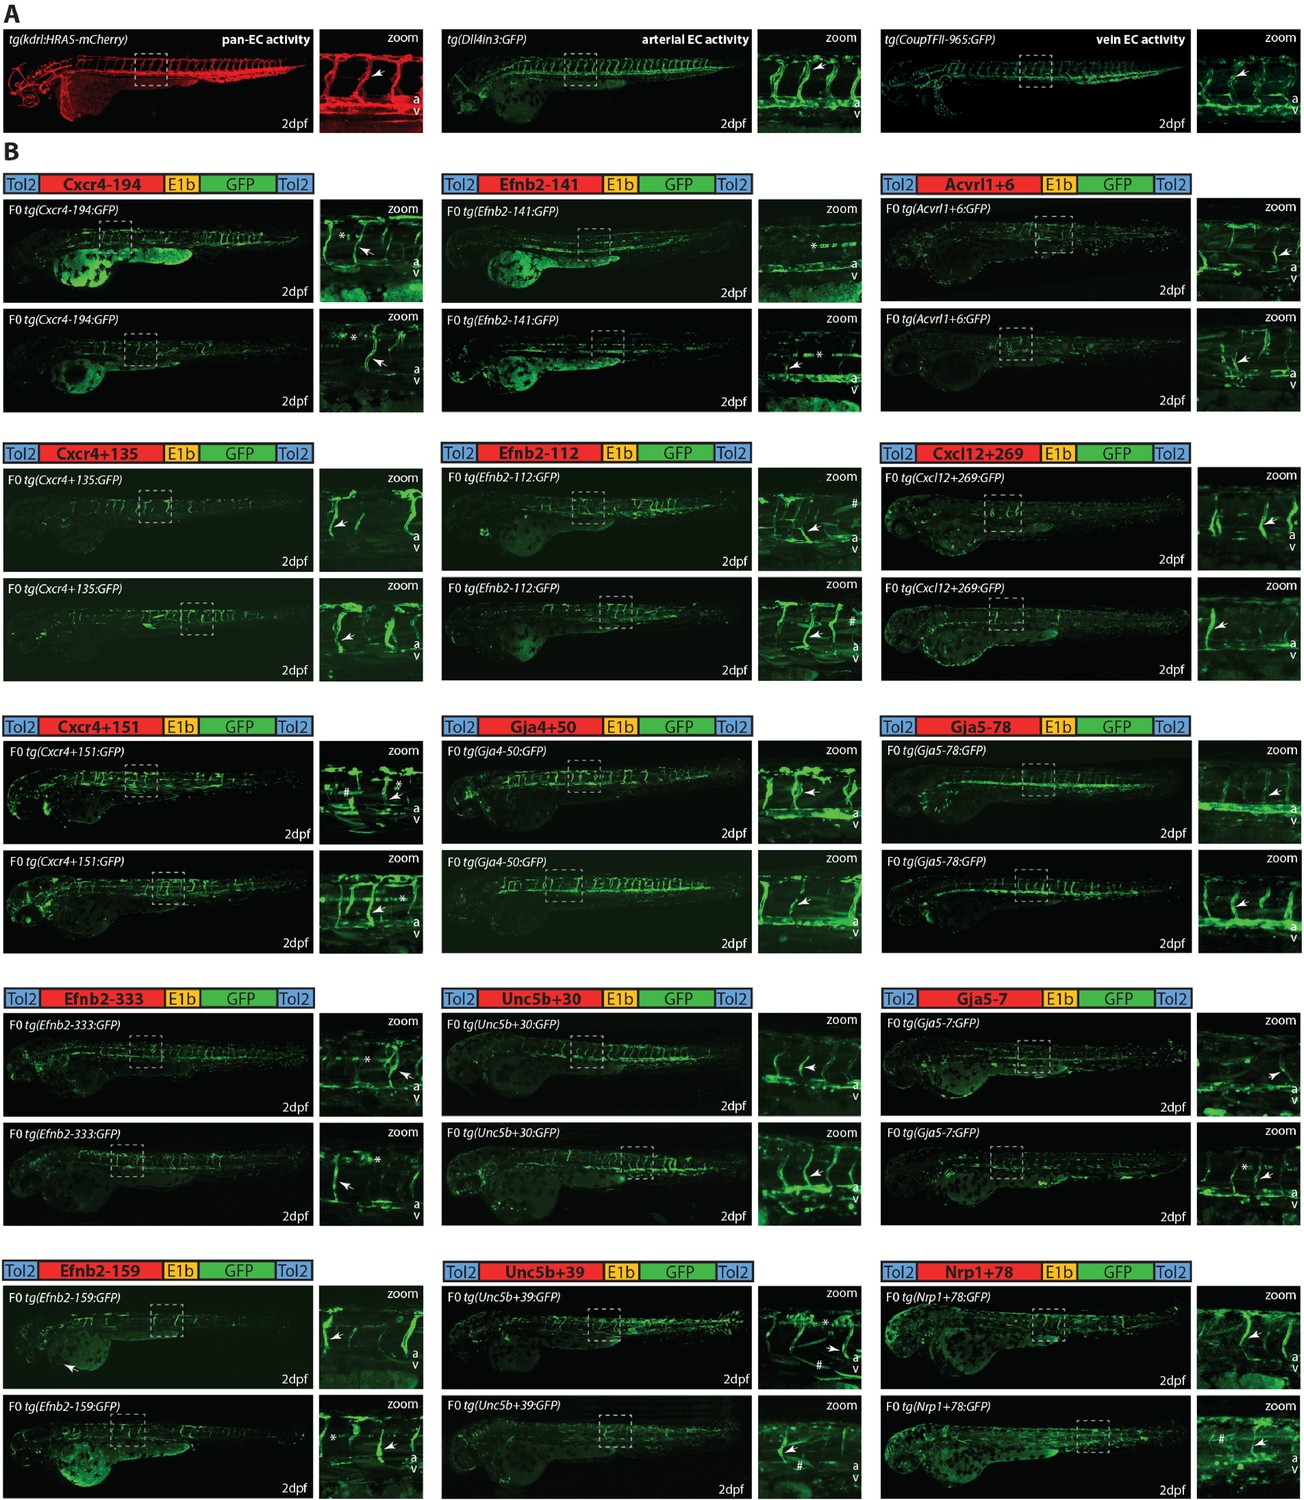
Analysis of putative enhancers in F0 mosaic Tol2 transgenic zebrafish identifies 15 enhancers able to drive robust GFP activity in arterial endothelial cells (ECs) (other weaker/ non-arterial enhancers are detailed in Figure 1—figure supplement 3).
(A) Example of the expression of known pan-EC (kdrl1:HRAS-mCherry) (Chi et al., 2008), arterial (Dll4in3:GFP; Sacilotto et al., 2013), and vein (CoupTFII-965:GFP; Neal et al., 2019) enhancers in 2 dpf zebrafish. (B) Two representative F0 transgenic zebrafish expressing each of the 15 new strong arterial enhancers alongside a schematic of each transgene. Grey dashed box indicates region of zoom, a indicates dorsal aorta, v indicates cardinal vein, white arrow indicates intersegmental vessels, * indicates expression in neural tube, and # indicates expression in muscle fibres.
Figure 1—figure supplement 3
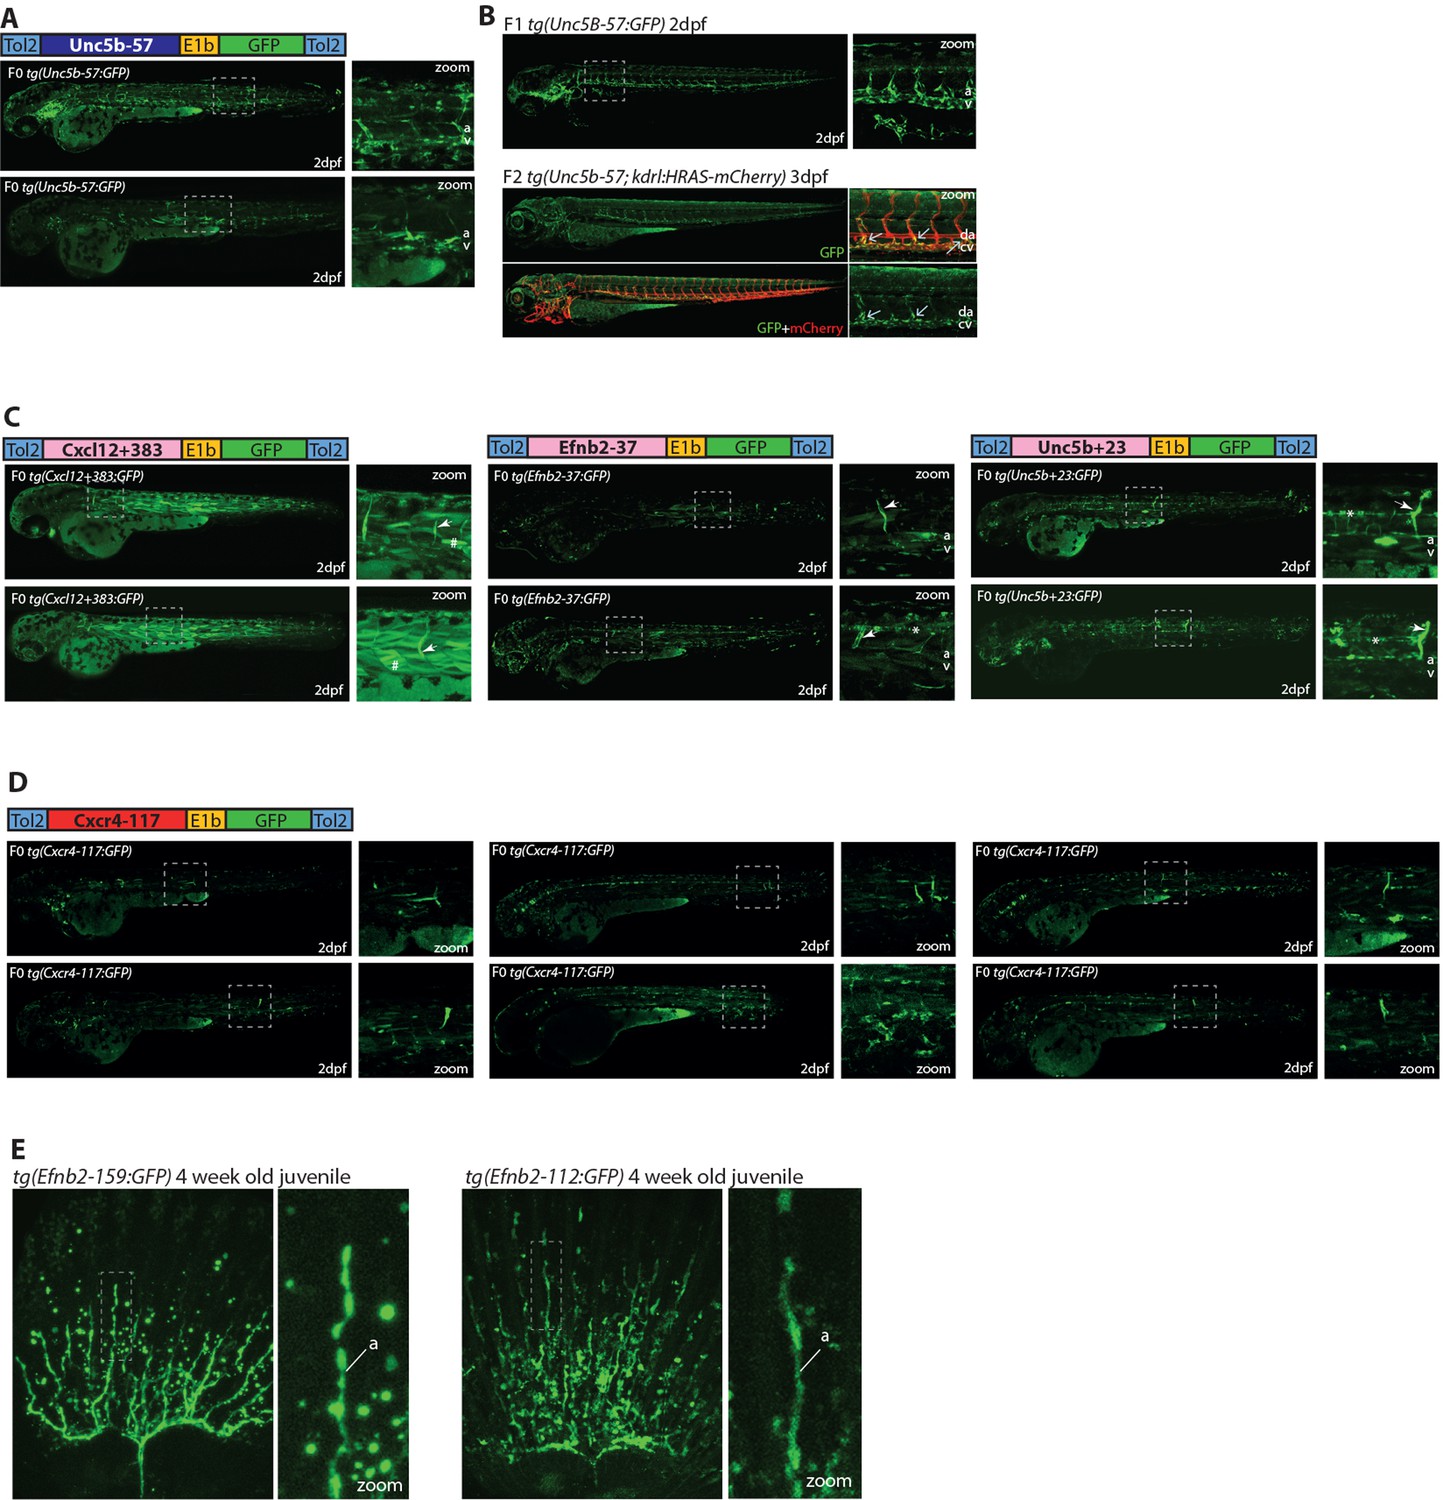
Additional images of transgenic fish expressing the Unc5b-57:GFP, Cxcl12+383:GFP, Efnb2-37, Unc5b+23, Cxcl12+117, Efnb2-112 and Efnb2-159 transgenes.
(A,, B) The Unc5b-57:GFP transgene is expressed in the vasculature when investigated in either F0 Tol2 transgenic zebrafish (A) or F1/2 stable transgenic zebrafish (B). Crossing with the kdrl:HRAS-mCherry transgene demonstrates that Unc5b-57:GFP expression is restricted to venous locations towards the anterior of the fish. (C) Expression pattern driven by the three ‘weak’ enhancers identified in our F0 mosaic Tol2 transgenic zebrafish screen. Grey dashed box indicates region of zoom, a indicates dorsal aorta, v indicates cardinal vein, white arrows indicate intersegmental vessels, * indicates expression in neural tube, and # indicates expression in muscle fibres. (D) The Cxcr4-117:GFP transgene directs very limited reporter gene expression in transgenic zebrafish. The six transgenic zebrafish shown exhibited the greatest level of GFP expression seen in all injected zebrafish. Grey dashed box indicates region of zoom. (E) Expression pattern of the Efnb2-159 and Efnb2-112 enhancer:GFP transgenes in 4-week-old juvenile zebrafish fins. Grey dashed box indicates regions of zoom, a fin artery, and v fin vein.
Figure 1—figure supplement 4
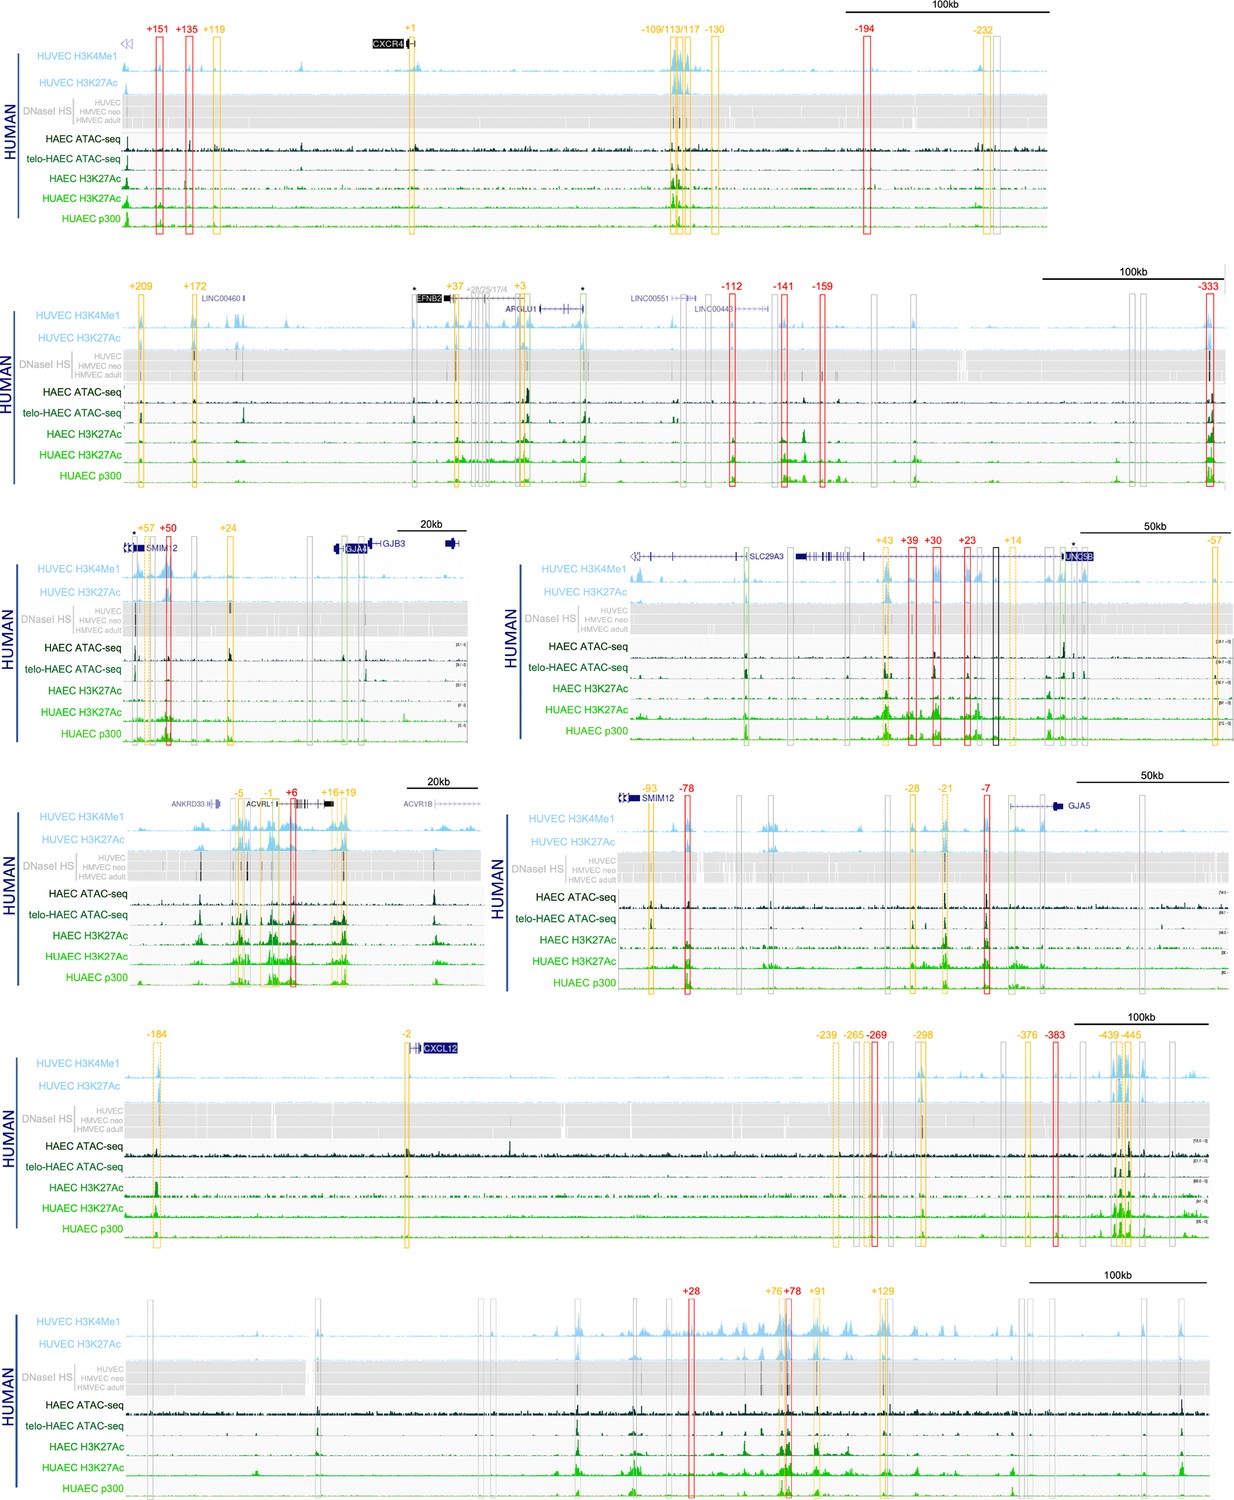
Enhancer marks in cultured human arterial endothelial cells (ECs) around the eight target arterial gene loci.
These are shown relative to the enhancer marks in human vein-origin and microvascular-origin ECs used to originally identify putative arterial enhancers in Figure 1. Red and orange boxes denote the regions identified as putative enhancers in original analysis, grey boxes denote regions below threshold, and numbers represent approximate distance from TSS in mouse sequence. * indicates that enhancer marks were not specific for ECs but rather found in many cell types. Enhancer marks in human vein-origin and microvascular-origin ECs used in original analysis: light blue peaks denote enriched H3K27Ac and H3K4Me1 in human umbilical vein ECs (HUVECs), data from the UCSC Genome Browser Hou et al., 2022; grey heat map denotes open chromatin regions assessed by DNAseI hypersensitivity in HUVECs (upper line) and dermal-derived neonatal and adult blood microvascular ECs (HMVEC-dBl-neo/ad, middle and bottom line) from the UCSC Genome Browser (Hou et al., 2022). Enhancer marks in human arterial-origin ECs are all shaded green, including very dark green ‘HAEC ATAC-seq’ denoting open chromatin assessed by ATAC-seq in human aortic ECs from Hogan et al., 2017; dark green ‘telo-HAEC ATAC-seq’ denoting open chromatin assessed by ATAC-seq in immortalized human aortic ECs from Schnitzler et al., 2024; green ‘HAEC H3K27Ac’ denoting enriched H3K27Ac enhancer marks in human aortic ECs from Hogan et al., 2017; bright green ‘HUAEC H3K27Ac’ denoting enriched H3K27Ac enhancer marks in human umbilical aortic ECs from Sissaoui et al., 2020; and lime green ‘HUAEC p300’ denoting enriched p300 binding peaks in human umbilical aortic ECs from Sissaoui et al., 2020.
Figure 2
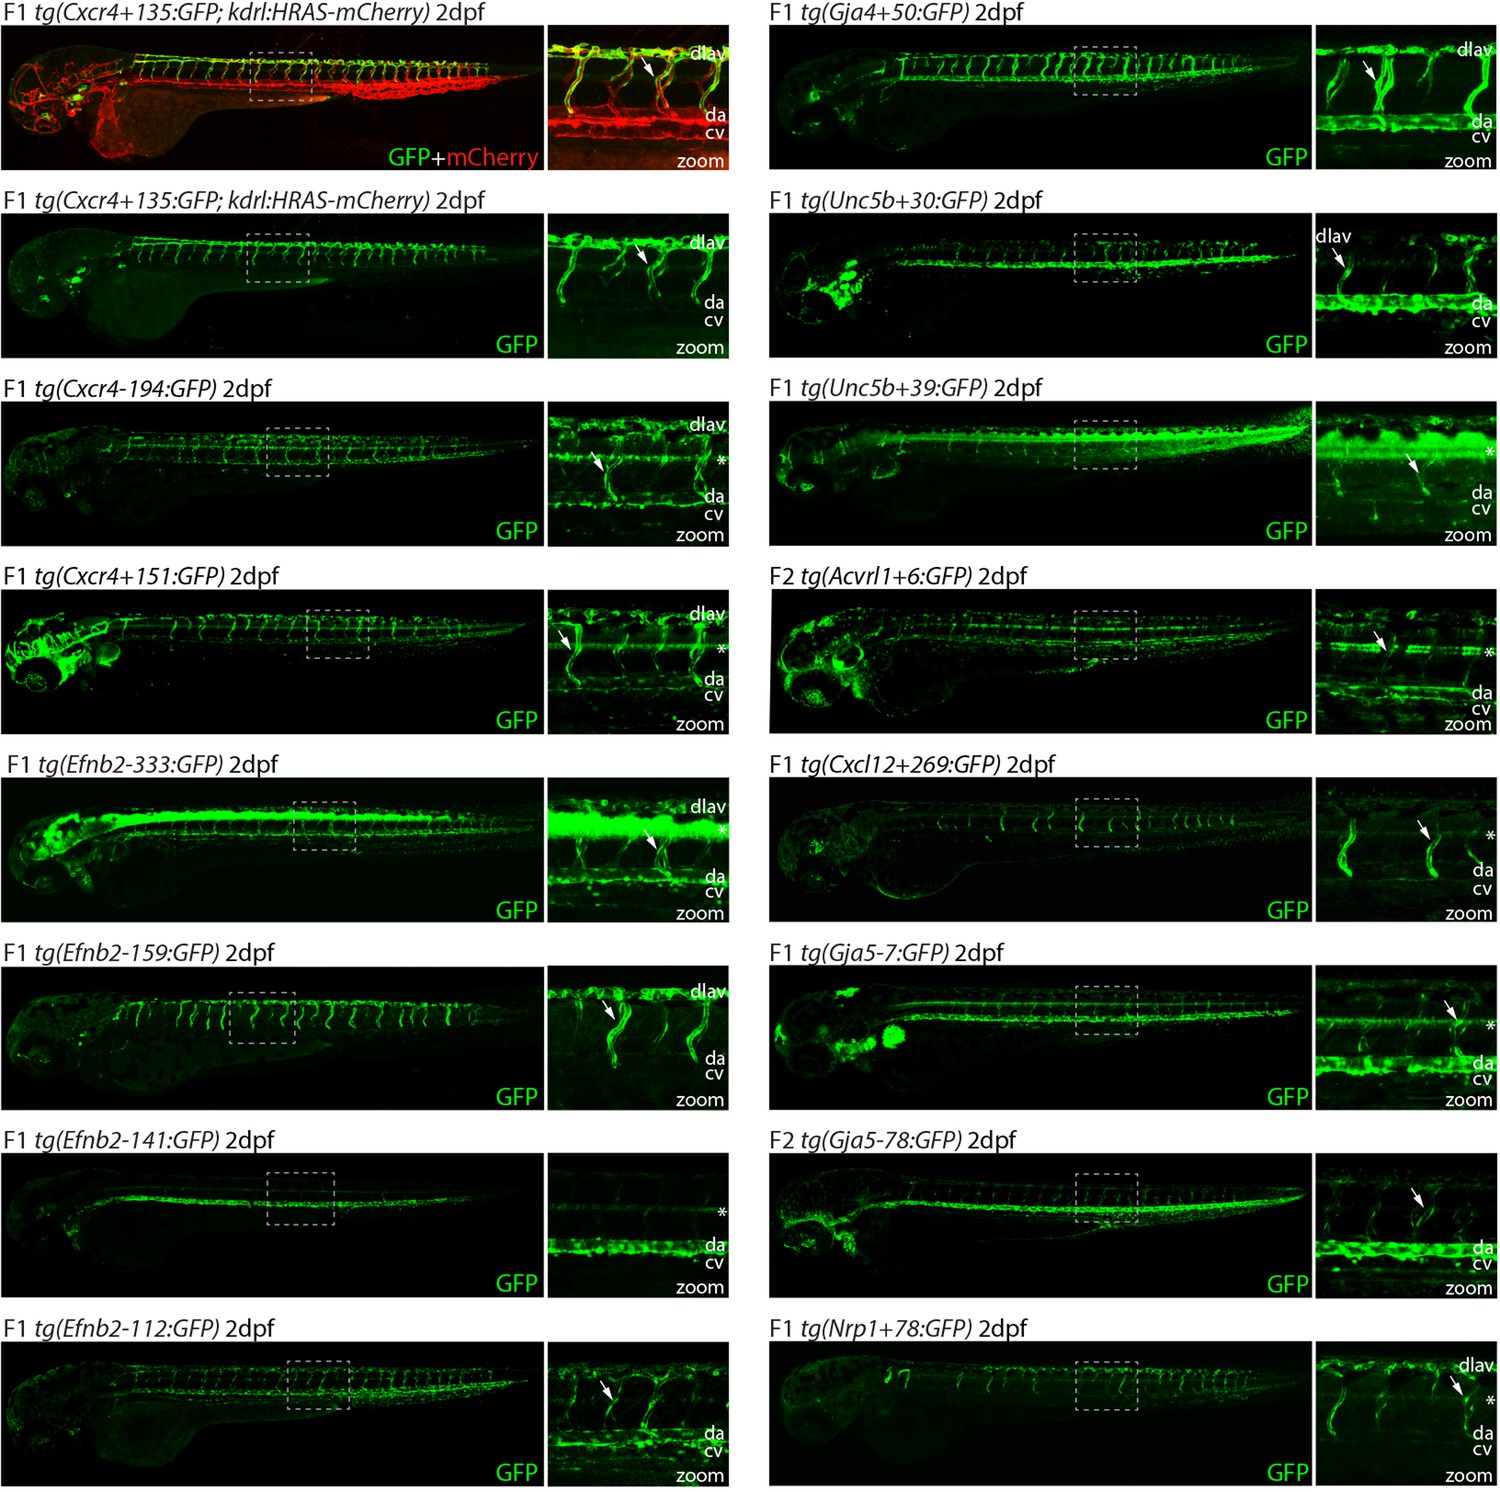
Analysis in 2 dpf transgenic zebrafish indicates arterial activity of fifteen novel enhancer:GFP transgenes.
Grey dashed box indicates region of zoom, da indicates dorsal aorta, cv indicates cardinal vein, dlav indicates dorsal longitudinal anastomotic vessel, white arrow indicates intersegmental vessels, and * indicates expression in neural tube. tg(Cxcr4-135:GFP) was crossed with tg(kdrl:HRAS-mCherry), which expresses mCherry in all blood vascular ECs and is shown here on the top line as a guide to vessel structure at this timepoint. F1/2 indicates generation of embryo.
Figure 3 with 1 supplement
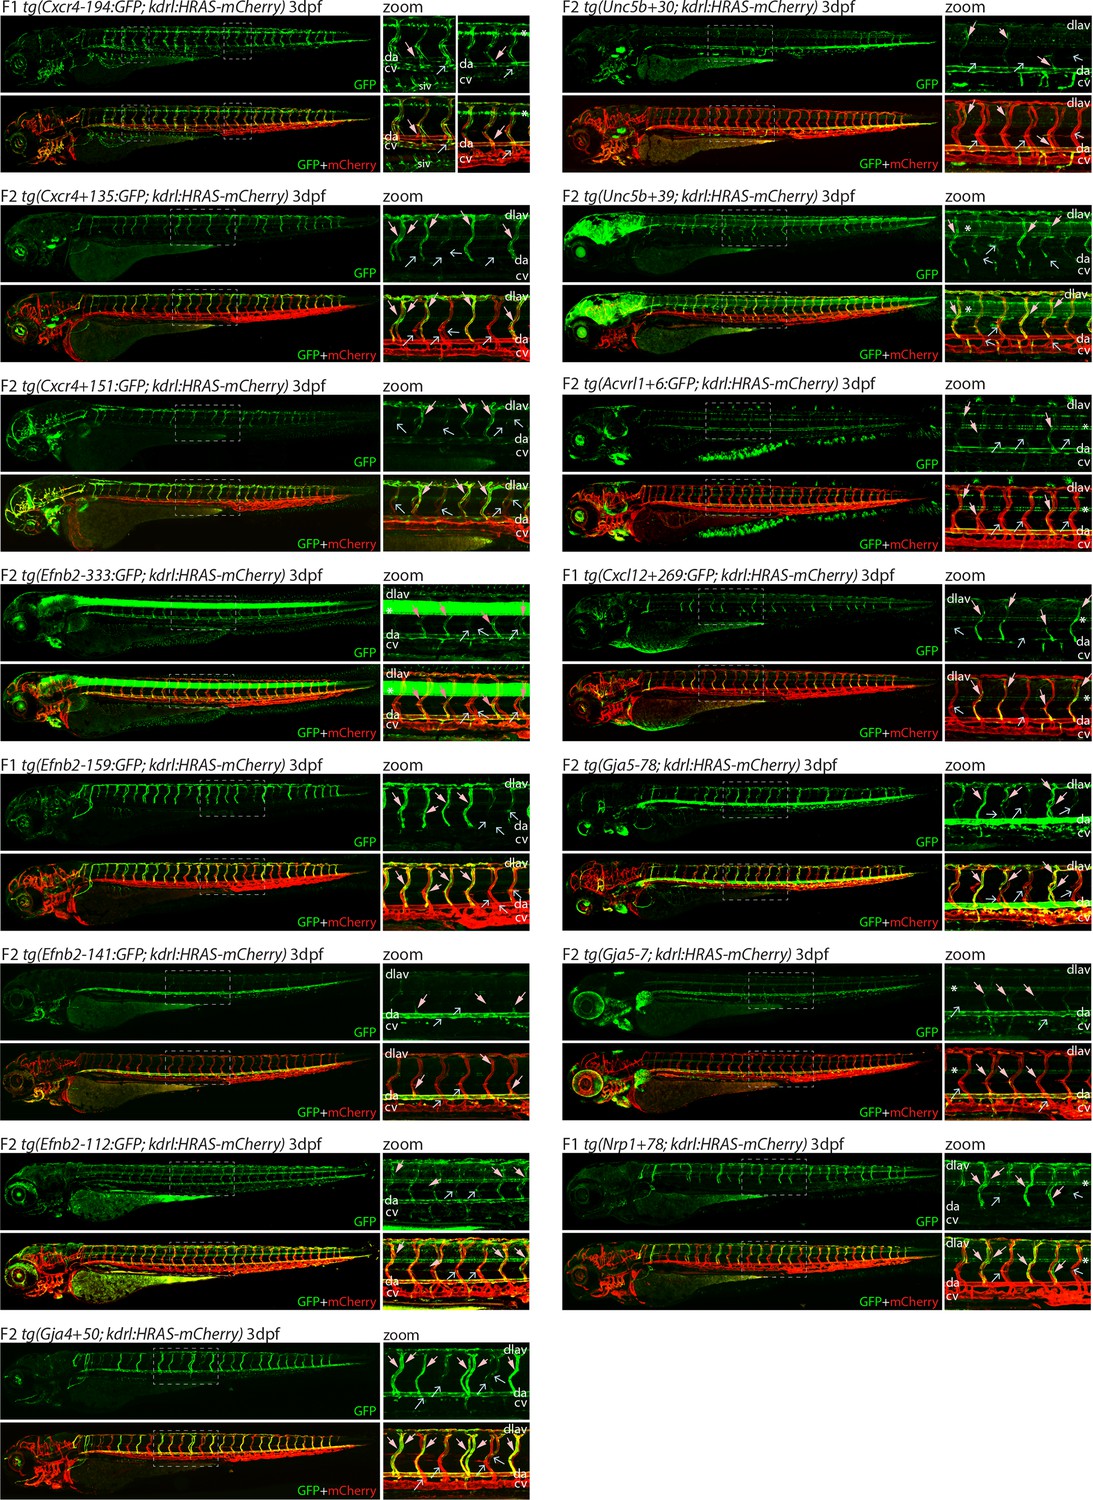
Analysis in 3 dpf transgenic zebrafish indicates specificity of arterial expression of each arterial enhancer.
Stable transgenic zebrafish expressing the 15 strong arterial enhancer:GFP transgenes crossed with tg(kdrl:HRAS-mCherry), which expresses mCherry in all blood vascular ECs. Grey dashed box indicates region of zoom, da indicates dorsal aorta, cv indicates cardinal vein, dlav indicates dorsal longitudinal anastomotic vessel, pale pink filled arrows indicates intersegmental arteries, pale blue open arrows indicate intersegmental veins, * indicates expression in neural tube, and F1/2 indicates generation of embryo.
Figure 3—figure supplement 1

Analysis of enhancer activity in the 2–3 dpf ocular vasculature.
(A) Schematic diagram of the primary ocular vasculature adapted from Hashiura et al., 2017. (B) Expression pattern of 15 novel arterial enhancers in the ocular vasculature at 2 dpf and 3 dpf. At 3 dpf, kdrl:HRAS-mCherry transgene was crossed with arterial zebrafish lines to enable visualization of all ECs.
Figure 4
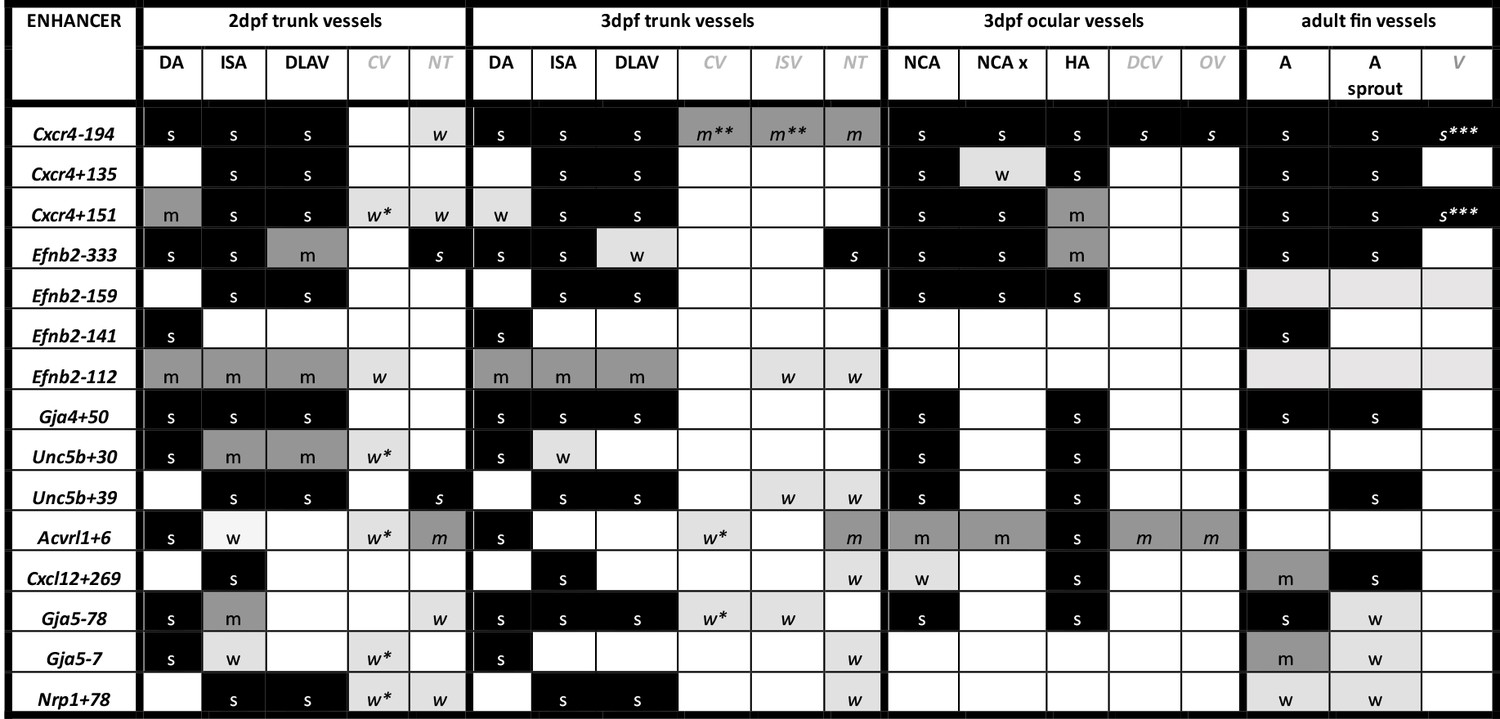
Summary of enhancer:GFP expression pattern in the vasculature of stable transgenic zebrafish lines.
DA dorsal aorta, ISA intersegmental arteries, DLAV dorsal longitudinal anastomotic vessel, CV cardinal vein, ISV intersegmental veins, NT neural tube, NCA nasal ciliary artery, NCAx extends beyond NCA in direction of blood flow, HA hyaloid artery, DCV dorsal ciliary vein, OV optic vein. A fin artery, V fin vein. Letters “s” “m” and “w” equate to strong medium or weak relative expression, *restricted to distal regions, ** restricted to anterior regions, *** restricted to subset of ECs.
-
Figure 4—source data 1
Summary of enhancer:GFP expression pattern in the vasculature of stable transgenic zebrafish lines.
DA dorsal aorta, ISA intersegmental arteries, DLAV dorsal longitudinal anastomotic vessel, CV cardinal vein, ISV intersegmental veins, NT neural tube, NCA nasal ciliary artery, NCAx extends beyond NCA in direction of blood flow, HA hyaloid artery, DCV dorsal ciliary vein, OV optic vein. A fin artery, V fin vein. Letters s m w equate to strong medium or weak relative expression, * restricted to distal regions, ** restricted to anterior regions, *** restricted to subset of ECs.
- https://cdn.elifesciences.org/articles/102440/elife-102440-fig4-data1-v2.xlsx
Figure 5
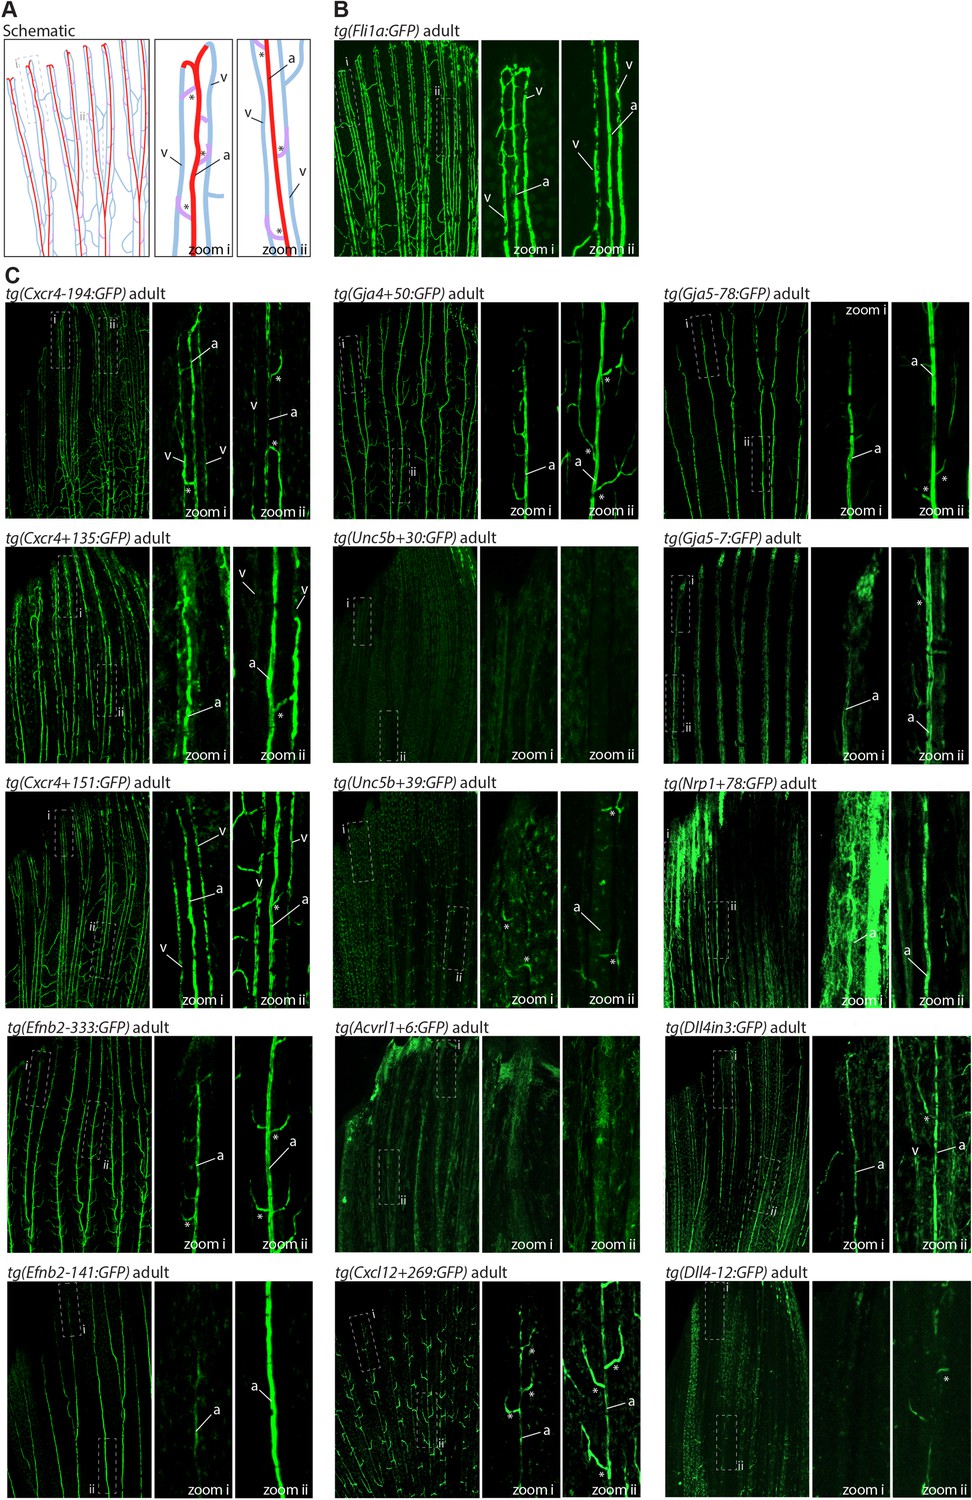
The majority of developmentally active arterial enhancers remain active in adult zebrafish fins.
(A) Schematic drawing of the zebrafish fin vasculature adapted from Xu et al., 2014. (B) Expression pattern of the common EC marker line Fli1a:GFP in an adult fin. (C) Expression pattern of 13 novel arterial enhancer:GFP transgenes in adult fins, alongside previously identified arterial enhancers Dll4in3 and Dll4-12. Grey dashed box indicates regions of zoom, a indicates fin artery, v indicates fin vein, * arterial sprout. See also Figure 1—figure supplement 4.
Figure 6 with 1 supplement
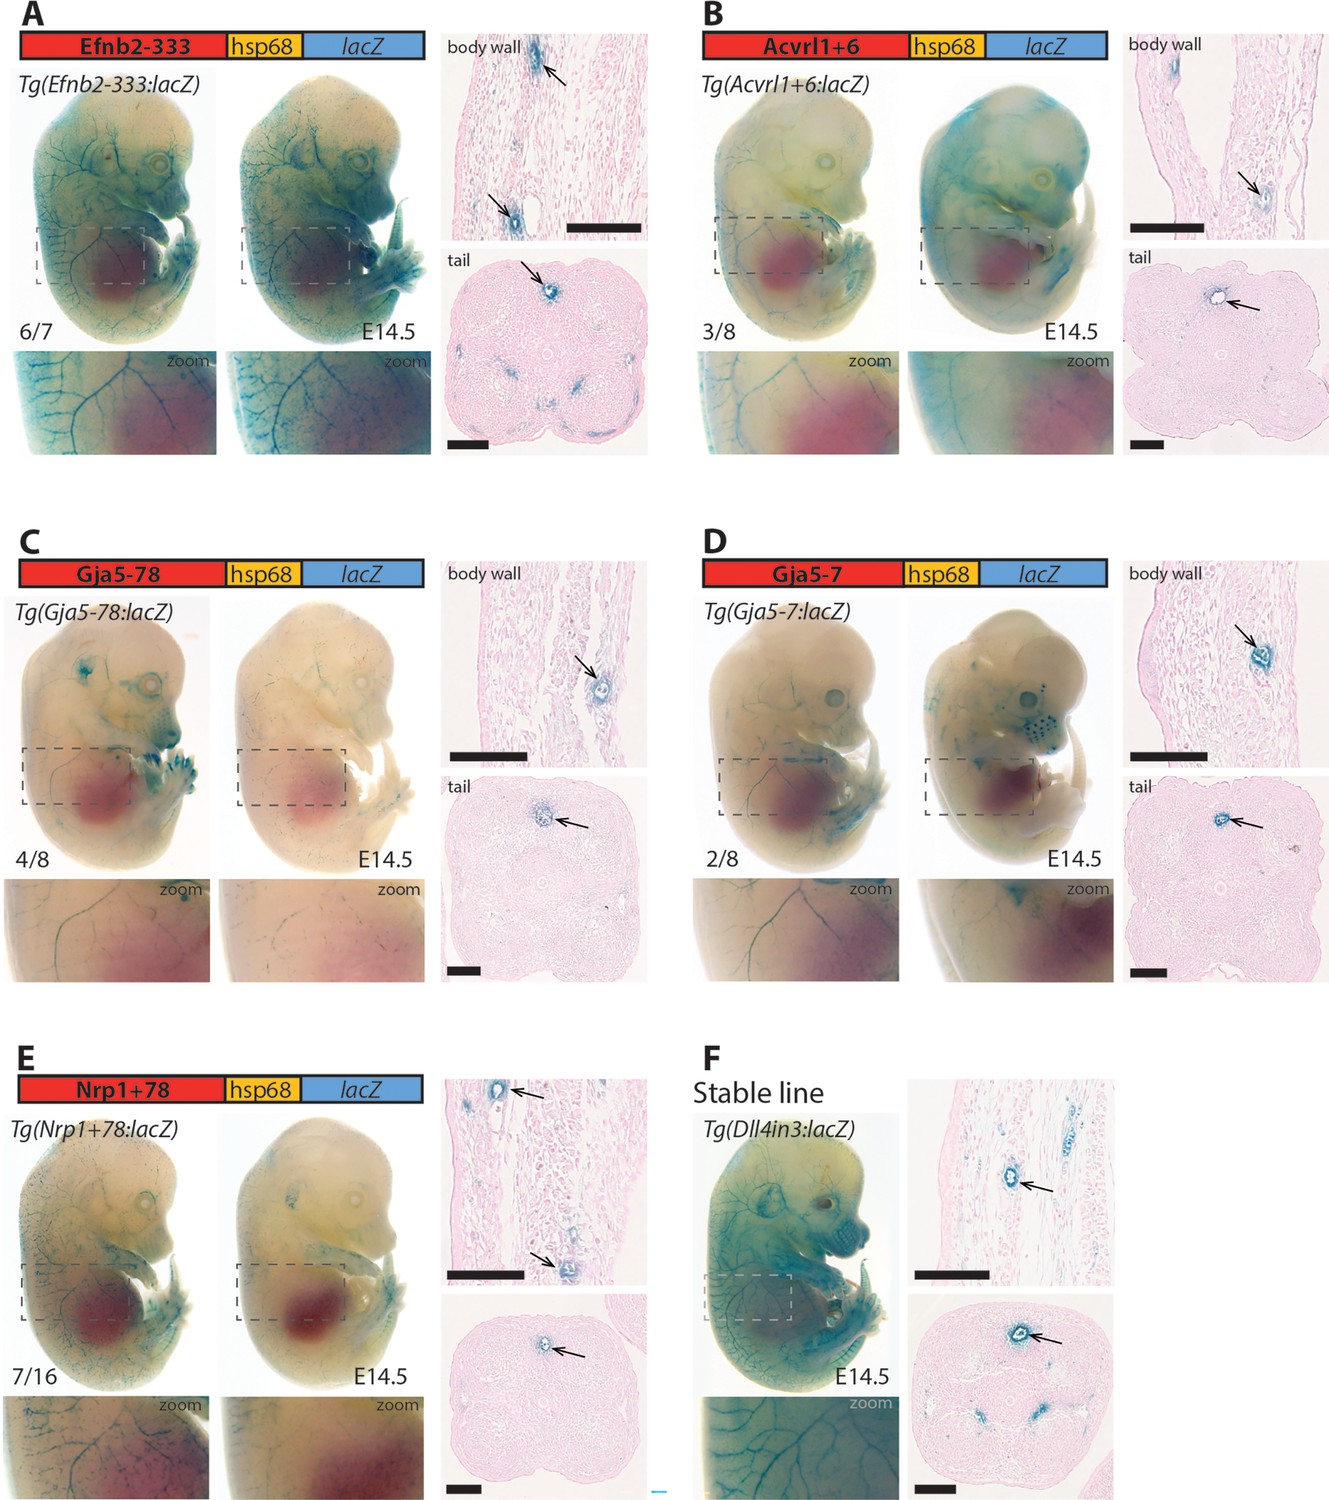
Five putative enhancers direct arterial expression in the vasculature of E14.5 transgenic mouse embryos.
(A–E) Two representative F0 embryos expressing each tested putative enhancer alongside a schematic of the transgene and two transverse sections through the embryo body wall and tail. Numbers in bottom left indicate embryos with arterial lacZ/total transgenic embryos. Grey dashed boxes indicate region in zoom, arrow indicates artery. (F) shows a representative E14.5 embryo from a stable transgenic line expressing the arterial Dll4in3:lacZ transgene alongside similar transverse sections through the embryo body wall and tail. Black line = 100 um.
Figure 6—figure supplement 1
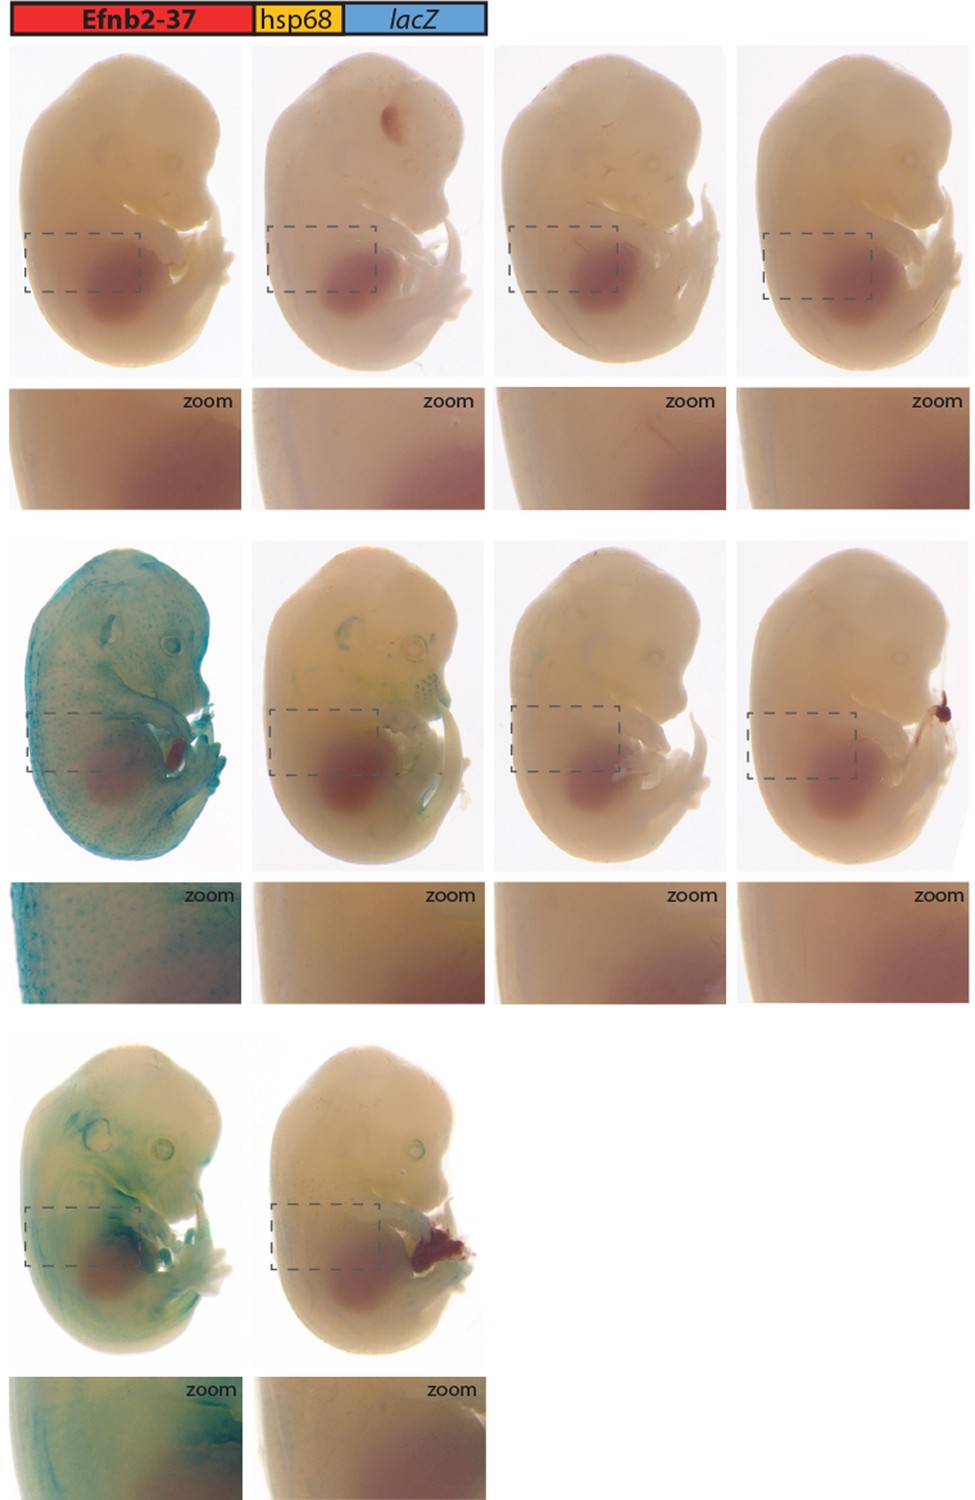
All transgenic embryos expressing the Efnb2-37:lacZ transgene at E14.5 Grey dashed boxes indicate region in zoom.
No expression is seen in vessels.
Figure 7 with 6 supplements

Schematics summarizing the transcription factor motifs found within each arterial (A), pan-EC (B), and venous (C) enhancer.
All enhancers shown in 3’–5’ orientation relative to the arterial gene TSS. Deep black-lined rectangle boxes indicate strongly conserved motifs for transcription factors (conserved at the same depth as the surrounding enhancer sequence), shallow grey-lined boxes/text indicate weakly conserved motifs (conserved between mouse and human enhancer sequence but not at the same depth as the surrounding sequence), and rounded boxes mark motifs in enhancers conserved only human-mouse. Bold transcription factor names indicate places where ChIP-seq (or similar analysis) confirms binding. See Figure 7—figure supplements 2–6 for annotated sequences. Arterial enhancers listed with * are previously published (as detailed in Payne et al., 2024), genome locations for each enhancer are provided in Table 2—source data 2. Distances between motifs are representative but not scaled.
Figure 7—figure supplement 1
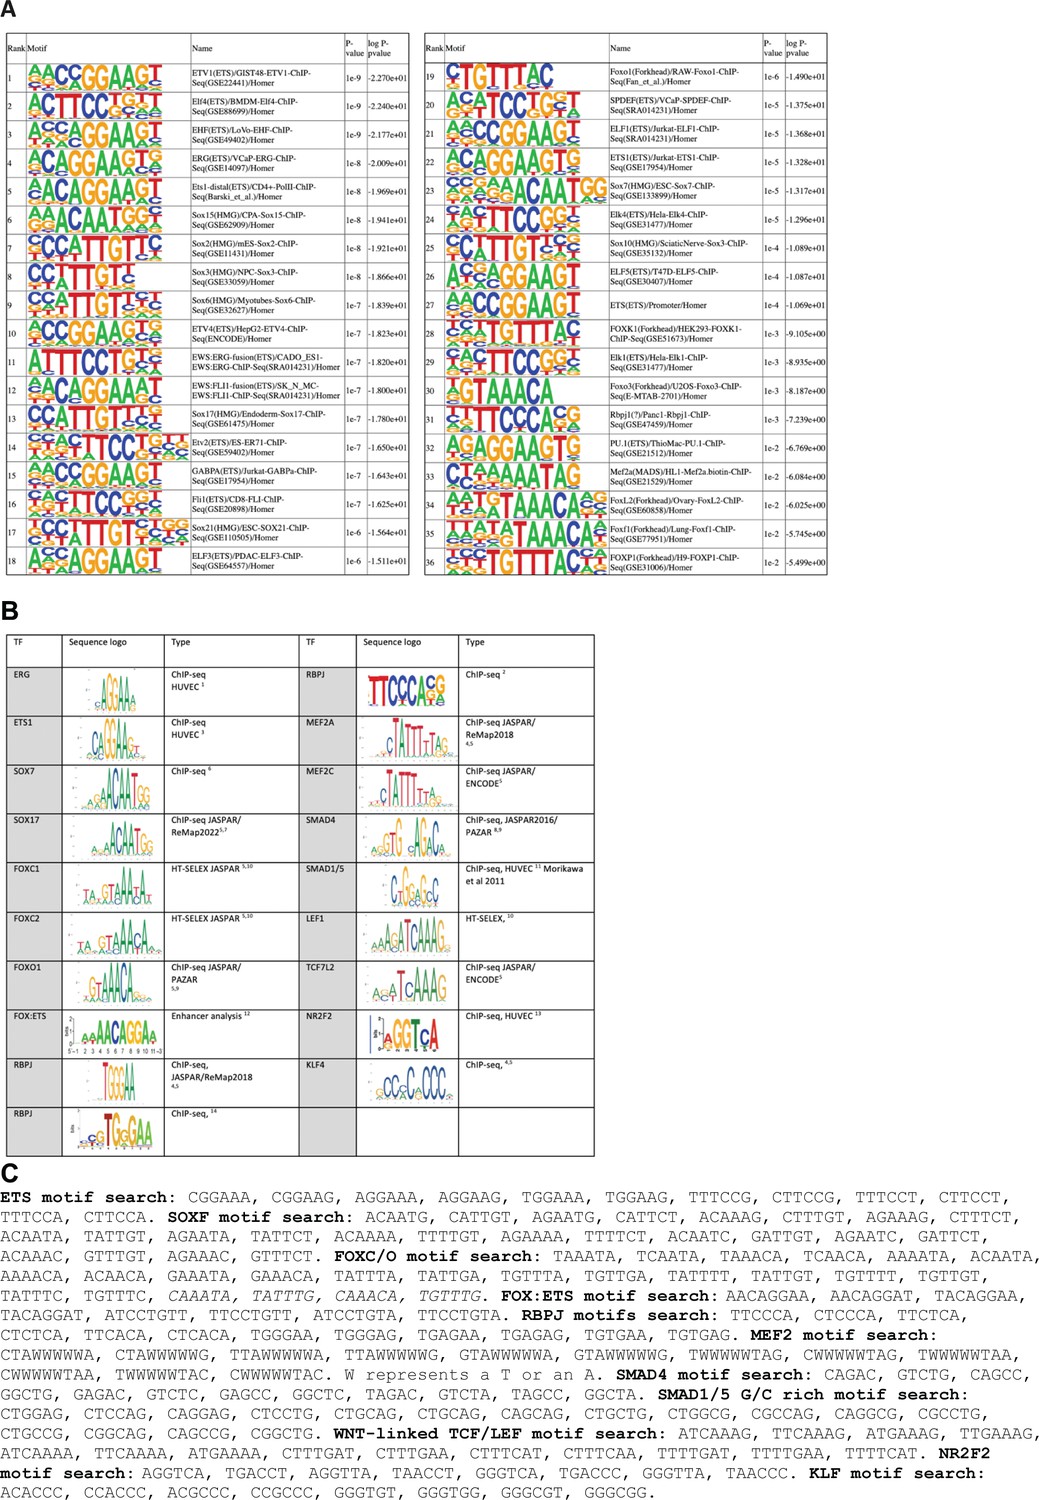
Transcription factor motifs associated with arterial enhancers.
(A) Homer known motif enrichment results on core enhancer sequences from all 23 arterial enhancers listed in Table 1. Exact sequences include in this analysis are listed in Figure 7—figure supplement 2, and the coordinates in mm10 recorded in Table 2—source data 2. (B) Table summarizing sequence logos used to guide motif analysis, alongside the source of each logo and EC type (where relevant). (C) Exact sequences assigned as motifs for each transcription factor.
Figure 7—figure supplement 2
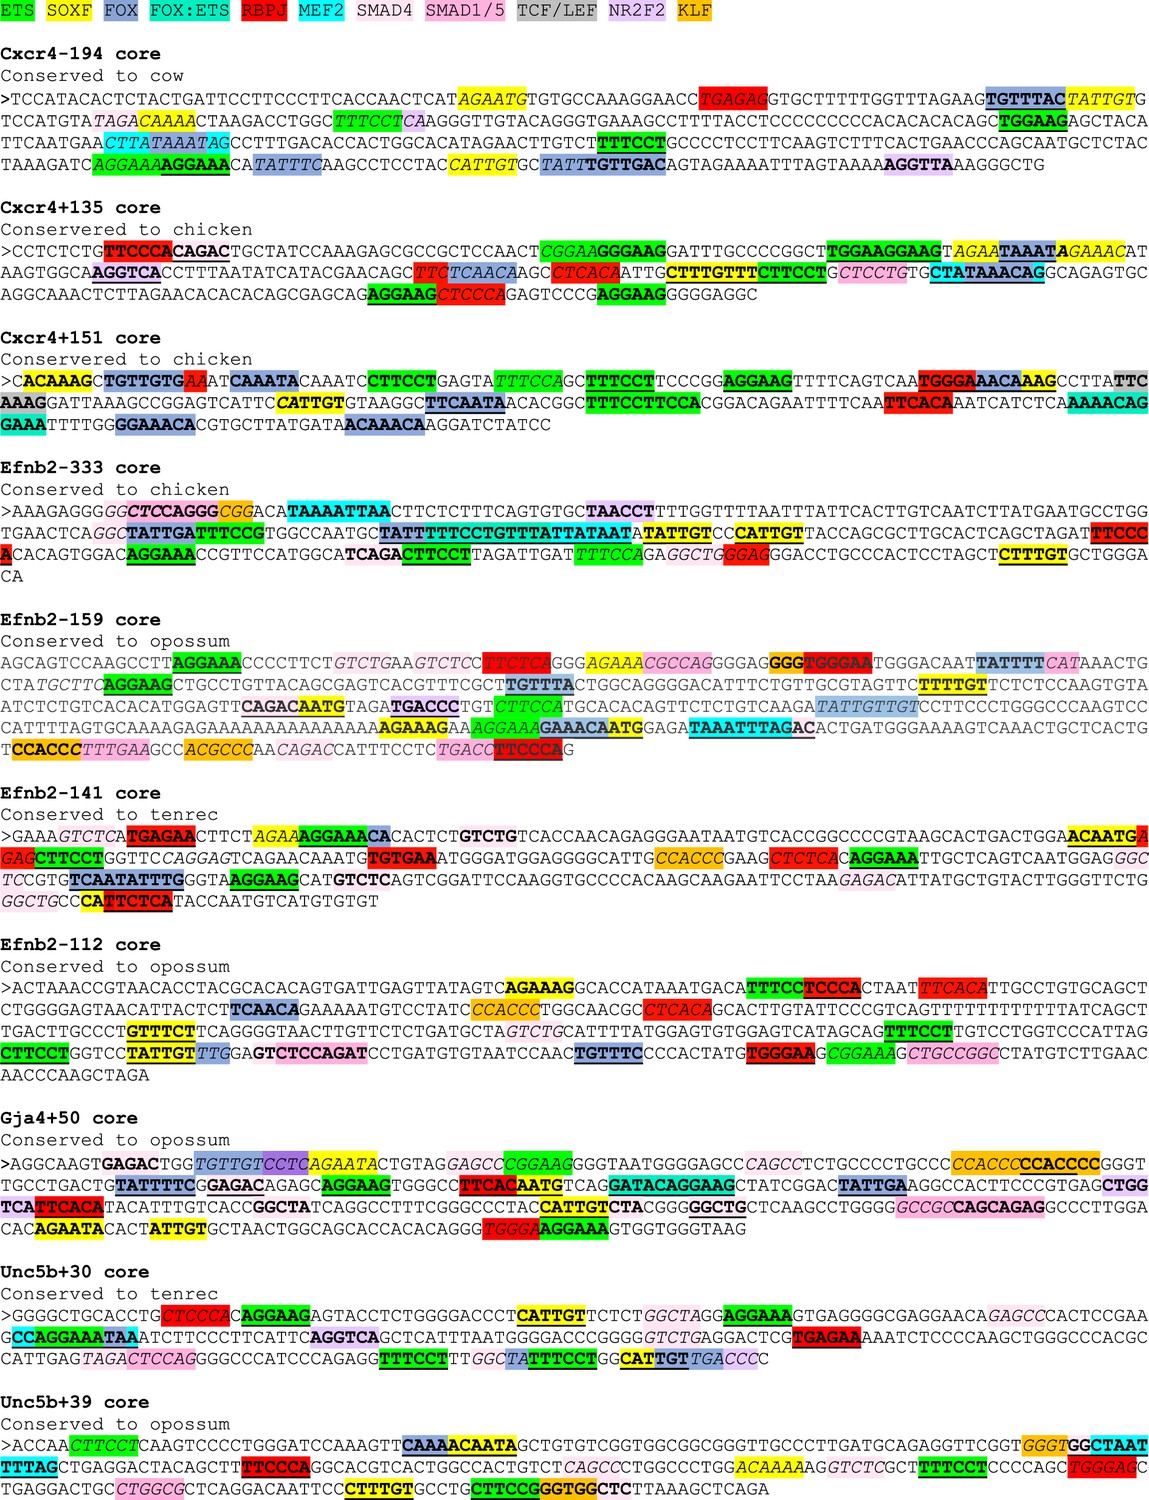
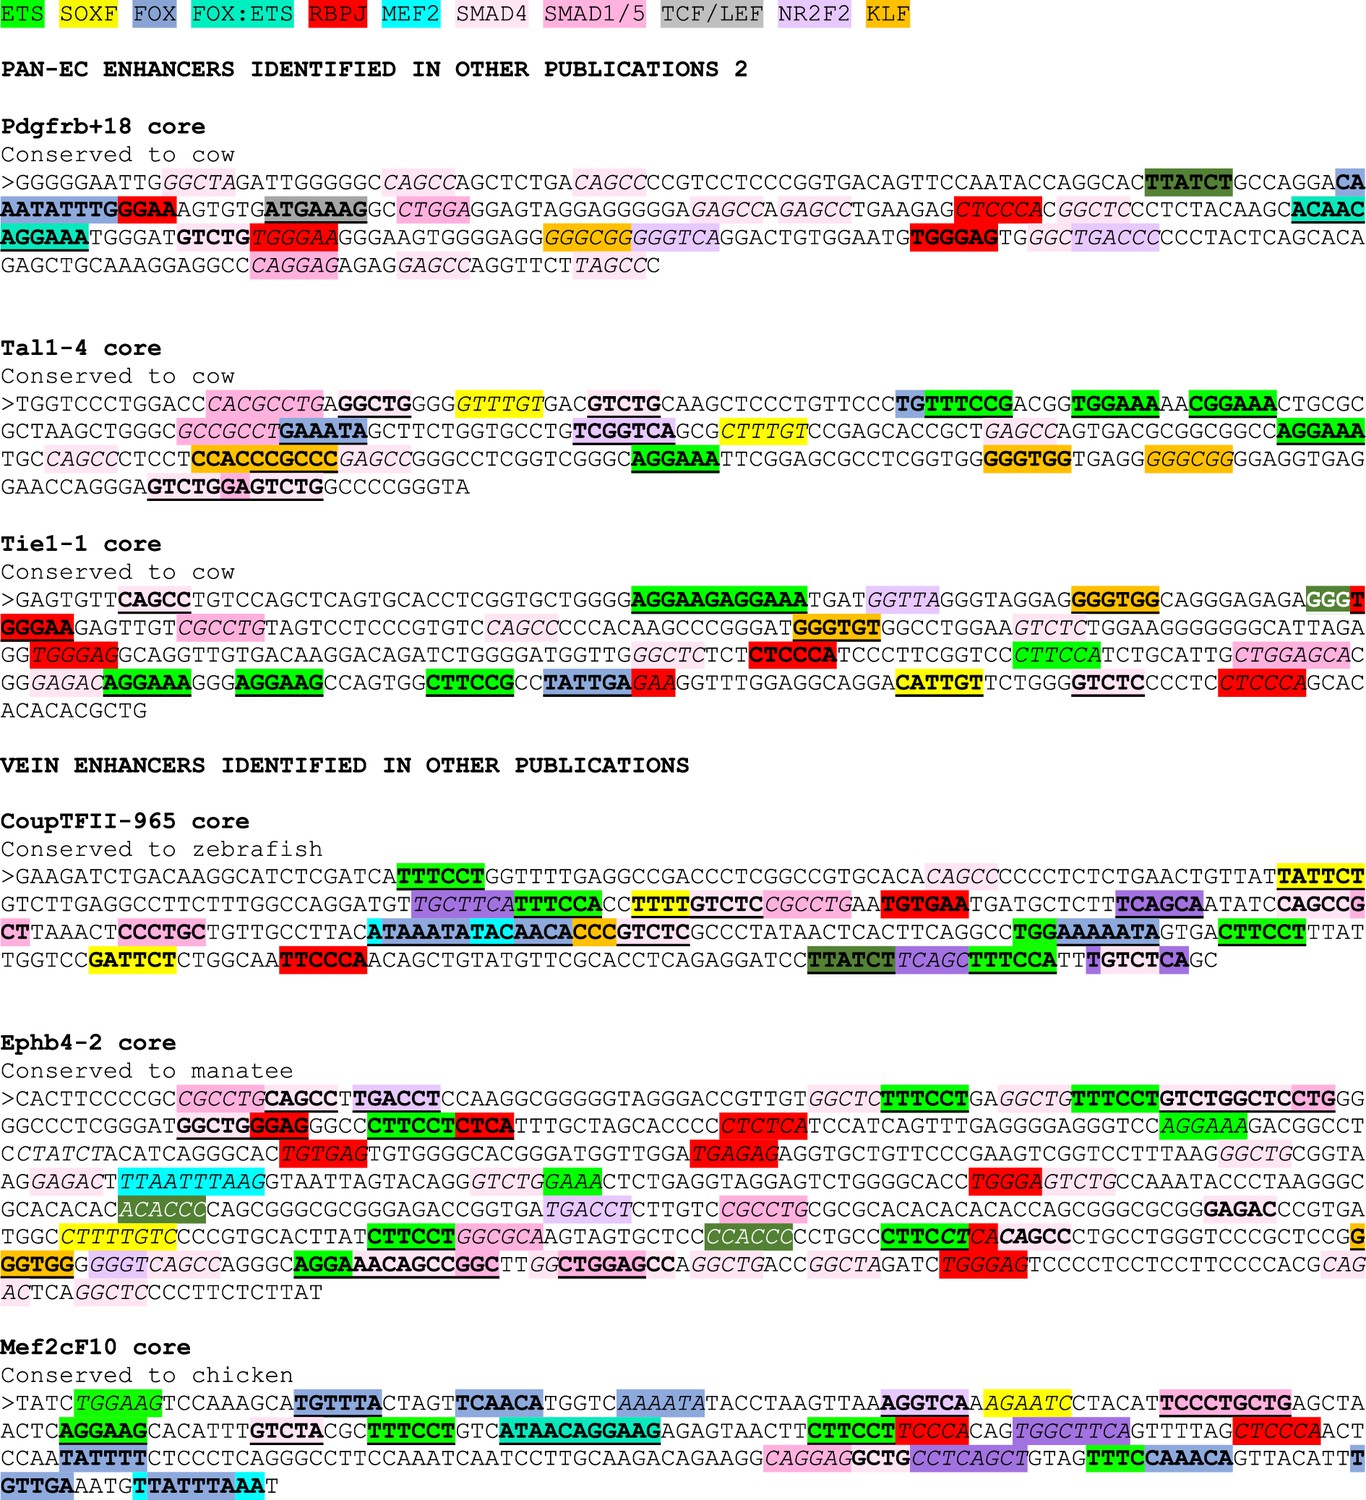
Sequences of core enhancers (3’ to 5’ orientation) listed in Figure 7 alongside annotated transcription factor binding motifs.
ETS motifs highlighted in green, SOXF motifs in yellow, FOX motifs in darker blue, FOX:ETS motifs in turquoise, RBPJ motifs in red, MEF2 in bright light blue, SMAD4 motifs in light pink, SMAD1/5 GC-rich motifs in darker pink, TCF/LEF (Wnt pathway) in grey, NR2F2 motifs in purple, and KLF4 motifs in orange. The sequences assessed as transcription factor motifs are listed in Figure 8C. Bold underline strong motifs conserved to the same depth as surrounding sequence (conservation depth indicated after title of each enhancer), bold indicates weak motif conserved between human and mouse but not to the comparable depth of the surrounding sequence, and italic indicates motif just found in mouse sequence.
Figure 7—figure supplement 3
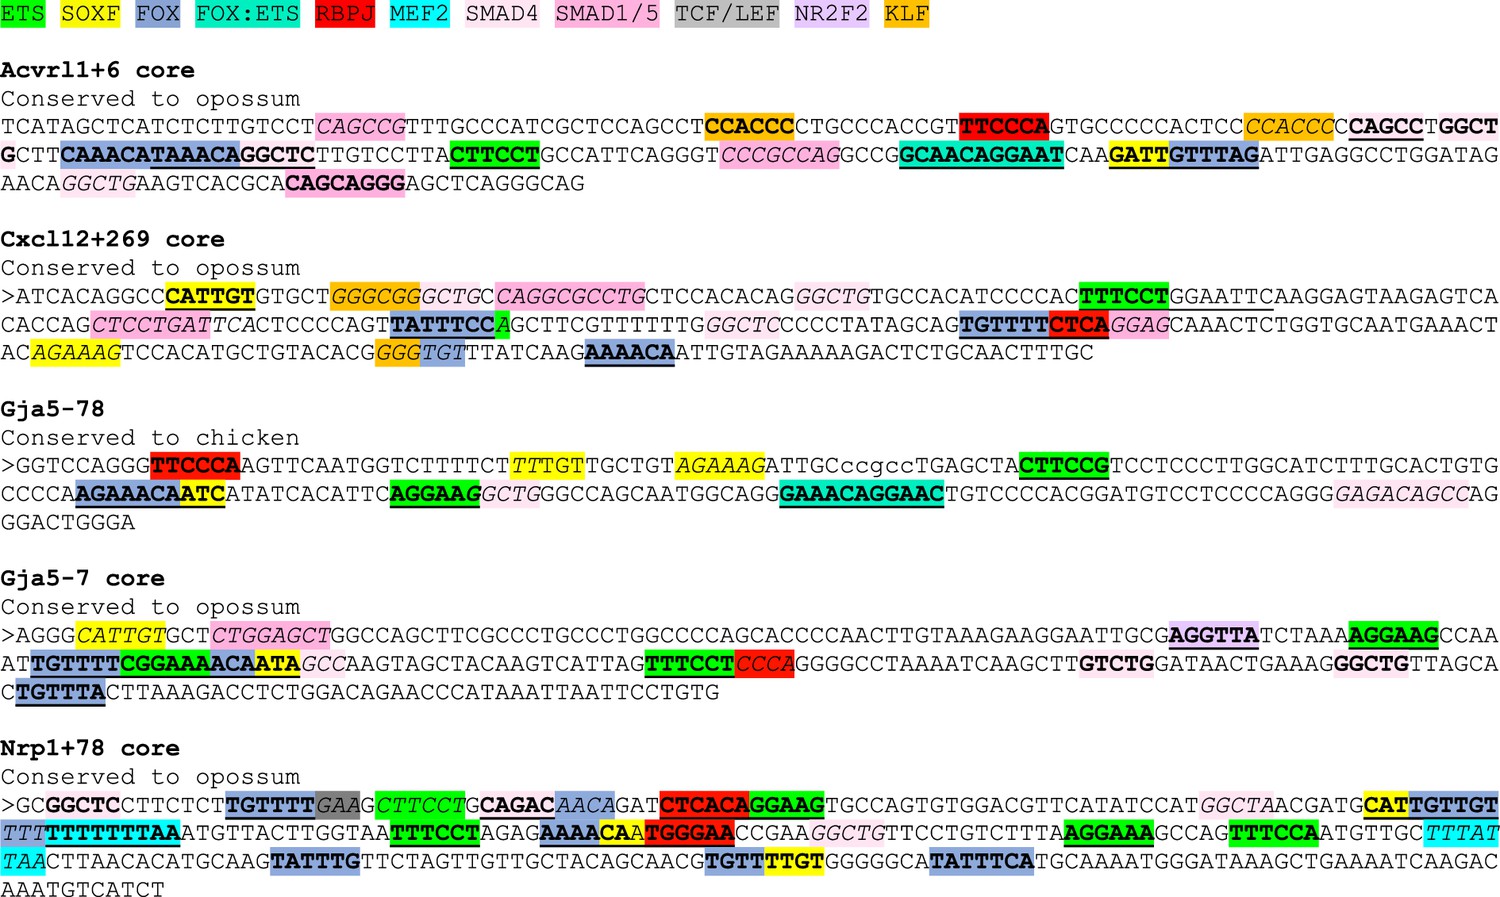
Sequences of core enhancers (3’ to 5’ orientation) listed in Figure 7 alongside annotated transcription factor binding motifs.
Figure 7—figure supplement 4
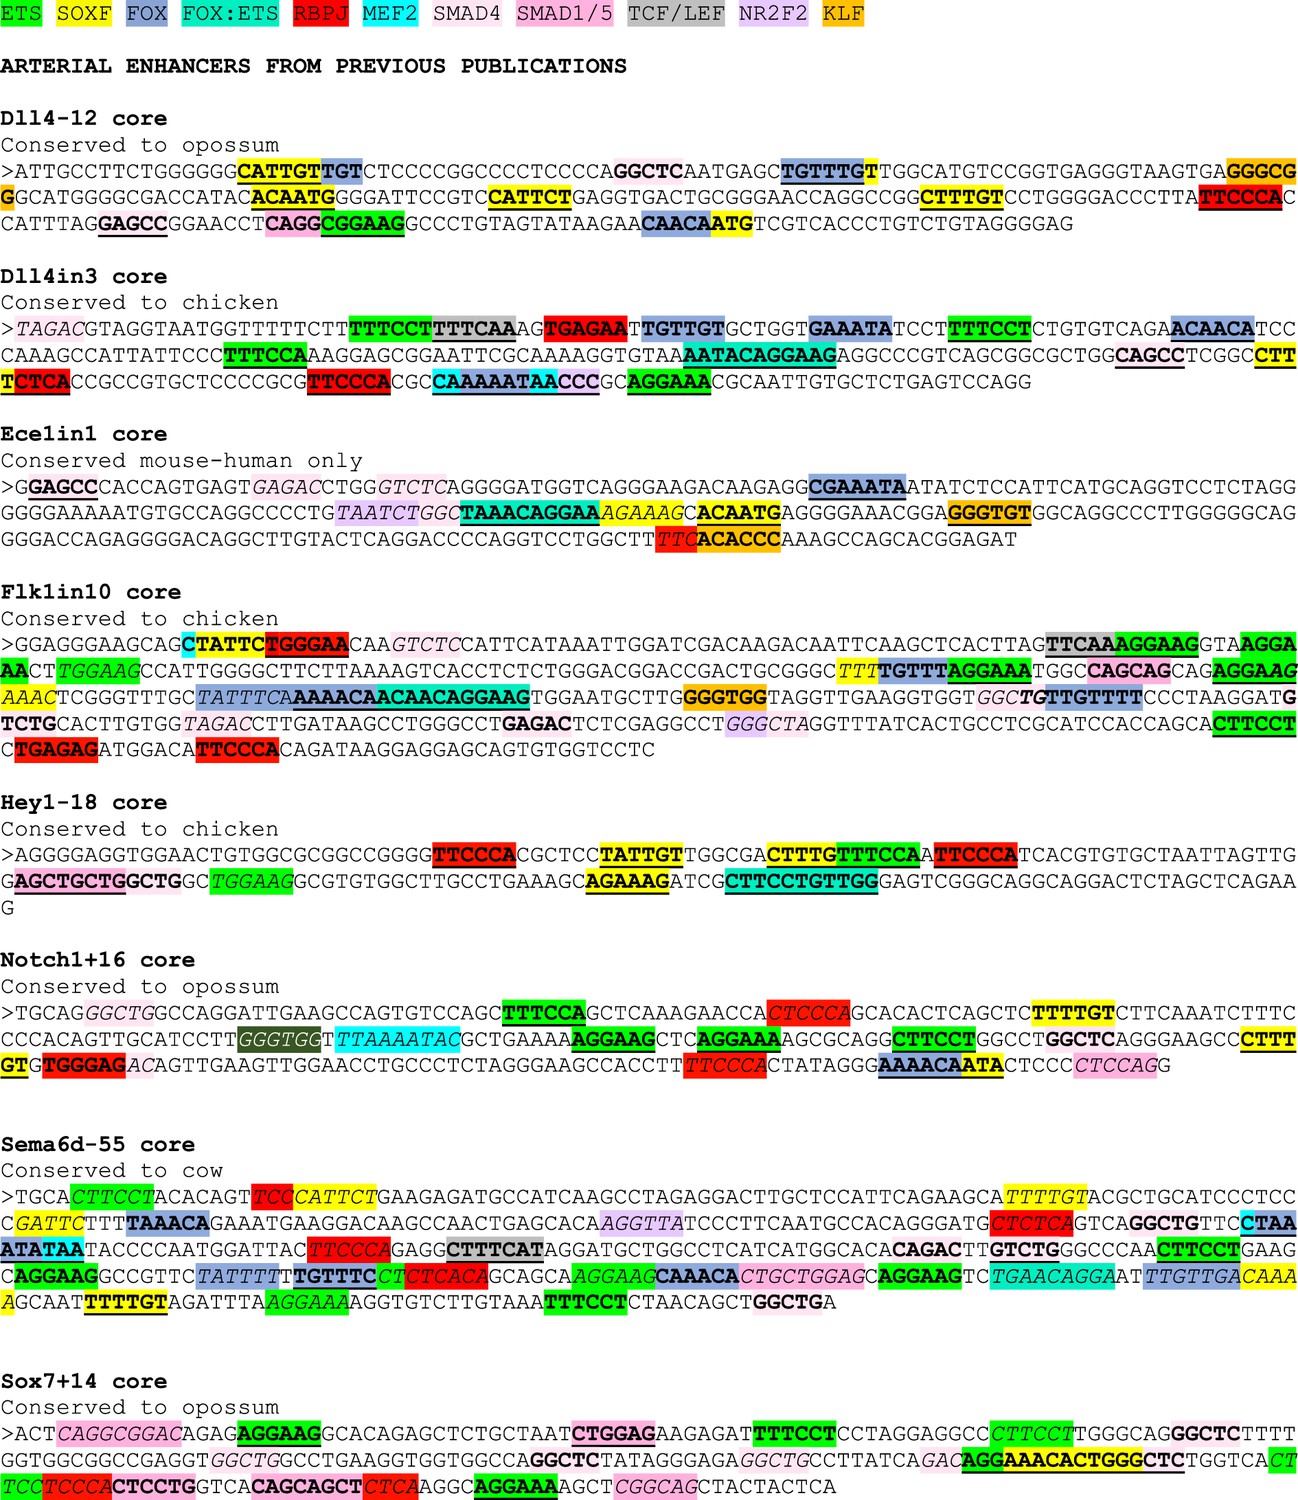
Sequences of core enhancers (3’ to 5’ orientation) listed in Figure 7 alongside annotated transcription factor binding motifs.
Figure 7—figure supplement 5
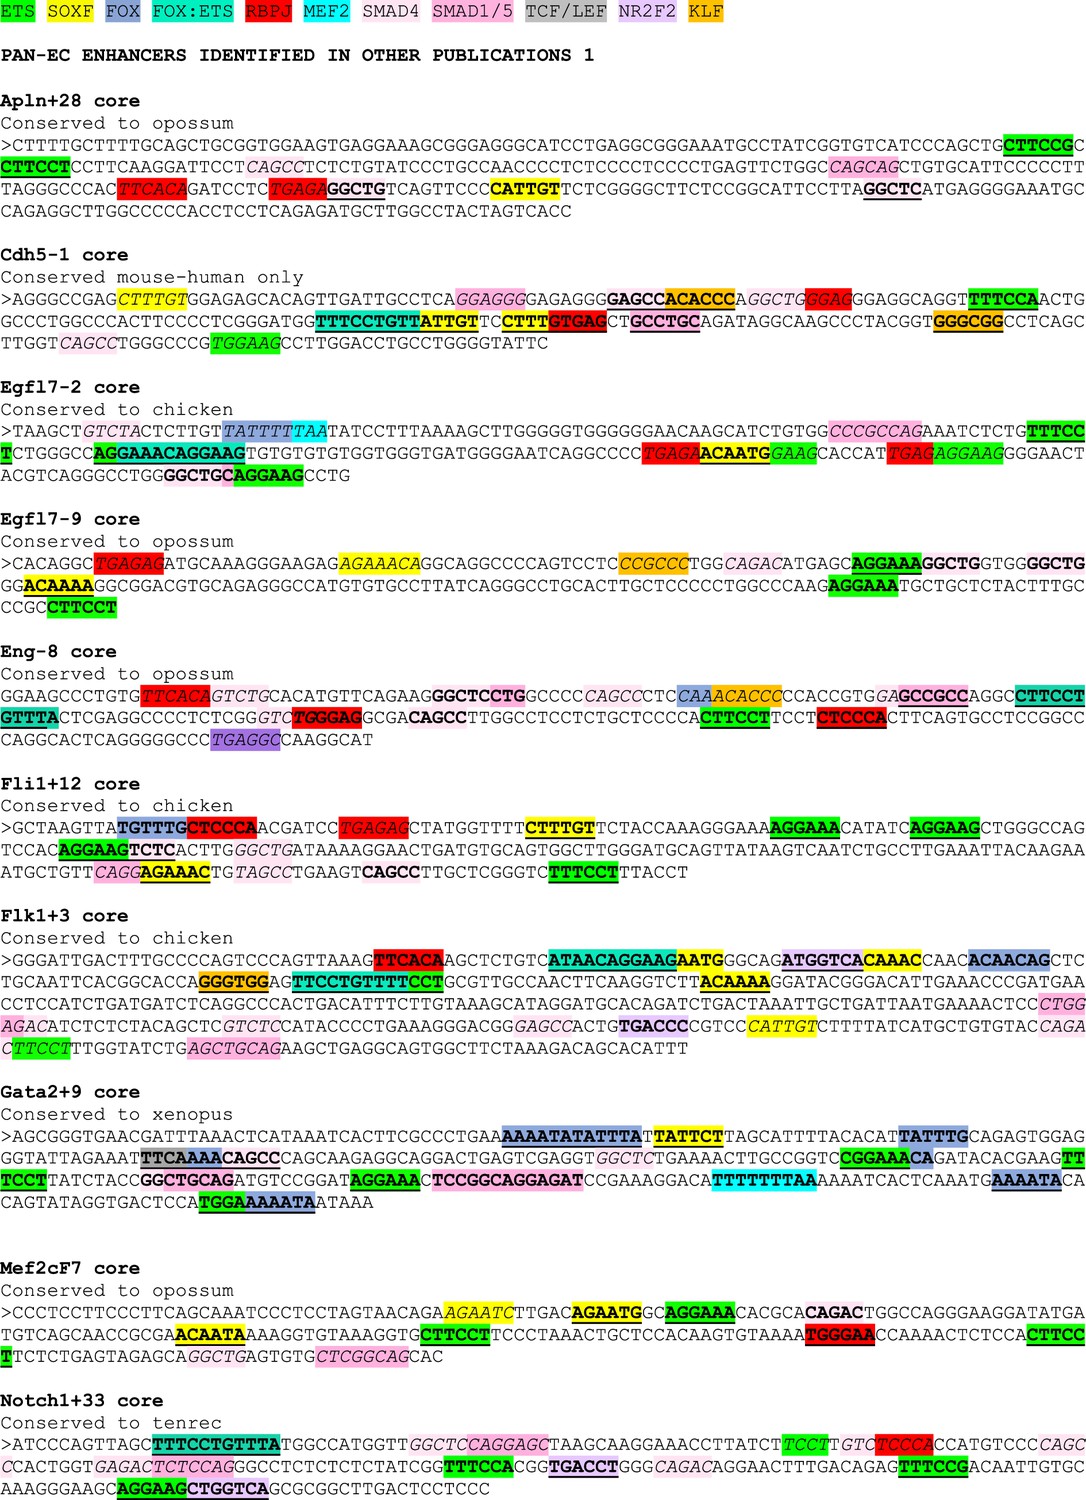
Sequences of core enhancers (3’ to 5’ orientation) listed in Figure 7 alongside annotated transcription factor binding motifs.
Figure 7—figure supplement 6
Sequences of core enhancers (3’ to 5’ orientation) listed in Figure 7 alongside annotated transcription factor binding motifs.
Figure 8 with 4 supplements

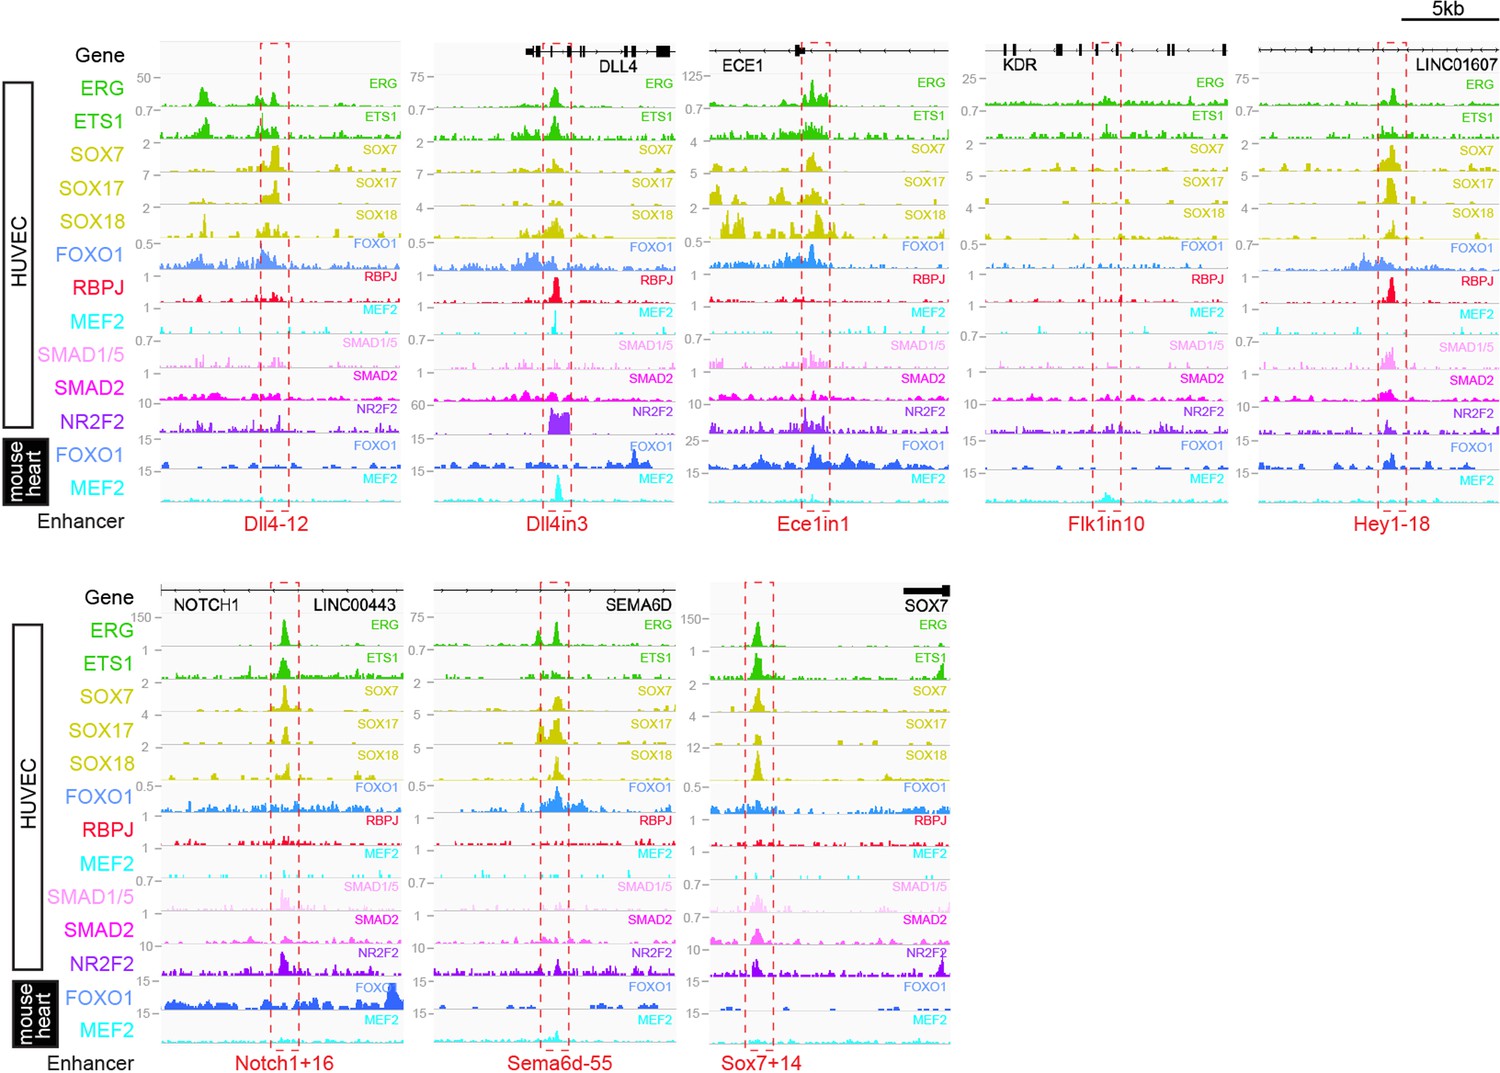
Binding patterns of 11 vascular-associated transcription factors around each arterial enhancer.
Red dashed box indicates arterial enhancer region. Tracks show ChIP-seq/CUT&RUN signal for ERG (Sissaoui et al., 2020), ETS1 (Chen et al., 2017), SOX7, SOX17 and SOX18 (this paper), FOXO1 (Andrade et al., 2021), RBPJ (Wang et al., 2019), MEF2C (Maejima et al., 2014), SMAD1/5 (Morikawa et al., 2011), SMAD2 (Chen et al., 2019), and NR2F2 (Sissaoui et al., 2020) in HUVECs, alongside FOXO1 (Sissaoui et al., 2020), and MEF2A (Akerberg et al., 2019) in adult mouse hearts.
Figure 8—figure supplement 1
Genomic regions around eight previously described arterial enhancers (red dashed box) alongside tracks showing ChIP-seq/CUT&RUN signal for ERG (Sissaoui et al., 2020), ETS1 (Chen et al., 2017), SOX7, SOX17, and SOX18 (this paper), FOXO1 (Andrade et al., 2021), RBPJ (Wang et al., 2019), MEF2C (Maejima et al., 2014), SMAD1/5 (Morikawa et al., 2011), SMAD2 (Chen et al., 2019), and NR2F2 (Sissaoui et al., 2020) in HUVECs, alongside FOXO1 (Sissaoui et al., 2020) and MEF2A (Akerberg et al., 2019) in adult mouse hearts.
Figure 8—figure supplement 2
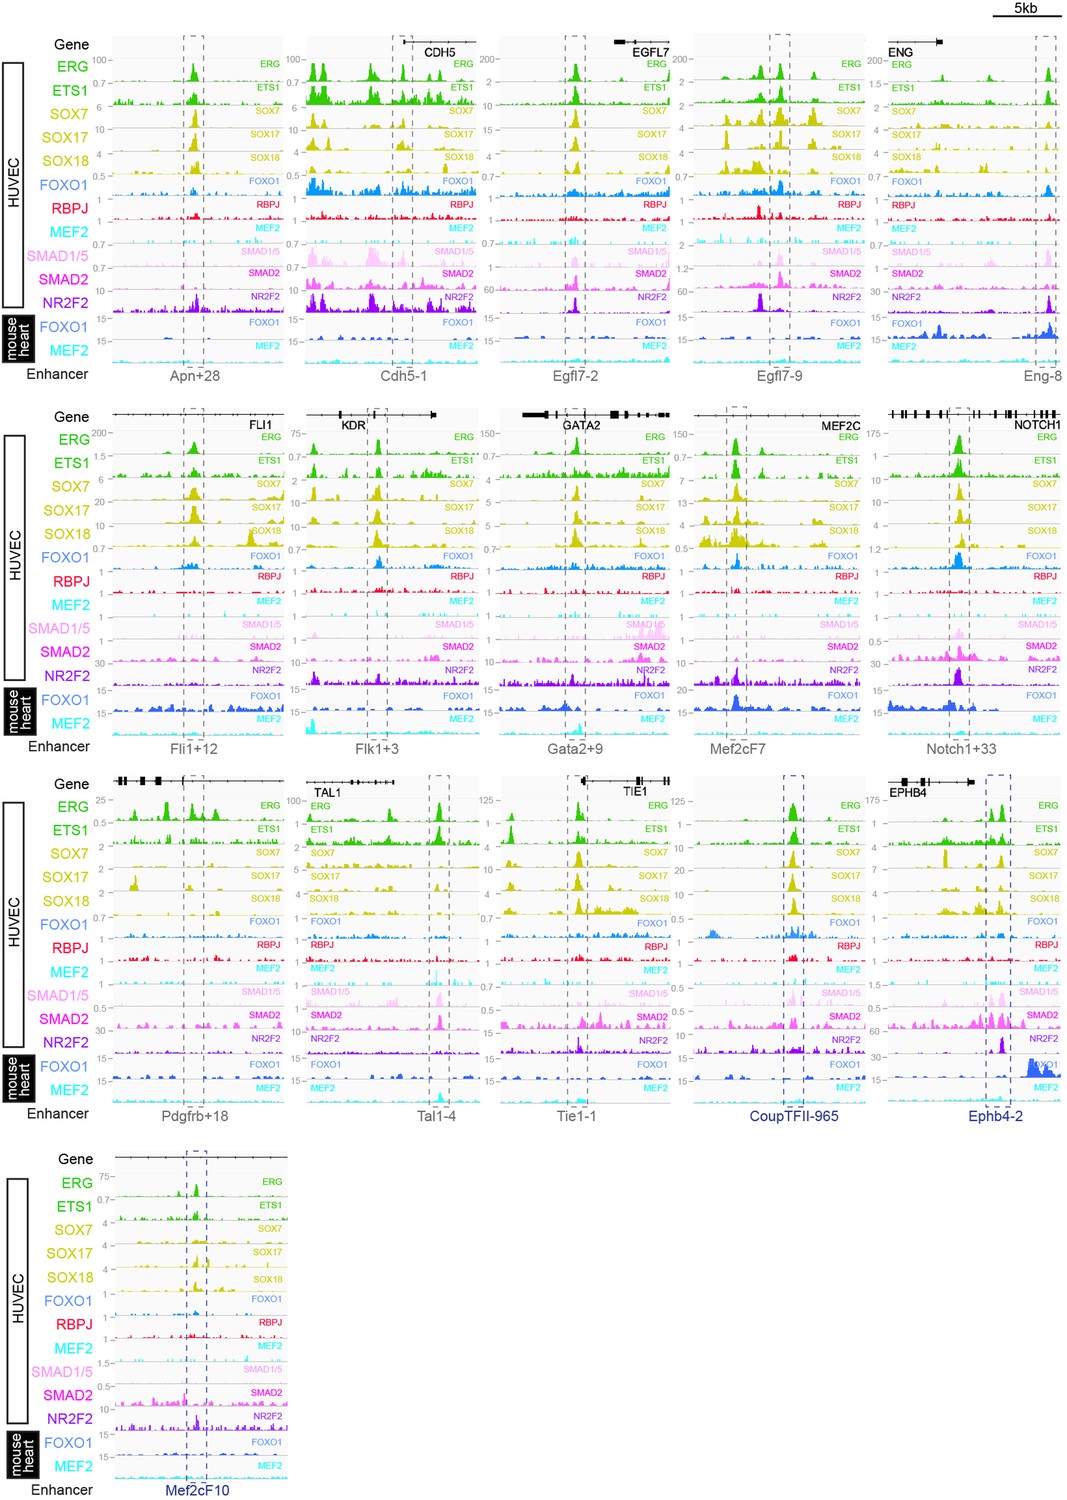
Genomic regions around 13 previously described pan-EC enhancers (grey dashed box) and 3 previously described vein enhancers (dark blue dashed box) alongside tracks showing ChIP-seq/CUT&RUN signal for ERG (Sissaoui et al., 2020), ETS1 (Chen et al., 2017), SOX7, SOX17, and SOX18 (this paper), FOXO1 (Andrade et al., 2021), RBPJ (Wang et al., 2019), MEF2C (Maejima et al., 2014), SMAD1/5 (Morikawa et al., 2011), SMAD2 (Chen et al., 2019), and NR2F2 (Sissaoui et al., 2020) in HUVECs, alongside FOXO1 (Sissaoui et al., 2020) and MEF2A (Akerberg et al., 2019) in adult mouse hearts.
Figure 8—figure supplement 3
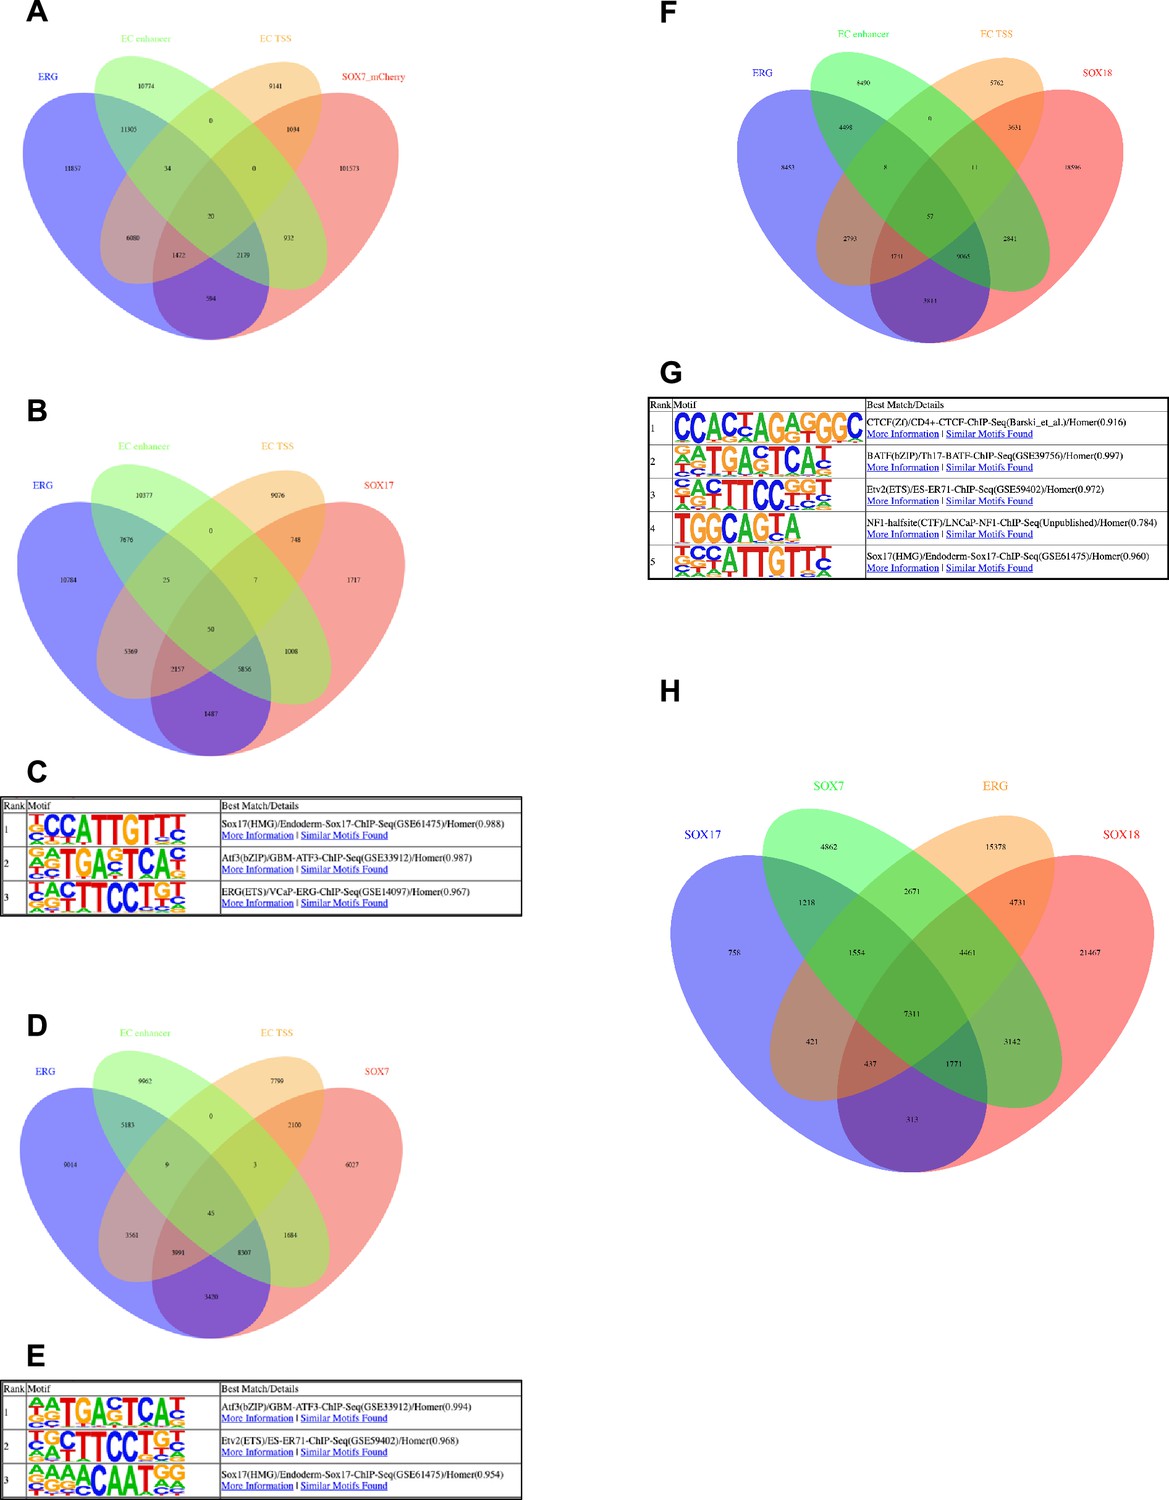
Assessment of SOX7, SOX17 and SOX18 CUT&RUN.
(A–B, D, F, H) Venn diagrams assessing overlap of genomic regions called as peaks of various combinations of ChIP-seq and CUT&RUN datasets. (A) Comparison of called binding peaks for ERG (Sissaoui et al., 2020) and SOX7_mCherry (Overman et al., 2017) with marks for enhancers and TSS (Sissaoui et al., 2020). (B) Comparison of called binding peaks for ERG and SOX17 (new CUT&RUN) with marks for enhancers and TSS. (D) Comparison of called binding peaks for ERG and SOX7 (new CUT&RUN) with marks for enhancers and TSS. (D, F) Comparison of called binding peaks for ERG and SOX7 (new CUT&RUN) with marks for enhancers and TSS. (H) Comparison of called binding peaks for the overlap of called peaks of our SOX7, SOX17, and SOX18 CUT&RUN data with each another and previously published ERG ChIP-seq data. (C, E, G) Top motif families called by HOMER in the SOX17 (C) and SOX7 (E) and SOX18 (G) CUT&RUN peaks.
Figure 8—figure supplement 4

Gene expression patterns of SOX and FOX transcription factors in ECs from different scRNA-seq datasets.
(A) UMAP visualization of scRNA-seq data of CD31+EC isolated from E12 BmxCreERT2;RosatdTomato lineage traced hearts with accompanying gene expression profiles. Raw data obtained from D’Amato et al., 2022. (B) Chosen gene expression profiles from scRNA-seq data of ApjCreER lineage traced EC isolated from E14.5 hearts. Plots taken from publicly available Shinyapp visualization of data from Su et al., 2018 . (C) UMAP plot and chosen gene expression profiles of CD31+EC from BmxCreERT2;RosatdTomato lineage traced from E17.5 hearts. Raw data obtained from D’Amato et al., 2022 for reanalysis.
Figure 9
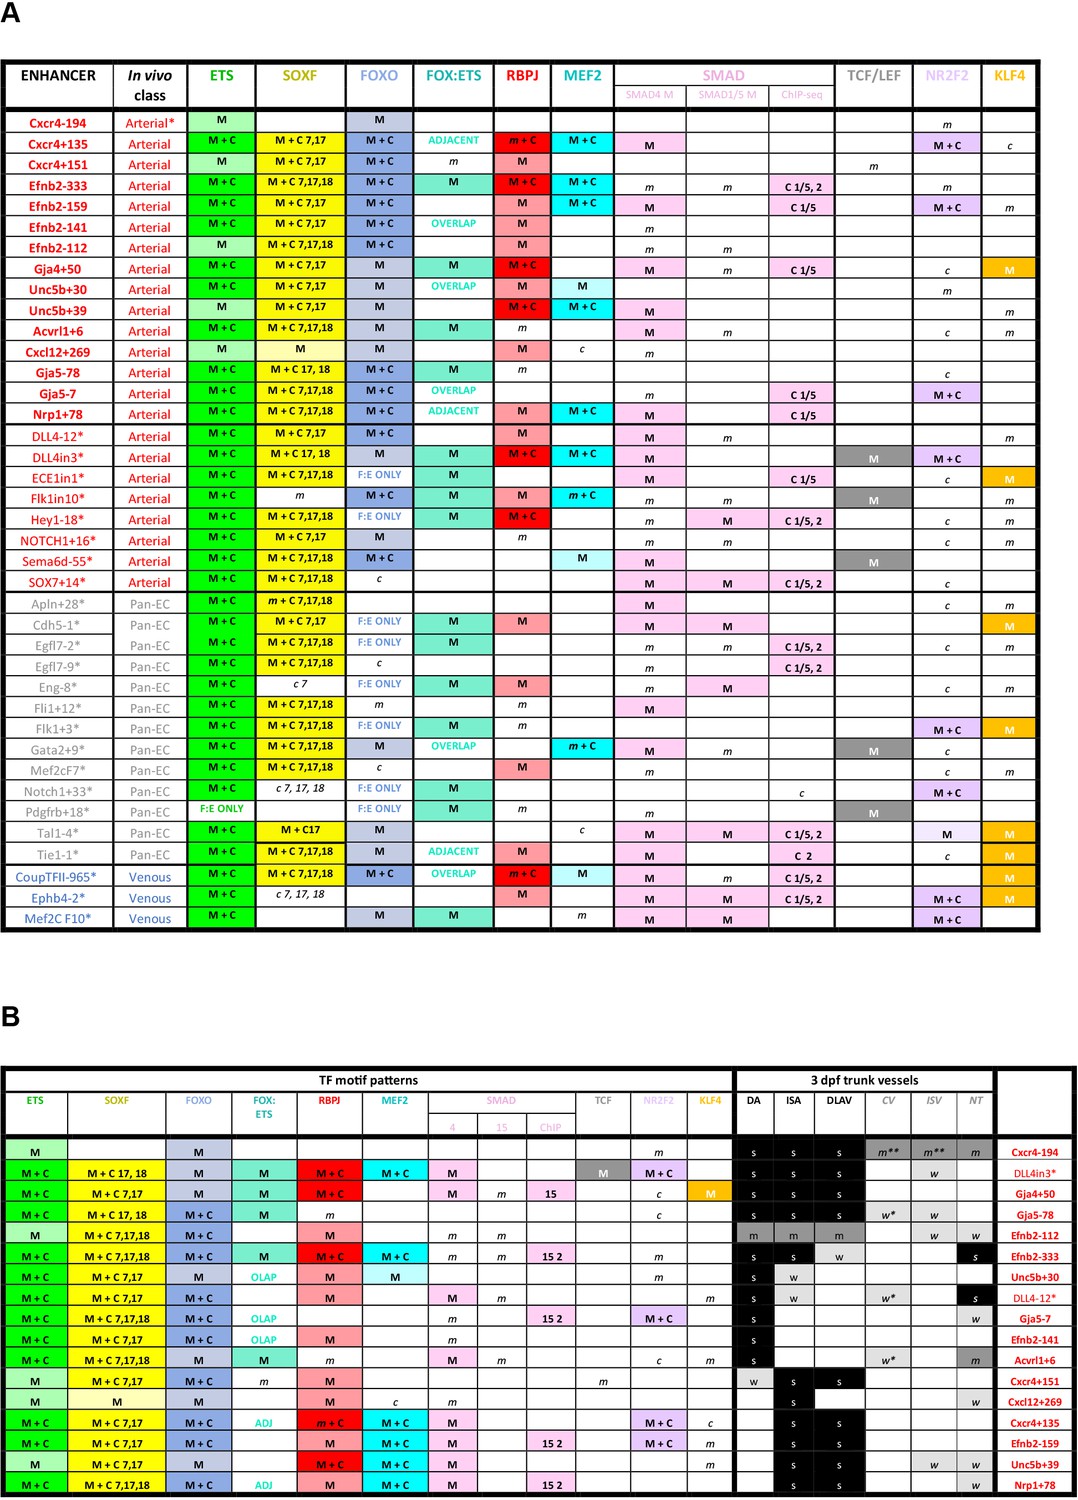
Summary of transcription factor motif and binding patterns at arterial, pan-EC and venous enhancers (A), and relative to different expression patterns within the arterial vasculature (B).
(A) All known (e.g. published) endothelial enhancers with adequately described expression patterns in transgenic mouse embryos were analysed to determine occurrence of selected TF motifs and direct binding. See Figure 7—figure supplement 1 for TF motif information, Figure 7—figure supplements 2–6 for annotated enhancer sequences and Figure 8 and Figure 8—figure supplements 1 and 2 for TF binding peaks. Enhancers in bold were identified in this paper, those with * are previously published (as detailed in 1), genome locations for each enhancer is provided in Table 2—source data 2. (B) TF binding patterns for each arterial enhancer grouped by expression patterns in the 3 dpf zebrafish trunk. DA dorsal aorta, ISA intersegmental arteries, DLAV dorsal longitudinal anastomotic vessel, CV cardinal vein, ISV intersegmental veins, NT neural tube, NCA nasal ciliary artery, NCAx extends beyond NCA in direction of blood flow, HA hyaloid artery, DCV dorsal ciliary vein, OV optic vein. A fin artery, V fin vein. Letters s m w equate to strong medium or weak relative expression, * restricted to distal regions, ** restricted to anterior regions, *** restricted to subset of ECs.
-
Figure 9—source data 1
Summary of transcription factor motif and binding patterns atarterial, pan-EC and venous enhancers, and relative to different expressionpatterns within the arterial vasculature.
M indicates enhancer contains one of more strongly conserved motifs for designated transcription factor, while m indicates weakly conserved motifs. C indicates a binding peak (as assessed by ChIP-seq or similar) for designated transcription factor in an enhancer with a corresponding motif, while c indicates a binding peak without a corresponding motif.
- https://cdn.elifesciences.org/articles/102440/elife-102440-fig9-data1-v2.xlsx
-
Figure 9—source data 2
TF binding patterns for each arterial enhancer grouped by expression patterns in the 3 dpf zebrafish trunk.
C indicates a binding peak (as assessed by ChIP-seq or similar) in an enhancer with a corresponding motif, while c indicates a binding peak without a corresponding motif. DA dorsal aorta, ISA intersegmental arteries, DLAV dorsal longitudinal anastomotic vessel, CV cardinal vein, ISV intersegmental veins, NT neural tube, NCA nasal ciliary artery, NCAx extends beyond NCA in direction of blood flow, HA hyaloid artery, DCV dorsal ciliary vein, OV optic vein. A fin artery, V fin vein. Letters s m w equate to strong medium or weak relative expression, * restricted to distal regions, ** restricted to anterior regions, *** restricted to subset of ECs.
- https://cdn.elifesciences.org/articles/102440/elife-102440-fig9-data2-v2.xlsx
Tables
Table 1
Enhancer marks around 32 known in vivo-characterized endothelial enhancers (all described in Payne et al., 2024).
Red text indicates arterial enhancers.
| Enhancer | hg19 coordinates | H DNAseI | H histone | Mm9 coordinates | M artery ATAC | M retina ATAC | M E11 p300 |
|---|---|---|---|---|---|---|---|
| Apln+28 | chrX:128,756,756–128,757,160 | Yes | Yes | chrX:45,359,306–45,359,632 | No | Yes | Yes |
| Dab2-240 | chr5:39,755,997–39,756,596 | Yes* | Yes | chr15:6,009,719–6,010,138 | No | No | Yes |
| Dll4in3 | chr15:41,222,881–41,223,570 | Yes | Yes | chr2:119,152,838–119,153,684 | Yes | Yes | Yes |
| Dll4-12 | chr15:41,210,706–41,211,825 | Yes | Yes | chr2:119,140,274–119,141,353 | Yes | Yes | Yes |
| Ece1in1 | chr1:21,606,038–21,607,057 | Yes | Yes | chr4:137,475,719–137,476,738 | Yes | Yes | Yes |
| Egfl7-9 | chr9:139,540,750–139,541,299 | Yes | Yes | chr2:26,427,513–26,427,707 | Yes | Yes | Yes |
| Egfl7-2 | chr9:139,550,292–139,550,891 | Yes | Yes | chr2:26,434,087–26,434,301 | Yes | Yes | Yes |
| Emcn-22 | chr4:101,460,885–101,461,224 | No | Yes | chr3:136,984,547–136,984,951 | Yes | No | No |
| Eng-8 | chr9:130,624,538–130,624,804 | Yes | Yes | chr2:32,493,606–32,493,823 | Yes | Yes | Yes |
| Eng +9 | chr9:130,607,199–130,607,657 | Yes | Yes | chr2:32,511,282–32,511,641 | Yes | Yes | Yes |
| Ephb4-2 | chr7:100,426,337–100,427,259 | Yes | Yes | chr5:137,789,910–137,790,581 | No | No | Yes |
| Fli1+12 | chr11:128,575,436–128,575,782 | Yes | Yes | chr9:32,337,295–32,337,538 | Yes | Yes | Yes |
| Flk1+3 | chr4:55,987,345–55,987,920 | Yes | Yes | chr5:76,370,627–76,371,056 | No | No | Yes |
| Flk1in10 | chr4:55,972,978–55,973,903 | Yes | No | chr5:76,357,891–76,358,715 | No | Yes | Yes |
| Flt4+26 | chr5:180,050,291–180,050,684 | No | Yes | chr11:49,445,777–49,446,175 | Yes | Yes | Yes |
| Foxp1+138 | chr3:71,493,515–71,493,886 | Yes | Yes | chr6:99,338,958–99,339,515 | No | Yes | Yes |
| Gata2+9 | chr3:128,201,971–128,202,273 | Yes | Yes | chr6:88,153,077–88,153,386 | Yes | Yes | Yes |
| Hey1-18 | chr8:80,695,610–80,697,109 | Yes | Yes | chr3:8,685,099–8,685,821 | Yes | Yes | Yes |
| Hlx-3 | chr1:221,049,978–221,050,354 | Yes | Yes | chr1:186,558,918–186,559,303 | Yes | Yes | Yes |
| Mef2F10 | chr5:88,110,980–88,111,253 | Yes | Yes | chr13:83,721,761–83,722,057 | No | Yes | Yes |
| Mef2F7 | chr5:88,123,031–88,123,357 | Yes | Yes | chr13:83,711,180–83,711,509 | Yes | Yes | Yes |
| Notch1+16 | chr9:139,424,543–139,424,953 | Yes | Yes | chr2:26,346,100–26,346,671 | Yes | Yes | Yes |
| Notch1+33 | chr9:139,406,356–139,406,655 | Yes | Yes | chr2:26,330,559–26,330,785 | Yes | Yes | Yes |
| CoupTFII-965 | chr15:95,908,708–95,909,240 | Yes | Yes | chr7:78,456,407–78,456,767 | Yes | Yes | Yes |
| Nrp1+28 | chr10:33,590,960–33,591,499 | No | Yes | chr8:130,911,132–130,911,551 | Yes | Yes | Yes |
| Nrp2+26 | chr2:206,573,202–206,573,523 | Yes | Yes | chr1:62,776,231–62,776,553 | Yes | Yes | Yes |
| Pdgfrb +18 | chr5:149,516,883–149,517,356 | No | Yes | chr18:61,219,244–61,219,566 | No | No | No |
| Epcr-5 | chr20:33,754,176–33,754,585 | Yes | Yes | chr2:155,568,588–155,569,127 | Yes | No | Yes |
| Sema6d-55 | chr15:47,958,023–47,958,764 | Yes | Yes | chr2:124,380,522–124,381,285 | Yes | Yes | Yes |
| Sox7+14 | chr8:10,573,085–10,574,291 | Yes | Yes | chr14:64,576,271–64,577,533 | Yes | Yes | Yes |
| Tal +19 | chr1:47,677,539–47,677,958 | Yes | Yes | chr4:114,748,131–114,748,530 | Yes | Yes | Yes |
| Tal1-4 | chr1:47,701,050–47,701,347 | No | Yes | chr4:114,725,243–114,725,552 | Yes | Yes | Yes |
-
*
“H DNAseI” indicates open chromatin regions as defined by DNAseI hypersensitivity in HUVECs, HMVEC-dBl-neo and HMVEC-dBl-ad comparative to non-ECs and relative to surrounding region (UCSC genome browser38); “H histone” indicates relatively enriched binding of H3K27Ac and/or H3K4Me1 in HUVECs (UCSC genome browser38), * indicates this extends to many non-EC lines as well; “M artery ATAC” indicates regions of relatively open chromatin assessed by ATAC-seq in primary mouse adult aortic ECs (MAECs) (Engelbrecht et al35); “M retina ATAC” indicates regions of relatively open chromatin assessed by ATAC-seq in mouse postnatal day 6 (P6) retina ECs (MRECs) (Yanagida et al36); “M E11 p300” indicates regions relatively enriched for EP300 binding in Tie2Cre+ve cells from embryonic day (E)11.5 mouse embryos (Zhou et al37). * indicates that enhancer marks were not specific for ECs but rather found in many cell types.‘M artery ATAC’ indicates regions of relatively open chromatin assessed by ATAC-seq in primary mouse adult aortic ECs (MAECs) Engelbrecht et al., 2020; ‘M retina ATAC’ indicates regions of relatively open chromatin assessed by ATAC-seq in mouse postnatal day 6 (P6) retina ECs (MRECs) Yanagida et al., 2020; ‘M E11 p300’ indicates regions relatively enriched for EP300 binding in Tie2Cre+ve cells from embryonic day (E) 11.5 mouse embryos (Zhou et al., 2017). *indicates that enhancer marks were not specific for ECs but rather found in many cell types.
Table 2
Summary of putative enhancer activity in mosaic Tol2 transgenic zebrafish.
‘In vivo classification’ indicates the results of this screen, ‘in silico classification’ indicates designation from dataset from Sissaoui et al., 2020, as defined by relative enhancer and promoter marks in HUVECs vs. HUAECs.
| Enhancer | # Injected/# any EC GFP | In vivo classification | In silico classification |
|---|---|---|---|
| Cxcr4-232 | 163/0 | Inactive | Uncalled |
| Cxcr4-194 | 46/25 | Arterial enhancer | Uncalled |
| Cxcr4-130 | 95/0 | Inactive | Uncalled |
| Cxcr4-117^ | 209/9* | Inactive | Uncalled |
| hCxcr4-117^/CXCR4-125 | 81/0 | Inactive | Uncalled |
| Cxcr4-113 | 300/0 | Inactive | Common EC enhancer |
| Cxcr4-109 | 89/0 | Inactive | Common EC enhancer |
| Cxcr4+1 | 33/0 | Inactive | Uncalled |
| Cxcr4+119 | 187/0 | Inactive | Arterial enhancer |
| Cxcr4+135 | 69/56 | Arterial enhancer | Uncalled |
| Cxcr4+151 | 96/50 | Arterial enhancer | Arterial TSS |
| Efnb2-333 | 152/93 | Arterial enhancer | Common EC enhancer |
| Efnb2-159 | 247/217 | Arterial enhancer | Common EC enhancer |
| Efnb2-141 | 74/36 | Arterial enhancer | Arterial TSS |
| Efnb2-112 | 65/30 | Arterial enhancer | Arterial TSS |
| Efnb2+3 | 92/0 | Inactive | Common EC TSS |
| Efnb2+37 | 114/18* | Weak enhancer* | Common EC enhancer |
| Efnb2+172 | 63/0 | Inactive | Common EC enhancer |
| Efnb2+209 | 158/0 | Inactive | Common EC enhancer |
| Gja4+24 | 52/0 | Inactive | Uncalled |
| Gja4+50 | 232/187 | Arterial enhancer | Common EC enhancer |
| Gja4+57 | 192/0 | Inactive | Uncalled |
| Unc5b-57 | 50/21 | Venous enhancer | Uncalled |
| Unc5b+14 | 61/0 | Inactive | Uncalled |
| Unc5b+23 | 82/16* | Weak enhancer* | Arterial enhancer |
| Unc5b+30 | 96/79 | Arterial enhancer | Arterial enhancer |
| Unc5b+39 | 96/56 | Arterial enhancer | Arterial enhancer |
| Unc5b+43 | 111/0 | Inactive | Arterial enhancer |
| Acvrl1-5 | Seki et al., 2004 | Inactive | Common EC enhancer |
| Acvrl1-1/p | Seki et al., 2004 | Inactive | Common EC TSS |
| Acvrl1+6 | 127/49 | Arterial enhancer | Common EC TSS |
| Acvrl1+16 | 205/0 | Inactive | Common EC TSS |
| Acvrl1+19 | 95/0 | Inactive | Common EC TSS |
| Cxcl12-184 | 64/0 | Inactive | Common EC enhancer |
| Cxcl12-2 | 32/0 | Inactive | Common EC enhancer |
| Cxcl12+239 | 70/1 | Inactive | Uncalled |
| Cxcl12+265 | 42/1 | Inactive | Uncalled |
| Cxcl12+269 | 163/63 | Arterial enhancer | Uncalled |
| Cxcl12+298 | 51/0 | Inactive | Common EC enhancer |
| Cxcl12+376 | 149/0 | Inactive | Uncalled |
| Cxcl12+383 | 152/37* | Weak enhancer* | Uncalled |
| Cxcl12+439 | 73/0 | Inactive | Common EC enhancer |
| Cxcl12+445 | 145/0 | Inactive | Common EC TSS |
| Gja5-7 | 66/39 | Arterial enhancer | Arterial enhancer |
| Gja5-21† | 38/0 | Inactive | Common EC enhancer |
| Gja5-28 | 156/0 | Inactive | Uncalled |
| Gja5-78 | 76/62 | Arterial enhancer | Common EC enhancer |
| Gja5-93 | 253/0 | Inactive | Arterial enhancer |
| Nrp1+28 | De Val et al., 2008 | Pan-EC enhancer | Common EC enhancer |
| Nrp1+76 | 54/0 | Inactive | Common EC enhancer |
| Nrp1+78 | 191/34 | Arterial enhancer | Common EC enhancer |
| Nrp1+91 | 109/0 | Inactive | Common EC enhancer |
| Nrp1+129 | 110/0 | Inactive | Common EC enhancer |
| DLL4-12 | Sacilotto et al., 2013 | Arterial enhancer | Common EC enhancer |
| DLL4in3 | Sacilotto et al., 2013 | Arterial enhancer | Common EC enhancer |
| ECE1in1 | Robinson et al., 2014 | Arterial enhancer | Common EC enhancer |
| Flk1in10 | Becker et al., 2016 | Arterial enhancer | Uncalled |
| Hey1-18 | Watanabe et al., 2020 | Arterial enhancer | Common EC enhancer |
| NOTCH1+16 | Chiang et al., 2017 | Arterial enhancer | Common EC enhancer |
| Sema6d-55 | Zhou et al., 2017 | Arterial enhancer | Common EC enhancer |
| SOX7+14 | Zhou et al., 2017 | Arterial enhancer | Common EC enhancer |
-
*
indicates only limited expression in a very small number of ECs. Acvrl1-5 and Acvrl1-1/p were previously investigated by Seki et al., 2003, Nrp1+28 by De Val et al., 2008, Notch1+16 by Chiang et al., 2017, Dll4-12 and Dll4in3 by Sacilotto et al., 2013, Flk1in10 by Becker et al., 2016, Sema6d-55 by Zhou et al., 2017, Sox7+14 by Zhou et al., 2017; Andersson et al., 2014, Ece1in10 by Robinson et al., 2014, and Hey1-18 by Watanabe et al., 2020.
-
†
After this analysis but prior to this publication, Gja5-21 was shown to direct expression in the zebrafish endocardium at 4 dpf (Chiang et al., 2023).
-
Table 2—source data 1
Enhancer marks in different human and mouse ECs at putative enhancer regions within the loci of eight arterial genes.
‘Selected’ indicates that the region meets our threshold as a putative enhancer, ‘exception’ indicates region did not meet our threshold but was included in transgenic analysis as a control (grey text). Numbers indicate approximate distance from the TSS of the named arterial gene. * indicates that enhancer mark was widely seen beyond endothelial cells. Grey italic text refers to regions previously implicated in enhancer activity, with the /enhancer name ascribed in the original reference. Cxcr4-117/CXCR4-125 is from Tsaryk et al., 2022 ; Cxcr4-1, Nrp1- 1/NRP1A and Nrp1+76/NRP1B are from Yamamizu et al., 2010 ; Efnb2+17/EFNB2A and Efnb2+25/EFNB2B are from Grego-Bessa et al., 2007; and Efnb2+4/EFNB2R1 and Efnb2+28/EFNB2R4 are from Stewen et al., 2024.
- https://cdn.elifesciences.org/articles/102440/elife-102440-table2-data1-v2.docx
-
Table 2—source data 2
Genome locations for all enhancer (and human orthologues) investigated in this paper.
Values given for mm10 represent the core enhancer regions analysed for motif sequences and protein binding.
- https://cdn.elifesciences.org/articles/102440/elife-102440-table2-data2-v2.docx
Key resources table
| Reagent type (species) or resource | Designation | Source or reference | Identifiers | Additional information |
|---|---|---|---|---|
| Genetic reagent (Danio rerio) | tg(kdrl:Has.HRAS-mcherry)s896 | Chi et al., 2008 | ZFIN:s896 | |
| Genetic reagent (D. rerio) | tg(fli1:EGFP) | Lawson et al., 2001 | ZFIN:y1 | |
| Genetic reagent (D. rerio) | tg(Cxcr4-194:EGFP) | This paper | ZFIN:lcr6 | Enhancer mm10 chr1:128,785,499–128,786,173 |
| Genetic reagent (D. rerio) | tg(Cxcr4+135:EGFP) | This paper | ZFIN:lcr7 | Enhancer mm10 chr1:128,456,948–128,457,375 |
| Genetic reagent (D. rerio) | tg(Cxcr4+151:EGFP) | This paper | ZFIN:lcr8 | Enhancer mm10 chr1:128,440,589–128,441,003 |
| Genetic reagent (D. rerio) | tg(Efnb2-333:EGFP) | This paper | ZFIN:lcr9 | Enhancer mm10 chr8:8,994,329–8,995,063 |
| Genetic reagent (D. rerio) | tg(Efnb2-159:EGFP) | This paper | ZFIN:lcr10 | Enhancer mm10 chr8:8,819,219–8,819,856 |
| Genetic reagent (D. rerio) | tg(Efnb2-141:EGFP) | This paper | ZFIN:lcr11 | Enhancer mm10 chr8:8,801,433–8,802,174 |
| Genetic reagent (D. rerio) | tg(Efnb2-112:EGFP) | This paper | ZFIN:lcr12 | Enhancer mm10 chr8:8,772,171–8,772,912 |
| Genetic reagent (D. rerio) | tg(Gja4-50:EGFP) | This paper | ZFIN:lcr13 | Enhancer mm10 chr4:127,263,607–127,264,323 |
| Genetic reagent (D. rerio) | tg(Unc5b+30:EGFP) | This paper | ZFIN:lcr14 | Enhancer mm10 chr10:60,800,677–60,801,144 |
| Genetic reagent (D. rerio) | tg(Unc5b+39:EGFP) | This paper | ZFIN:lcr15 | Enhancer mm10 chr10:60,792,705–60,793,377 |
| Genetic reagent (D. rerio) | tg(Acvrl1+6:EGFP) | This paper | ZFIN:lcr16 | Enhancer mm10 chr15:101,134,018–101,134,405 |
| Genetic reagent (D. rerio) | tg(Cxcl12+269:EGFP) | This paper | ZFIN:lcr17 | Enhancer mm10 chr6:117,437,567–117,438,123 |
| Genetic reagent (D. rerio) | tg(Gja5-78:EGFP) | This paper | ZFIN:lcr18 | Enhancer mm10 chr3:96,953,659–96,954,322 |
| Genetic reagent (D. rerio) | tg(Gja5-7:EGFP) | This paper | ZFIN:lcr19 | Enhancer mm10 chr3:97,025,305–97,025,791 |
| Genetic reagent (D. rerio) | tg(Nrp1+78:EGFP) | This paper | ZFIN:lcr20 | Enhancer mm10 chr8:128,437,292–128,437,815 |
| Genetic reagent (Mus musculus) | tg(Dll4in3:lacZ) | Sacilotto et al., 2013 | Tg(Rr393-lacZ)#Sav | |
| Recombinant DNA reagent | E1b-GFP-Tol2-Gateway | Ahituv; Birnbaum et al., 2012 | AddGene_#37846 | |
| Recombinant DNA reagent | Hsp68-LacZ-Gateway | Ahituv; Pennacchio et al., 2006 | AddGene_#37843 | |
| Cell line (Homo sapiens) | HUVECs | Lonza | C2519A | Grown in EBM-2 basal medium (Lonza CC-3156) with EBM-2 SingleQuot (Lonza CC-4176) |
| Antibody | IgG control (rabbit monoclonal) | Cell Signaling Technology | CST 66362 | 1:20 (antibody total amount 0.5 µg) |
| Antibody | Sox7 (goat polyclonal) | R&D Systems | AF2766 | 1:50 (antibody total amount 0.4 µg) |
| Antibody | Sox17 (goat polyclonal) | R&D Systems | AF1924 | 1:40 (antibody total amount 0.5 µg) |
| Antibody | Sox18 (mouse monoclonal) | Abnova | H00054345-M05 | 1:100 (antibody total amount 1 µg) |
| Commercial assay or kit | NEBNext(R) Ultra II DNA Library Prep Kit | New England Biolabs | NEB E7645L | Using NEBNext Dual Index Multiplex Oligos NEB E7600S |
| Commercial assay or kit | ChIP DNA Clean & Concentrator kit | Zymo Research | D5205 | |
| Commercial assay or kit | Gateway LR Clonase II Enzyme mix | Thermo Fisher Scientific | 11791100 | |
| Commercial assay or kit | CUT&RUN Kit | Cell Signaling Technologies | CST 86652 | |
| Commercial assay or kit | pCR8/GW/TOPO TA Cloning Kit | Thermo Fisher Scientific | K250020 | |
| Software, algorithm | ZEN 2.3 lite (blue edition) | Zeiss | RRID:SCR_023747 | |
| Software, algorithm | nf-core/cutandrun | Cheshire et al., 2023 | Version 3.1.0 | |
| Software, algorithm | Homer | Heinz et al., 2010 | RRID:SCR_023747 | |
| Software, algorithm | vennRanges | https://rdrr.io/github/antonio-mora/vennRanges/#vignettes; Antonio, 2019 | Version 0.1 | |
| Software, algorithm | FIJI | Schindelin et al., 2012 | RRID:SCR_002285 |
Additional files
Download links
A two-part list of links to download the article, or parts of the article, in various formats.
Downloads (link to download the article as PDF)
Open citations (links to open the citations from this article in various online reference manager services)
Cite this article (links to download the citations from this article in formats compatible with various reference manager tools)
Evaluating the transcriptional regulators of arterial gene expression via a catalogue of characterized arterial enhancers
eLife 14:e102440.
https://doi.org/10.7554/eLife.102440


