DNA replication in primary hepatocytes without the six-subunit ORC
- Dept. of Biochemistry and Molecular Genetics, University of Virginia, United States
- Dept. of Genetics, University of Alabama at Birmingham, United States
- Cancer Center, University of Wisconsin in Milwaukee, United States
Figures
Figure 1
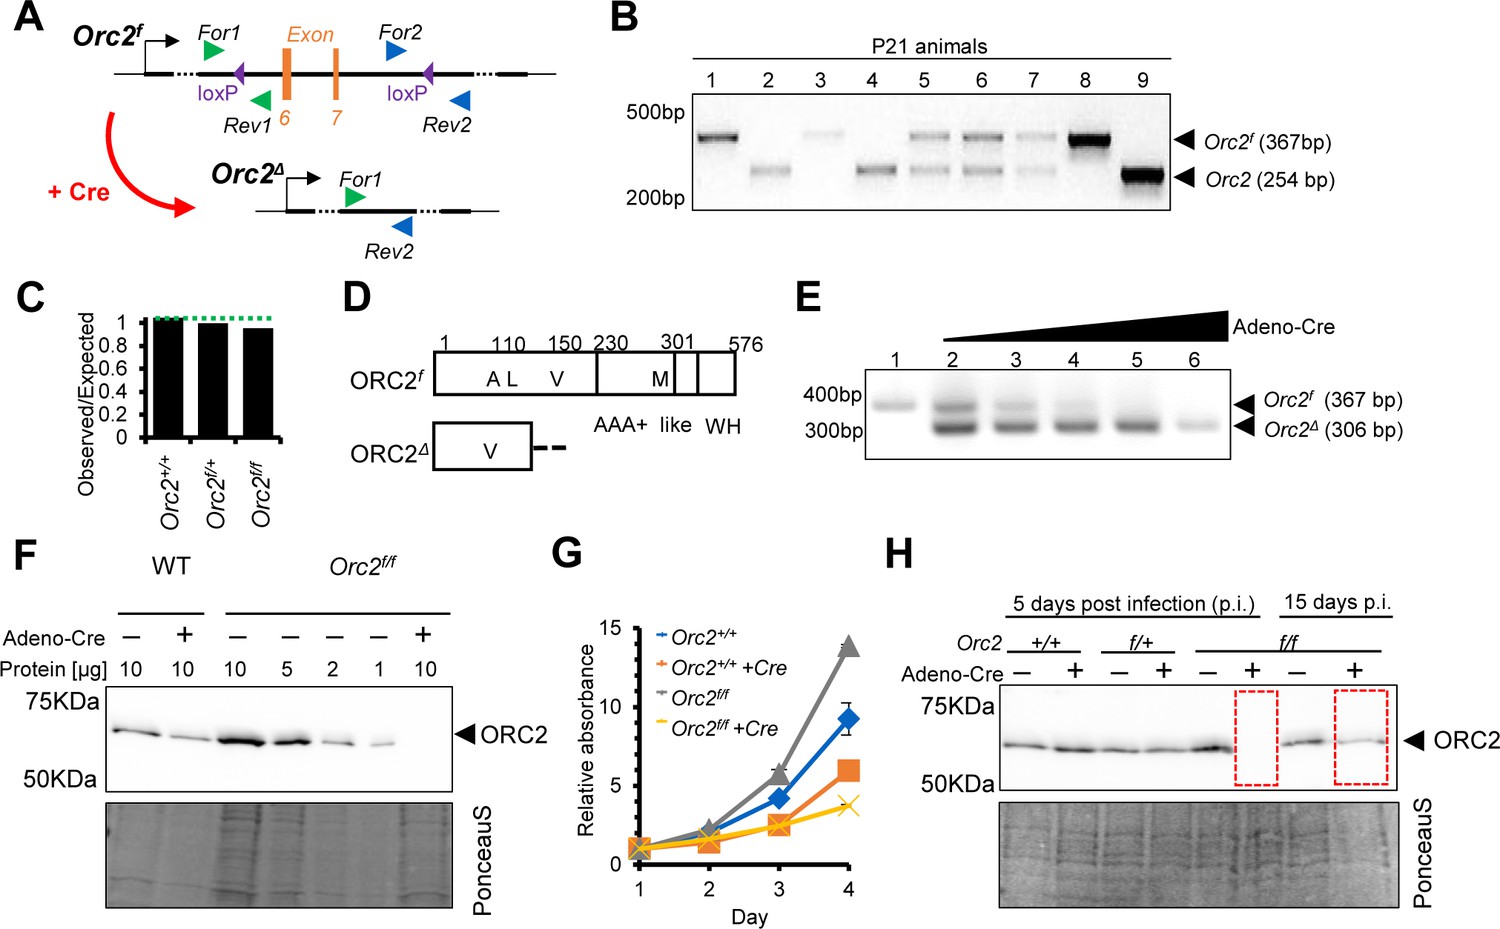
Generation of Orc2f/f mice and ORC2 knockout (KO) mouse embryo fibroblasts (MEFs).
(A) Scheme of introduced loxP sites in Orc2 locus. (B) Representative picture of genotyping of offspring coming from Orc2f/+ crossed with Orc2f/+. (C) The ratio of observed to expected animals coming from Orc2f/+ crossed with Orc2f/+. (D) Schematic of the ORC2 protein and the DeltaORC2 protein produced after deletion of exons 6 and 7. A110 is mutated to V110 and then the protein goes out of frame. (E) Validation of Orc2 deletion 3 d after Adeno cre transduction. (F) Western blot of ORC2 protein 5 d after Adeno cre transduction. 10 or indicated μl of lysate loaded/lane as written on the top. (G) MTT assay of WT and Orc2f/f MEFs without and with Adeno cre transduction. (H) Western blot of ORC2 protein 5 and 15 d after Adeno Cre transduction.
-
Figure 1—source data 1
PDF file containing original DNA gel picture corresponding to Figure 1, panel B, indicating the relevant bands and individual animals.
- https://cdn.elifesciences.org/articles/102915/elife-102915-fig1-data1-v1.zip
-
Figure 1—source data 2
Original image for Figure 1, panel B.
- https://cdn.elifesciences.org/articles/102915/elife-102915-fig1-data2-v1.zip
-
Figure 1—source data 3
PDF file containing original DNA gel picture corresponding to Figure 1, panel E, indicating the relevant bands and increasing Adeno-Cre.
- https://cdn.elifesciences.org/articles/102915/elife-102915-fig1-data3-v1.zip
-
Figure 1—source data 4
Original image for Figure 1, panel E.
- https://cdn.elifesciences.org/articles/102915/elife-102915-fig1-data4-v1.zip
-
Figure 1—source data 5
PDF file containing original Western blot membrane picture corresponding to Figure 1, panel F, indicating the relevant bands and addition of Adeno-Cre.
- https://cdn.elifesciences.org/articles/102915/elife-102915-fig1-data5-v1.zip
-
Figure 1—source data 6
Original image for Figure 1, panel F.
- https://cdn.elifesciences.org/articles/102915/elife-102915-fig1-data6-v1.zip
-
Figure 1—source data 7
PDF file containing original Western blot membrane picture corresponding to Figure 1, panel H, indicating the relevant bands and ORC2 protein expression.
- https://cdn.elifesciences.org/articles/102915/elife-102915-fig1-data7-v1.zip
-
Figure 1—source data 8
Original image for Figure 1, panel H.
- https://cdn.elifesciences.org/articles/102915/elife-102915-fig1-data8-v1.zip
Figure 2 with 1 supplement
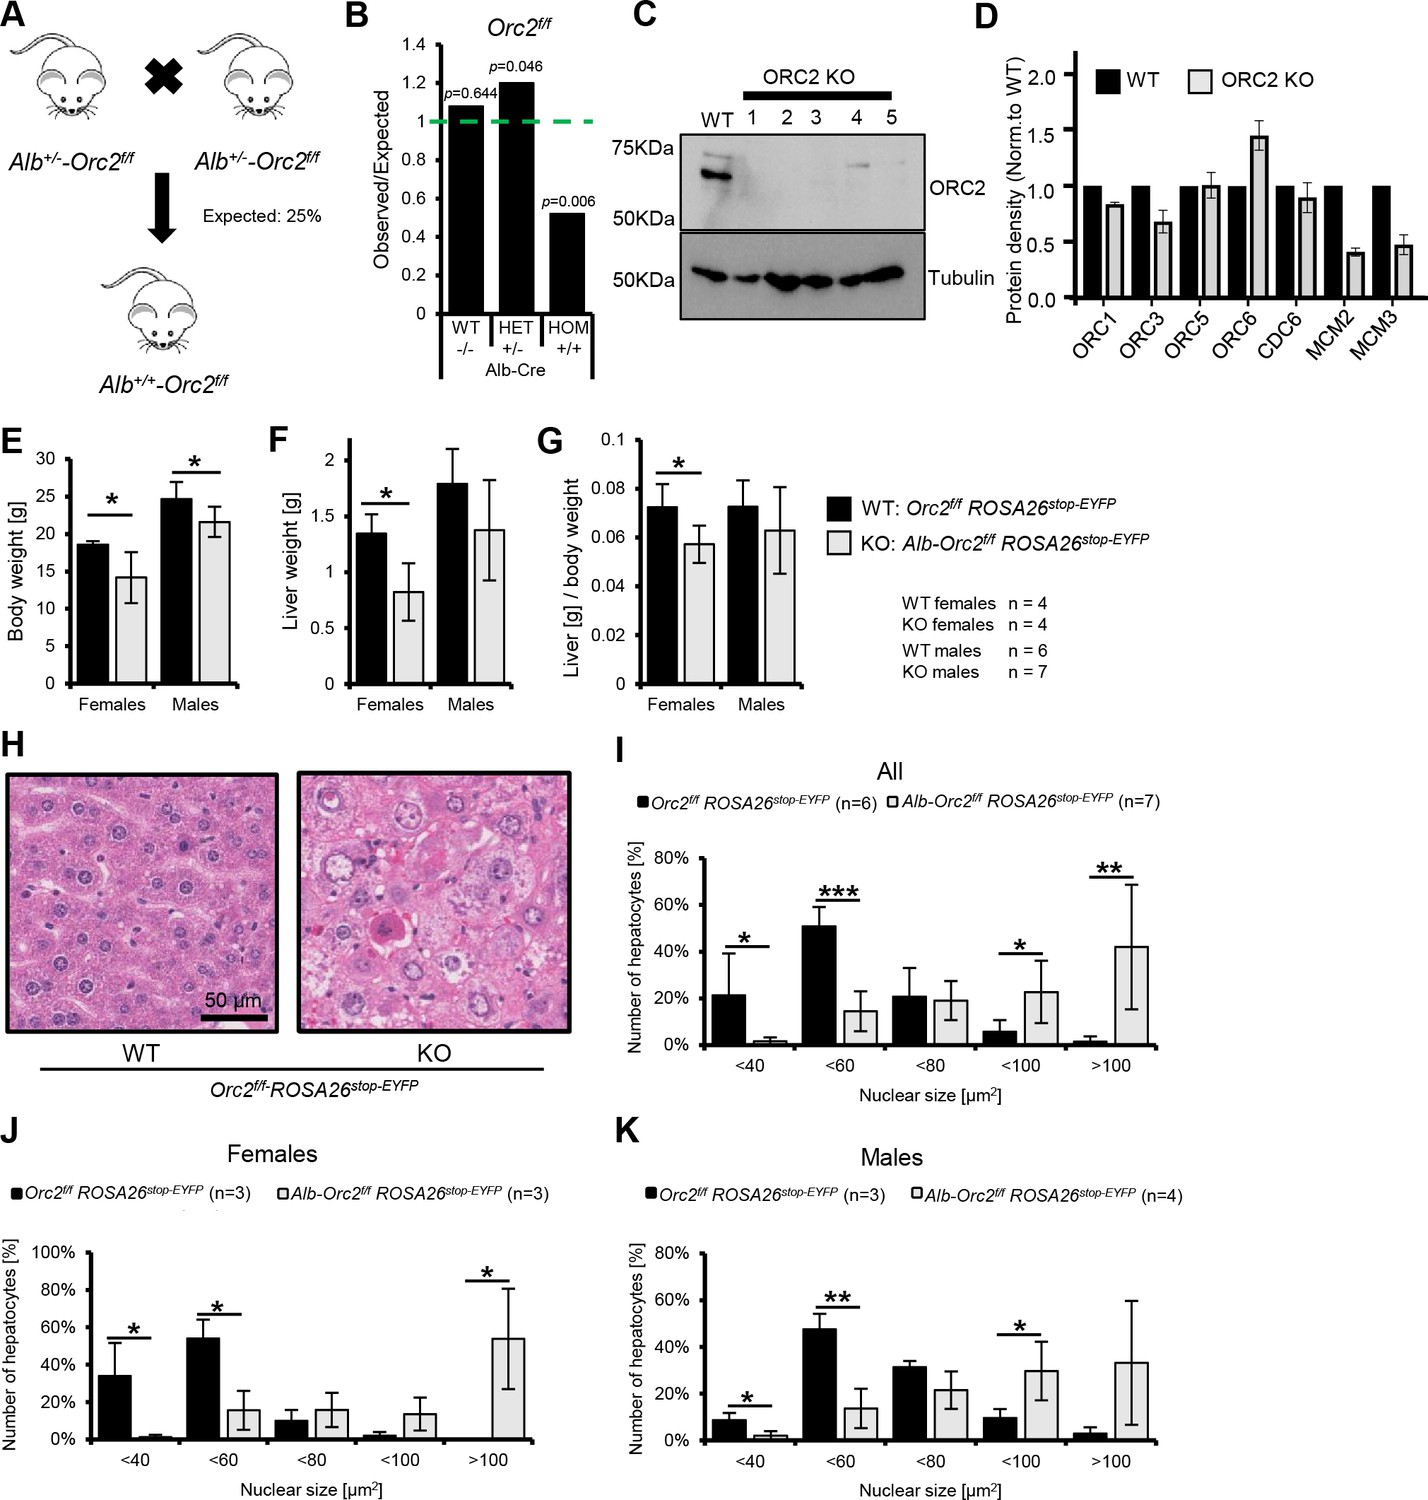
Development of liver in Orc2 KO mice.
(A) Scheme of Alb+/--Orc2f/f ROSA26stop-EYFP crossed with Alb+/--Orc2f/f ROSA26stop-EYFP (All mice are with ROSA26stop-EYFP and so we do not include this in the genotypes below). (B) The ratio of observed to expected animals coming from A. (C) Western blot of hepatocytes from Orc2f/f and Alb+/--Orc2f/f animals. Tubulin was used as loading control. (D) Quantification of the Western blots of hepatocyte lysates from Orc2 f/f (without Alb-cre) mice and the same genotype but with Alb-Cre to show the levels of other key replication initiation proteins in the ORC2 KO hepatocytes. (E) Average body weight of Orc2f/f and Alb-Orc2f/f animals. (F) Average liver weight of Orc2f/f and Alb-Orc2f/f animals. (G) Average liver-to-body weight ratio of Orc2f/f and Alb-Orc2f/f animals. (H) Representative H&E staining of liver tissue from Orc2f/f (WT) and Alb-Orc2f/f (KO) animals. Both panels at same scale. (I) Quantification of hepatocyte nuclear size in Orc2f/f and Alb-Orc2f/f animals. (J) Quantification of hepatocyte nuclear size in Orc2f/f and Alb-Orc2f/f female mice. (K) Quantification of hepatocytes nuclear size in Orc2f/f and Alb-Orc2f/f male mice. *p<0.05, **p<0.01, two-tailed Student’s t-test.
-
Figure 2—source data 1
Original Western blot membrane picture corresponding to Figure 2, panel C.
Molecular weight markers are labeled on the left. The bands next to the arrow represent ORC2 protein.
- https://cdn.elifesciences.org/articles/102915/elife-102915-fig2-data1-v1.zip
-
Figure 2—source data 2
Original image for Figure 2, panel C.
- https://cdn.elifesciences.org/articles/102915/elife-102915-fig2-data2-v1.zip
-
Figure 2—source data 3
Original Western blot membrane picture corresponding to Figure 2, panel C.
Molecular weight markers are labeled on the left. The bands next to the arrow represent Tubulin protein.
- https://cdn.elifesciences.org/articles/102915/elife-102915-fig2-data3-v1.zip
-
Figure 2—source data 4
Original image for Figure 2, panel C.
- https://cdn.elifesciences.org/articles/102915/elife-102915-fig2-data4-v1.zip
Figure 2—figure supplement 1
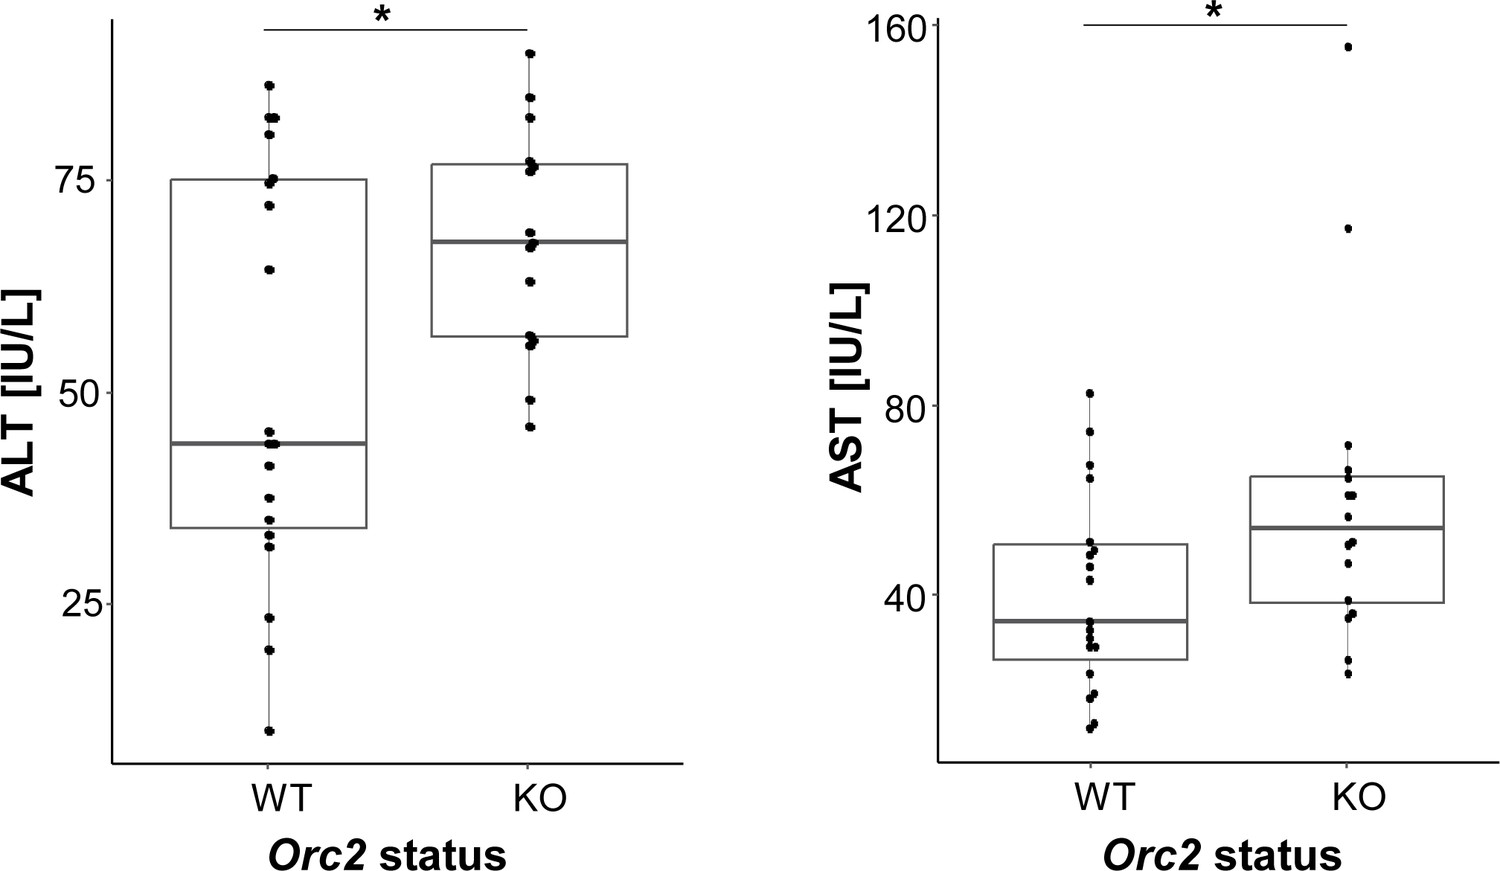
Serum liver enzymes in ORC2 wild-type (Orc2f/f) and Orc2 KO (Alb-Orc2f/f) mice.
*p<0.05, two-tailed homoscedastic Student’s t-test.
Figure 3
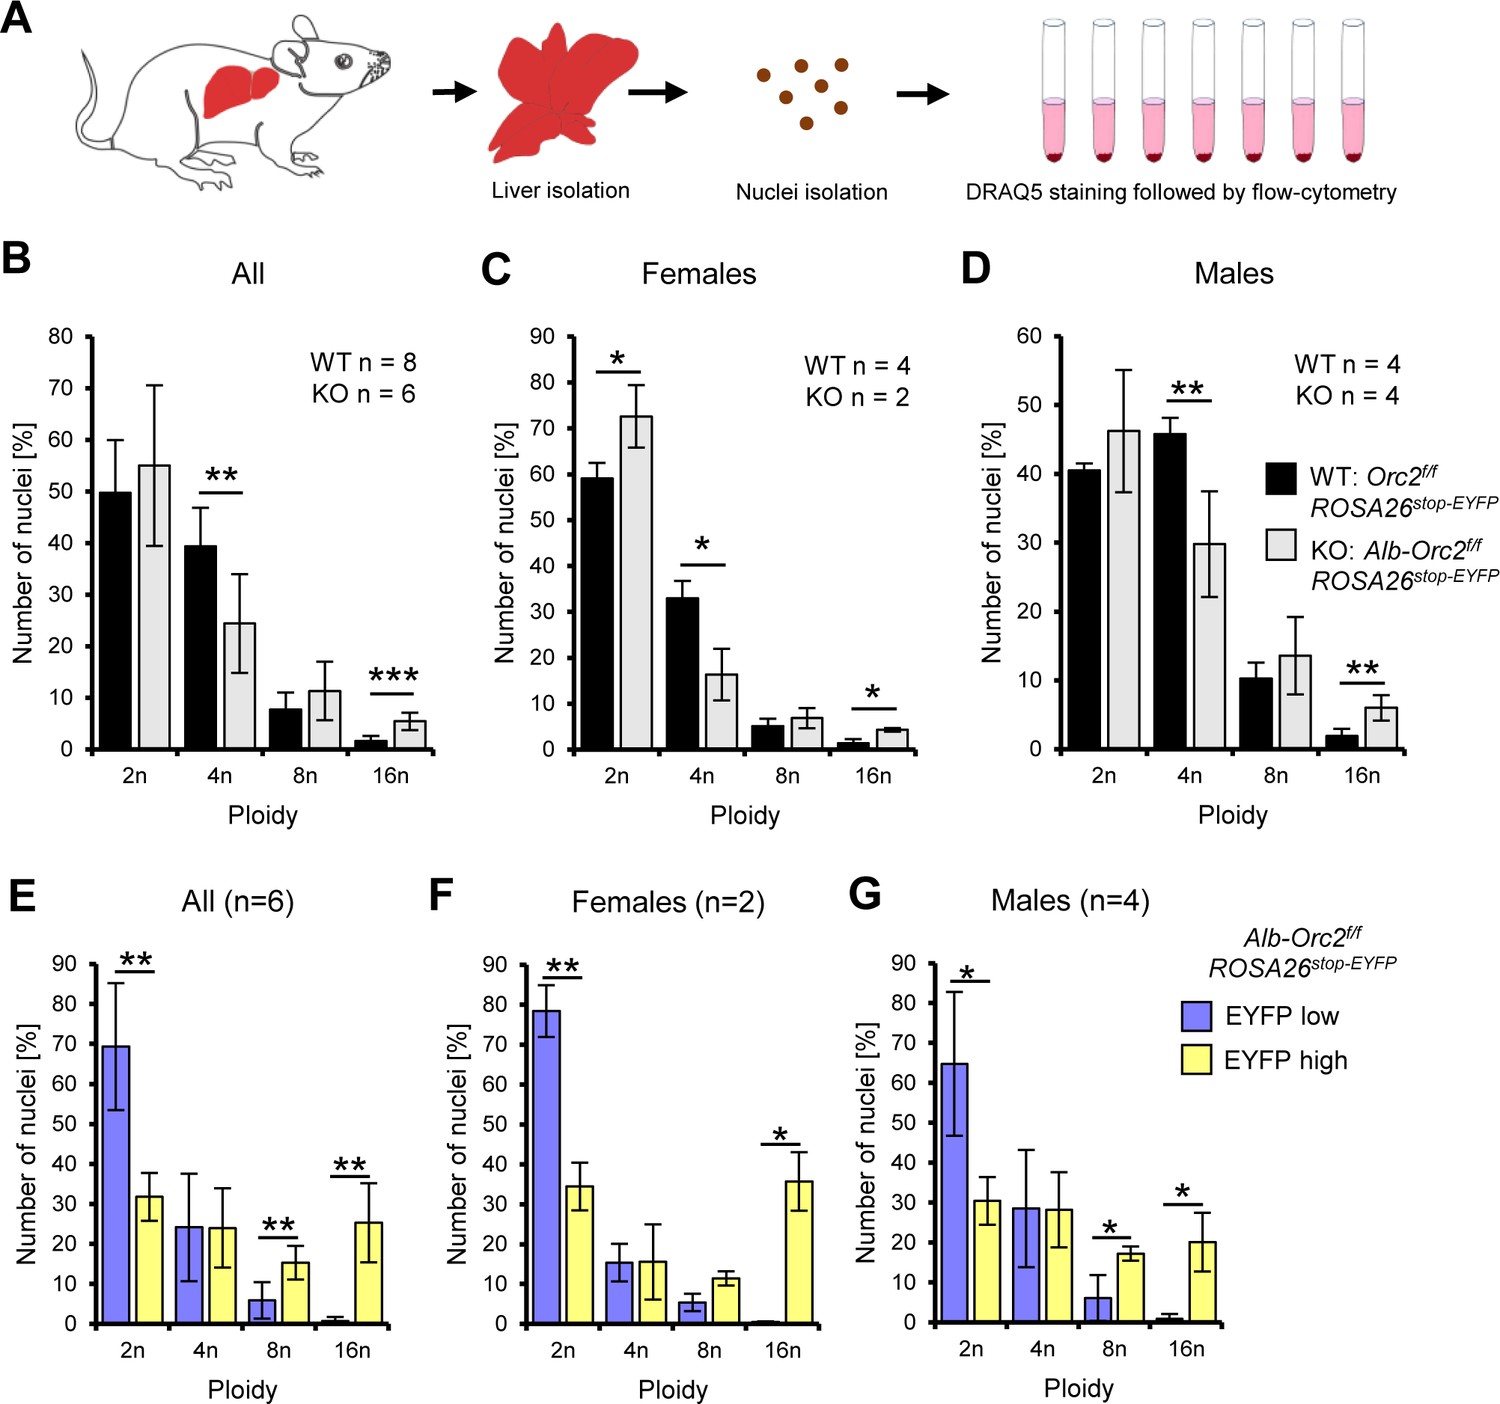
Endoreduplication in the ORC2 liver conditional knock-out animals.
(A) Experimental design. (B–D) Quantification of nuclei ploidy on 10,000 nuclei from the livers of Orc2f/f ROSA26stop-EYFP and Alb-Orc2f/f ROSA26stop-EYFP animals. (E–G) Quantification of nuclei ploidy for EYFP low (includes negative) and high (positive) primary liver cells. *p<0.05, **p<0.01, ***p<0.001, two-tailed Student’s t-test.
Figure 4
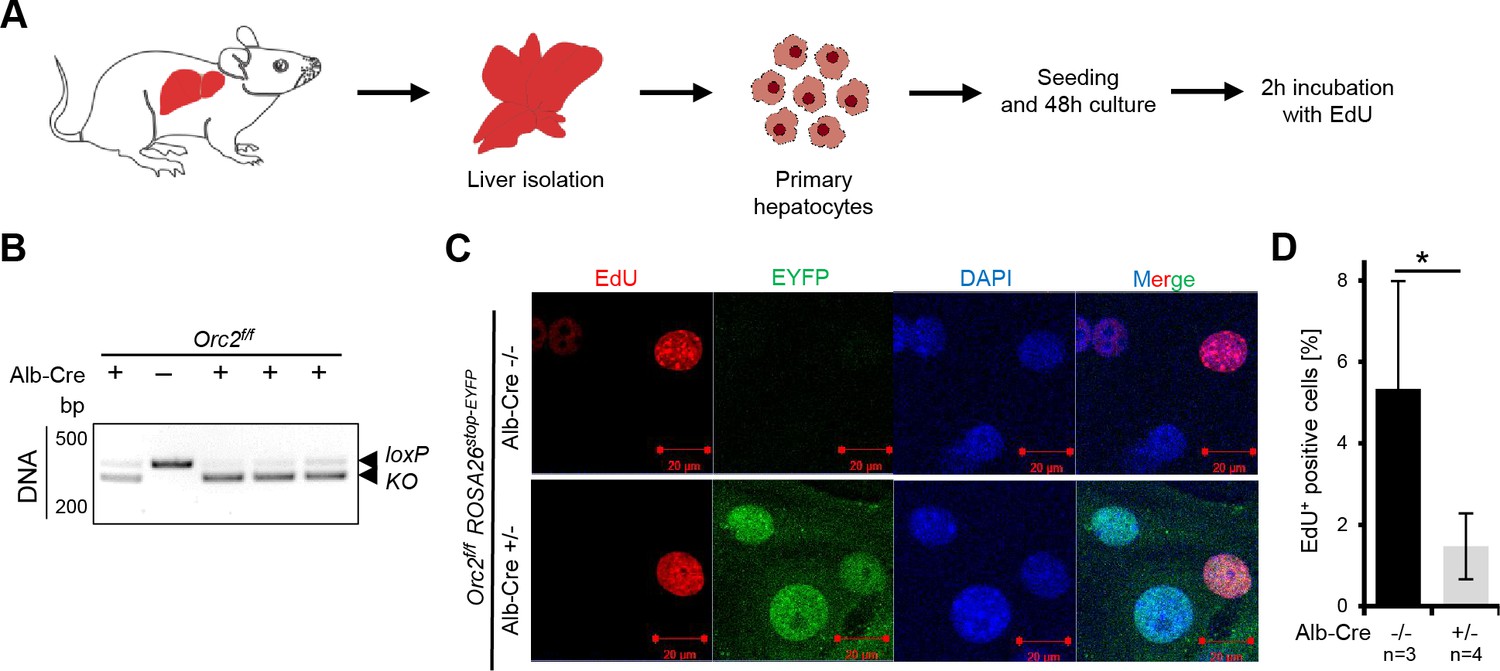
Orc2 KO primary hepatocytes are viable and can incorporate EdU in vitro.
(A) Experimental design. (B) Genotyping and western blotting of hepatocytes. (C) Representative picture of EdU, EYFP and DAPI staining on the Orc2 WT (Orc2f/f) and KO (Orc2f/f Alb-Cre) primary hepatocytes. (D) The percentage of EdU positive nuclei from Orc2 WT or Orc2 KO primary hepatocytes. *p < 0.05, two-tailed Student’s t test.
-
Figure 4—source data 1
PDF file containing original DNA gel picture corresponding to Figure 4, panel B, indicating the relevant bands and individual animals.
- https://cdn.elifesciences.org/articles/102915/elife-102915-fig4-data1-v1.zip
-
Figure 4—source data 2
Original image for Figure 4, panel B.
- https://cdn.elifesciences.org/articles/102915/elife-102915-fig4-data2-v1.zip
Figure 5
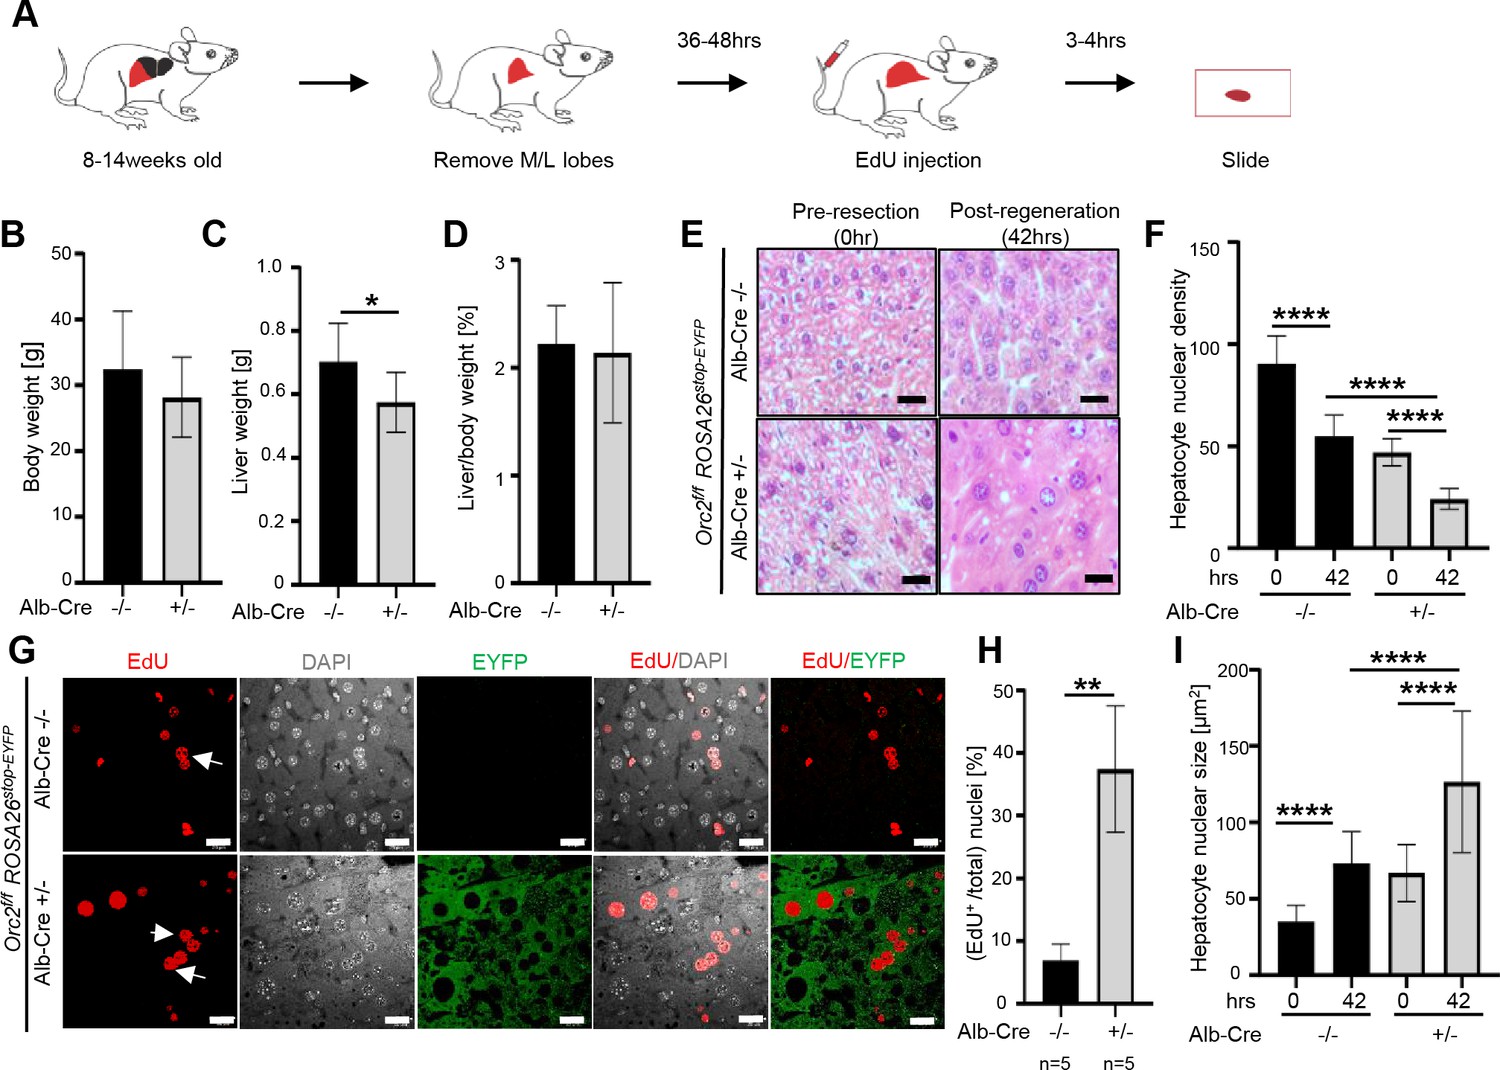
The ORC2 mutant livers regenerate after partial hepatectomy.
(A) Schematic of the experiment. (B) Body weight of the Orc2f/f ROSA26stop-EYFP mice without (-/-) or with Alb-Cre (+/-) before partial hepatectomy. (C) Liver weight of the mice in B after liver regeneration. (D) Regenerated liver to pre-hepatectomy body weight ratio of the mice in B. (E) H&E stain of Orc2f/f ROSA26stop-EYFP livers with intact Orc2 (Alb-cre-/-, N=3) or Orc2 knockout (Alb-cre+/-, N=7). Scale bar: 25 μm. (F) Quantitation of nuclear counts per field (76,000 μm2). Six images were taken for each liver. 0 hr (pre-resection). 42 hr (post-regeneration). (G) EdU incorporation of indicated livers. EYFP marks cells where Cre has been expressed. Orc2 (Alb-cre-/-, N=5) or Orc2 knockout (Alb-cre+/-, N=5). Scale bar: 25 μm. (H) Percent EdU+ nuclei counted in 1882 and 825 nuclei in the Cre- and Cre+ livers, respectively. (I) Nuclear size of indicated livers. 0 hr (pre-resection). 42 hr (post-regeneration). Mean and S.D from about 40–70 nuclei, *p<0.05, ****p<0.0001, unpaired two-tailed Student’s t test is used.
Figure 6 with 2 supplements

Endoreduplication in liver of Orc1 Orc2 DKO animals.
(A–B) Breeding schemes to obtain conditional double flox animals. (C) The ratio of observed to expected animals coming from B. Orc1=all animals with Orc1f/f ROSA26stop-EYFP, Orc2=all animals with Orc2f/f ROSA26stop-EYFP, Orc1 Orc2=all animals with Orc1f/f Orc2f/f ROSA26stop-EYFP genotype. This was before the introduction of Alb-Cre. (D) Immunoblot of hepatocytes from WT (Orc1f/f Orc2f/f) and DKO (Orc1f/f Orc2f/f Alb-cre+/-) mice to show that ORC1 and ORC2 are depleted in the DKO cells. (E) Quantitation of immunoblots to show that levels of other key initiation protein subunits are not decreased in the DKO mice hepatocytes. (F) Average body, liver weight, and their ratio for WT and DKO animals. (G) Representative H&E staining of liver tissue from male WT and DKO animals. (H) Quantification of hepatocyte nuclear size in the WT and DKO animals. (I) Quantification of nuclei ploidy for EYFP low (includes negative) and high (positive) primary liver cells from DKO mice.
-
Figure 6—source data 1
PDF file containing original Western blot membrane picture corresponding to Figure 6, panel D, indicating the relevant bands, ORC1 protein expression, and individual animals.
- https://cdn.elifesciences.org/articles/102915/elife-102915-fig6-data1-v1.zip
-
Figure 6—source data 2
Original image for Figure 6 panel D, ORC1 protein expression, and individual animals.
- https://cdn.elifesciences.org/articles/102915/elife-102915-fig6-data2-v1.zip
-
Figure 6—source data 3
PDF file containing original Western blot membrane picture corresponding to Figure 6, panel D, indicating the relevant bands, ORC2 protein expression, and individual animals.
- https://cdn.elifesciences.org/articles/102915/elife-102915-fig6-data3-v1.zip
-
Figure 6—source data 4
Original image for Figure 6 panel D, ORC2 protein expression, and individual animals.
- https://cdn.elifesciences.org/articles/102915/elife-102915-fig6-data4-v1.zip
-
Figure 6—source data 5
PDF file containing original Western blot membrane picture corresponding to Figure 6, panel D, indicating the relevant bands, HSP90 protein expression, and individual animals.
- https://cdn.elifesciences.org/articles/102915/elife-102915-fig6-data5-v1.zip
-
Figure 6—source data 6
Original image for Figure 6 panel D, HSP90 protein expression, and individual animals.
- https://cdn.elifesciences.org/articles/102915/elife-102915-fig6-data6-v1.zip
Figure 6—figure supplement 1
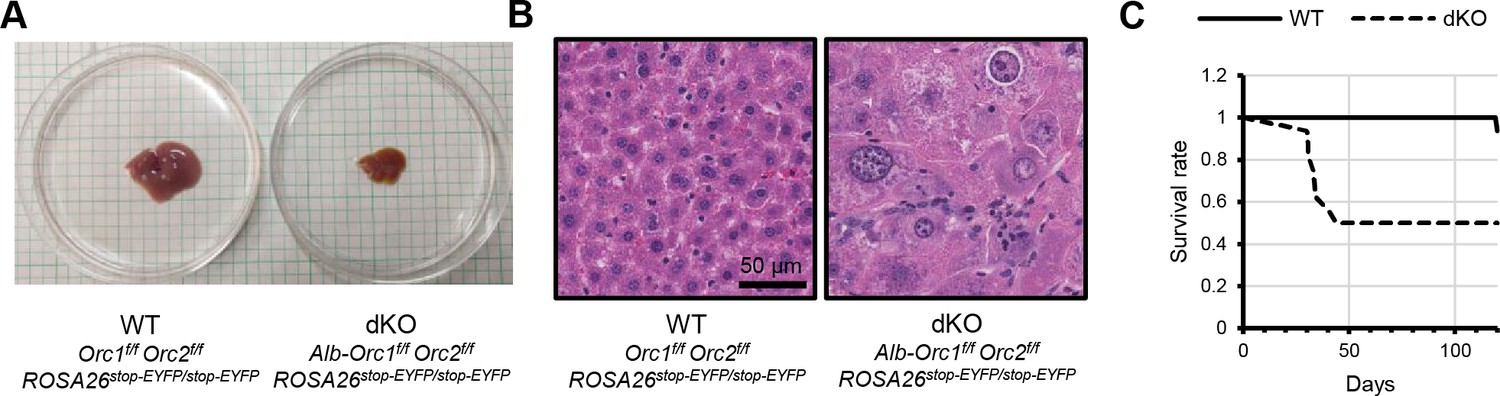
Orc1 Orc2 deletion produces smaller livers with larger nuclei and more mortality in female mice.
(A) Representative picture of livers of female Orc1 Orc2 WT and liver-specific double KO (dKO). (B) Representative H&E staining of liver tissue from Orc1f/f Orc2f/f ROSA26stop-EYFP (WT) and Alb-Orc1f/f Orc2f/f ROSA26stop-EYFP (dKO) females. (C) Kaplan-Meier plot for Alb-Orc1f/f Orc2f/f ROSA26stop-EYFP (dKO) females postnatally.
Figure 6—figure supplement 2
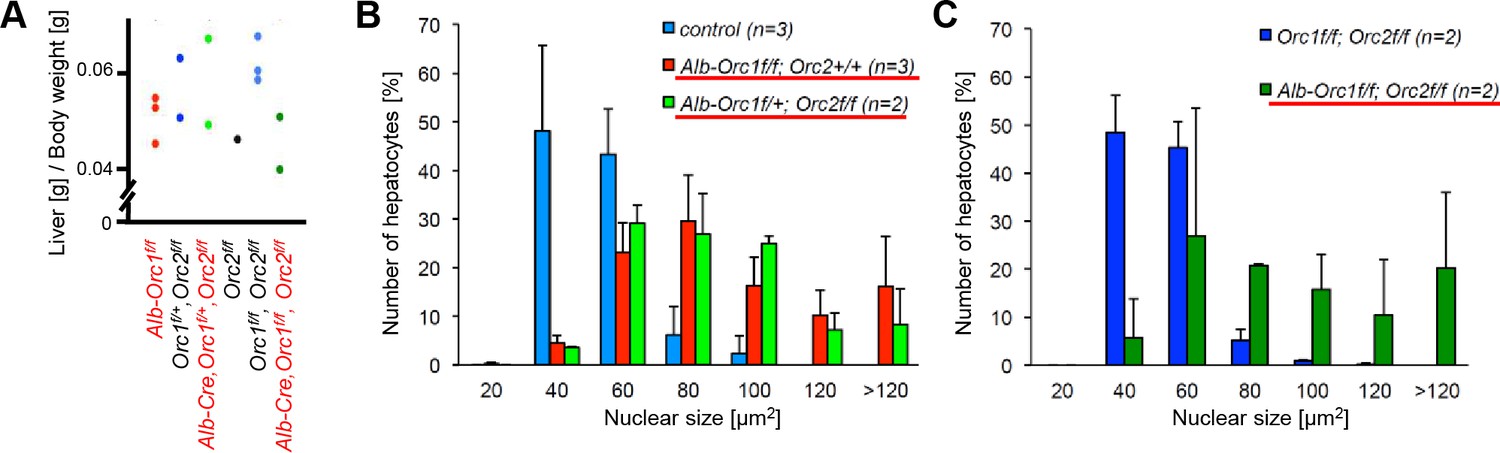
From an independent breeding experiment to generate mice with Orc1-/-; Orc2-/- and Orc1-/-, Orc2-/- livers.
(A) Ratio of liver weight to body weight for mice at 6 wk of age. The Orc1 mutant, Orc2 mutant or double mutant mice are in red. (B) Enlarged nuclei seen in 6 wk mouse livers in mice expressing Alb-Cre where both alleles of one ORC subunit are floxed (underlined): Orc1f/f or Orc2f/f. (C) Enlarged nuclei seen in 6 wk mouse livers in mice expressing Alb-Cre where both alleles of two ORC subunits are floxed (underlined): Orc1f/f Orc2f/f.
Figure 7
Endoreduplication in the liver of the DKO mice during liver regeneration.
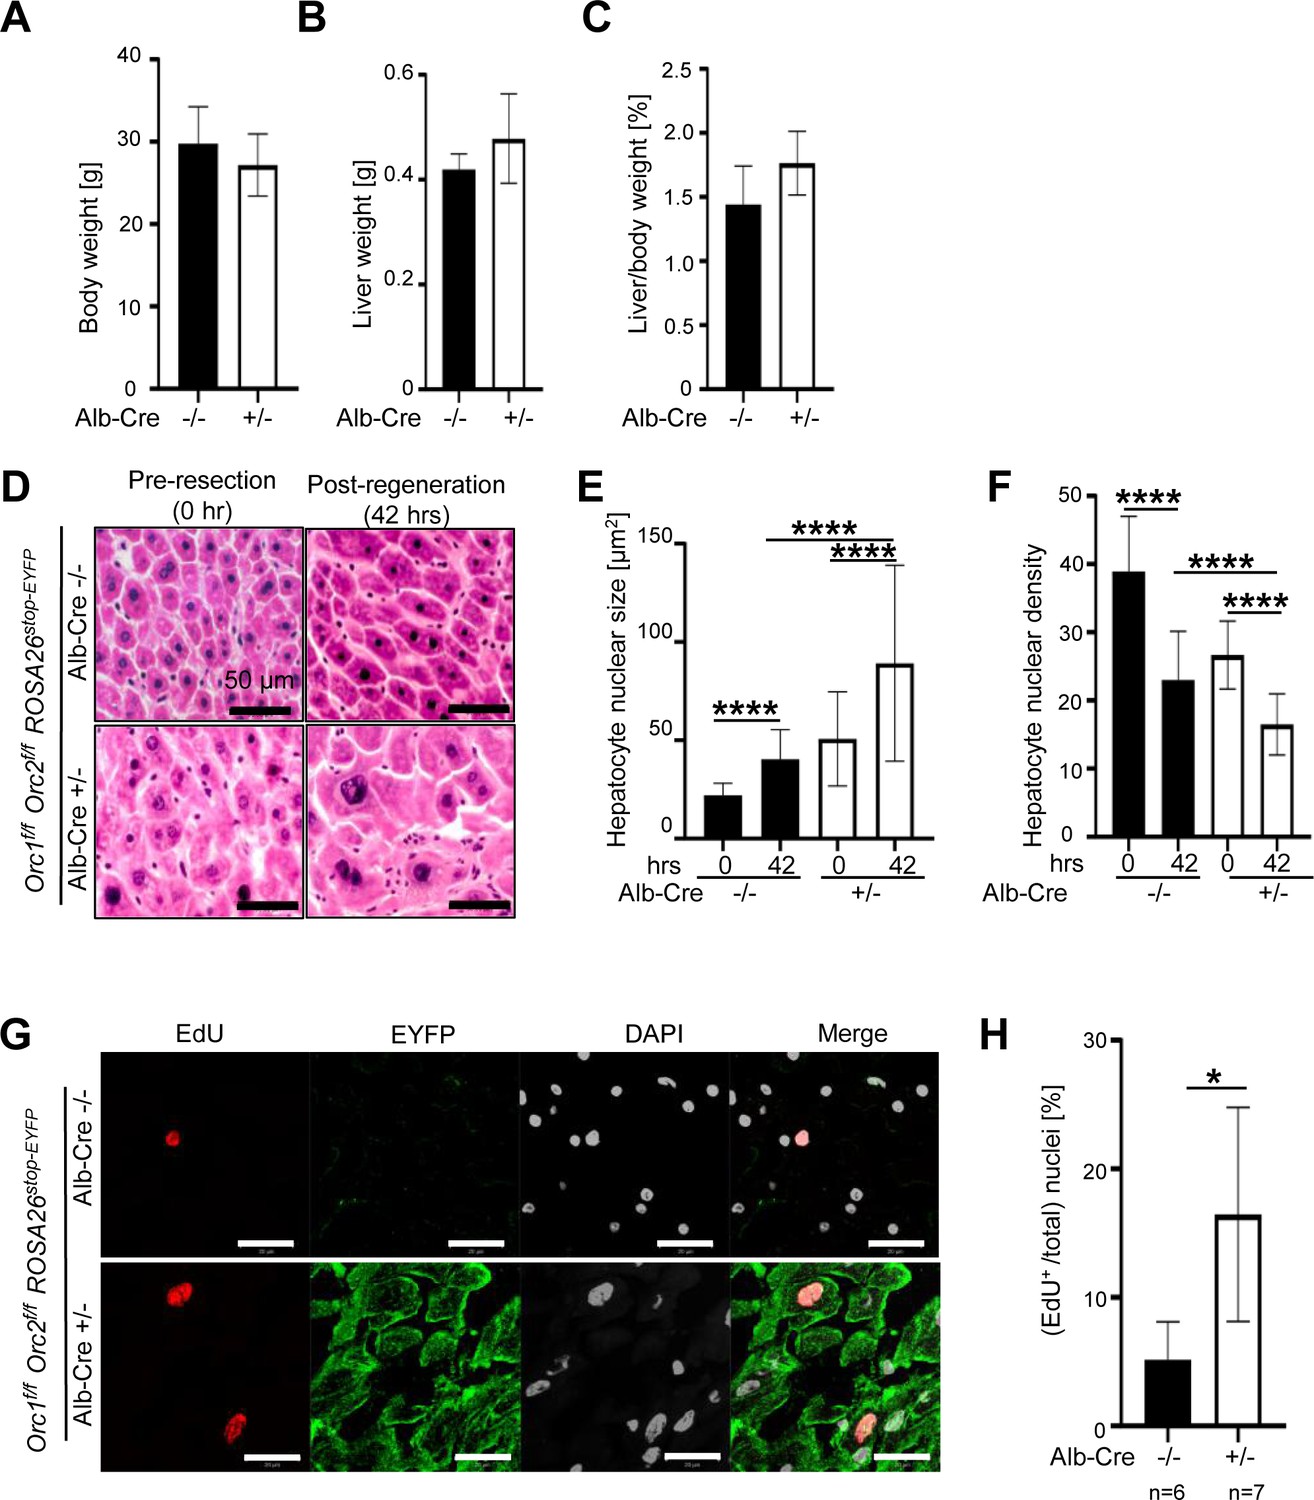
(A–C) Body weight pre-resection, liver weight post-regeneration, and regenerated liver to body weight ratio in mice with indicated genotypes. Black bars: 4 wild-type (WT) males (Orc1f/f Orc2f/f ROSA26stop-EYFP mice without Alb-Cre). White bars: 6 dKO males (Orc1f/f Orc2f/f ROSA26stop-EYFP mice with Alb-Cre+/-). No significant difference between the two groups using two-tailed Student t-test. (D) H&E stain of WT (N=4) or DKO mice (N=6). Scale bar: 50 μm. (E) Quantitation of hepatocyte nuclear size post regeneration. WT: black bars. DKO: white bars. 0 hr (pre-resection). 42 hr (post-regeneration). Five-six images were taken for each liver. About 120–200 nuclei are counted. (F) Quantitation of hepatocyte nuclear density post regeneration. WT: black bars. DKO: white bars. 0 hr (pre-resection). 42 hr (post-regeneration). Five-six images were taken for each liver. (G) Micrographs of EdU, DAPI and EYFP imaging of livers with indicated genotypes post regeneration. WT (N=6) and DKO mice (N=7). Scale bar: 20 μm. WT in the top row, DKO in the bottom row. (H) Quantitation of EdU positive nuclei post regeneration. WT: black bar. DKO: white bar. Five-six images were taken for each liver. *p<0.05, ****p<0.0001, unpaired two-tailed Student’s t-test were used.
Tables
Table 1
Embryonic lethality of Orc2 KO.
The Orc2Δ allele was created by expressing Cre recombinase from a Sox2 promoter in the Orc2f/f embryos.
| Offspring from Orc2+/Δ intercrosses | |||||
|---|---|---|---|---|---|
| Genotype | Empty decidua | total # (litters) | |||
| Stage | Orc2+/+ | Orc2+/Δ | OrcΔ /Δ | ||
| E3.5 | 18 | 30 | 6 | 6 (n.d) | 60 (6) |
| E7.5 | 9 | 21 | 0 | 16 | 46 (5) |
| E13.5 | 9 | 31 | 0 | 15 | 55 (6) |
| 2 wk | 52 | 115 | 0 | - | 167 (27) |
Table 2
Estimate of number of hepatocyte nuclei in adult mice of indicate genotypes and thus, number of hepatocyte nuclear divisions required after E9.5 mouse embryos.
| WT | Orc2 -/- | Orc1 -/-Orc2 -/-(Females) | Orc1 -/-Orc2 -/-(Males) | |
|---|---|---|---|---|
| Liver weight | 100% | 50–70% | 30% | 47% |
| Hepatocyte nuclear density | 1 | 0.5 | 0.1 | 0.66 |
| Total nuclei in liver (normalized to WT) | 100 | 25–37.5 | 3 | 31 |
| Deficit in # cell division | 0 | 1–2 | 5 | 1–2 |
| Number of nuclear divisions since E9.5 | 20 | 18 | 15 | 19 |
Additional files
-
MDAR checklist
- https://cdn.elifesciences.org/articles/102915/elife-102915-mdarchecklist1-v1.pdf
-
Source data 1
source data for all figures.
- https://cdn.elifesciences.org/articles/102915/elife-102915-data1-v1.xlsx
Download links
A two-part list of links to download the article, or parts of the article, in various formats.
Downloads (link to download the article as PDF)
Open citations (links to open the citations from this article in various online reference manager services)
Cite this article (links to download the citations from this article in formats compatible with various reference manager tools)
DNA replication in primary hepatocytes without the six-subunit ORC
eLife 13:RP102915.
https://doi.org/10.7554/eLife.102915.3


