Magnetically steered cell therapy for reduction of intraocular pressure as a treatment strategy for open-angle glaucoma
- Woodruff School of Mechanical Engineering, Georgia Institute of Technology, United States
- School of Chemistry and Biochemistry, Georgia Institute of Technology, United States
- Wallace H. Coulter Department of Biomedical Engineering, Georgia Institute of Technology/Emory University, United States
- Department of Ophthalmology, Duke University, United States
- Department of Ophthalmology and Visual Sciences, The University of Iowa, United States
- Veterans Administration Center for the Prevention and Treatment of Visual Loss, Iowa City VA Healthcare System, United States
- Department of Medical Engineering, University of South Florida, United States
- Departments of Ophthalmology and Pathology, Emory University School of Medicine, United States
- School of Electrical and Computer Engineering, Georgia Institute of Technology, United States
- Department of Biomedical Engineering, Duke University, United States
Figures
Figure 1
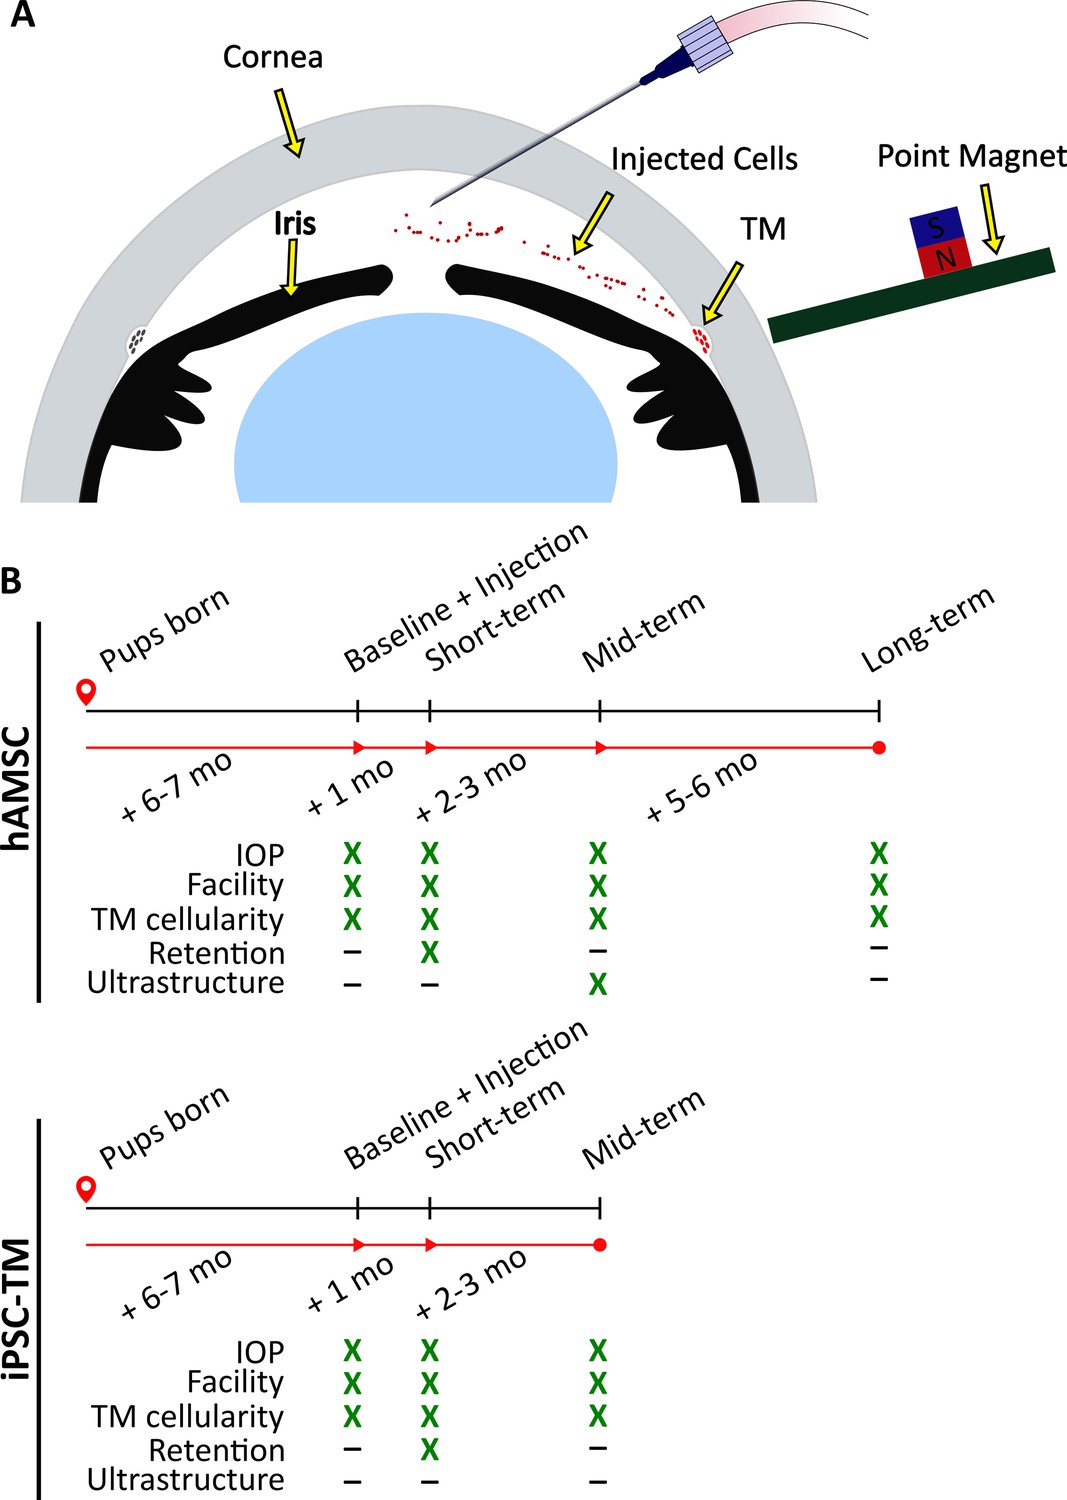
Experimental schematic and design.
(A) Schematic of magnetically steered cell delivery to the trabecular meshwork (TM). As cells are injected into the anterior chamber at a low flow rate, the experimenter places the ‘point magnet’ (Bahrani Fard et al., 2023) on the limbus and carefully drags the cells toward the iridocorneal angle, targeting the TM. Features of the figure are not drawn to scale. (B) Timeline of the experiments. An ultrastructural analysis, specifically the quantification of inner wall basement membrane fenestrations, was not undertaken for eyes receiving induced pluripotent cell derivatives (iPSC-TMs) due to their inferior performance. Additionally, cell retention in the anterior chamber was only investigated at the short term. Note that baseline measurements were taken for wild-type (WT) and transgenic animals that did not necessarily receive an injection afterward. Refer to Materials and methods for a description of various experimental groups and further details.
Figure 2
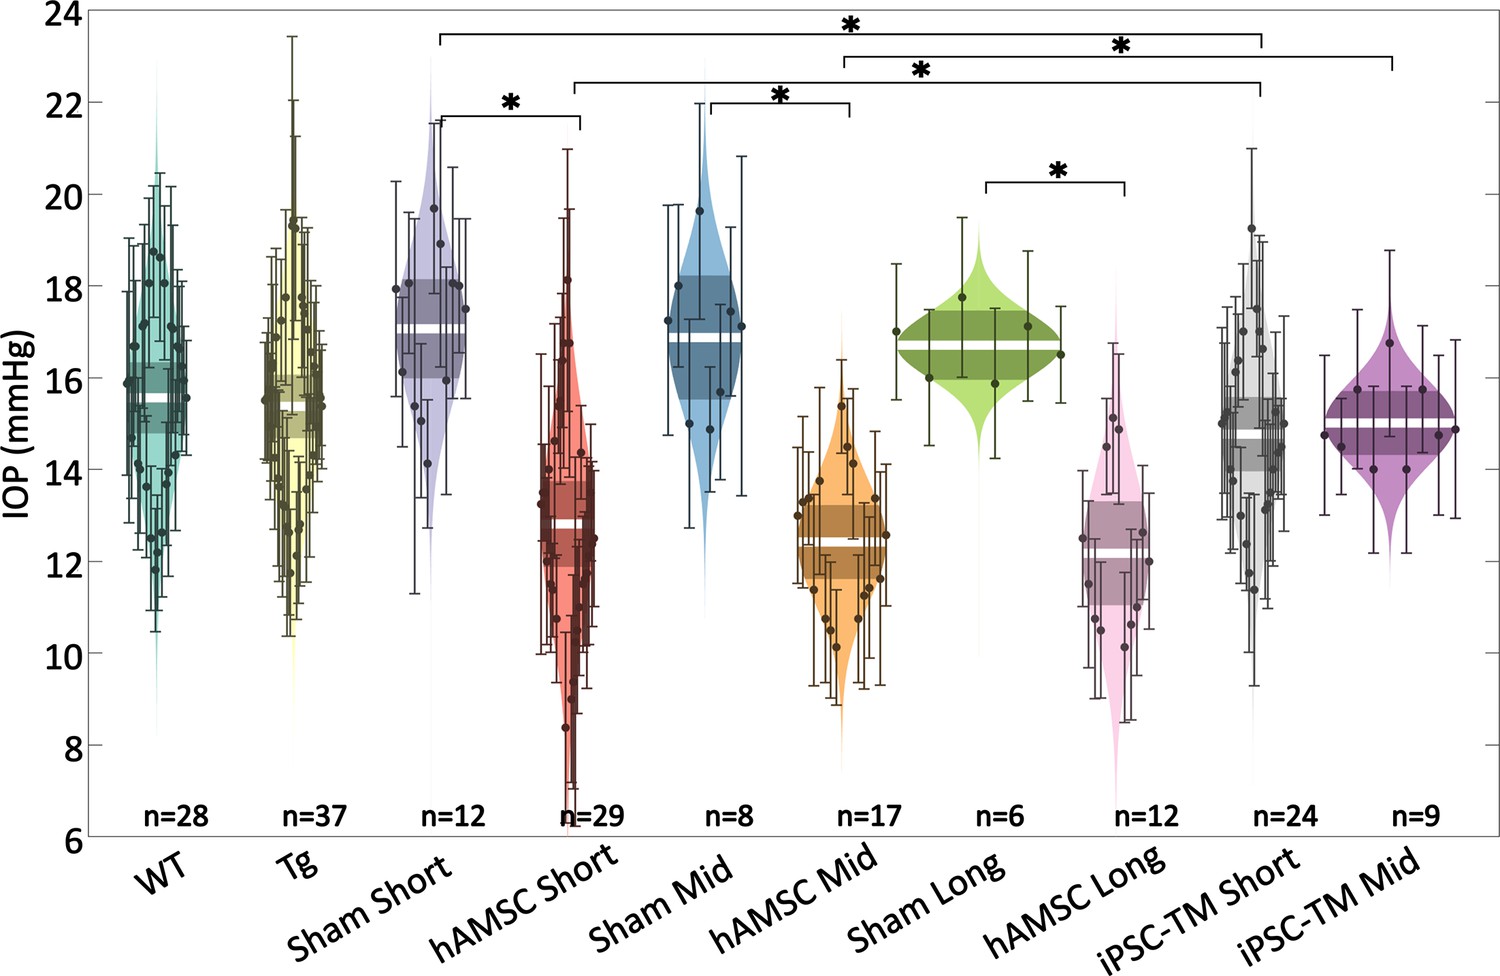
Intraocular pressure (IOP) was reduced by targeted cell delivery to the trabecular meshwork (TM).
In each experimental cohort, the central white strip indicates the mean, while the darker region represents the 95% confidence interval on the mean. The colored region shows the distribution. Dots represent individual eyes, with error bars demarcating the 95% confidence intervals. For further information on experimental groups and statistical analysis, refer to text. * with Bonferroni correction (see Table 2). See below for a more complete statistical analysis. WT: wild-type hybrid mice (naïve control), Tg: Tg- MYOCY437H mice, sham: Tg mice receiving saline injection, human adipose-derived mesenchymal stem cell (hAMSC): Tg mice receiving magnetically steered hAMSCs, induced pluripotent cell derivative (iPSC-TM): Tg mice receiving magnetically steered iPSC-TMs. ‘Short’, ‘mid’, and ‘long’ refer to time points. n is the number of eyes measured in each group.
Figure 3
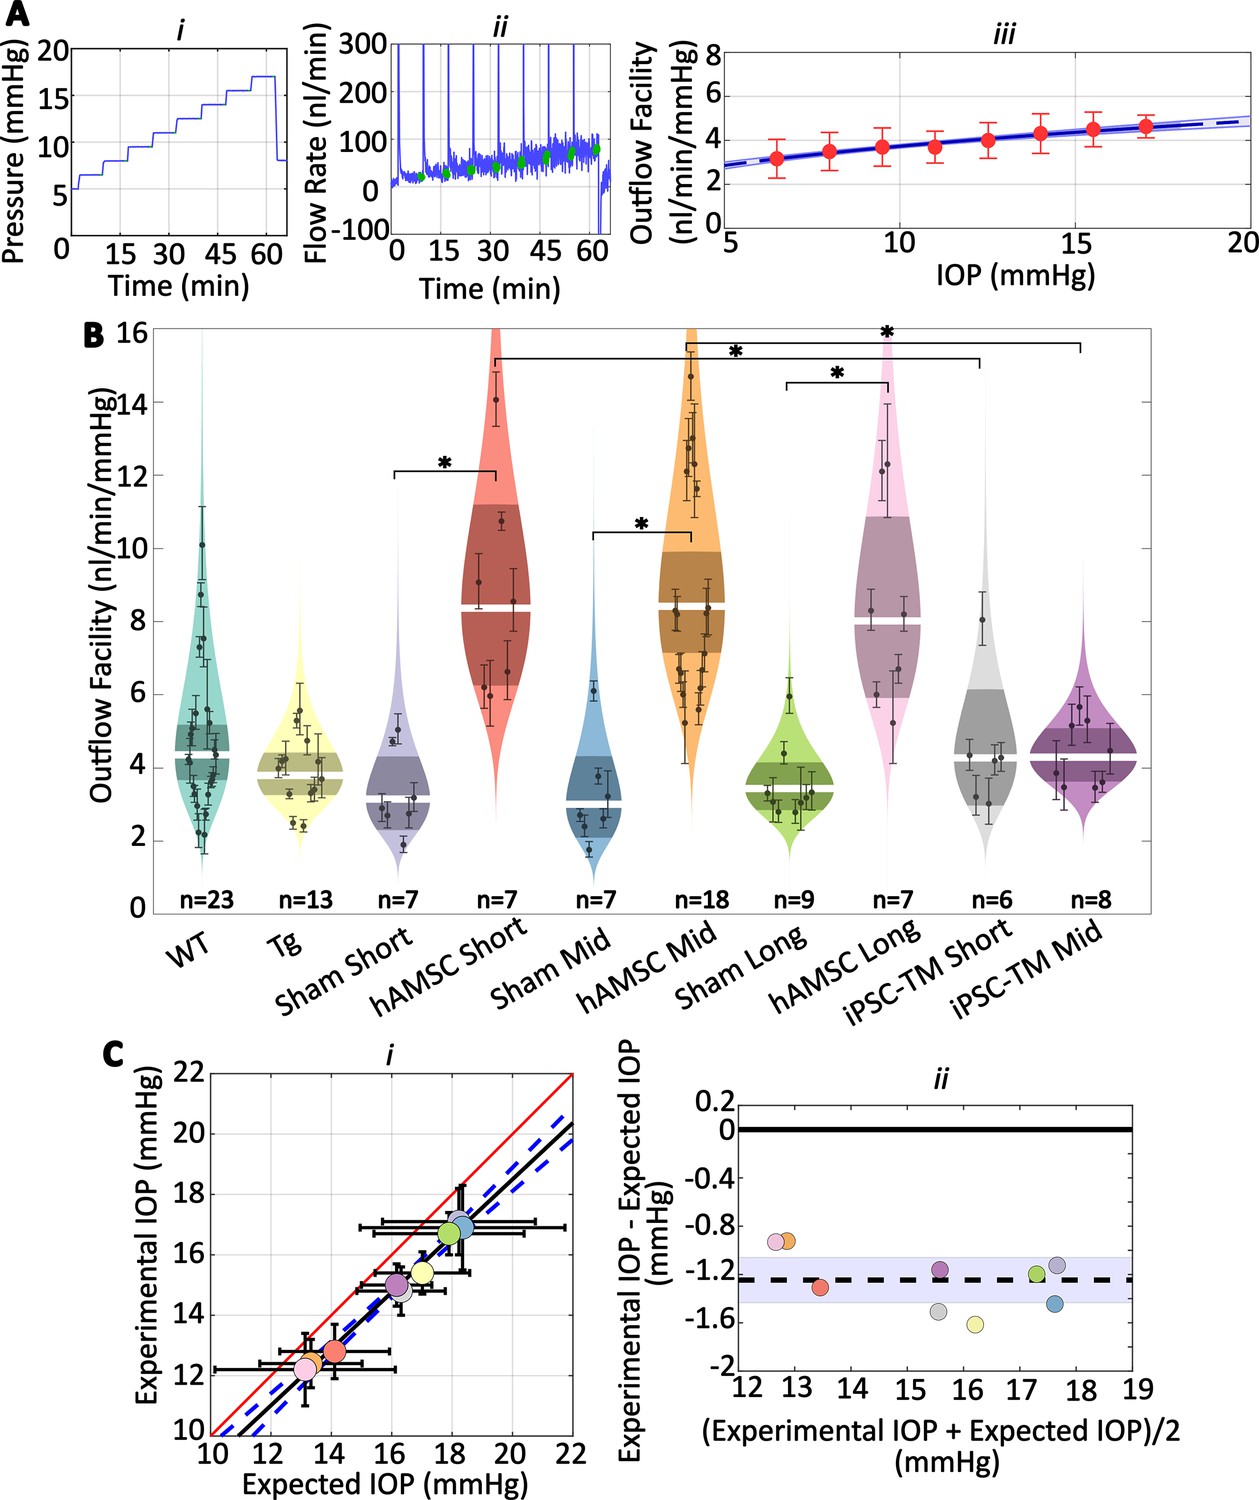
Human adipose-derived mesenchymal stem cells (hAMSCs) increase outflow facility in mice.
(Ai–ii) Intraocular pressure (IOP) and flow rate vs. time for multiple pressure steps during the perfusion experiment in a representative eye. After each pressure step, the perfusion system automatically waits for a steady-state inflow rate to be achieved, based on the criterion that the rate of change in the inflow rate falls below 3 nl/min/min. The steady intervals for each step are shown in green. Data has been trimmed to not include preparatory and pre-loading phases. (Aiii) Calculated outflow facility (red dots) vs. IOP. The solid curve shows the fitted model with the shaded region being the 95% confidence interval on the regression line. Error bars are 95% confidence intervals on individual steps. (B) Outflow facilities across different experimental cohorts. Refer to Figure 2 for interpretation details. Note that outflow facilities in mice follow a log-normal distribution. (C) Cross-validation of experimentally measured and expected IOP, calculated from measured facility values. (i) Regression plot of experimental vs. expected IOPs. Solid black fitted line (, ) is shown along with its confidence bounds in dashed blue. Error bars show the 95% confidence interval on both experimental (vertical) and expected (horizontal) IOPs. The unity line is shown as a solid red line. (ii) Bland-Altman plot of IOP residuals (experimental minus expected IOPs) vs. average of experimental and expected IOPs. Individual experimental groups are indicated by colors matching those in panel B. Dashed line shows the mean and is shown along with its 95% confidence interval (shaded). Solid line shows zero difference between the two parameters, i.e., the null hypothesis. For further information on experimental groups and statistical analysis, refer to text. with Bonferroni correction (see Table 2).
Figure 4 with 1 supplement
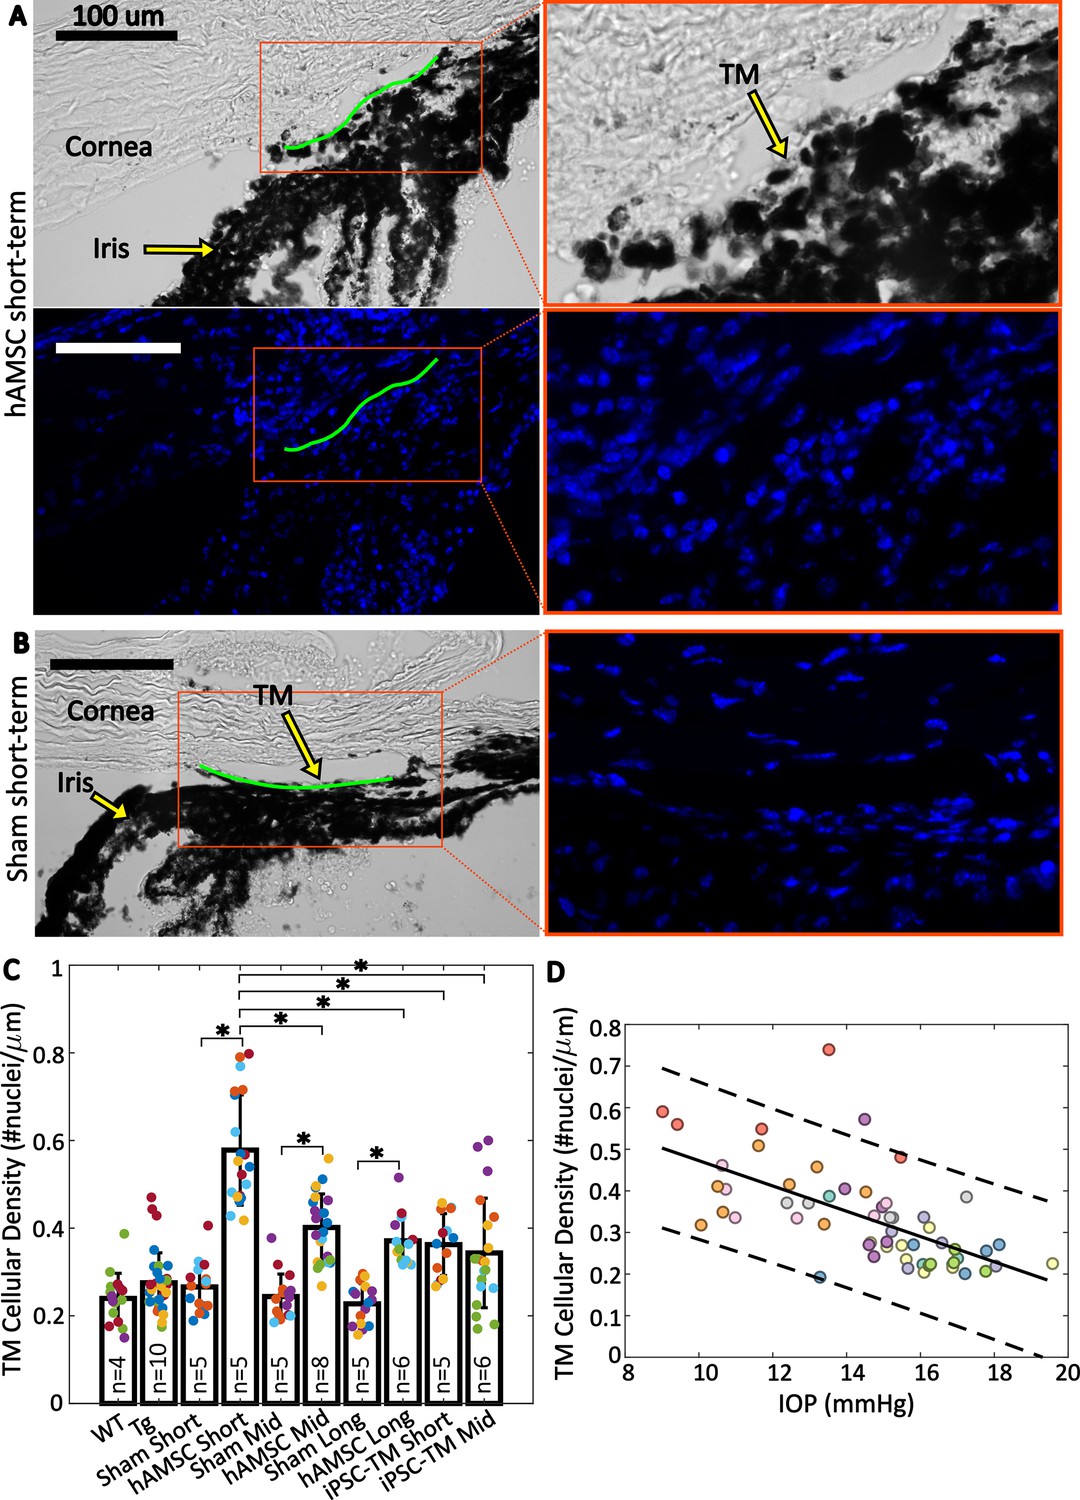
Trabecular meshwork (TM) cellular density is improved by stem cell delivery.
(A and B) Bright-field and fluorescent micrographs of the irideocorneal angle (sagittal view) taken from a representative eye from the hAMSC short-term (A) and sham short-term (B) experimental groups (see Figure 4—figure supplement 1 for more details). Green line shows the contour of the TM along the inner wall of Schlemm’s canal used for normalizing nuclei count. DAPI-stained nuclei in the fluorescent image are shown in blue. Adjacent panels show a magnified view of the angle. (C) Comparison of TM cellular density (number of nuclei per length of inner wall of Schlemm’s canal) for various experimental cohorts. Bars show mean and standard deviation. Multiple sections analyzed from each eye are coded with the same color. n=number of eyes. Linear mixed-effect model, * with Bonferroni correction (see Table 2). (D) Cross-comparison of TM cellularity vs. IOP for the eyes shown in panel (C). The negative correlation between the variables was statistically confirmed (Pearson’s correlation coefficient = –0.63 and ). Each color represents one eye, with different colors matching the experimental groups as shown in Figure 2. Trend line (solid) is shown along with the 95% prediction interval (dashed).
Figure 4—figure supplement 1

Complementary micrographs to Figure 4 used for trabecular meshwork (TM) cellularity quantifications.
Overview micrographs are shown in the left and right columns (see labels above images), with zoomed regions in the central column as indicated by the red arrows. Regions of interest (ROI), encompassing the parts of TM used for nuclei counting (demarcated in red), are outlined by green dashed boxes, and the DAPI-stained nuclei (blue) are shown in a zoomed-in fluorescent micrograph of the ROI (green solid box). In overview images in which the ROI is tilted, the corresponding fluorescent micrograph has been rotated counterclockwise so that it is horizontal, thus enabling a more compact presentation.
Figure 5 with 1 supplement
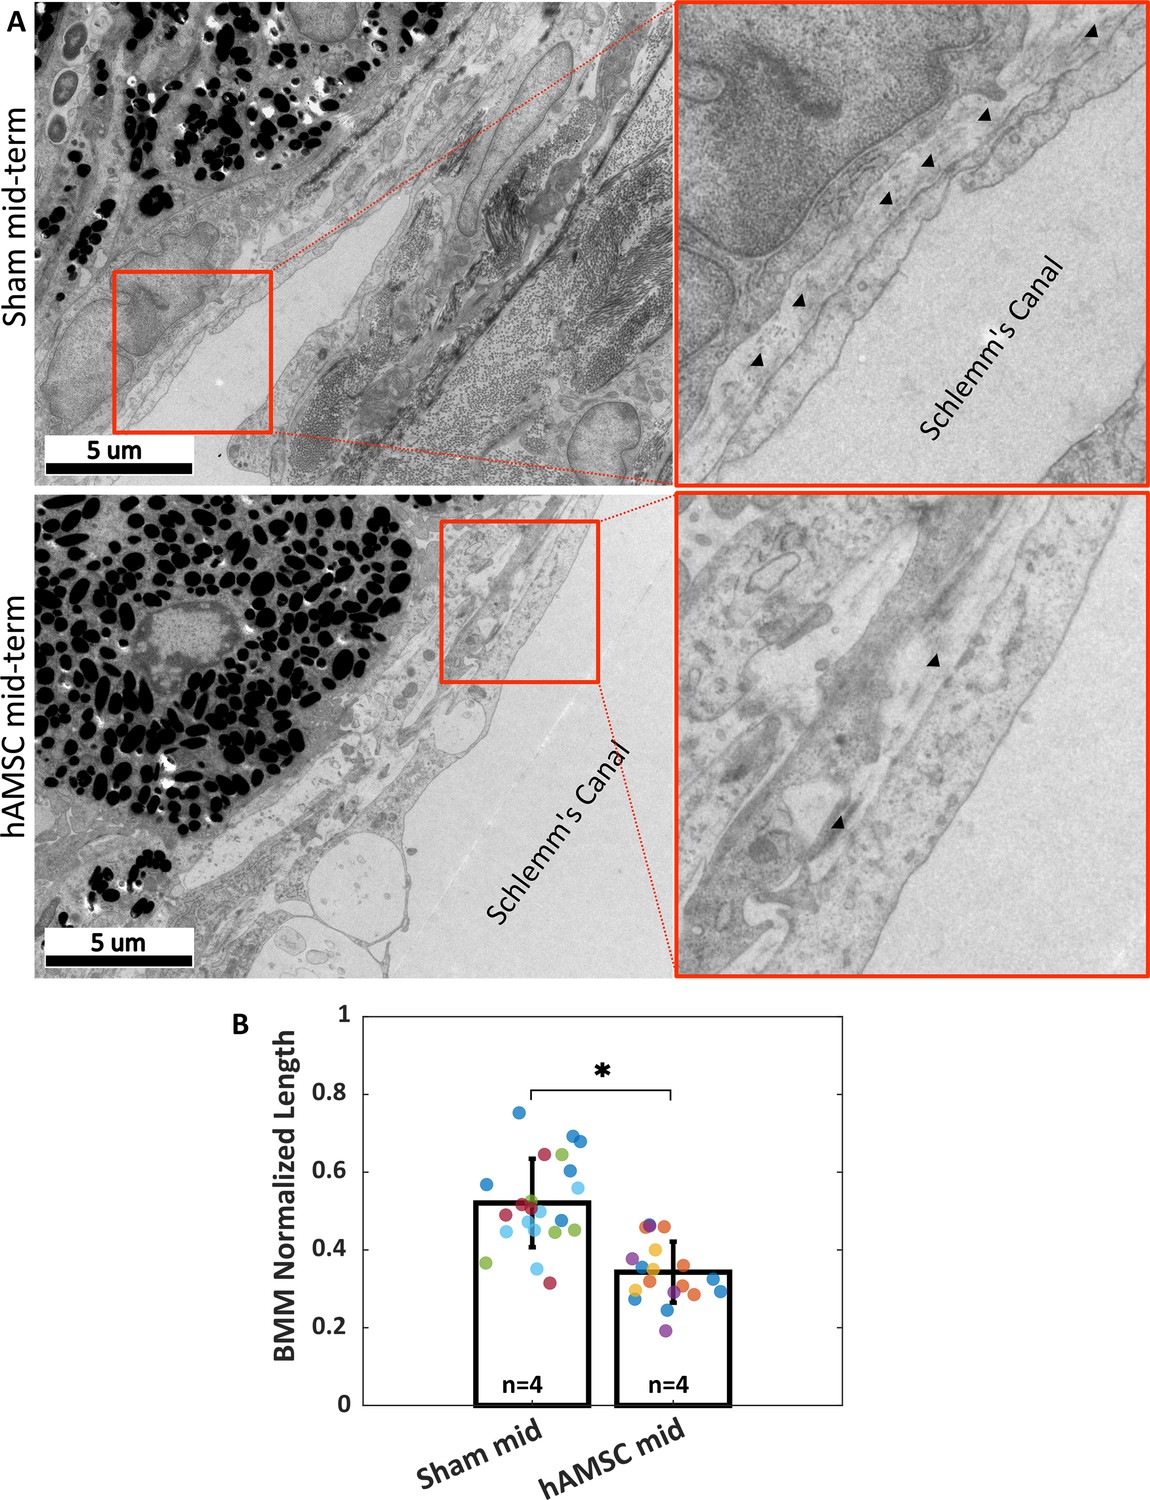
Ultrastructural analysis of extracellular matrix (ECM) underlying the inner wall (IW) of Schlemm’s canal (basement membrane material [BMM]).
(A) Greater amounts of BMM are evident immediately adjacent to the IW of Schlemm’s canal (arrowheads) in a saline-injected eye (top row) vs. in a human adipose-derived mesenchymal stem cell (hAMSC)-treated eye (bottom row) at the mid-term time point. The images at right are a zoomed view of the orange boxed areas in the left panels. (B) The normalized length of BMM directly in contact with the IW (length of BMM material divided by length of IW of Schlemm’s canal) for the experimental groups represented in panel A. Dots represent the average value between annotators for each measured section. Multiple sections analyzed from each eye are coded with the same color. n=number of eyes. Bars and error bars represent means and standard deviations. Linear mixed-effect model. .
Figure 5—figure supplement 1

Quantification procedure for the amount of basement membrane materials (BMM) underlying to the inner wall of Schlemm’s canal.
The red and blue line segments mark the BMM adjacent to the inner wall of Schlemm’s canal for each annotator. The summed length of these segments was then normalized by the overall length of the inner wall (yellow) for quantifications. The yellow line is slightly shifted from the blue and red segments for easier visualization.
Figure 6 with 1 supplement
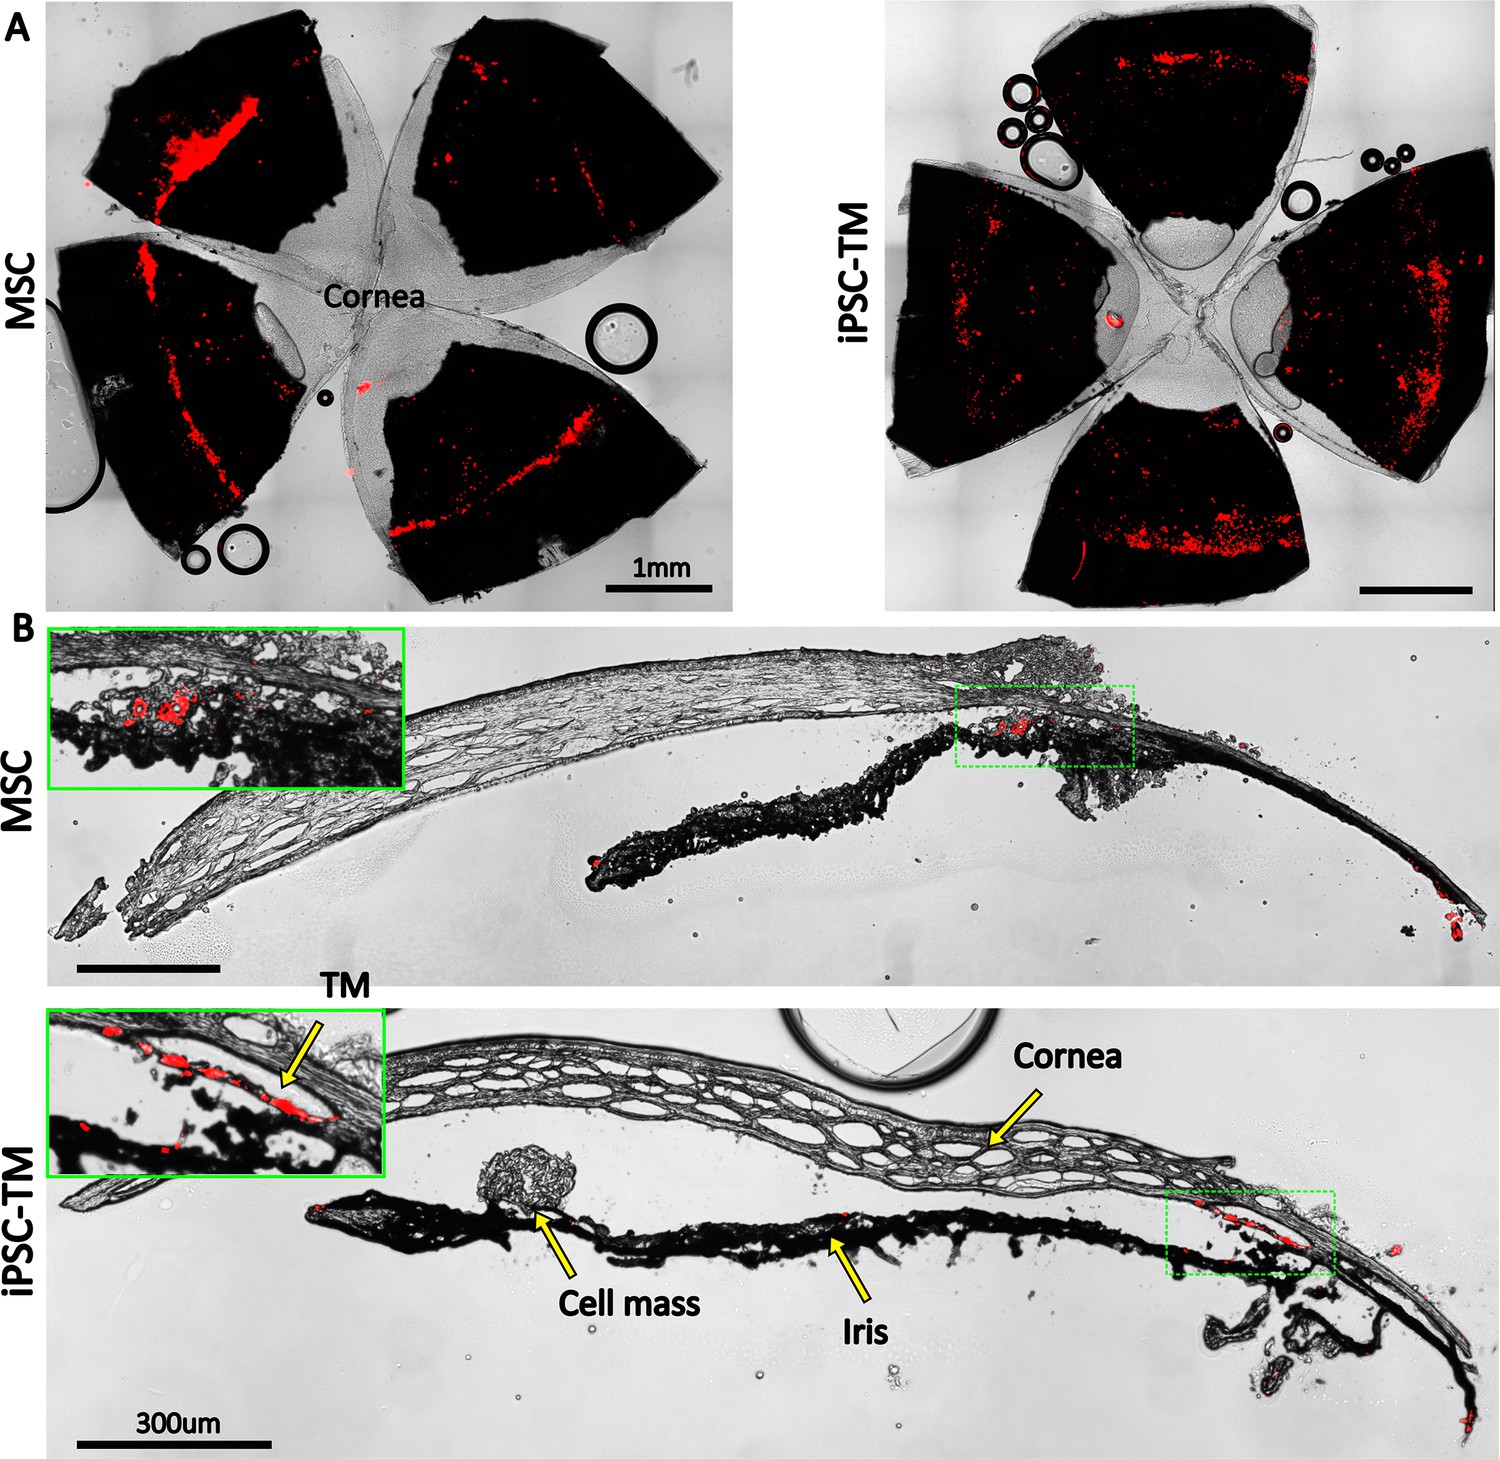
Retention of exogenous cells in the anterior segment 3 weeks after injection.
Distribution of both human adipose-derived mesenchymal stem cells (hAMSC) and induced pluripotent cell derivative (iPSC-TM) cells (red) are shown in (A) en face images of the anterior segments and (B) sagittal sections. In panel (B), insets show a magnified view of the sites with the most intense fluorescent signal (green boxes). Autofluorescence can be seen in the posterior chambers, as well as exterior to the corneoscleral shell. A cell mass, possibly a growing tumor, can be seen over the iris in the iPSC-TM-injected eye.
Figure 6—figure supplement 1

Autofluorescence from various ocular tissues at the same fluorescence settings as used in Figure 6.
The autofluorescence profile is dependent on the quality of dissection. In A, a signal is evident in insufficiently removed orbital tissue (yellow arrow) and at the limbus (green arrow). In B, autofluorescence is localized within the remnants of the retina (yellow arrow) and ciliary body (green arrow).
Figure 7
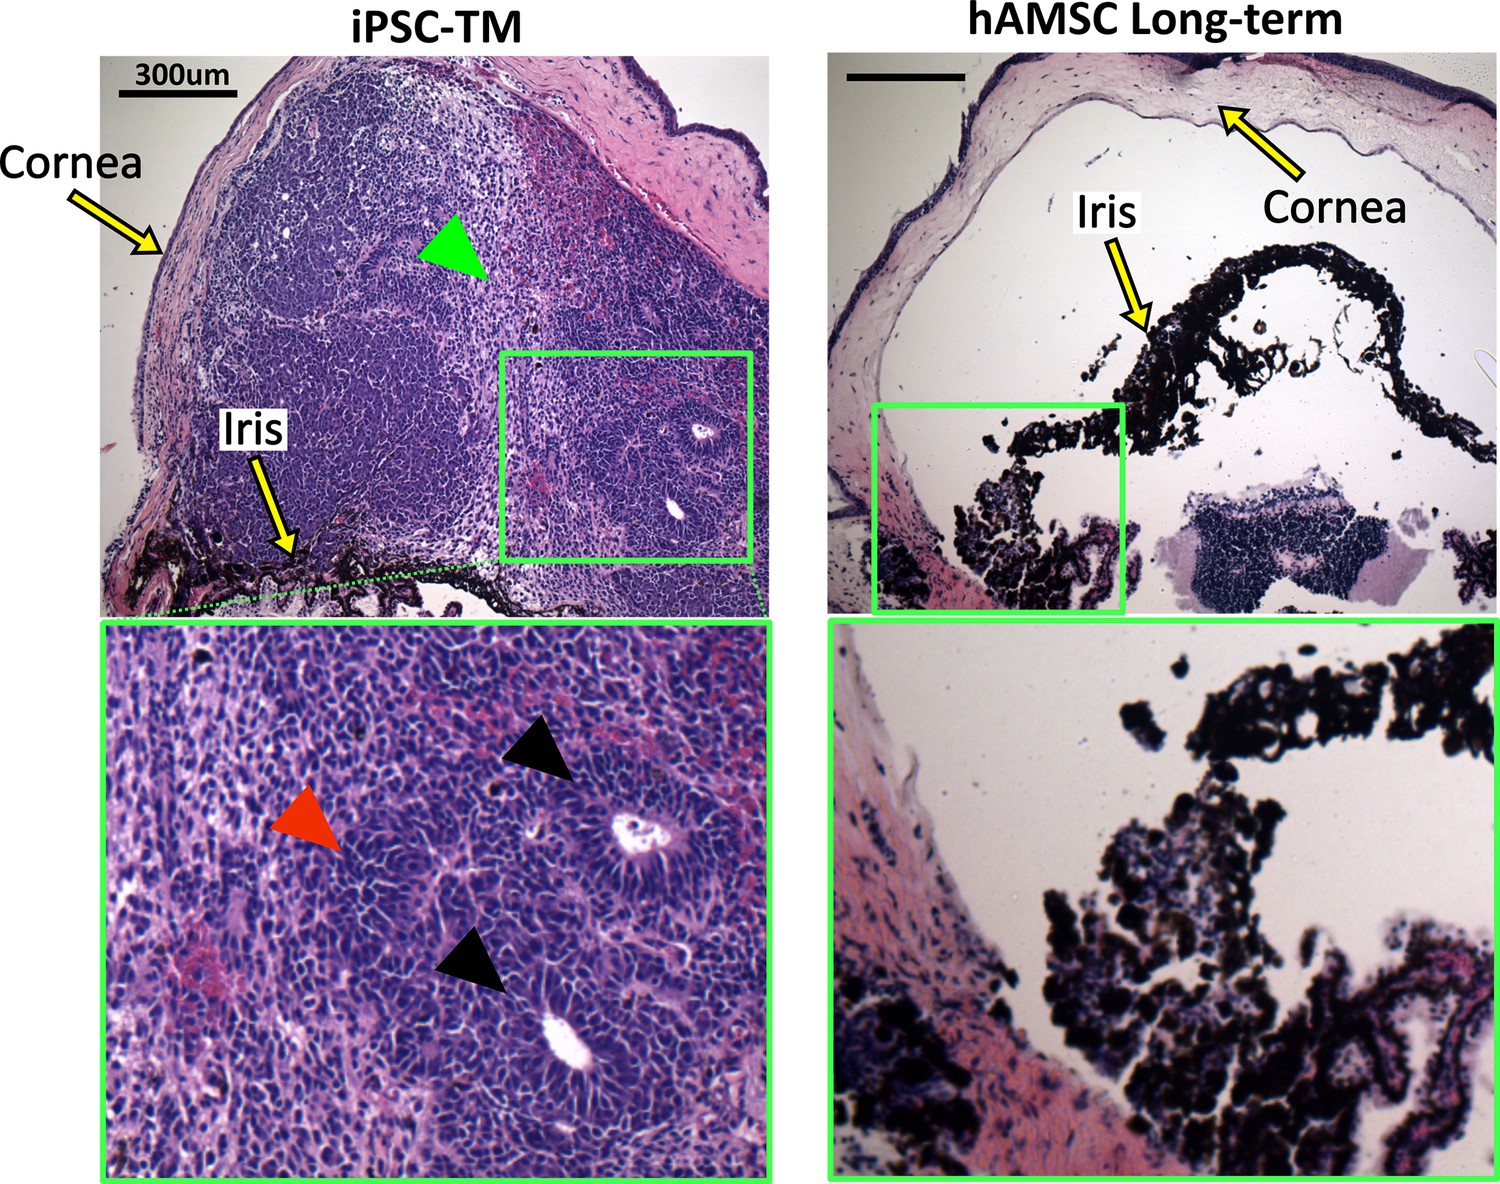
Histopathological assessment of tumors in eyes receiving transplanted cells.
Induced pluripotent cell derivative (iPSC-TM)- and human adipose-derived mesenchymal stem cell (hAMSC)-transplanted eyes were stained with hematoxylin and eosin (H&E). iPSC-TM sections show distinct tumor characteristics in the anterior chamber, including the presence of rosettes (black arrowheads), densely packed cells with high nuclear-cytoplasmic ratios (red arrowhead), and more loosely coherent cells (green arrowhead). Note that eyes were collected immediately after showing visible signs of tumor growth (usually within a month post-transplantation) and not at a predefined time point. hAMSC eyes at long-term time point showed no sign of tumor growth. In all panels, the green boxes provide a magnified view of the areas where tumor growth or the accumulation of exogenous cells occurred.
Appendix 1—figure 1
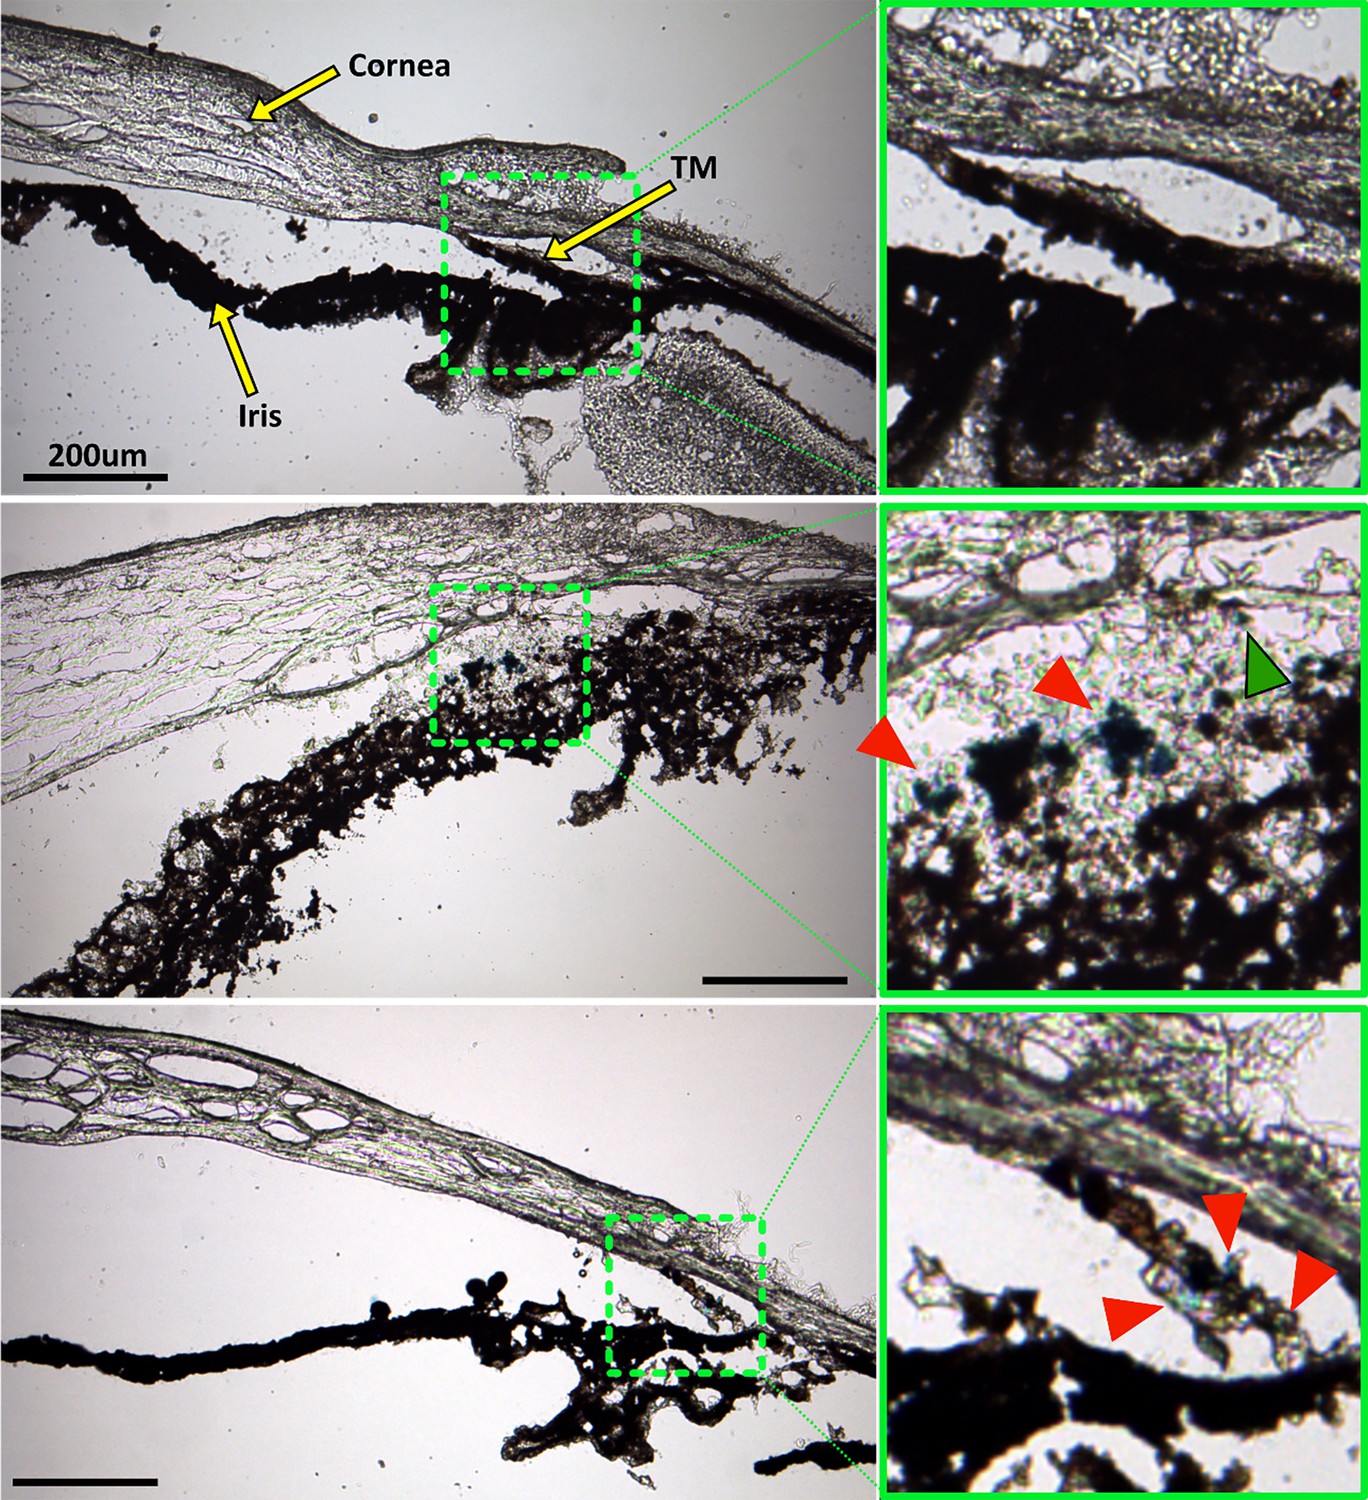
Prussian blue staining to locate superparamagnetic iron oxide nanoparticles (SPIONs) within the anterior segment after cell transplantation.
The left column shows overview images of the anterior segment, while green boxes in the right column show a zoomed view of the region with strongest Prussian blue staining, corresponding to the green dashed boxes in the left column. Top row: No Prussian blue staining could be found in the saline injection control. Middle row: Prussian blue stain is challenging to distinguish from melanin, but accumulation of blue label (red arrowheads) can be seen to coincide with the locations of exogenous cells visualized in Figure 6. In particular, injected human adipose-derived mesenchymal stem cells (hAMSCs) primarily accumulated close to the trabecular meshwork (TM), corresponding to the location of Prussian blue stain. A small region of Prussian blue staining can be observed in the TM (green arrowhead). Bottom row: Similarly, in eyes receiving induced pluripotent cell derivatives (iPSC-TMs), most of the Prussian blue staining was found within the TM, corresponding to the location of injected cells (Figure 6). Unfortunately, the fluorescent signal in Figure 6 was significantly attenuated after Prussian blue staining and could not be overlaid on these images to assist with interpretation. Iris degradation, notable in the middle row, is an undesirable artifact of the cryosectioning or staining process (Figure 6).
Appendix 2—figure 1
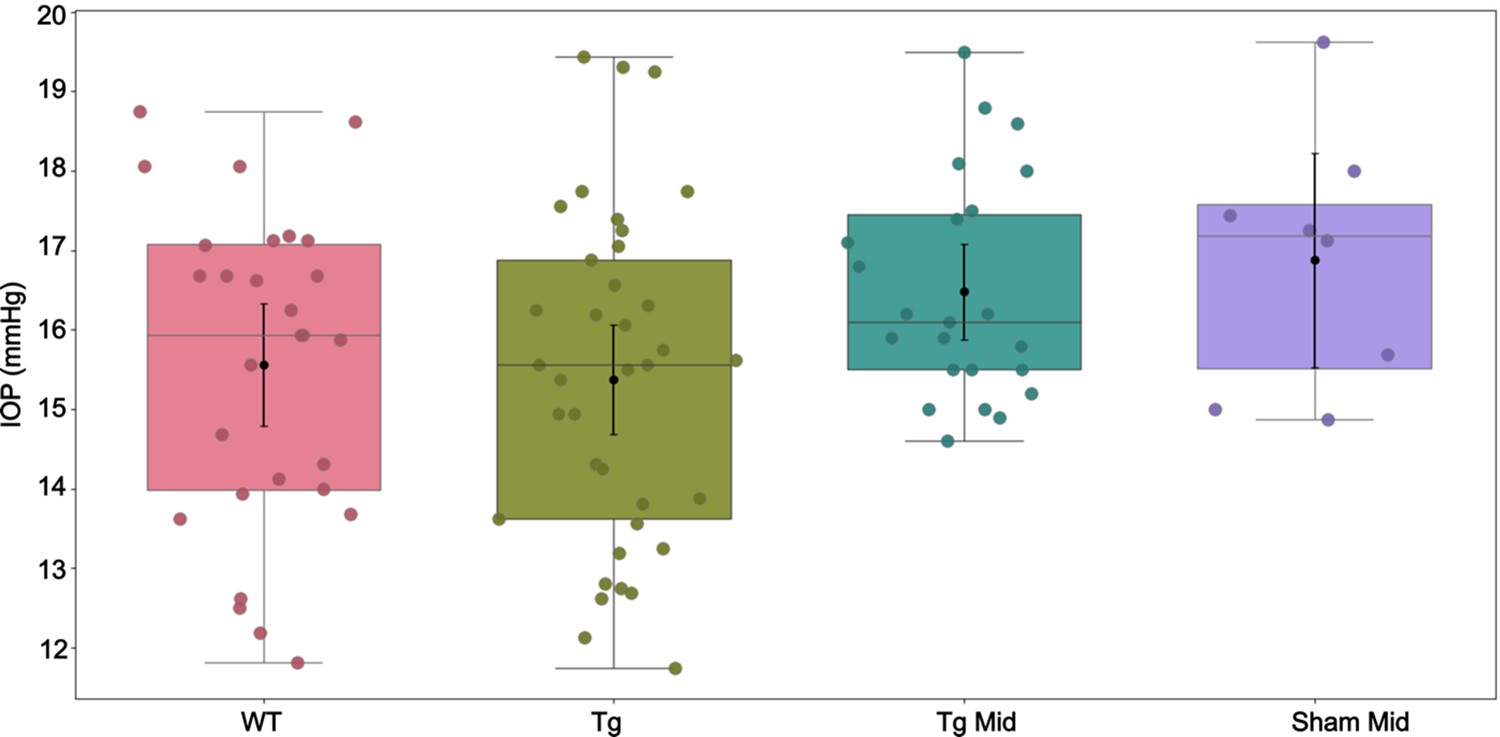
Intraocular pressure (IOP) measurements corresponding to Appendix 2—table 1.
In each experimental cohort, the box plot shows interquartile range, and the center horizontal line denotes median. Black dots and their whiskers show the mean and 95% confidence interval on the mean, respectively. Dots represent individual eyes. See Appendix 2—table 2 for complete statistical analysis.
Tables
Table 1
Outcome measures, shown as means and [95% confidence intervals].
| Group | IOP (mmHg) | Facility (nl/min/mmHg) | Cellular density (nuclei/µm) |
|---|---|---|---|
| WT | 15.6 [14.8,16.3] | 4.4 [3.7,5.2] | 0.24 [0.15,0.33] |
| Tg | 15.4 [14.7,16.1] | 3.8 [3.3,4.4] | 0.28 [0.23,0.32] |
| Sham Short | 17.1 [16.0,18.1] | 3.2 [2.3,4.3] | 0.27 [0.20,0.34] |
| MSC Short | 12.8 [11.9,13.8] | 8.4 [6.3,11.2] | 0.58 [0.42,0.73] |
| Sham Mid | 16.9 [15.5,18.2] | 3.0 [2.1,4.3] | 0.24 [0.18,0.31] |
| MSC Mid | 12.4 [11.6,13.2] | 8.4 [7.1,9.9] | 0.40 [0.34,0.47] |
| Sham Long | 16.7 [16.0,17.5] | 3.4 [2.8,4.2] | 0.23 [0.17,0.28] |
| MSC Long | 12.2 [11.0,13.3] | 8.0 [5.9,10.9] | 0.37 [0.31,0.43] |
| iPSC-TM Short | 14.8 [14.0,15.6] | 4.3 [3.0,6.2] | 0.36 [0.27,0.45] |
| iPSC-TM Mid | 15.0 [14.3,15.7] | 4.3 [3.6,5.1] | 0.34 [0.21,0.47] |
Table 2
Result of multiple comparisons for various groups and variables, with statistically significant comparisons highlighted in orange*.
| Compared groups | p-Values | ||||
|---|---|---|---|---|---|
| vs. | IOP | Facility | Cellular density | ||
| 1 | WT | Tg | 0.3579 | 0.1353 | 0.6264 |
| 2 | Tg | Sham Short | 0.0070 | 0.0901 | 0.9214 |
| 3 | Tg | Sham Mid | 0.0311 | 0.0614 | 0.2879 |
| 4 | Tg | Sham Long | 0.0652 | 0.1865 | 0.2442 |
| 5 | Tg | hAMSC Short | <0.0001 | <0.0001 | <0.0001 |
| 6 | Tg | hAMSC Mid | <0.0001 | <0.0001 | 0.0003 |
| 7 | Tg | hAMSC Mid | <0.0001 | <0.0001 | 0.008 |
| 8 | Tg | iPSC-TM Short | 0.1287 | 0.2044 | 0.0239 |
| 9 | Tg | iPSC-TM Mid | 0.3073 | 0.1296 | 0.0303 |
| 10 | Sham Short | hAMSC Short | <0.0001 | <0.0001 | <0.0001 |
| 11 | Sham Short | iPSC-TM Short | 0.0006 | 0.0692 | 0.0535 |
| 12 | hAMSC Short | hAMSC Mid | 0.2786 | 0.4838 | <0.0001 |
| 13 | hAMSC Short | hAMSC Long | 0.2111 | 0.4045 | <0.0001 |
| 14 | hAMSC Short | iPSC-TM Short | 0.0013 | 0.0019 | <0.0001 |
| 15 | Sham Mid | hAMSC Mid | <0.0001 | <0.0001 | <0.0001 |
| 16 | Sham Mid | iPSC-TM Mid | 0.0047 | 0.0210 | 0.0072 |
| 17 | hAMSC Mid | hAMSC Long | 0.3497 | 0.3719 | 0.5595 |
| 18 | hAMSC Mid | iPSC-TM Mid | <0.0001 | <0.0001 | 0.2751 |
| 19 | Sham Long | hAMSC Long | <0.0001 | <0.0001 | 0.0020 |
| 20 | iPSC-TM Short | iPSC-TM Mid | 0.3597 | 0.4877 | 0.8516 |
-
*
Post hoc comparisons were performed after ANOVA (for IOP and outflow facility) or linear mixed-effect model (for TM cellularity). Bonferroni correction was used to adjust the critical p-value from 0.05 to 0.0025 (based on the 20 reported comparisons).
Appendix 2—table 1
Intraocular pressure (IOP) measurements for select groups, shown as means and [95% confidence intervals] similar to Table 1.
Tg Mid: Untreated eyes, either contralateral to sham mid-term or human adipose-derived mesenchymal stem cell (hAMSC) mid-term eyes (n=23).
| Group | IOP (mmHg) |
|---|---|
| WT | 15.6 [14.8,16.3] |
| Tg | 15.4 [14.7,16.1] |
| Tg Mid | 16.5 [15.9,17.1] |
| Sham Mid | 16.9 [15.5,18.2] |
Appendix 2—table 2
Result of multiple comparison for the groups listed in Appendix 2—table 1.
None of the comparisons reached statistical significance.
| Compared groups | |||
|---|---|---|---|
| vs. | p-Value* | ||
| 1 | WT | Tg | 0.3579 |
| 2 | WT | Tg Mid | 0.0680 |
| 3 | WT | Sham Mid | 0.0491 |
| 4 | Tg | Tg Mid | 0.0278 |
| 5 | Tg | Sham Mid | 0.0311 |
| 6 | Tg Mid | Sham Mid | 0.5148 |
-
*
Post hoc comparisons were performed after ANOVA. Bonferroni correction was used to adjust the critical p-value from 0.05 to 0.008 (based on the six reported comparisons).
Additional files
-
MDAR checklist
- https://cdn.elifesciences.org/articles/103256/elife-103256-mdarchecklist1-v1.docx
-
Source data 1
Summary of IOP, Outflow Facility, TM Cellularity, Expected IOP (computed from facility), and extracellular matrix (ECM) length under the inner wall.
- https://cdn.elifesciences.org/articles/103256/elife-103256-data1-v1.xlsx
Download links
A two-part list of links to download the article, or parts of the article, in various formats.
Downloads (link to download the article as PDF)
Open citations (links to open the citations from this article in various online reference manager services)
Cite this article (links to download the citations from this article in formats compatible with various reference manager tools)
Magnetically steered cell therapy for reduction of intraocular pressure as a treatment strategy for open-angle glaucoma
eLife 13:RP103256.
https://doi.org/10.7554/eLife.103256.3


