PDZ-directed substrate recruitment is the primary determinant of specific 4E-BP1 dephosphorylation by PP1-Neurabin
- Signalling and Transcription Laboratory, Francis Crick Institute, United Kingdom
- Structural Biology STP, Francis Crick Institute, United Kingdom
- Chemical Biology STP, Francis Crick Institute, United Kingdom
Figures
Figure 1 with 2 supplements
PP1-PIP fusion proteins.
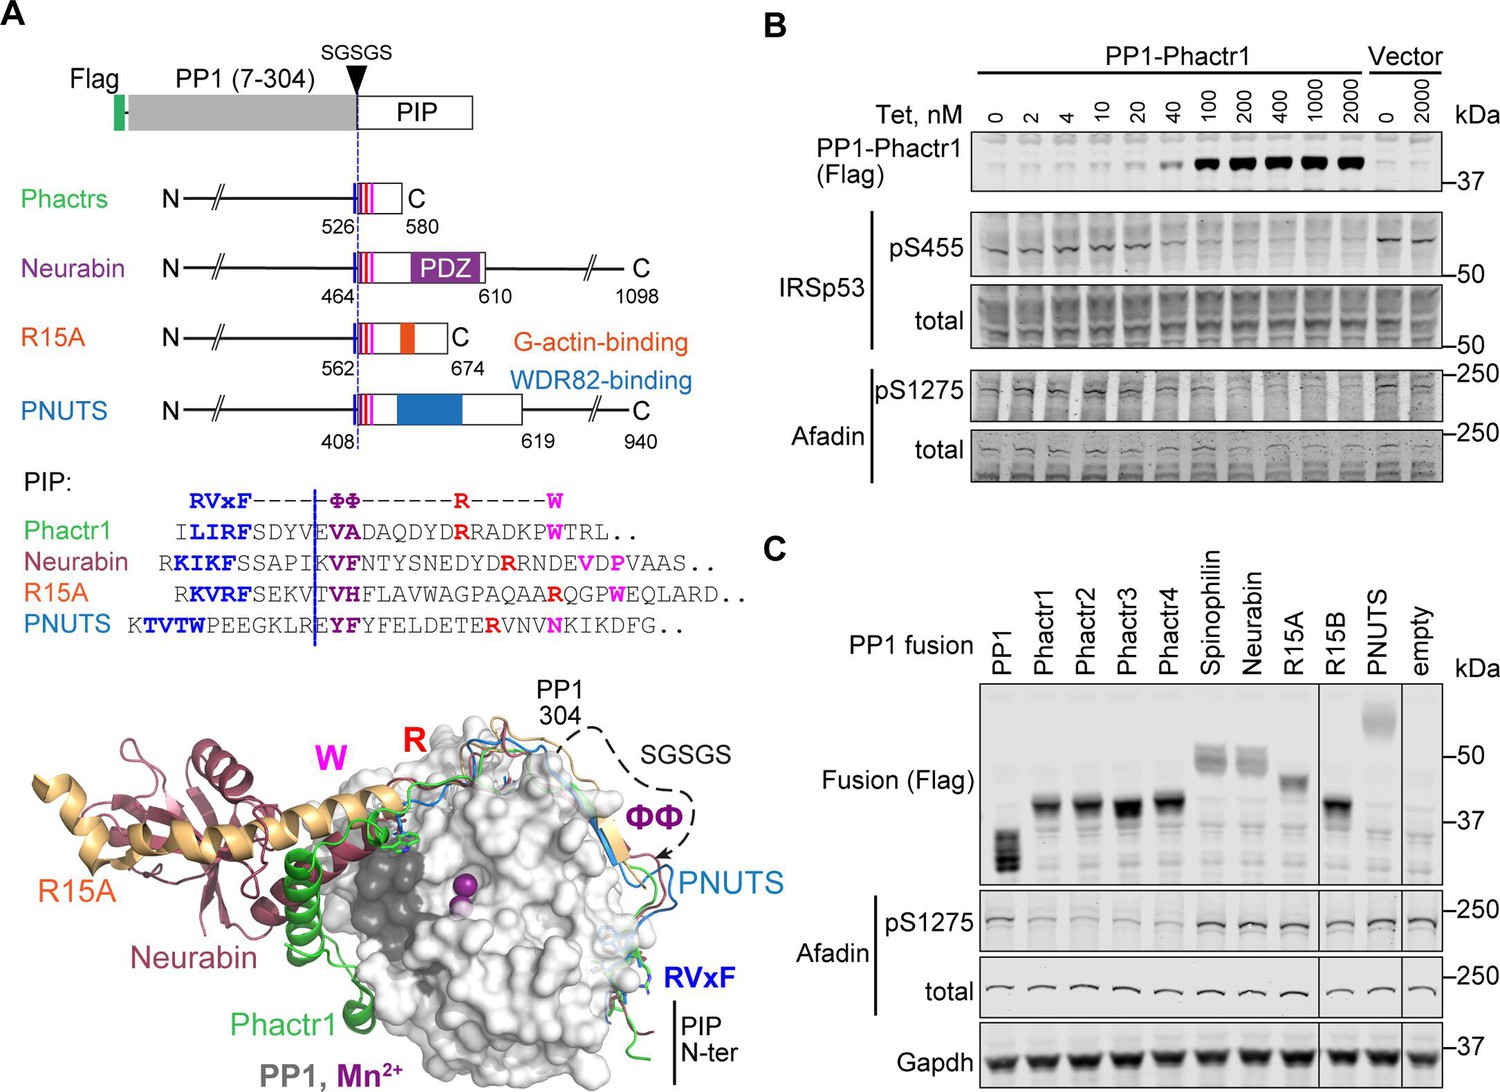
(A) Structures of fusion proteins. N-terminally Flag-tagged PP1α(7–304) is linked to sequences from each of the four families of RVxF-ΦΦ-R-W PIPs, shown as an open box. Each fusion contains sequences immediately C-terminal to the PP1 interaction motif (coloured lines), including known protein interaction domains previously implicated in potential substrate interactions (coloured blocks). For PIP sequences in each fusion, see Figure 1—figure supplement 1A and Methods. Middle, sequences of the RVxF-ΦΦ-R-W string in each PIP, with motifs coloured. Each fusion contains the sequences C-terminal to the dashed line, representing the position of PP1-SGSGS linker insertion. Bottom, structures of PP1/PIP complexes. Crystal structures of different PIP/PP1 complexes superimposed, aligned on PP1. Grey: PP1 (PDB: 4MOV), with PIP sequences as follows; green, Phactr1 (PDB: 6ZEE); magenta, Neurabin (PDB: 3HVQ); orange, R15A (PDB: 7NZM); blue, PNUTS (PDB: 4MOY). Dashed line, GSGSG linker. (B) Activity of PP1-Phactr1 expressed in Flp-In T-REx 293 cells. PP1-Phactr1 expression was induced by tetracycline as indicated. Phosphorylation of Phactr1/PP1 substrates IRSp53 S455 and Afadin S1275 is shown below. (C) Analysis of Phactr1/PP1 substrate Afadin pS1275 phosphorylation in Flp-In T-REx 293 cells expressing PP1 and PP1-fusion proteins.
-
Figure 1—source data 1
Sequence alignments related to Figure 1A, Figure 1—figure supplement 1A.
- https://cdn.elifesciences.org/articles/103403/elife-103403-fig1-data1-v1.zip
-
Figure 1—source data 2
Original files for western blot analysis displayed in Figure 1B.
- https://cdn.elifesciences.org/articles/103403/elife-103403-fig1-data2-v1.zip
-
Figure 1—source data 3
Full-size western blots indicating the relevant bands and treatments related to Figure 1B.
- https://cdn.elifesciences.org/articles/103403/elife-103403-fig1-data3-v1.zip
-
Figure 1—source data 4
Original files for western blot analysis displayed in Figure 1C.
- https://cdn.elifesciences.org/articles/103403/elife-103403-fig1-data4-v1.zip
-
Figure 1—source data 5
Full-size western blots indicating the relevant bands and treatments related to Figure 1C.
- https://cdn.elifesciences.org/articles/103403/elife-103403-fig1-data5-v1.zip
Figure 1—figure supplement 1
Sequences and functional validation of PP1-PIP fusions.
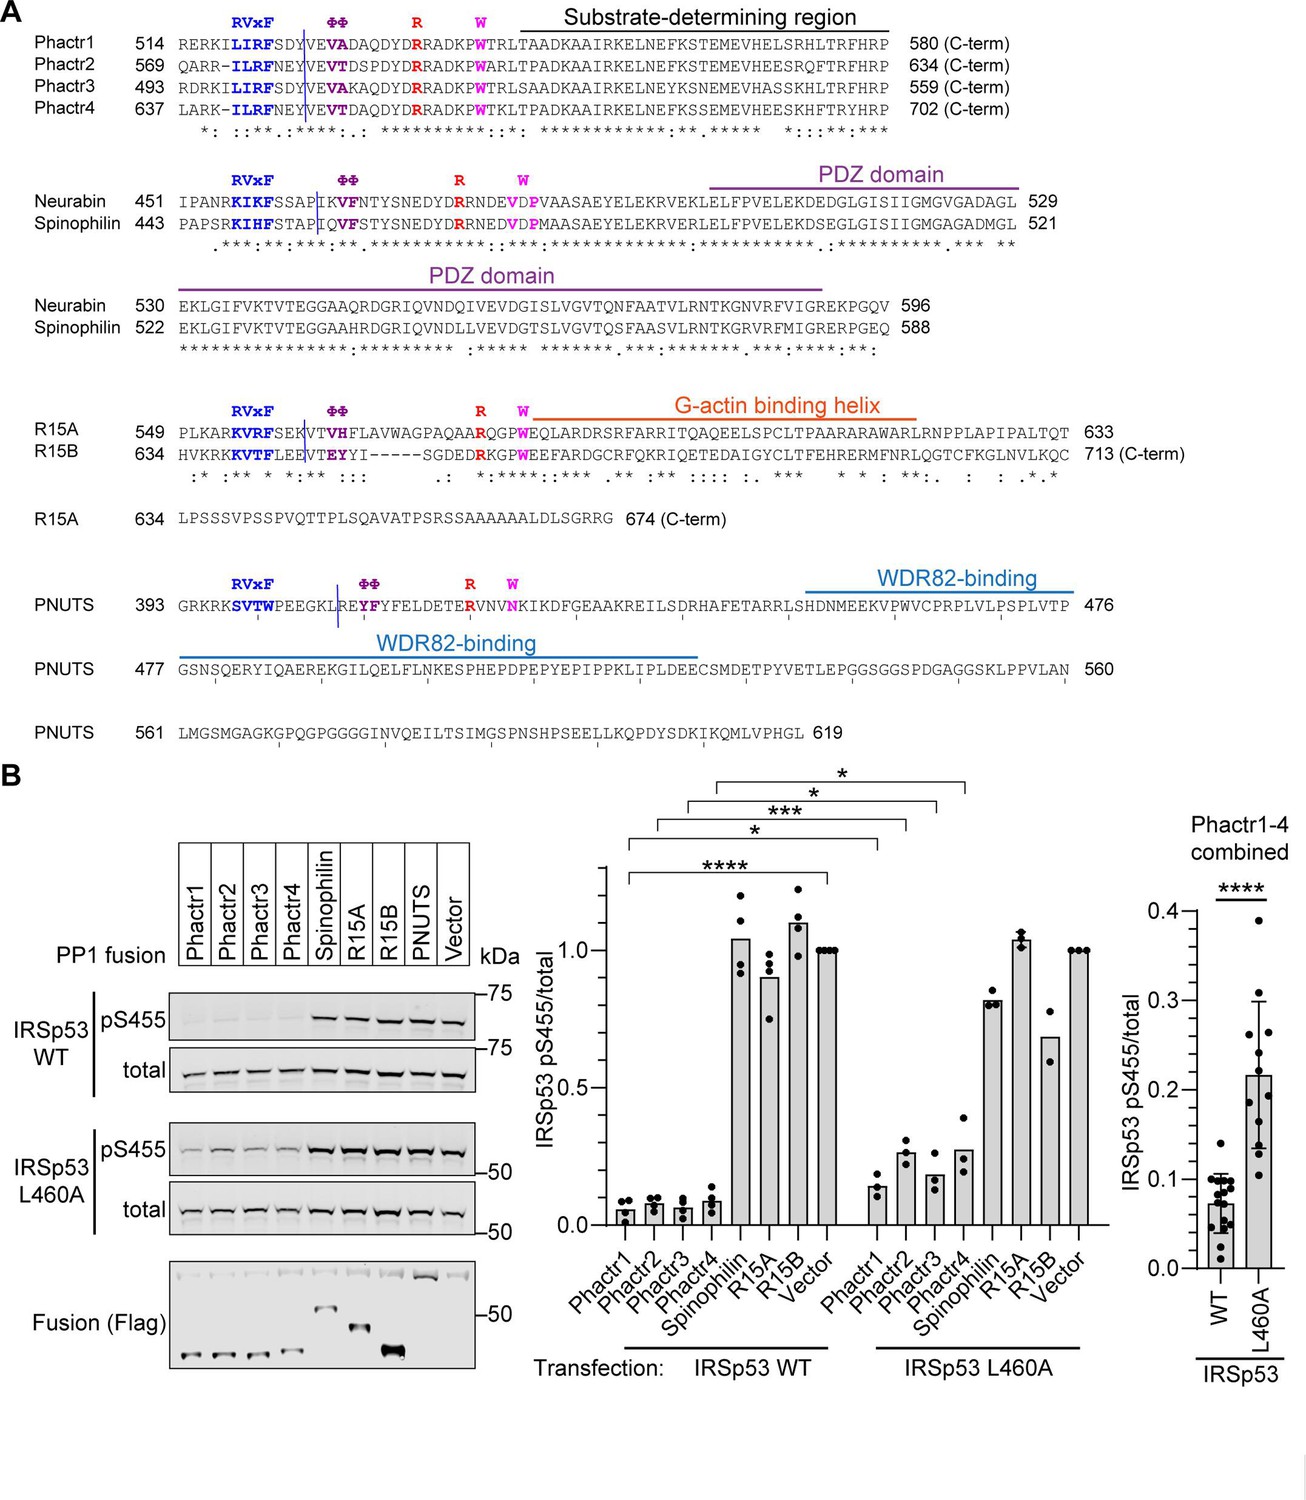
(A) PIP sequences in each fusion. Sequences of the PP1-binding and C-terminal sequences in each RVxF-ΦΦ-R-W PIP fusion are shown. Blue line indicates fusion point. Known interaction domains are overlined. (B) IRSp53 WT or L460A mutant was transfected into 293 Flp-In T-REx cells expressing the different fusion proteins, and fusion expression induced by tetracycline. Immunoblotting for total and S455-phosphorylated IRSp53 is shown. Flag tag indicates the expression of the fusion phosphatases. For each of the four PP1-Phactr fusions, the IRSp53 L460A peptide is significantly less reactive than the IRSp53WT peptide (p<0.05 for each fusion). Since the specificity of the four PP1-Phactr fusions is the same, combination of data for all four fusions is shown at the right. Bars are plotted as averages of 3 or 4 replicates. Statistical significance by Student’s t-test: *, p<0.05; ***, p<0.001; ****, p<0.0001.
-
Figure 1—figure supplement 1—source data 1
Original files for western blot analysis displayed in Figure 1—figure supplement 1B.
- https://cdn.elifesciences.org/articles/103403/elife-103403-fig1-figsupp1-data1-v1.zip
-
Figure 1—figure supplement 1—source data 2
Full-size western blots indicating the relevant bands and treatments related to Figure 1—figure supplement 1B.
- https://cdn.elifesciences.org/articles/103403/elife-103403-fig1-figsupp1-data2-v1.zip
Figure 1—figure supplement 2
Structural alignments of RVxF-ΦΦ-R-W PIP complexes with PP1.
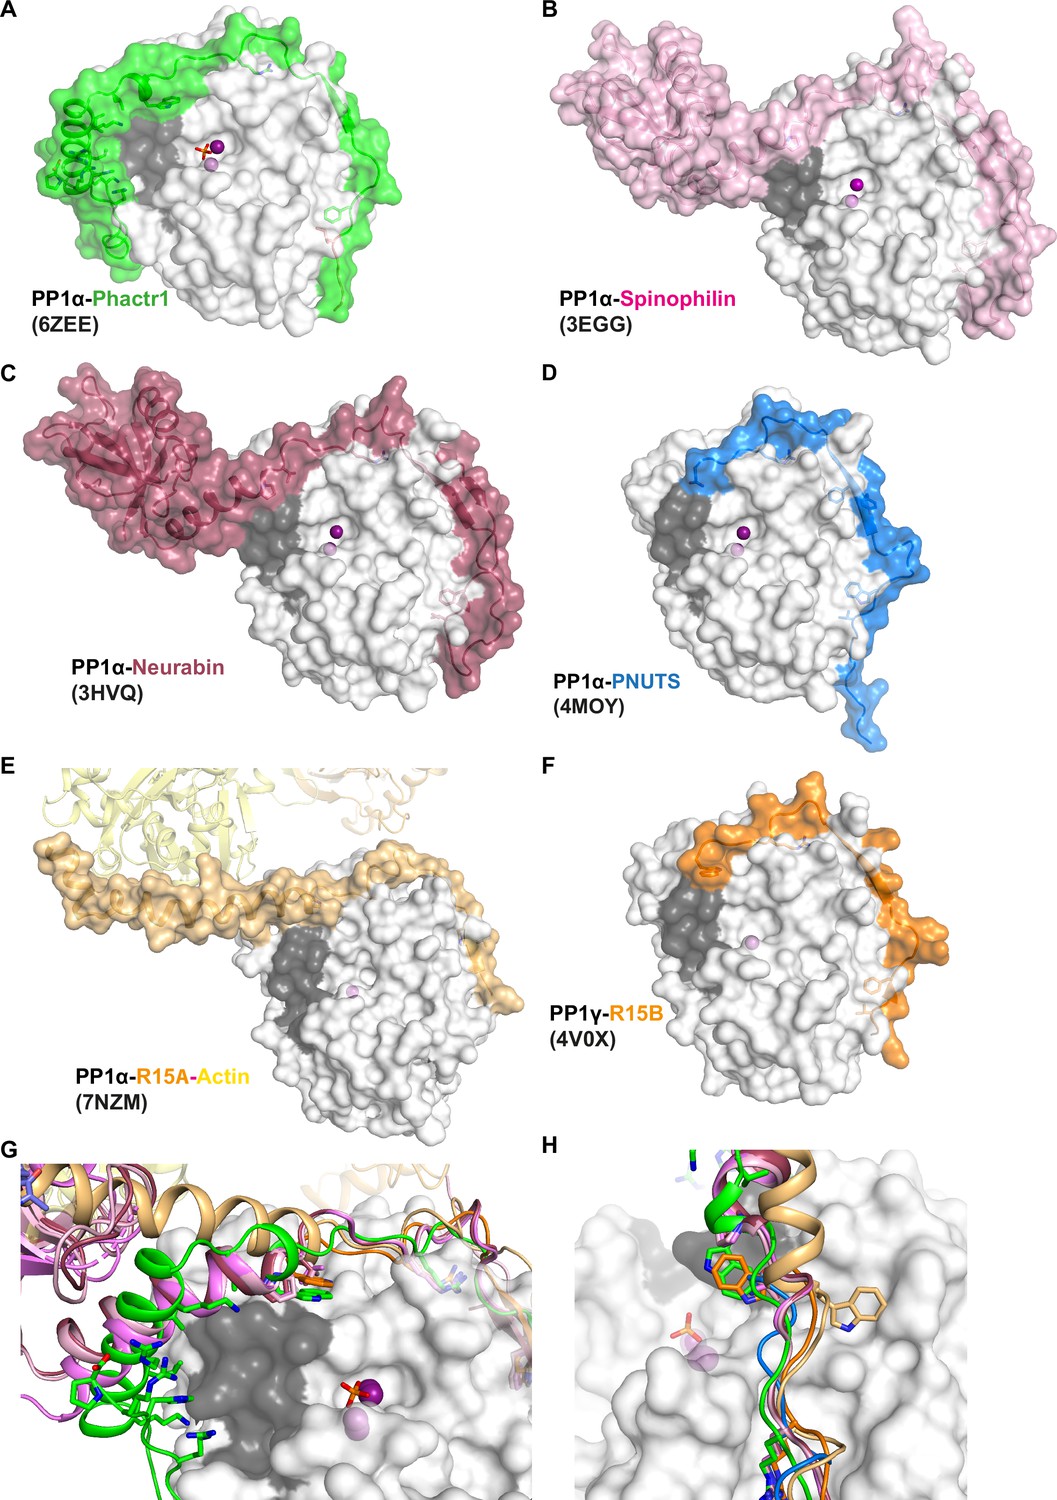
(A) Crystal structure of the PP1/Phactr1 complex (PDB 6ZEE). PP1 in white surface representation, with the hydrophobic substrate groove residues C127, A128, S129, I130, I133, Y134, V195, L205, W206, V223 coloured in grey and PP1 active site presumptive Mn2+ ions in purple spheres. Phactr1 is in green surface representation. (B) Crystal structure of the PP1/Spinophilin complex (PDB 3EGG). PP1 is shown as in A, and Spinophilin shown in light pink surface representation. (C) Crystal structure of the PP1/Neurabin complex (PDB 3HVQ). PP1 is shown as in A, and Neurabin shown in red surface representation. (D) Crystal structure of the PP1/PNUTS complex (PDB 4MOY). PP1 is shown as in A, and PNUTS shown in blue surface representation. (E) Crystal structure of the PP1/R15A/Actin/DNAse1 complex (PDB 7NZM). PP1 is shown as in A, and R15A shown in wheat surface representation, and actin as yellow ribbons. (F) Crystal structure of the PP1/R15B complex (PDB 4V0X). PP1 is shown as in A, and R15B shown in orange surface representation. (G) Superposition of all the PIP/PP1 complex structures shown in A–F. A close-up for the PP1 hydrophobic groove is shown, with PP1 as in A and each PIP shown as ribbon representation, coloured as in panels A–F, with the W motif residues shown in sticks. (H) Same as (F) in a different orientation to highlight the alternative orientations of the W PP1/R15A/Actin/DNAse1 and PP1/R15B complexes.
Figure 2 with 2 supplements
PP1-PIP fusion phosphoproteomics.
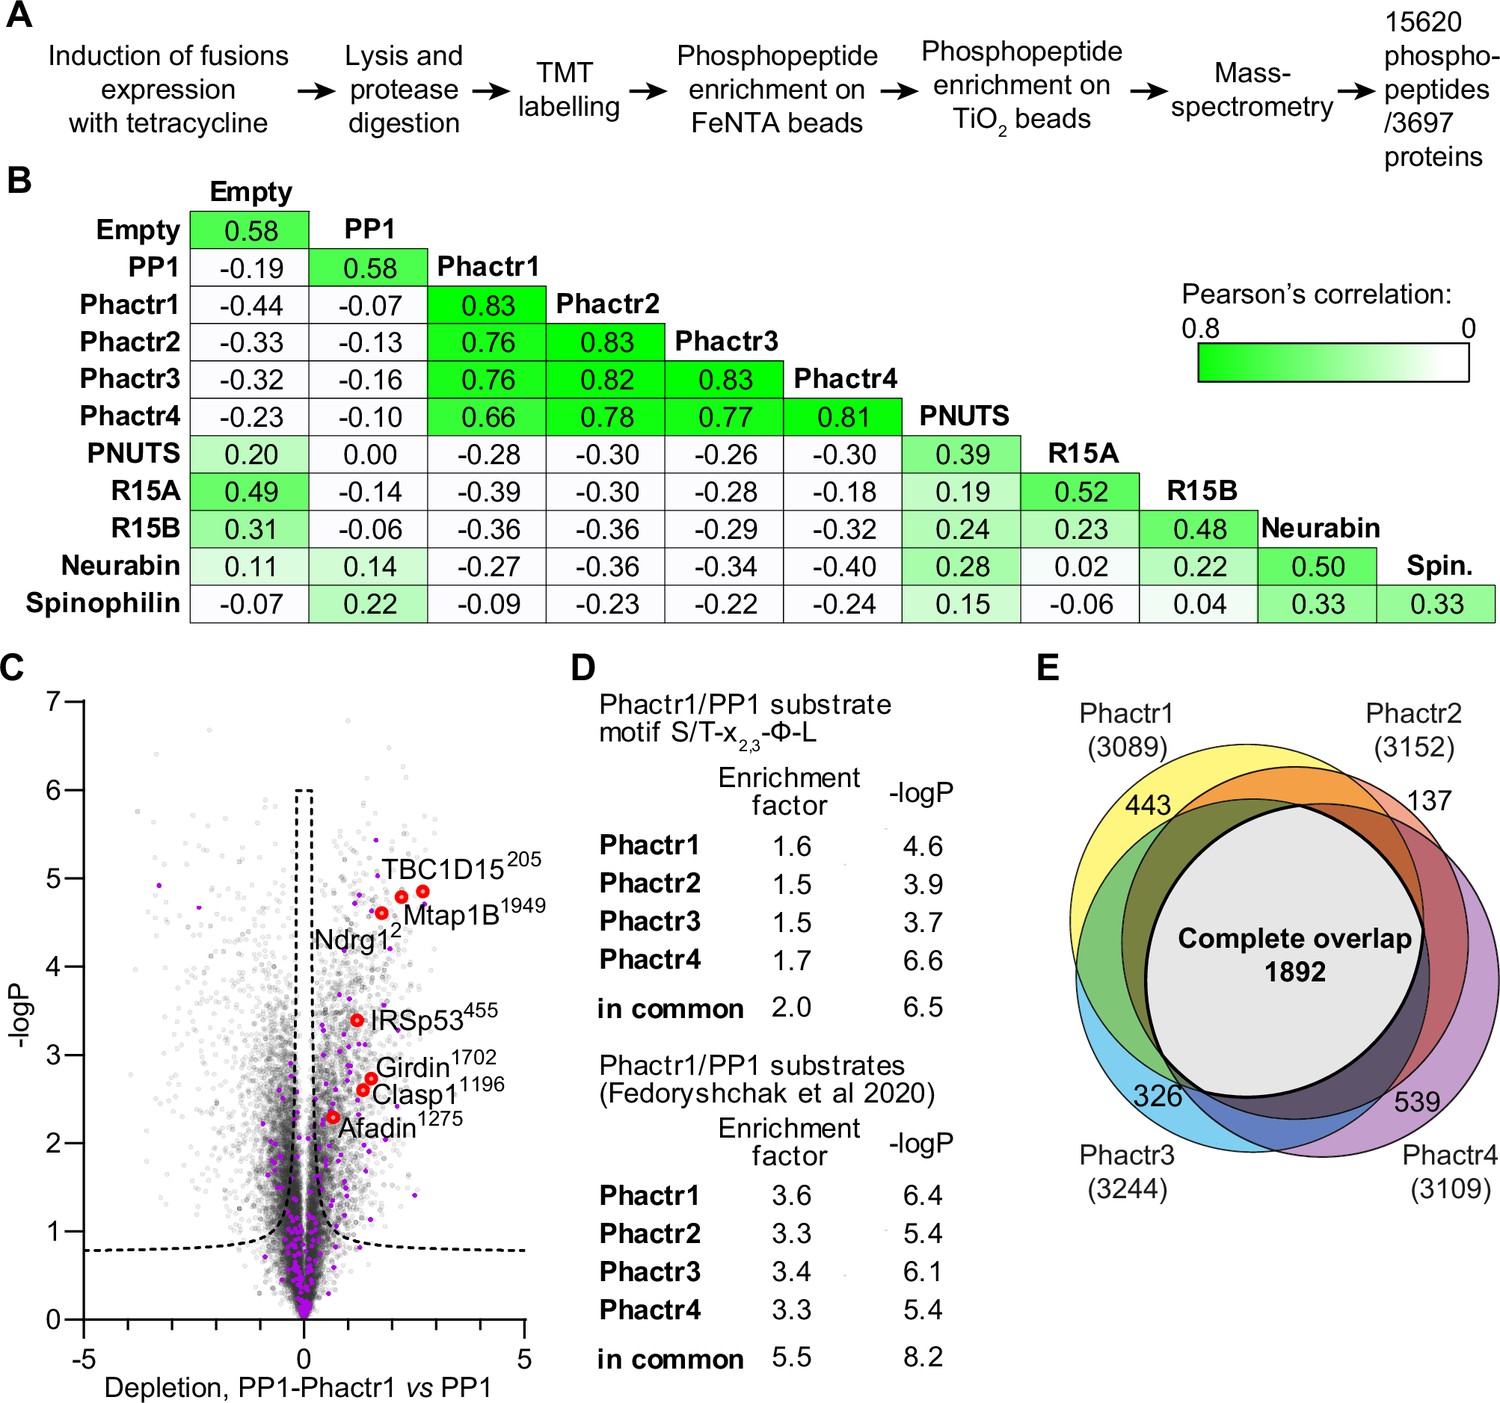
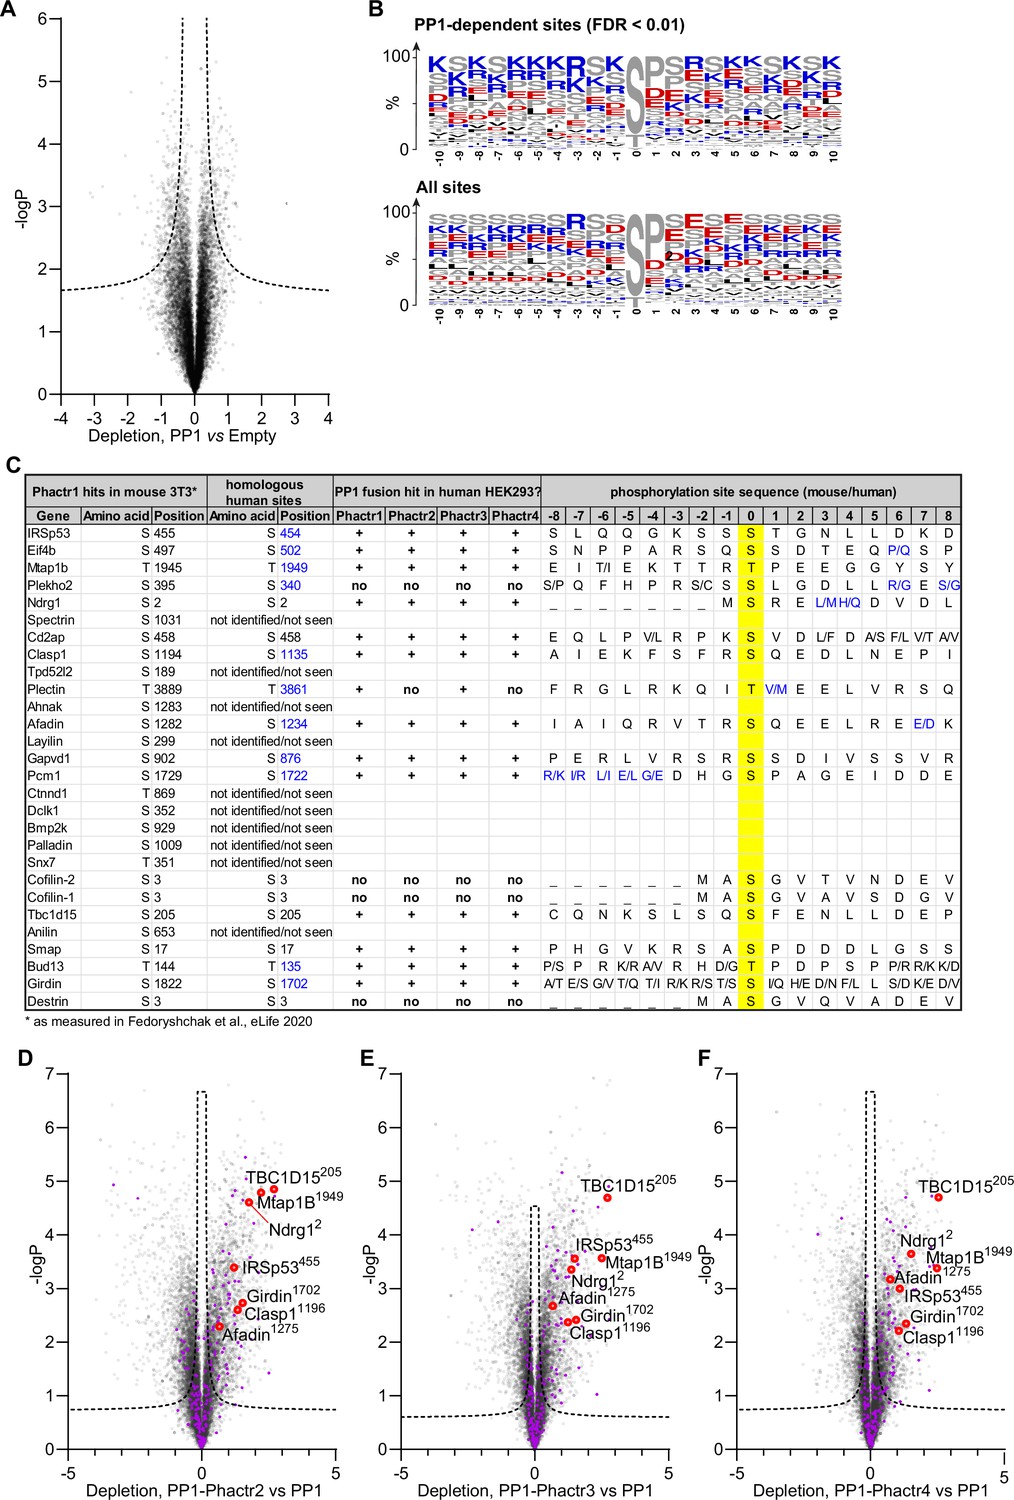
(A) Tandem mass tag (TMT) phosphoproteomics workflow. (B) Average sample-to-sample correlations between triplicates from cells expressing the different fusion proteins, PP1α(7–304)-SGSGS alone, or empty vector. For the same fusion-expressing cell lines, the average of Pearson coefficients of correlation within a triplicate are shown. (C) Specific phosphosite depletion in cells expressing PP1-Phactr1 as opposed to PP1 alone. Abundances of specific phosphosites in PP1 and PP1-Phactr1 samples were determined, log-transformed, and expressed as Z-scores. For each phosphosite, depletion in cells expressing PP1-Phactr1 as opposed to PP1 alone was quantified as the difference between the PP1 and PP1-Phactr1 Z-scores, and plotted versus -log10p. Dashed line, 5% false discovery rate cut-off. Purple, phosphosites conforming to the Phactr1/PP1 substrate motif S/T-x2,3-Φ-L. Red, Phactr1/PP1 substrates identified previously (Fedoryshchak et al., 2020). (D) Enrichment of hits conforming to the Phactr1 substrate motif S/T-x2,3-Φ-L and of hits identified in the previous study in all Phactr samples calculated using Fisher’s exact test. (E) Venn diagram showing overlap between hits identified as potential Phactr1-4 substrates.
Figure 2—figure supplement 1
Detailed analysis of PP1 and PP1-Phactr1-4 phosphoproteomics.
(A) Phosphorylation sites depleted in PP1-expressing samples compared with control empty-vector samples. Dashed line, 1% false discovery rate cut-off. (B) Frequency plots for residues identified as PP1 hits in (A) and for all phosphorylation sites in the analysis. Enrichment is broadly consistent with published findings (Hoermann et al., 2020). (C) The top Phactr1/PP1 substrate sites previously identified in mouse NIH3T3 cells (Fedoryshchak et al., 2020) are listed and compared with the candidate substrates for the four PP1-Phactr fusions identified here in human 293 Flp-In T-REx cells. Phosphorylation sites that could not be identified or that were not detectable in 293 Flp-In T-REx cells are indicated. ‘+’ and ‘no‘ indicate phosphorylation sites identified in 293 Flp-In T-REx cells that were either sensitive (+) or insensitive (no) to PP1-Phactr fusion expression. (D–F) Specific phosphorylation site depletion in cells expressing PP1-Phactr2 (C), PP1-Phactr3 (D), or PP1-Phactr4 (E) fusion proteins as opposed to PP1 alone. Abundances of specific phosphorylation sites in PP1 and the different PP1-Phactr fusion samples were determined, log-transformed, and expressed as Z-scores. For each phosphorylation site, depletion in cells expressing each fusion as opposed to PP1 alone was quantified as the difference between the PP1 and PP1-Phactr fusion Z-scores, and plotted versus -log10p. Dashed line, 5% false discovery rate cut-off. Purple, phosphorylation sites conforming to the Phactr1/PP1 substrate motif S/T-x2,3-Φ-L. Red, top Phactr1/PP1 hits identified previously (Fedoryshchak et al., 2020).
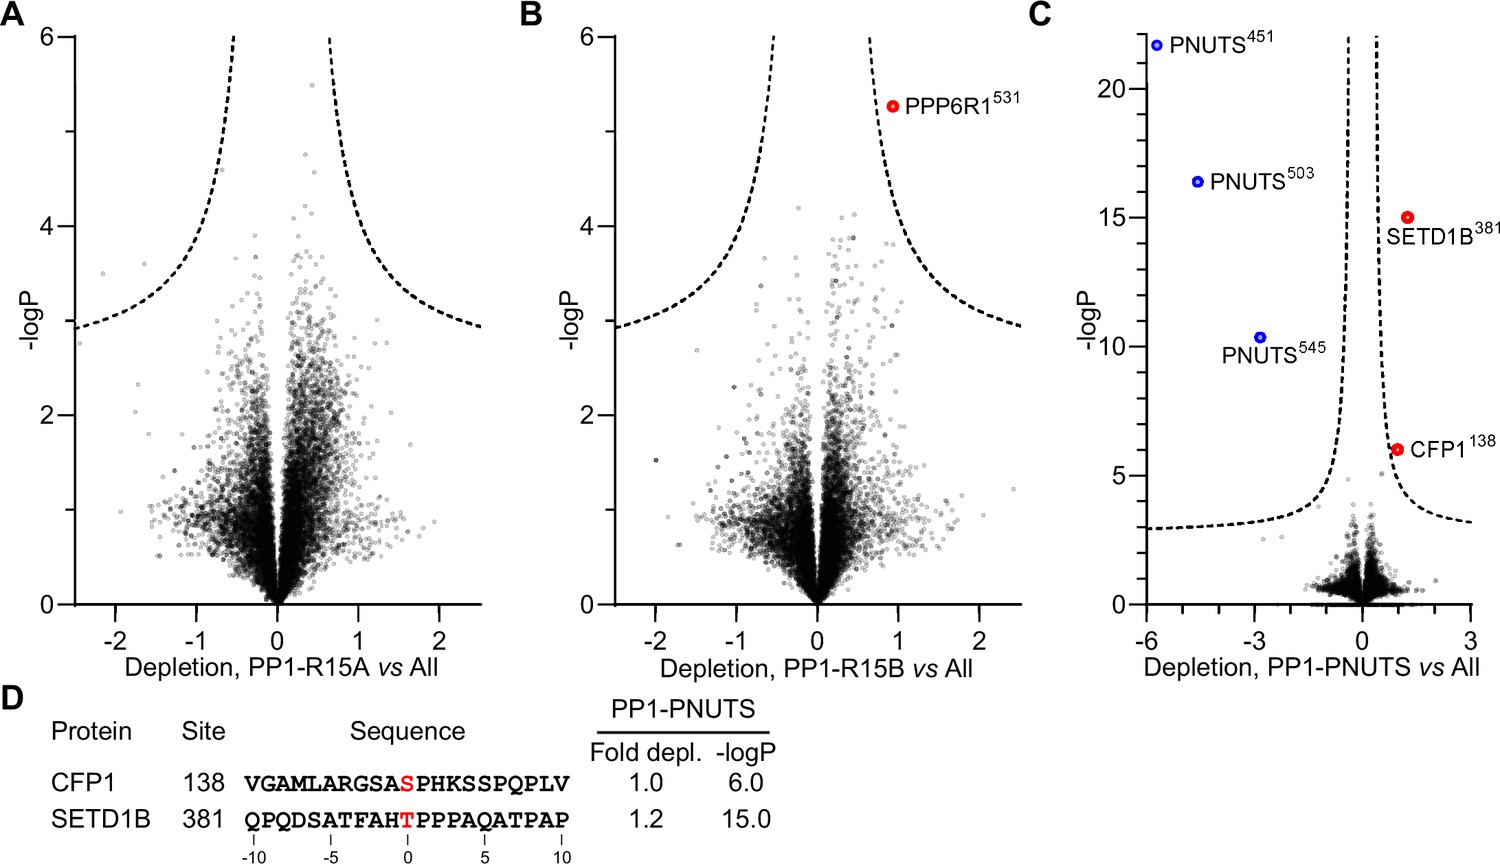
Figure 2—figure supplement 2
Detailed analysis of PP1-R15A, PP1-R15B and PP1-PNUTS phosphoproteomics.
(A) Identification of PP1-R15A substrates. Abundances of specific phosphorylation sites in PP1-R15A samples were determined, log-transformed, and expressed as Z-scores. For each phosphorylation site, the average abundance in the remaining datasets, excluding PP1-R15B, was quantified in the same way. Depletion of phosphorylation sites in cells expressing PP1-R15A was quantified as the difference between the PP1-R15A and the dataset average Z-scores, and plotted versus -log10p. Dashed line, 5% false discovery threshold. (B) Identification of PP1-R15B substrates. Depletion of each phosphorylation site in cells expressing PP1-R15B, relative to its average abundance in the other datasets, excluding PP1-R15A, was quantified and plotted as in (A). Significantly depleted phosphorylation sites are highlighted in red. (C) Identification of PP1-PNUTS substrates. Depletion of each phosphorylation site in cells expressing PP1-PNUTS, relative to its average abundance in all the other datasets, was quantified and plotted as in (D). Significantly depleted phosphorylation sites are highlighted in red. PNUTS phosphorylation sites exhibiting increased abundance, presumably reflecting PP1-PNUTS fusion expression, are highlighted in blue.
Figure 3 with 1 supplement
Phosphoproteomics of PP1-Neurabin and PP1-Spinophilin.
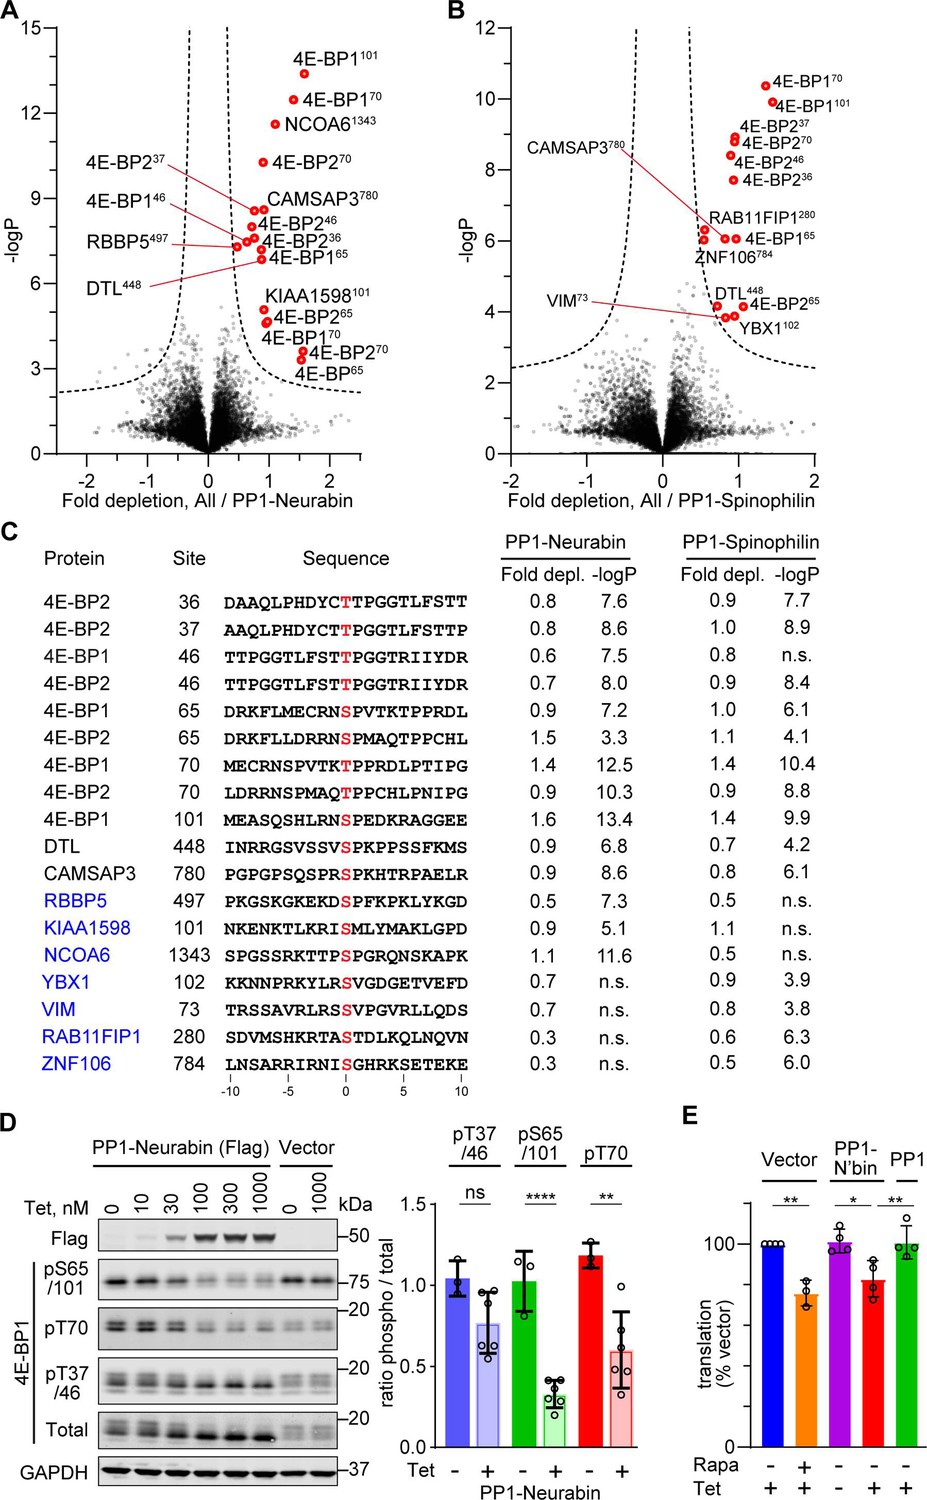
(A) Identification of PP1-Neurabin substrates. Abundances of specific phosphorylation sites in PP1-Neurabin samples were determined, log-transformed, and expressed as Z-scores. For each phosphosite, the abundance in the remaining datasets, excluding PP1-Spinophilin, was quantified in the same way. Depletion of phosphosites in cells expressing PP1-Neurabin was quantified as the difference between the PP1-Neurabin and the dataset average Z-scores, and plotted versus -log10p. Dashed line, 5% false discovery threshold; significantly depleted phosphosites are highlighted in red. (B) Identification of PP1-Spinophilin substrates. Depletion of each phosphorylation site in cells expressing PP1-Spinophilin, relative to its average abundance in the other datasets, excluding PP1-Neurabin, was quantified and plotted as in (A). (C) Sequences of significantly depleted phosphorylation sites identified in (A and B). (D) Immunoblot analysis of 4E-BP1 phosphorylation sites in 293 Flp-In T-REx cells upon induced expression of PP1-Neurabin or empty vector. Note that the low level of PP1-Neurabin expression in uninduced cells (see Figure 3—figure supplement 1C) alters the relative abundance of the different phosphorylated forms compared with 293 Flp-In T-REx cells expressing vector alone. (E) Protein synthesis quantification assay. 293 Flp-In T-REx cells expressing vector alone, PP1-Neurabin, or PP1, were induced with tetracycline (50 nM) and/or treated with rapamycin (50 nM) for 16 hr as indicated before treatment with O-propargyl puromycin to label nascent polypeptides, which were conjugated to Alexa Fluor-488 azide and quantified by flow cytometry. Fluorescence intensities were normalised to untreated cells.
-
Figure 3—source data 1
Original files for western blot analysis displayed in Figure 3D, Figure 4—figure supplement 1C.
- https://cdn.elifesciences.org/articles/103403/elife-103403-fig3-data1-v1.zip
-
Figure 3—source data 2
Full-size western blots indicating the relevant bands and treatments related to Figure 3D, Figure 4—figure supplement 1C.
- https://cdn.elifesciences.org/articles/103403/elife-103403-fig3-data2-v1.zip
-
Figure 3—source data 3
Flow cytometry data related to Figure 3E.
- https://cdn.elifesciences.org/articles/103403/elife-103403-fig3-data3-v1.zip
Figure 3—figure supplement 1
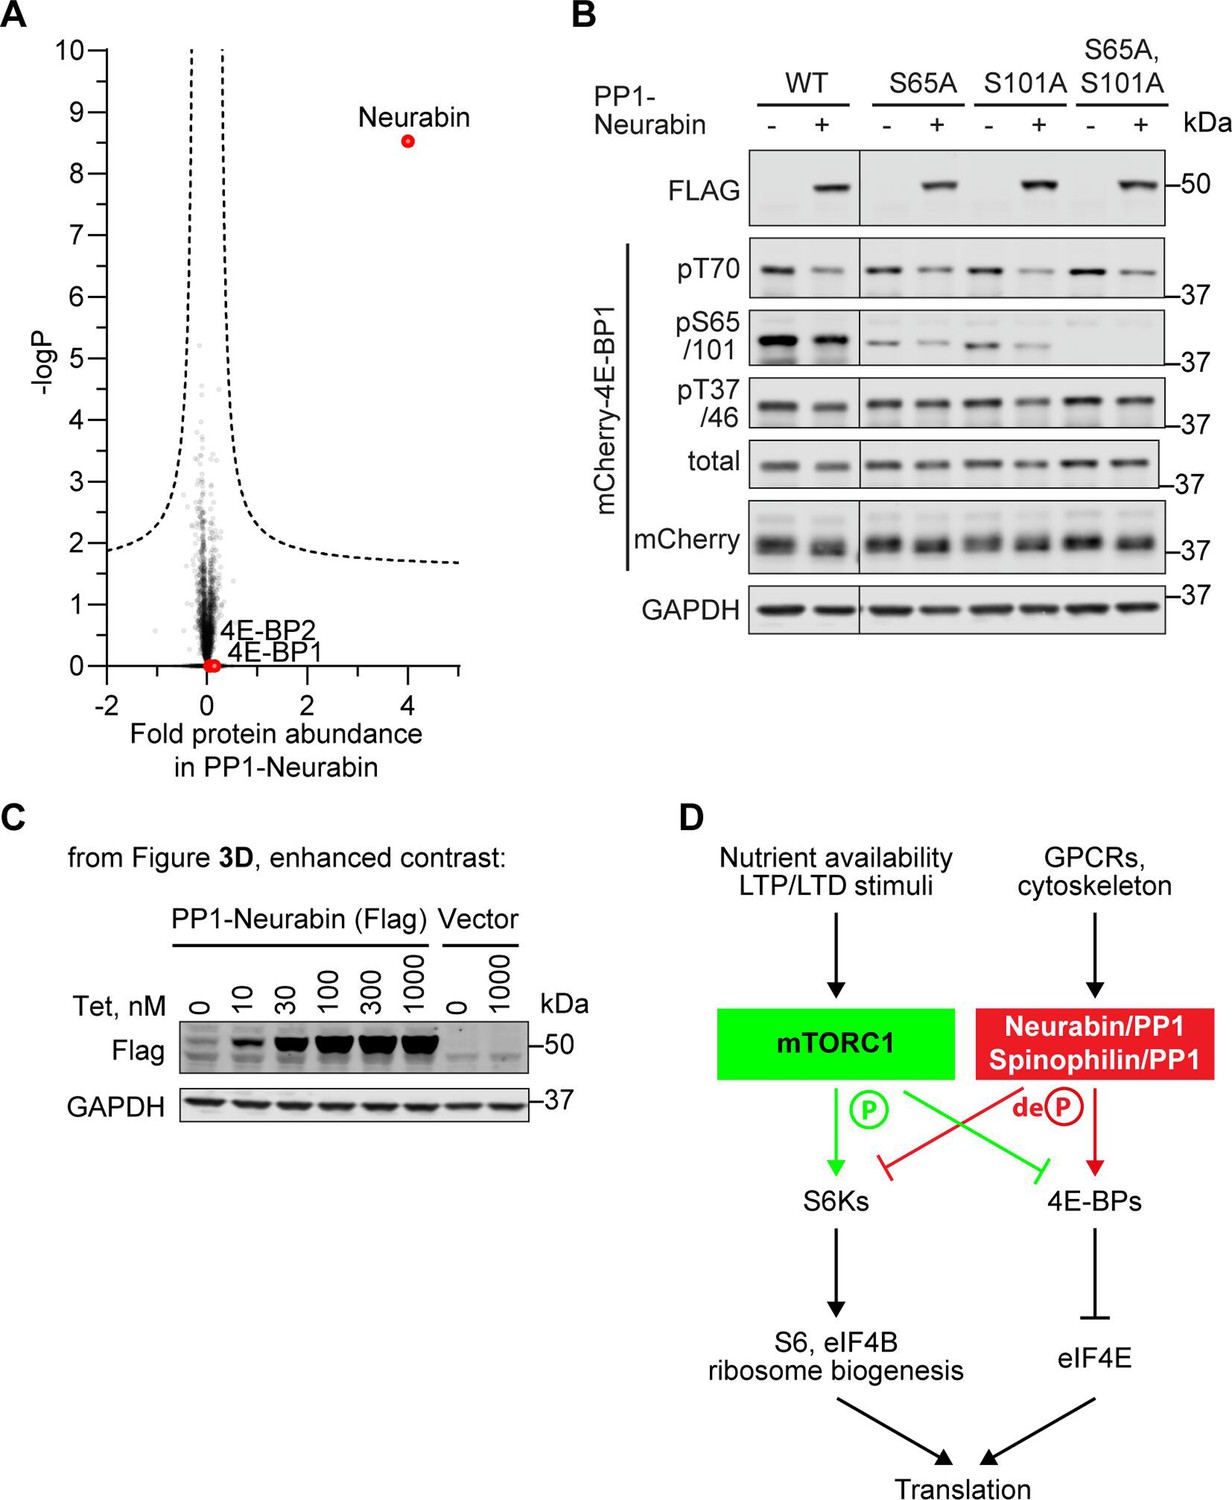
Additional details for the identification of 4E-BP1 as PP1-Neurabin target.
(A) 4E-BP1 and 4E-BP2 levels are unaffected by PP1-Neurabin expression. Protein abundances in PP1-Neurabin cells before and after induction of PP1-Neurabin expression were determined, log-transformed, and normalised to median. Change in relative abundance upon induction was scored as the difference between the induced and uninduced samples, and plotted versus -log10p. Dashed line, 5% false discovery threshold. Neurabin and the 4E-BPs are highlighted in red. (B) Specificity analysis of the commercial anti-phospho-S65 antibody. (C) Basal expression of PP1-Neurabin in uninduced 293 Flp-In T-REx cells. Data are contrast-enhanced blots from Figure 3D. (D) mTORC1 pathway schematic (see Hoeffer and Klann, 2010; Liu and Sabatini, 2020).
-
Figure 3—figure supplement 1—source data 1
Original files for western blot analysis displayed in Figure 3—figure supplement 1B, Figure 4—figure supplement 1A.
- https://cdn.elifesciences.org/articles/103403/elife-103403-fig3-figsupp1-data1-v1.zip
-
Figure 3—figure supplement 1—source data 2
Full-size western blots indicating the relevant bands and treatments related to Figure 3—figure supplement 1B, Figure 4—figure supplement 1A.
- https://cdn.elifesciences.org/articles/103403/elife-103403-fig3-figsupp1-data2-v1.zip
Figure 4 with 1 supplement
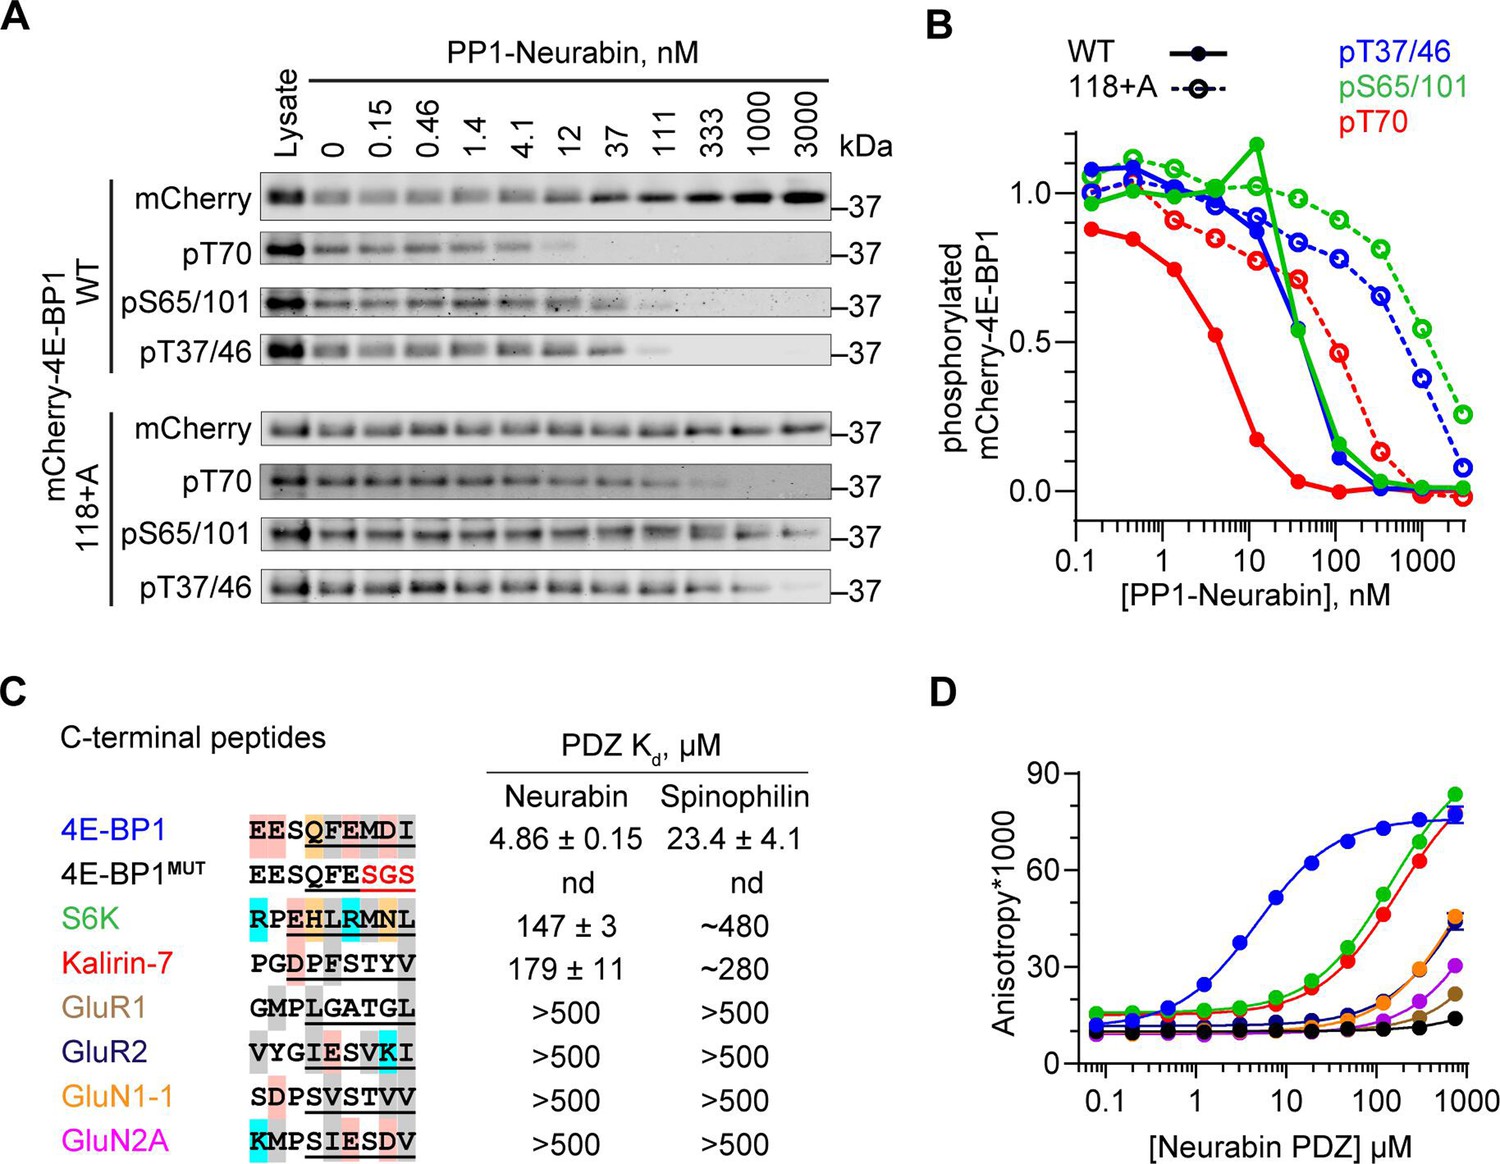
4E-BP1 is a substrate of PP1-Neurabin.
(A) mCherry-tagged wildtype 4E-BP1 or 4E-BP1(118+A) were expressed and purified from 293 cells, incubated with increasing amounts of recombinant PP1-Neurabin. Phosphorylation of the indicated sites was analysed by immunoblotting. (B) Quantification of (A). (C) Left, sequence alignment of potential Neurabin/Spinophilin PDZ domain ligands. Grey shading, hydrophobic residues; pink, acidic residues; cyan, basic residues; orange, hydrophilic residues. Underlining shows sequences N-terminally linked to 6-carboxyfluorescein (FAM) for use in fluorescence polarisation (FP) assay. Right, binding affinities for the Neurabin and Spinophilin PDZ domains as determined in the FP assay. (D) FP assay. FAM-labelled peptides (see C) were titrated with increasing concentrations of recombinant Neurabin PDZ domain and affinity estimated from change in fluorescence anisotropy. For Spinophilin data, see Figure 4—figure supplement 1B.
-
Figure 4—source data 1
Original files for western blot analysis displayed in Figure 4A.
- https://cdn.elifesciences.org/articles/103403/elife-103403-fig4-data1-v1.zip
-
Figure 4—source data 2
Full-size western blots indicating the relevant bands and treatments related to Figure 4A.
- https://cdn.elifesciences.org/articles/103403/elife-103403-fig4-data2-v1.zip
-
Figure 4—source data 3
Fluorescence polarisation assay related to Figure 4C, D, Figure 4—figure supplement 1A, B.
- https://cdn.elifesciences.org/articles/103403/elife-103403-fig4-data3-v1.zip
Figure 4—figure supplement 1

4E-BP1 is a substrate of both PP1-Neurabin and PP1-Spinophilin.
(A) Immunoblotting analysis of wildtype mCherry-4E-BP1 or mutants either lacking the six C-terminal residues (ΔCter) or containing an additional C-terminal alanine (118+A) upon expression in 293 cells with or without PP1-Neurabin expression as indicated. (B) Left, sequence alignment of potential Neurabin/Spinophilin PDZ domain ligands. Grey shading, hydrophobic residues; pink, acidic residues; cyan, basic residues; orange, hydrophilic residues. Underlining shows sequences N-terminally linked to 6-carboxyfluorescein (FAM) for use in fluorescence polarisation (FP) assay. FAM-labelled peptides were titrated with increasing concentrations of recombinant Spinophilin PDZ domain and affinity estimated from change in fluorescence anisotropy (for summary, see Figure 4C). (C) Immunoblotting analysis of S6K phosphorylation in 293 Flp-In T-REx cells upon expression of PP1-Neurabin or empty vector.
Figure 5 with 2 supplements
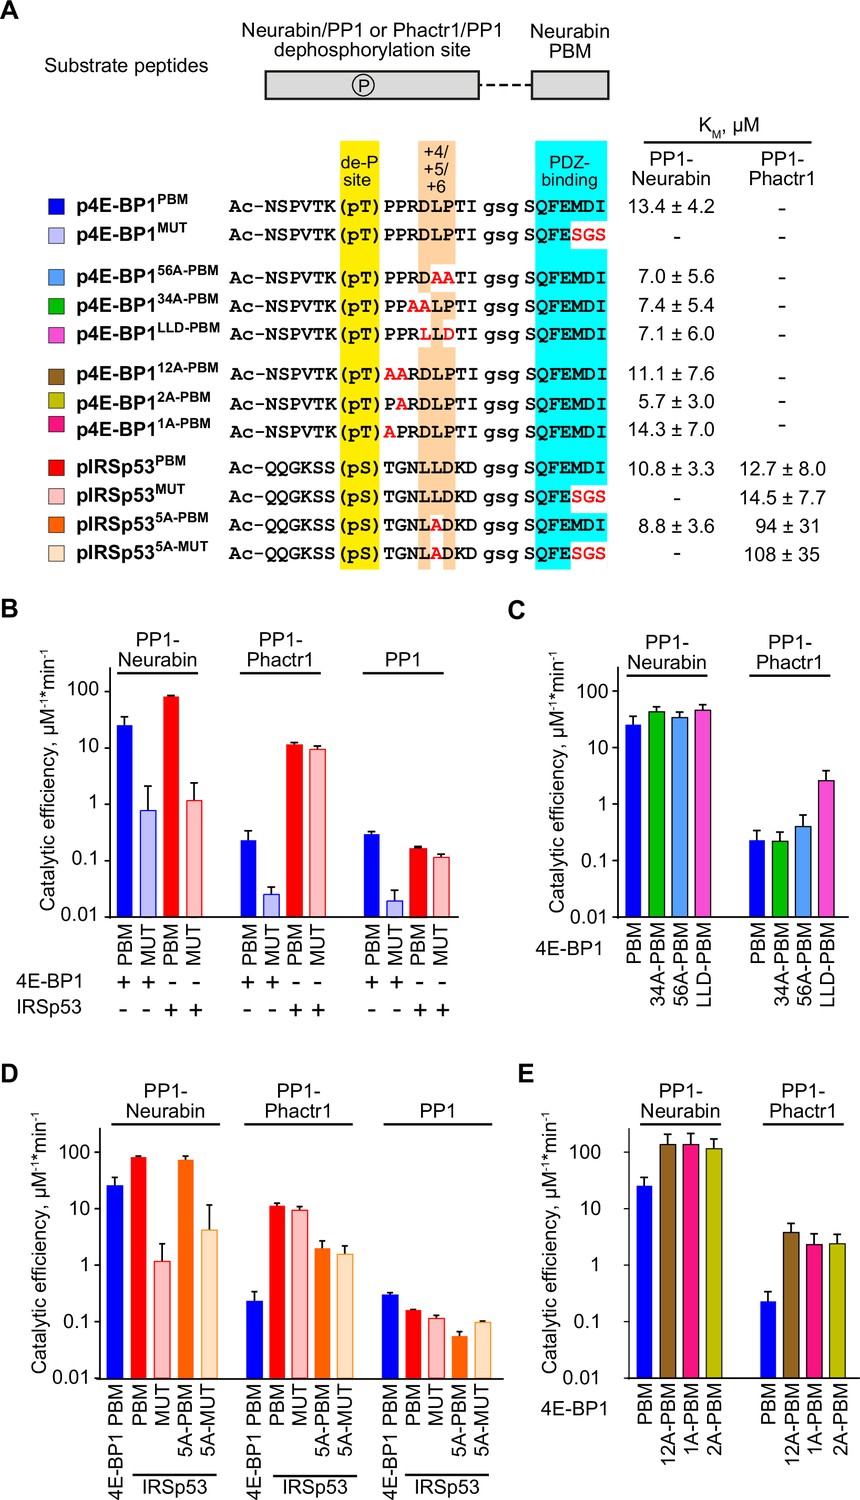
Substrate specificity determinants of PP1-Neurabin.
(A) Top, synthetic substrate peptides contain either the 4E-BP1 T70 or IRSp53 S455 phosphorylation sites, joined by a GSG linker to the Neurabin PDZ-binding C-terminal sequences. PBM, PDZ-binding motif (FEMDI); MUT, mutated PBM (FEsgs). Below, sequences of the different peptides analysed; highlights indicate the dephosphorylation site (yellow), the +4/+6 region (orange), and the PDZ-binding sequence (cyan), with alanine and other substitutions indicated in red. Peptides were treated with recombinant PP1-Neurabin, PP1-Phactr1, or PP1 in the presence of the phosphate sensor, and KM and catalytic efficiencies determined. KM are shown at the right; for catalytic efficiency quantification, see Figure 5—figure supplement 1A. For raw and processed data, see Supplementary file 3. (B–E) Panels show relative catalytic efficiencies as determined from data displayed in Figure 5—figure supplement 1B–E. Each panel shows different subsets of the data to highlight comparison between different enzymes and/or substrates. For raw and processed data, see Supplementary file 3. (B) Comparison of Neurabin-PP1 and Phactr1-PP1 substrates 4E-BP1 and IRSp53 to assess the role of the Neurabin PDZ domain in substrate recognition. (C) Role of the +4/+6 region in 4E-BP1 substrate recognition. (D) Role of the +5 residue in IRSp53 substrate recognition. (E) Role of 4E-BP1+1/+2 residues.
-
Figure 5—source data 1
Activity assay data related to Figure 5, Figure 5—figure supplement 1.
- https://cdn.elifesciences.org/articles/103403/elife-103403-fig5-data1-v1.zip
Figure 5—figure supplement 1
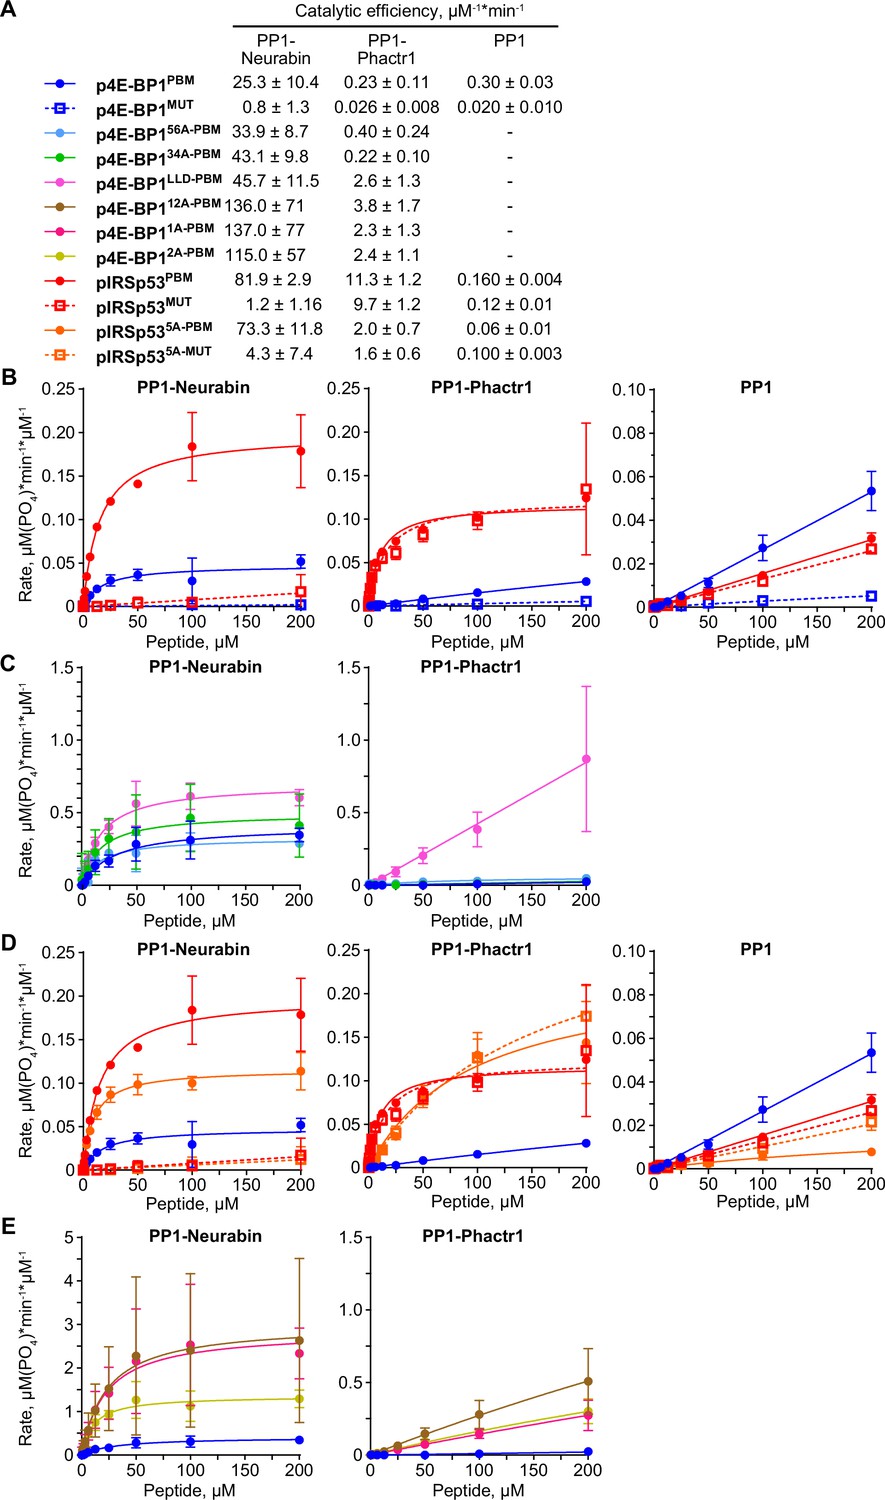
Substrate dephosphorylation by PP1-Neurabin, PP1-Phactr1 and PP1.
(A) Catalytic efficiencies for the various peptide dephosphorylation reactions by PP1-Neurabin, PP1-Phactr1, and PP1 are shown. For raw and processed data, see Supplementary file 3. (B–E) Dephosphorylation reaction rates plotted against substrate concentration for different sets of phosphopeptides with PP1-Neurabin, PP1-Phactr1, or PP1.
Figure 5—figure supplement 2
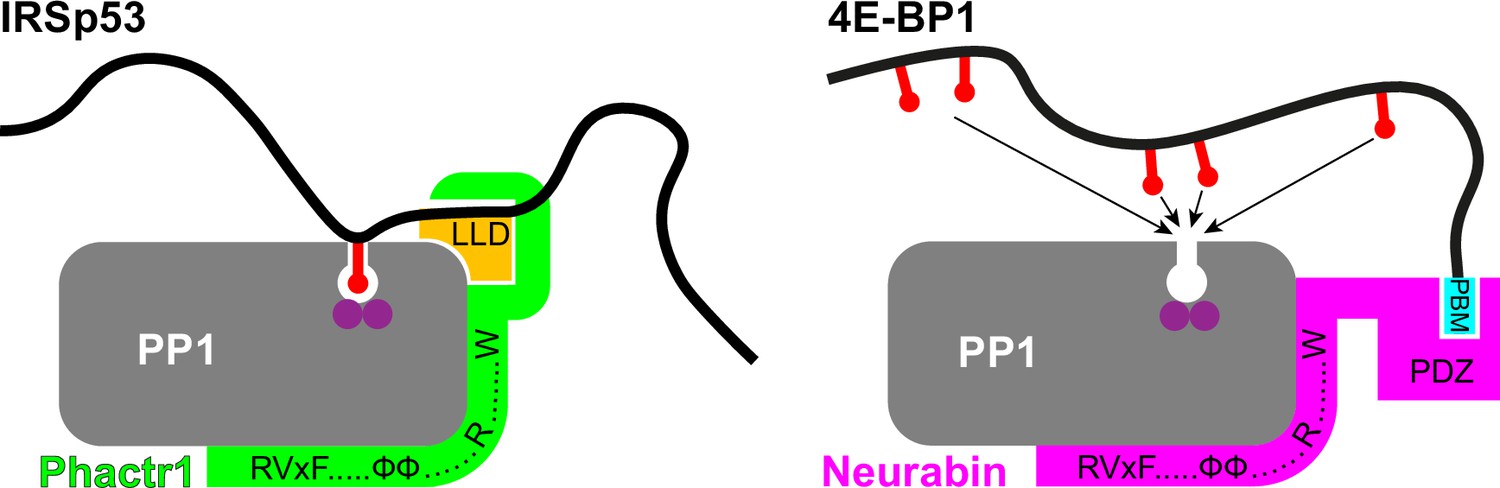
Schematic showing the mechanisms of substrate binding by Phactr1/PP1 and Neurabin/PP1 complexes.
Phosphate groups are indicated by red lollipops, the Phactr1 consensus in orange, and the Neurabin PBM motif in cyan.
Figure 6 with 2 supplements
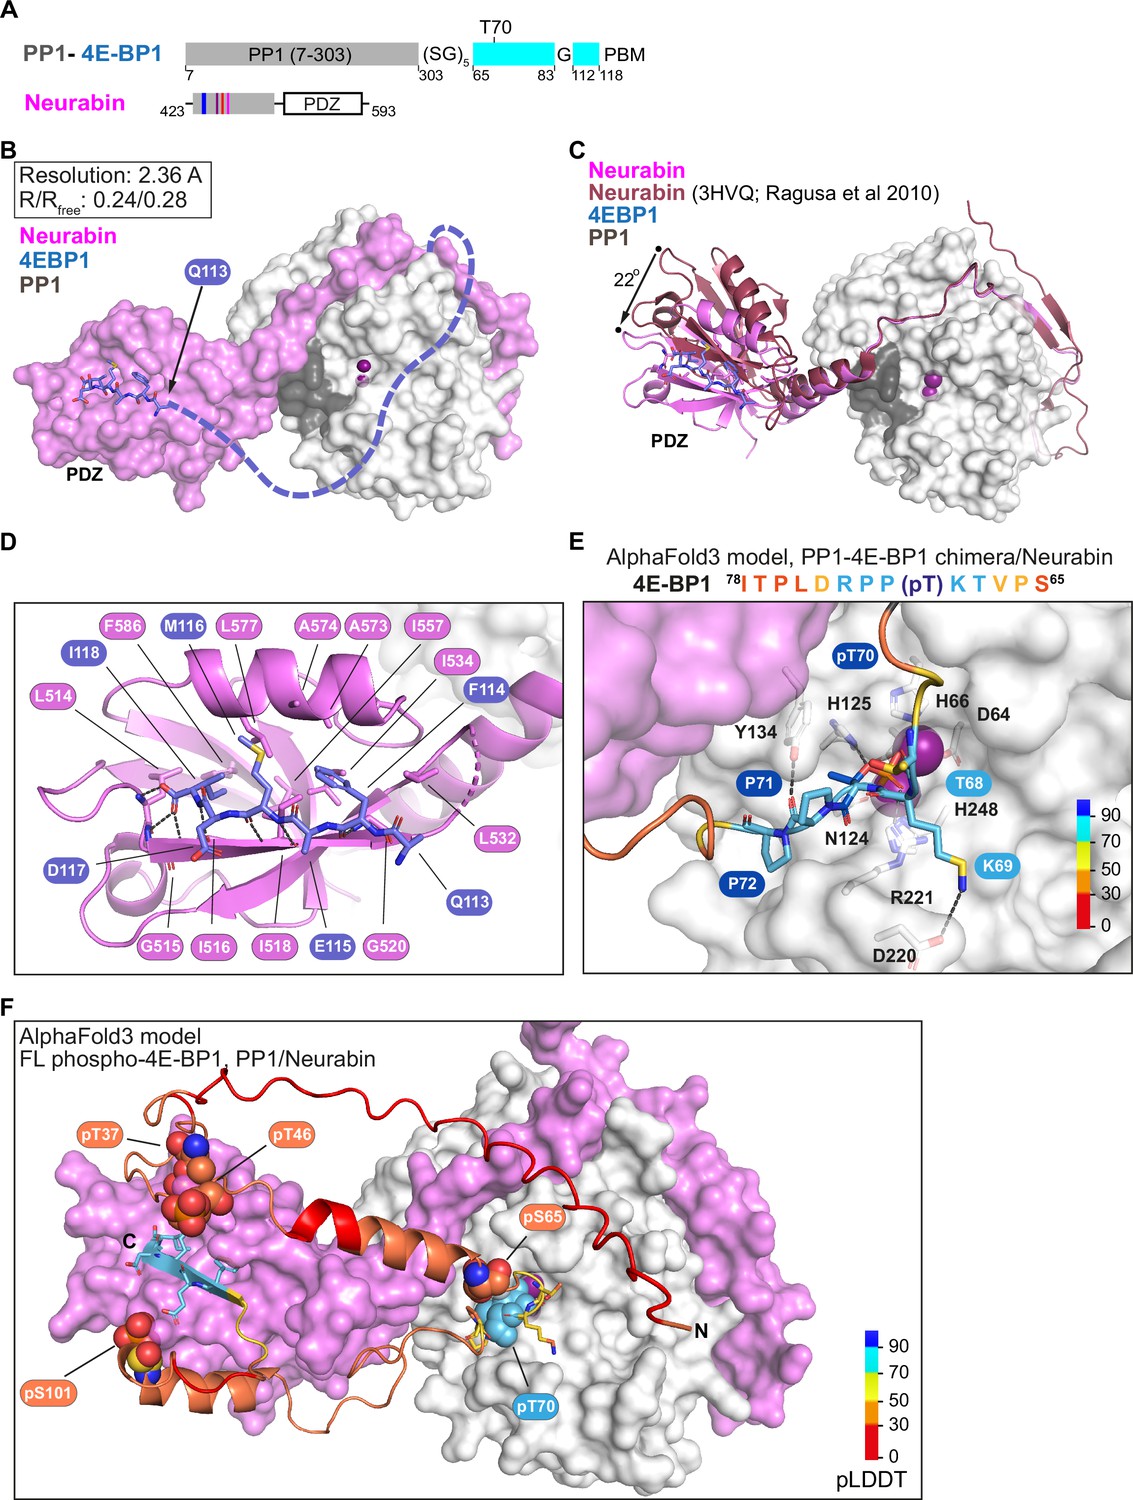
Structural analysis of 4E-BP1 interactions with PP1-Neurabin.
(A) Schematic of the PP1-4E-BP1 chimera and of Neurabin PP1-interacting and PDZ domain sequences. (B) Crystal structure of the PP1-4E-BP1/Neurabin complex. PP1 in white surface representation, Neurabin in lilac surface representation, 4E-BP1 in blue stick representation, with unresolved sequences indicated by dashed line. PP1 active site presumptive Mn2+ ions in purple. (C) Comparison of PP1-4E-BP1/Neurabin complex structure with the previously published Neurabin/PP1 holophosphatase structure (9PDB 3HVQ) (Ragusa et al., 2010). PP1 in white surface representation, Neurabin in ribbon representation (lilac, PP1-4E-BP1/Neurabin; red, Neurabin/PP1). 4E-BP1 in blue stick representation, unresolved sequences not shown. Structures are superimposed on PP1 residues 7–298 (rmsd = 0.21 Å, 277 alpha carbons). (D) Close-up view of interactions between 4E-BP1 C-terminal sequences (blue sticks) with the Neurabin PDZ domain (lilac cartoons). (E) AlphaFold3 model of the phosphorylated PP1-4E-BP1 chimera/Neurabin(423–593) interaction. A close-up view of predicted interaction of pT70 with the PP1 catalytic site is shown. For PAE and pLDDT plots, see Figure 6—figure supplement 2A. PP1 and Neurabin are shown respectively in white and lilac surface representation, with PP1 active site Mn2+ ions in purple. 4E-BP1 sequences are in stick representation, colour-coded according to the AlphaFold3 pLDDT score (inset). See also Figure 6—figure supplement 2C. (F) AlphaFold3 modelling of the Neurabin(423–593)/PP1-5x phospho-4E-BP1 interaction. PP1 and Neurabin are shown respectively in white and lilac surface representation, with PP1 active site Mn2+ ions in purple. 4E-BP1 sequences are in ribbon and stick representation, colour-coded according to the AlphaFold3 pLDDT score (inset), with the 4E-BP1 phosphorylations at T37, T46, S65, T70, and S101 shown in spheres. For PAE and pLDDT plots, see Figure 6—figure supplement 2F.
-
Figure 6—source data 1
AlphaFold 3 modelling results related to Figure 6, Figure 6—figure supplement 2.
- https://cdn.elifesciences.org/articles/103403/elife-103403-fig6-data1-v1.zip
Figure 6—figure supplement 1
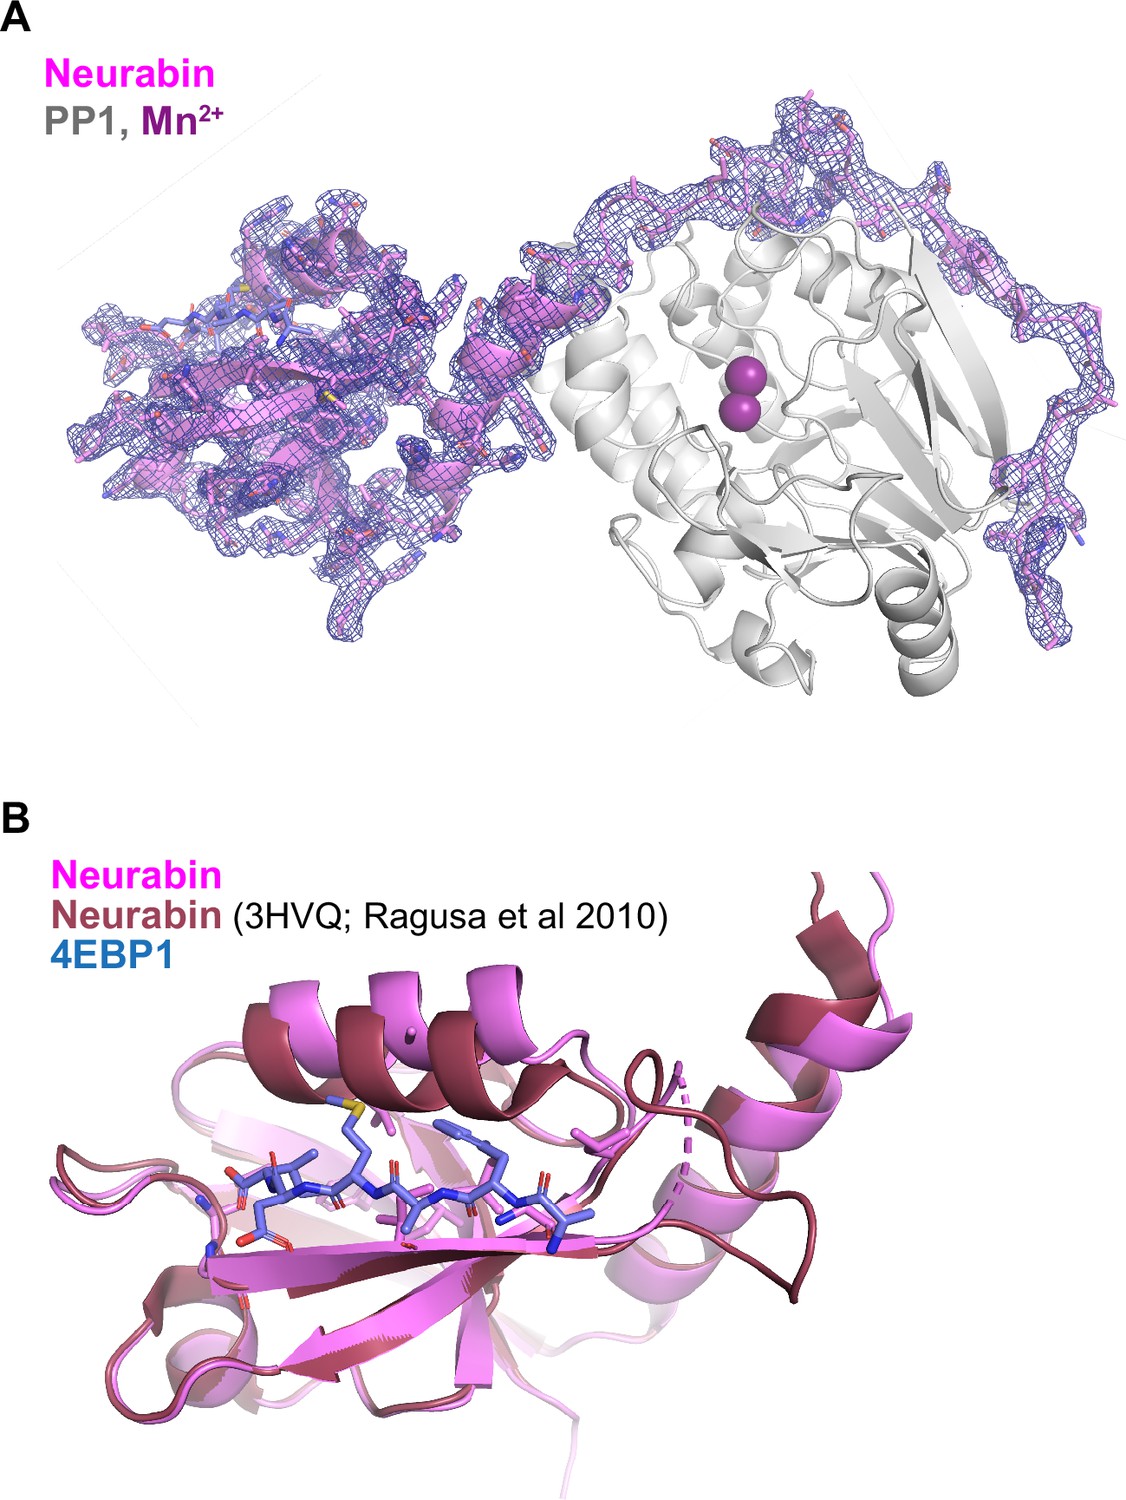
Additional characterisation of the PP1-4E-BP1/Neurabin complex.
(A) Crystal structure of the PP1-4E-BP1/Neurabin complex. PP1 in white surface representation, with active site presumptive Mn2+ ions in purple, Neurabin in lilac cartoon representation, and 4E-BP1 in blue stick representation. PP1 2Fo-Fc electronic density contoured at 1 sigma level is displayed around Neurabin. (B) Comparison of the PBM-liganded Neurabin PDZ domain (pink ribbons) with the previously published structure of the unliganded Neurabin PDZ domain (red ribbons) (PDB 3HVQ, Ragusa et al., 2010). The 4E-BP1 PBM is shown in blue stick representation.
Figure 6—figure supplement 2
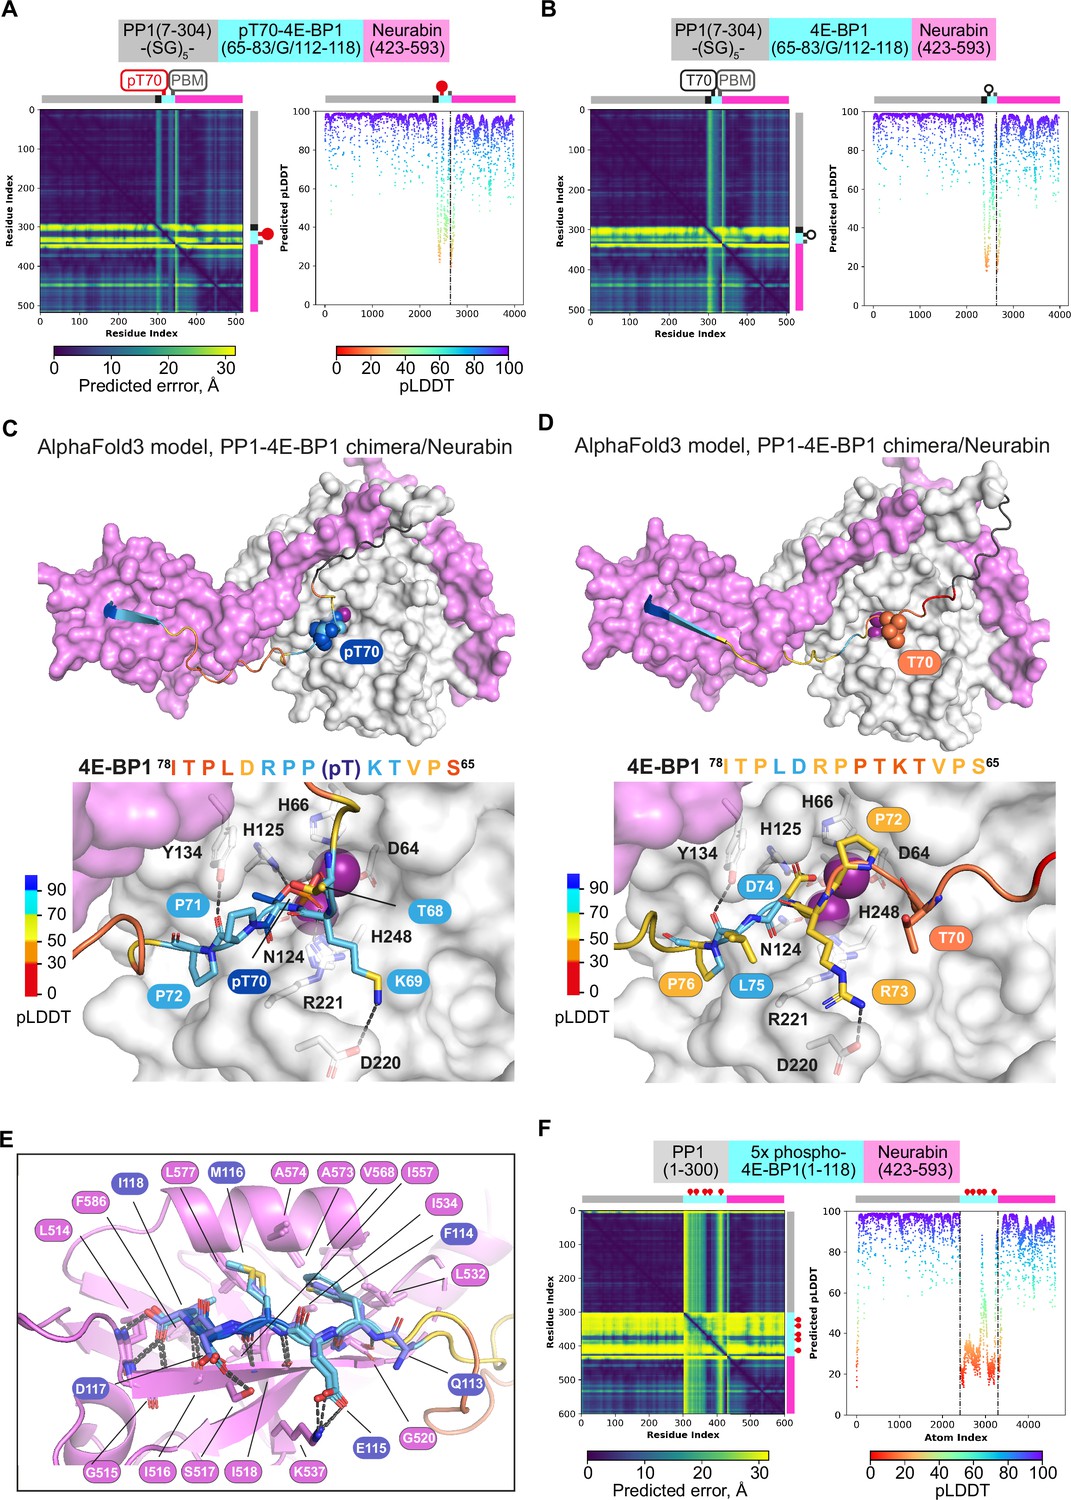
AlphaFold3 predictions for phosphorylated 4E-BP1 binding to PP1 and Neurabin.
(A, B) AlphaFold3 models of the phosphorylated (A) and unphosphorylated (B) PP1-4E-BP1 chimera/Neurabin(423–593) interaction. Left, PAE plots; right, pLDDT plots, with confidence boundaries indicated by dashed lines (>90%, very high [side chains]; 70–90%, high [main chain]; 50–70%, low). (C, D) AlphaFold3 models of the phosphorylated (C) and unphosphorylated (D) PP1-4E-BP1 chimera/Neurabin(423–593) interaction. PP1 and Neurabin are shown respectively in white and lilac surface representation with PP1 active site Mn2+ ions in purple. 4E-BP1 sequences are in stick representation, colour-coded according to the AlphaFold3 pLDDT score (inset), with pT70 and T70 in space-fill; linker residues are in black. Below are shown close-up views of predicted interactions with the PP1 catalytic site. For PAE and pLDDT plots, see (A, B). (E) Comparison of crystal structure and AlphaFold3 model of 4E-BP1/PDZ interactions in phosphorylated and unphosphorylated PP1-4E-BP1 chimera/Neurabin(423–593) interaction. Predicted structures are oriented by superposition of the PDZ domain, shown in lilac ribbon representation. 4E-BP1 sequences are in stick representation, colour-coded according to the AlphaFold3 pLDDT score as in panels C and D. Note that AlphaFold3 does not predict any interaction between the Neurabin PDZ domain and the 4E-BP1(118+A) PBM mutant characterised in Figure 4. (F) AlphaFold3 modelling of the Neurabin(423–593)/PP1-5x phospho-4E-BP1 interaction. Left, PAE plots; right, pLDDT plots, with confidence boundaries indicated by dashed lines (>90%, very high [side chains]; 70–90%, high [main chain]; 50–70%, low).
Tables
Table 1
Crystallographic data and refinement statistics.
| PDB 9GSU | |
|---|---|
| Resolution range | 52.48–2.36 (2.42–2.36) |
| Space group | C2221 |
| Unit cell a, b, c | 104.95 130.64 156.13 |
| α, β, γ | 90 90 90 |
| Total reflections | 1 207 183 (85 193) |
| Unique reflections | 44 376 (3 023) |
| Multiplicity | 27.2 (28.2) |
| Completeness (%) | 98.91 (91.66) |
| Mean I/sigma(I) | 5.29 (0.20) |
| Wilson B-factor | 49.25 |
| R-merge | 0.31 (12.11) |
| R-meas | 0.32 (12.33) |
| R-pim | 0.06 (2.30) |
| CC1/2 | 0.99 (0.28) |
| Reflections used in refinement | 44 019 (2 889) |
| Reflections used for R-free | 1 996 (131) |
| Rwork | 0.24 (0.36) |
| Rfree | 0.28 (0.32) |
| Number of non-hydrogen atoms | 6 180 |
| macromolecules | 6 156 |
| Ligands | 4 |
| Solvent | 20 |
| Protein residues | 787 |
| RMS (bonds) | 0.003 |
| RMS (angles) | 0.61 |
| Ramachandran favoured (%) | 95.74 |
| Ramachandran allowed (%) | 4.26 |
| Ramachandran outliers (%) | 0.00 |
| Clash score | 3.23 |
| Average B-factor | 57.04 |
| Macromolecules | 57.05 |
| Ligands | 68.46 |
| Solvent | 50.83 |
Appendix 1—key resources table
| Reagent type (species) or resource | Designation | Source or reference | Identifiers | Additional information |
|---|---|---|---|---|
| Gene (Homo sapiens) | PPP1CA | UniProt P62136 | ||
| Gene (H. sapiens) | Phactr1 | UniProt Q9C0D0 | ||
| Gene (H. sapiens) | Phactr2 | UniProt O75167 | ||
| Gene (H. sapiens) | Phactr3 | UniProt Q96KR7 | ||
| Gene (H. sapiens) | Phactr4 | UniProt Q8IZ21 | ||
| Gene (H. sapiens) | PPP1R10 (PNUTS) | UniProt Q96QC0 | ||
| Gene (H. sapiens) | PPP1R9A Neurabin | UniProt Q9ULJ8 | ||
| Gene (H. sapiens) | PPP1R9B Spinophilin | UniProt Q96SB3 | ||
| Gene (H. sapiens) | PPP1R15A | UniProt O75807 | ||
| Gene (H. sapiens) | PPP1R15B | UniProt Q5SWA1 | ||
| Gene (H. sapiens) | S6K (RPS6KB1) | UniProt P23443 | ||
| Gene (H. sapiens) | 4E-BP1 (EIF4EBP1) | UniProt Q13541 | ||
| Strain (Escherichia coli) | 5-alpha competent E. coli | NEB C2992I | ||
| Strain (E. coli) | Protein expression BL21 (DE3) | NEB C2527H | ||
| Cell line (H. sapiens) | 293 Flp-In T-REx | Thermo R78007 | RRID:CVCL_U427 | |
| Antibody | Rabbit polyclonal anti-Flag M2 | Sigma F7425 | RRID:AB_439685 | WB 1:500 |
| Antibody | Goat polyclonal anti-IRSp53 | Abcam ab15697 | RRID:AB_301929 | WB 1:500 |
| Antibody | Mouse monoclonal anti-Afadin (B-5) | Santa Cruz sc-74433 | RRID:AB_1118816 | WB 1:200 |
| Antibody | Mouse monoclonal anti-GAPDH (0411) | Santa-Cruz sc-47724 | RRID:AB_627679 | WB 1:2000 |
| Antibody | Rabbit polyclonal anti-IRSp53 pS455 | Fedoryshchak et al., 2020 | WB 1:500 | |
| Antibody | Rabbit polyclonal anti-afadin pS1282 | Fedoryshchak et al., 2020 | WB 1:500 | |
| Antibody | Rabbit polyclonal anti-4E-BP1 pT70 | Cell Signaling 9455 | RRID:AB_330947 | WB 1:1000 |
| Antibody | Rabbit polyclonal anti-4E-BP1 pS65 (pS101) | Cell Signaling 9451 | RRID:AB_330945 | WB 1:1000 |
| Antibody | Rabbit polyclonal anti-4E-BP1 pT37/46 | Cell Signaling 9459 | RRID:AB_330944 | WB 1:1000 |
| Antibody | Rabbit polyclonal anti-4E-BP1 | Cell Signaling 9452 | RRID:AB_330946 | WB 1:1000 |
| Antibody | Rat monoclonal anti-mCherry | Thermo M11240 | RRID:AB_2536611 | WB 1:1000 |
| Antibody | Rabbit polyclonal anti-S6K pT389 | Cell Signaling 9205 | RRID:AB_330944 | WB 1:1000 |
| Antibody | Rabbit polyclonal anti-S6K pS371 | Cell Signaling 9208 | RRID:AB_331680 | WB 1:1000 |
| Antibody | Rabbit polyclonal anti-S6K pT421/pS424 | Cell Signaling 9204 | RRID:AB_331679 | WB 1:1000 |
| Antibody | Rabbit polyclonal anti-S6K | Cell Signaling 9202 | RRID:AB_331676 | WB 1:1000 |
| Antibody | IRDye 680RD Secondary Antibodies | Licor 925-68073 | RRID:AB_2716687 | WB 1:20,000 |
| Antibody | IRDye 800CW Secondary Antibodies | Licor 925-32214 | RRID:AB_2814909 | WB 1:20,000 |
| Recombinant DNA reagent (plasmid) | pcDNA3.1 IRSp53 | Dr. Eunjoon Kim; PMID: 15673667 | ||
| Recombinant DNA reagent (plasmid) | pcDNA3.1 IRSp53 L460A | Fedoryshchak et al., 2020 | See Methods; Figure 5B | |
| Recombinant DNA reagent (plasmid) | pTRIPZ | Esnault et al., 2014 | ||
| Recombinant DNA reagent (plasmid) | pGEX 6P2 | GE Healthcare 27-4598-01 | ||
| Recombinant DNA reagent (plasmid) | pET28 PP1(7–300) | Dr. Wolfgang Peti | RRID:Addgene_26566 | |
| Recombinant DNA reagent (plasmid) | pET28 PP1-Phactr1 fusion | Fedoryshchak et al., 2020 | ||
| Recombinant DNA reagent (plasmid) | pET28 PP1-PIP fusions | This paper | See Methods | |
| Recombinant DNA reagent (plasmid) | pcDNA5 PP1-PIP fusions | This paper | See Methods | |
| Recombinant DNA reagent (plasmid) | pcDNA5/FRT/TO | Thermo V652020 | ||
| Recombinant DNA reagent (plasmid) | pEF mCherry-4E-BP1 (wt/deltaPBM/118+A/S65A/S101A/SS65,101AA) | This paper | See Methods | |
| Recombinant DNA reagent (plasmid) | pOG44 | Thermo V600520 | ||
| Recombinant DNA reagent | pGro7 plasmid | Takara 3340 | ||
| Sequence-based reagent | Oligonucleotides | This paper | See Methods | |
| Sequence-based reagent | Peptides | This paper | See Methods | |
| Commercial assay or kit | Q5 Site-Directed Mutagenesis Kit | NEB e0552s | ||
| Commercial assay or kit | NEBuilder HiFi DNA Assembly Cloning Kit | NEB e5520s | ||
| Commercial assay or kit | TMT10plex Isobaric Label Reagent Set, 0.8 mg | Thermo 90111 | ||
| Commercial assay or kit | High-Select Fe-NTA Phosphopeptide Enrichment Kit | Thermo A32992 | ||
| Commercial assay or kit | High-Select TiO2 Phosphopeptide Enrichment Kit | Thermo A32993 | ||
| Commercial assay or kit | High pH Reversed Phase Fractionation Kit | Pierce 84868 | ||
| Commercial assay or kit | Transcriptor First Strand cDNA Synthesis kit | Roche 04897030001 | ||
| Commercial assay or kit | RFP-trap magnetic agarose beads | ChromoTek rtma-20 | RRID:AB_2827596 | |
| Commercial assay or kit | Phosphate sensor | Thermo PV4406 | ||
| Chemical compound | Lipofectamine 2000 | Invitrogen 11668-019 | ||
| Software | Xcalibur | Thermo | RRID:SCR_014593 | https://www.thermofisher.com/order/catalog/product/OPTON-30965 |
| Software | MaxQuant | Cox and Mann, 2008 | RRID:SCR_014485 | https://cox-labs.github.io/coxdocs/maxquant_instructions.html |
| Software | Perseus | Tyanova et al., 2016 | RRID:SCR_015753 | https://www.maxquant.org/perseus/ |
| Software | Weblogo | University of California, Berkeley | RRID:SCR_010236 | https://weblogo.berkeley.edu/logo.cgi/ |
| Software | GraphPad Prism | GraphPad | RRID:SCR_002798 | https://www.graphpad.com/scientific-software/prism/ |
| Software | Image Studio Lite 5.2 | LI-COR | RRID:SCR_013715 | https://www.licor.com/bio/image-studio-lite/ |
| Software | SnapGene software | Insightful Science | RRID:SCR_015052 | https://www.snapgene.com/ |
| Software | FlowJo v10.10.0 | BD Biosciences | RRID:SCR_008520 | https://flowjo.com/ |
| Software | AlphaFold 3 | Google Deepmind | RRID:SCR_021709 | https://alphafoldserver.com/ |
| Chemical compound | Manganese Chloride | Fluka 221279-500G | ||
| Chemical compound | Arabinose | Biosynth limited MA02043 | ||
| Chemical compound | IPTG | Neo Biotech NB-45-00030-25G | ||
| Chemical compound | Chloramphenicol | Acros organic 227920250 | ||
| Chemical compound | Tris | SDS 10708976001 | ||
| Chemical compound | Imidazole | Sigma-Aldrich I2399-100G | ||
| Chemical compound | Sodium Chloride | Sigma-Aldrich S9888-1KG | ||
| Chemical compound | Triton X-100 | Sigma-Aldrich X100-100ML | ||
| Chemical compound | TCEP | Fluorochem M02624 | ||
| Chemical compound | AEBSF | Melford A20010-5.0 | ||
| Chemical compound | Benzamidine | Melford B4101 | ||
| Chemical compound | Complete EDTA Free Protease Inhibitor tablet | Roche 05056489001 | ||
| Chemical compound | Glutathione Sephanrose 4B | GE Healthcare 17-0756-05 | ||
| Chemical compound | Ni-NTA Agarose | QIAGEN 30230 | ||
| Chemical compound | Tween 20 | Sigma-Aldrich P1379-100ML | ||
| Chemical compound | BSA | Sigma-Aldrich A2153-100G | ||
| Chemical compound | Lithium Chloride | Hampton Research HR2-631 | ||
| Chemical compound | Tri Sodium Citrate | Hampton Research HR2-549 | ||
| Chemical compound | PEG 6000 | Hampton Research HR2-533 | ||
| Chemical compound | PEG 3350 | Hampton Research HR2-527 | ||
| Chemical compound | Sodium Bromide | Hampton Research HR2-699 | ||
| Chemical compound | Potassium citrate | Hampton Research HR2-683 | ||
| Chemical compound | Bis-Tris-Propane | Sigma-Aldrich B6755-500G | ||
| Chemical compound | Sodium Iodide | Sigma-Aldrich 383112–100G | ||
| Chemical compound | Glycerol | SDS G7893-2L | ||
| Chemical compound | Ethylene Glycol | Sigma-Aldrich 324558–1L | ||
| Chemical compound | BTTAA | Cayman 41089 | ||
| Chemical compound | CuSO4 pentahydrate | Sigma-Aldrich C1297-100g | ||
| Chemical compound | Alexa Fluor-488 azide | Fisher 10033964 | ||
| Chemical compound | Tetracycline hydrochloride | Sigma-Aldrich T7660-25g | ||
| Chemical compound | Zeocin | Invivogen ant-zn-1 | ||
| Chemical compound | Blasticidin | Invivogen ant-bl-1 | ||
| Chemical compound | Hygromycin B | Invivogen ant-hg-2 |
Additional files
-
Supplementary file 1
Primer sequences.
(A) Primers for cloning new phosphatase fusions into pET28 vector. (B) Subcloning phosphatase fusion into pcDNA5. (C) Primers for cloning 4E-BP1 constructs into pEF vector. (D) Primers for 4E-BP1 mutagenesis. (E) Primers for subcloning PDZ domain constructs into pGEX vector. (F) Primers for the PP1-4E-BP1 chimera assembly.
- https://cdn.elifesciences.org/articles/103403/elife-103403-supp1-v1.xlsx
-
Supplementary file 2
Proteomics.
(A) Phosphoproteomics raw intensities based on MaxQuant analysis. (B) Phosphoproteomics processed, cleaned-up and normalised data used for further analyses. (C) Quantification of phosphorylation site preferences for PP1 (PP1 vs empty). (D) Substrate preferences of Phactr1-4-PP1 fusions as opposed to PP1 (Phactrs vs PP1). (E) Identification of substrates for Neurabin, Spinophilin, PNUTS, R15A and R15B PP1 fusions. (F) Total proteomics raw data and enrichment of proteins in the PP1-Neurabin samples.
- https://cdn.elifesciences.org/articles/103403/elife-103403-supp2-v1.xlsx
-
Supplementary file 3
Activity assay data.
(A) Comparative overview of significant differences between reactions performed with different peptides, or between different enzymes for the same substrate peptide. (B) Combined catalytic efficiency data from all 6 replicate assays. Raw and normalised values are presented separately. Normalization was performed by normalisation of average catalytic efficiency, using PBM peptides for PP1-Neurabin and IRSp53 peptides for PP1-Phactr1. (C) Combined Michaelis-Menten constants KM data from all 6 replicate assays. (D-H) Curve-fitting parameters for each replicate assay.
- https://cdn.elifesciences.org/articles/103403/elife-103403-supp3-v1.xlsx
-
MDAR checklist
- https://cdn.elifesciences.org/articles/103403/elife-103403-mdarchecklist1-v1.docx
-
Source data 1
All plasmid sequences used.
- https://cdn.elifesciences.org/articles/103403/elife-103403-data1-v1.zip
Download links
A two-part list of links to download the article, or parts of the article, in various formats.
Downloads (link to download the article as PDF)
Open citations (links to open the citations from this article in various online reference manager services)
Cite this article (links to download the citations from this article in formats compatible with various reference manager tools)
PDZ-directed substrate recruitment is the primary determinant of specific 4E-BP1 dephosphorylation by PP1-Neurabin
eLife 13:RP103403.
https://doi.org/10.7554/eLife.103403.3


