Gamma Knife stereotactic radiotherapy combined with tislelizumab as later-line therapy in pMMR/MSS/MSI-L metastatic colorectal cancer: a phase II trial analysis
- Department of General Surgery, The First Affiliated Hospital of Jinan University, China
- Department of Body Gamma Knife, The First Affiliated Hospital of Jinan University, China
- Department of Oncology, The First Affiliated Hospital of Jinan University, China
- MOE Key Laboratory of Tumor Molecular Biology and Key Laboratory of Functional Protein Research of Guangdong Higher Education Institutes, Institute of Life and Health Engineering, Jinan University, China
Figures
Figure 1
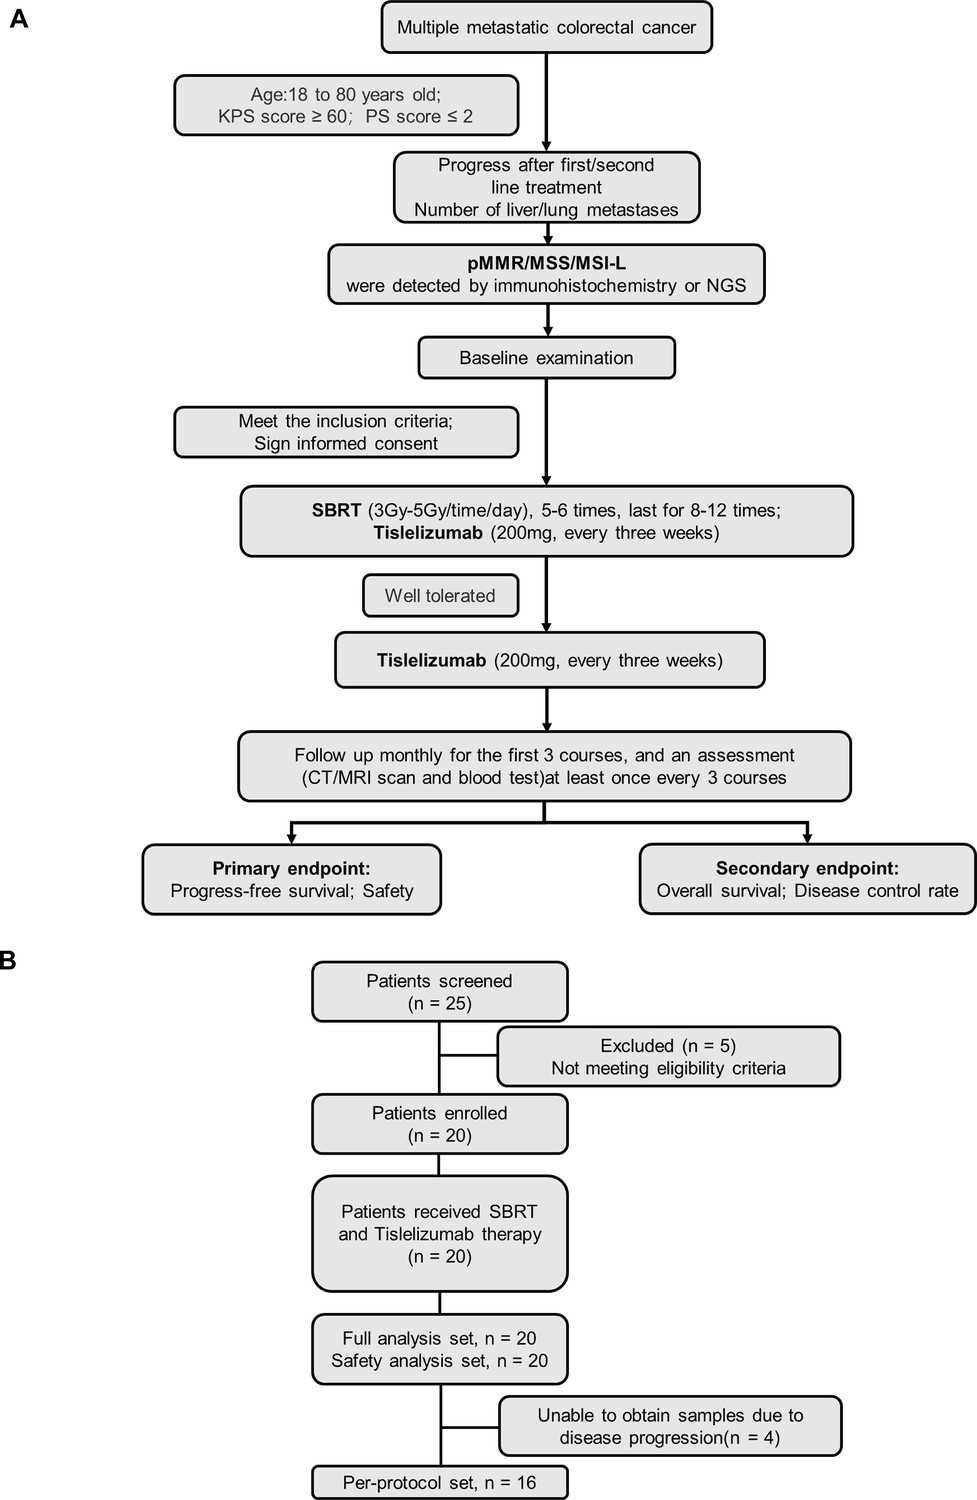
Clinical trial flowchart.
(A) Flowchart of therapeutic regimen. (B) Flow diagram of participants in the study.
Figure 2 with 1 supplement
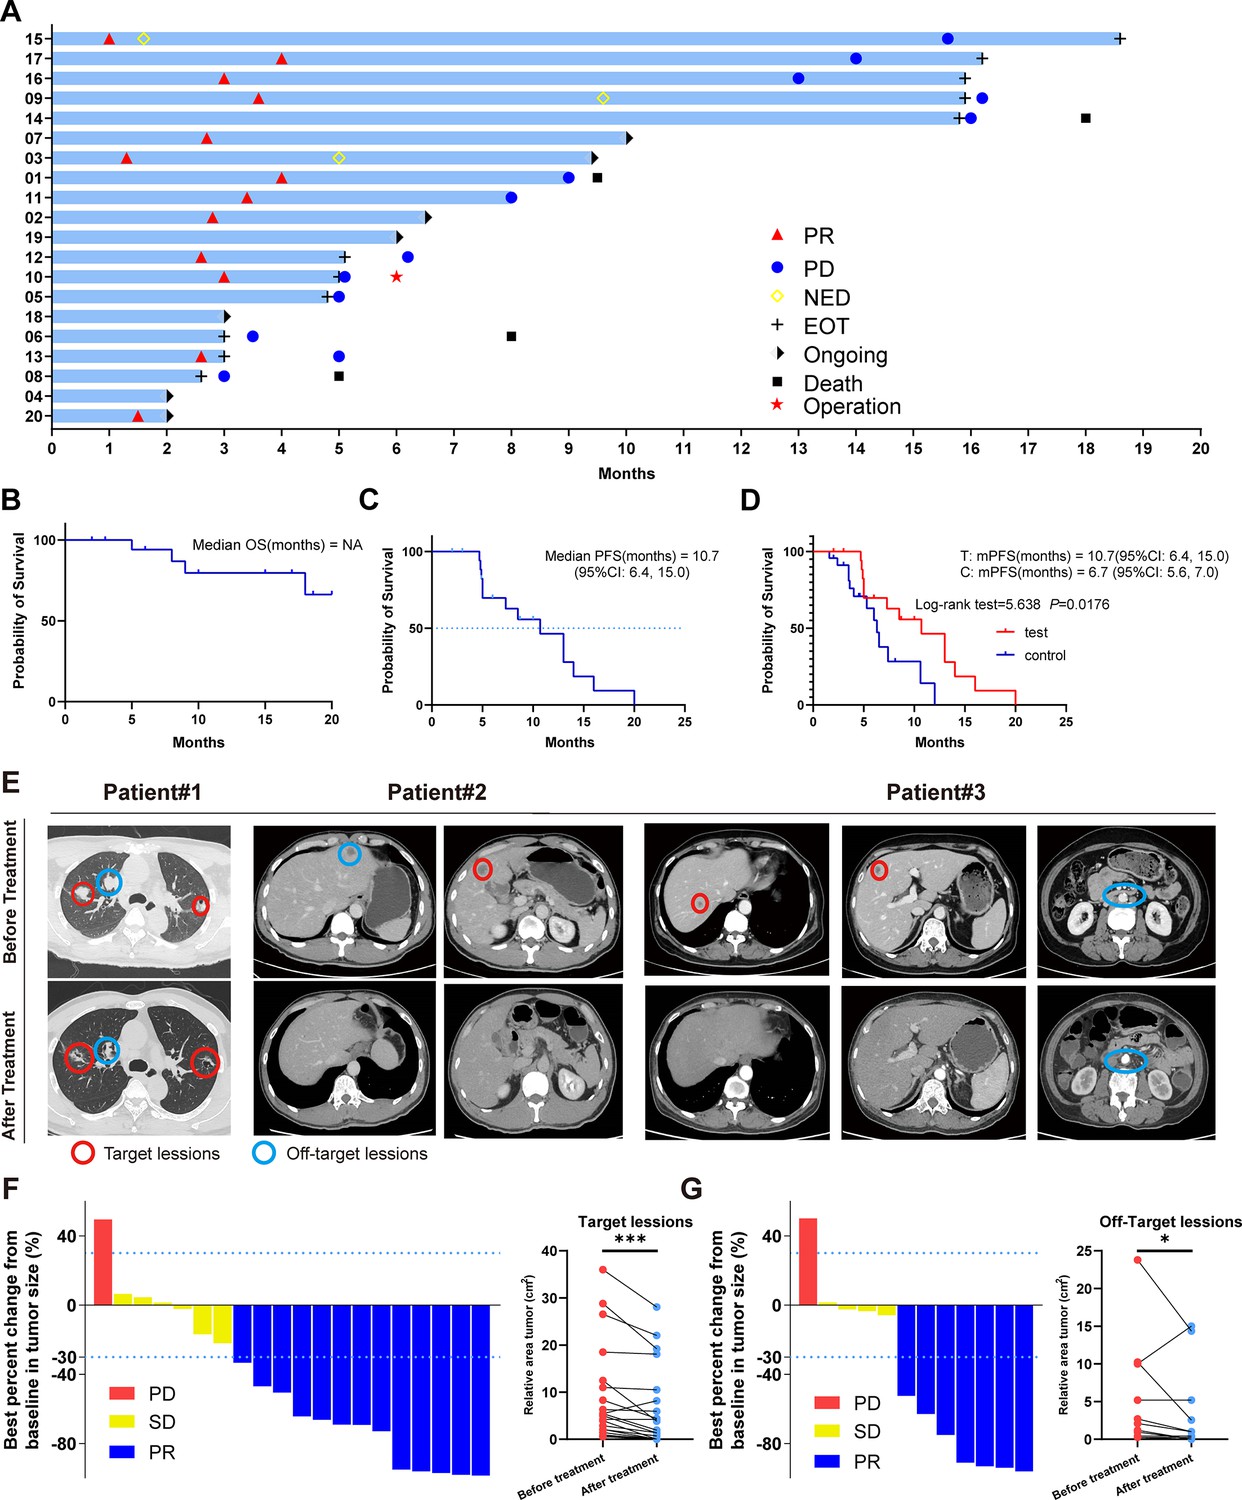
Clinical trial results.
(A) Swimmer plots of patients. (B) Kaplan-Meier curves of OS for the per-protocol set (N=20). (C) Kaplan-Meier curves of progression-free survival (PFS) for the per-protocol set (N=20). (D) Kaplan-Meier curves of PFS for didn’t receive immunotherapy set (control group) (N=23) and per-protocol set (test group) (N=20). (E) Radiological response from patient. (F) Waterfall plot of best percent change from baseline in patient target lesion (N=20). (G) Waterfall plot of best percent change from baseline in patient off-target lesion (N=12).
Figure 2—figure supplement 1
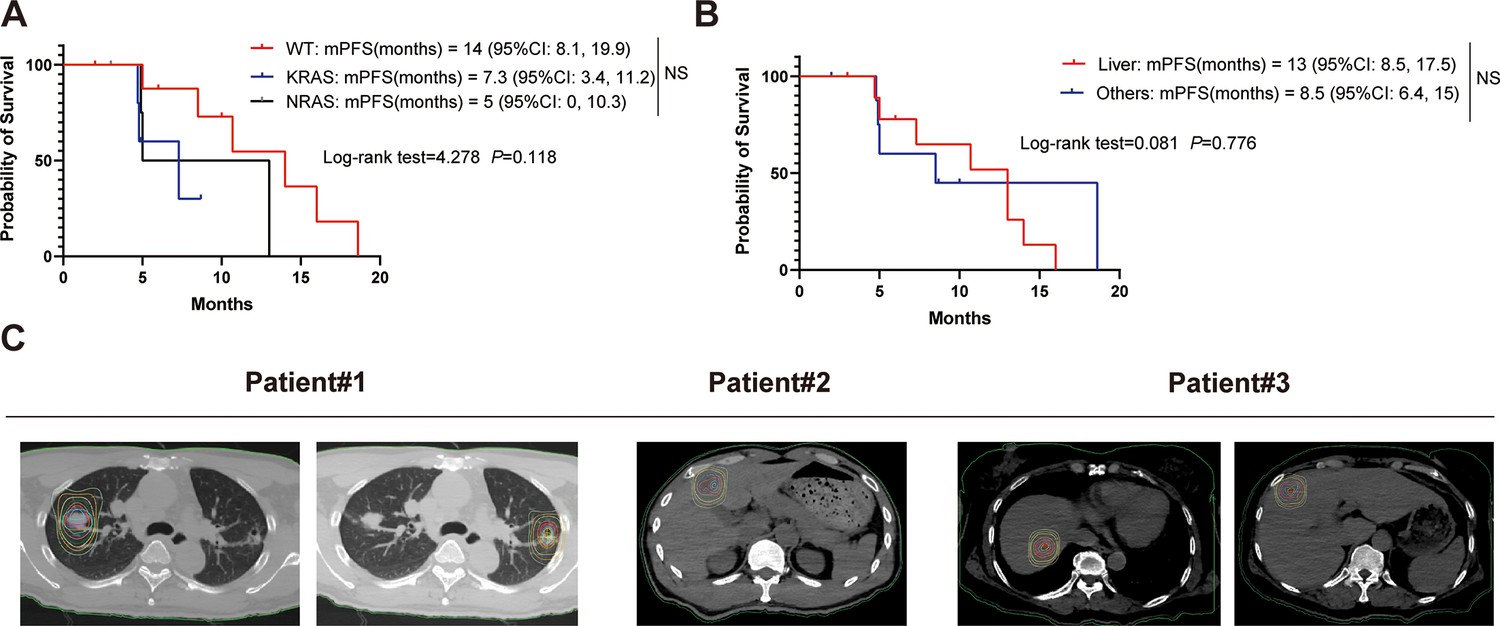
Supplementary clinical trial results.
(A) Kaplan-Meier curves of progression-free survival (PFS) for RAS wild-type set (n=9), KRAS set (n=5), and NRAS set (n=6). (B) Kaplan-Meier curves of PFS for simple liver metastasis (n=10) and other metastasis (n=10). (C) Schematic diagram of isodose lines of the planned treatment volume (PTV).
Figure 3 with 1 supplement
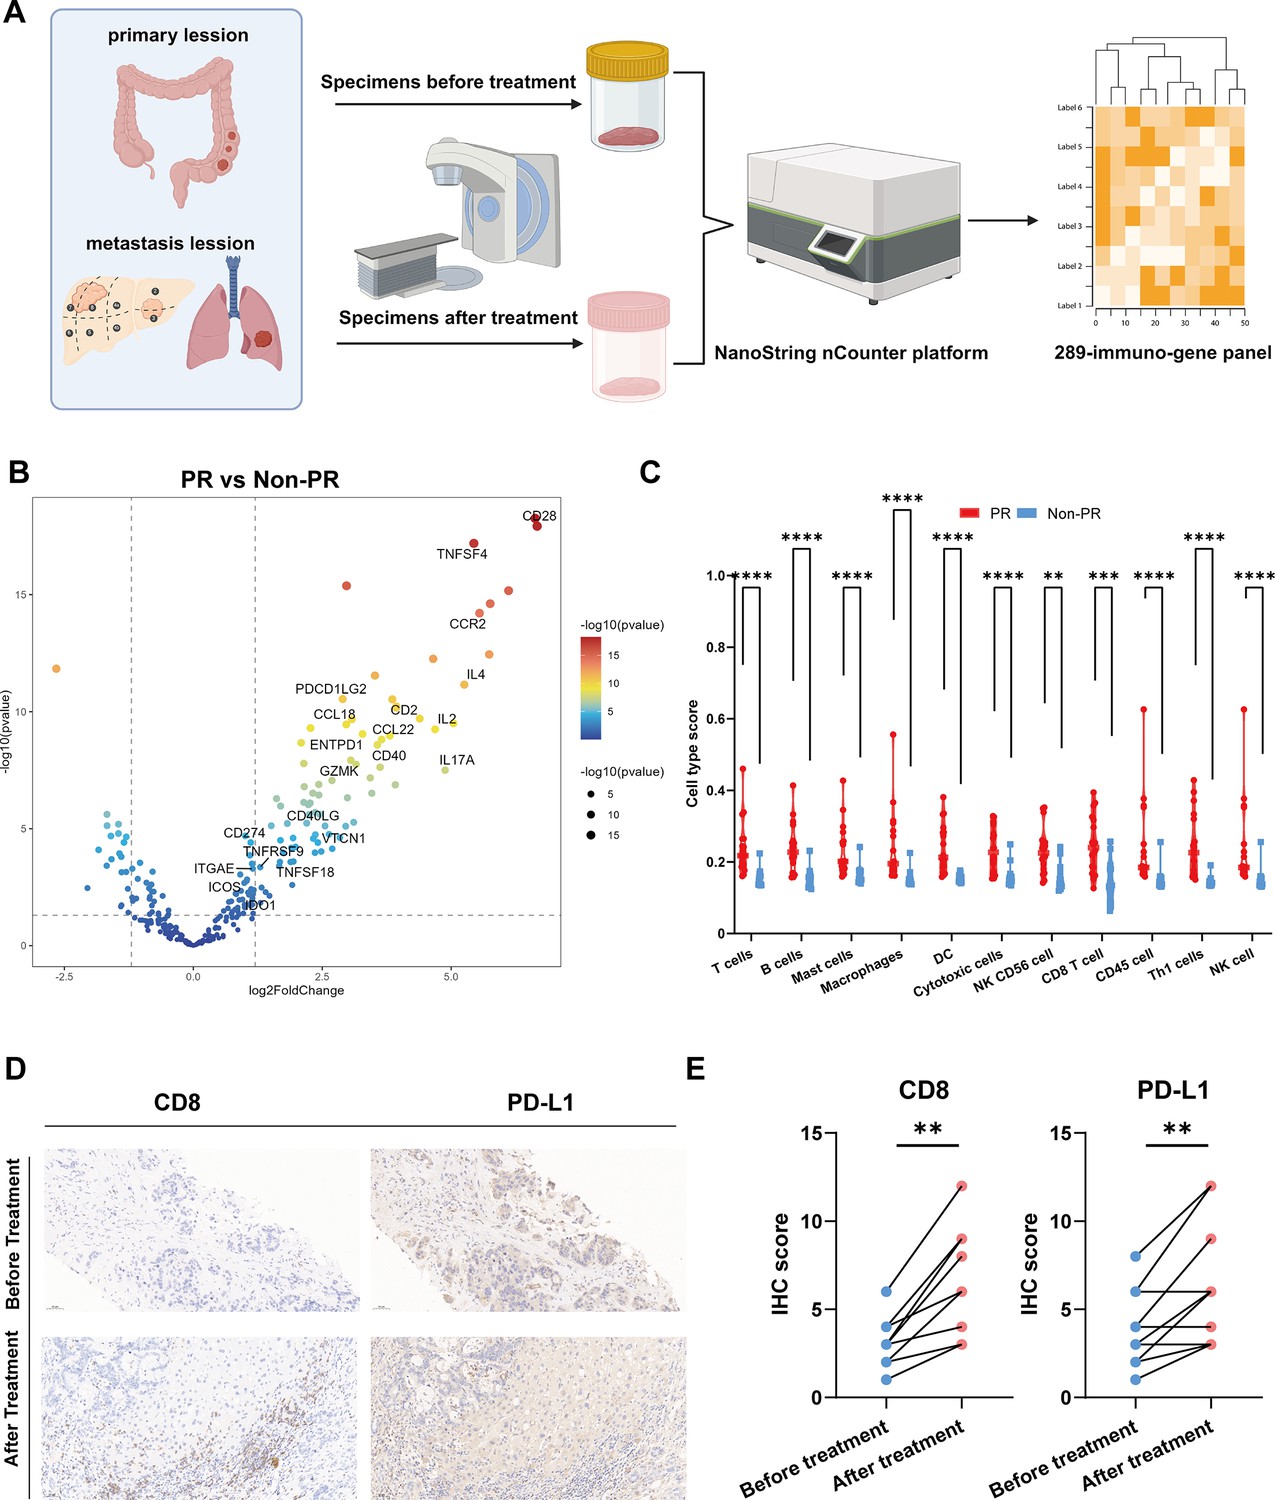
Differentially expressed genes analysis.
(A) Specimens collection flowchart. (B) Transcriptome analysis on differential expression genes between responders (PR) (n=9) and nonresponders (Non-PR) (n=7). DESeq2 was provided to perform differential expression testing. (C) The abundance of predefined 12 immune cell composition before and after treatment between responders (PR) (n=9) and nonresponders (Non-PR) (n=7). The Wilcoxon test was used to determine the statistical significance between subgroups. (D and E) Representative CD8 and PD-L1 immunohistochemistry (IHC) staining of before and after treatment specimens of the patient.
Figure 3—figure supplement 1
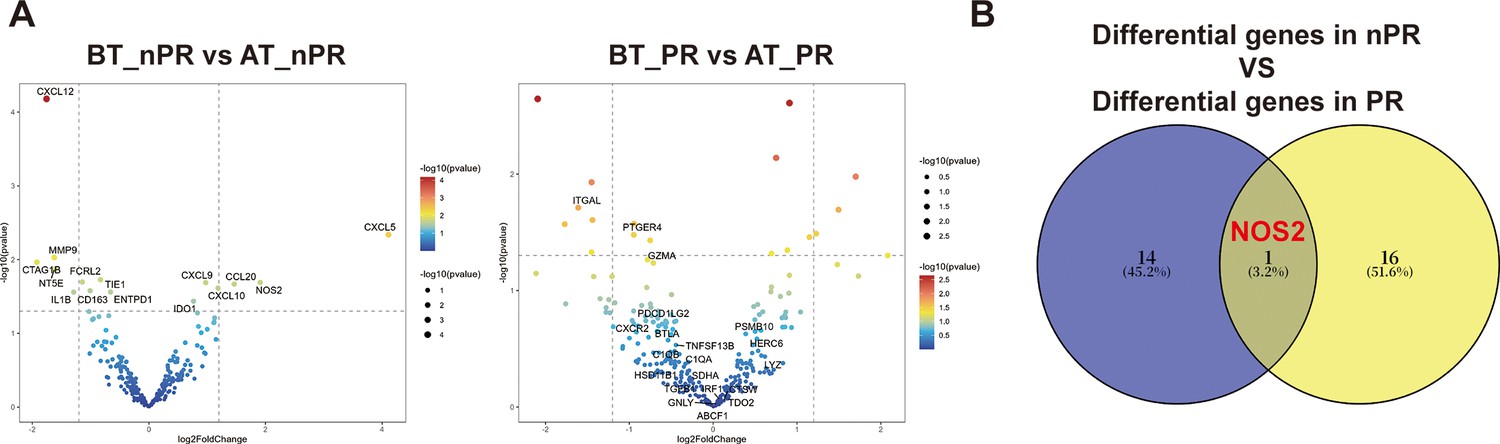
Supplementary differentially expressed genes analysis.
(A) Transcriptome analysis on differential expression genes before and after treatment between nonresponders (Non-PR) (n=7) and responders (PR) (n=9). DESeq2 was provided to perform differential expression testing. (B) Venn diagram of two groups of differentially expressed genes.
Figure 4 with 1 supplement
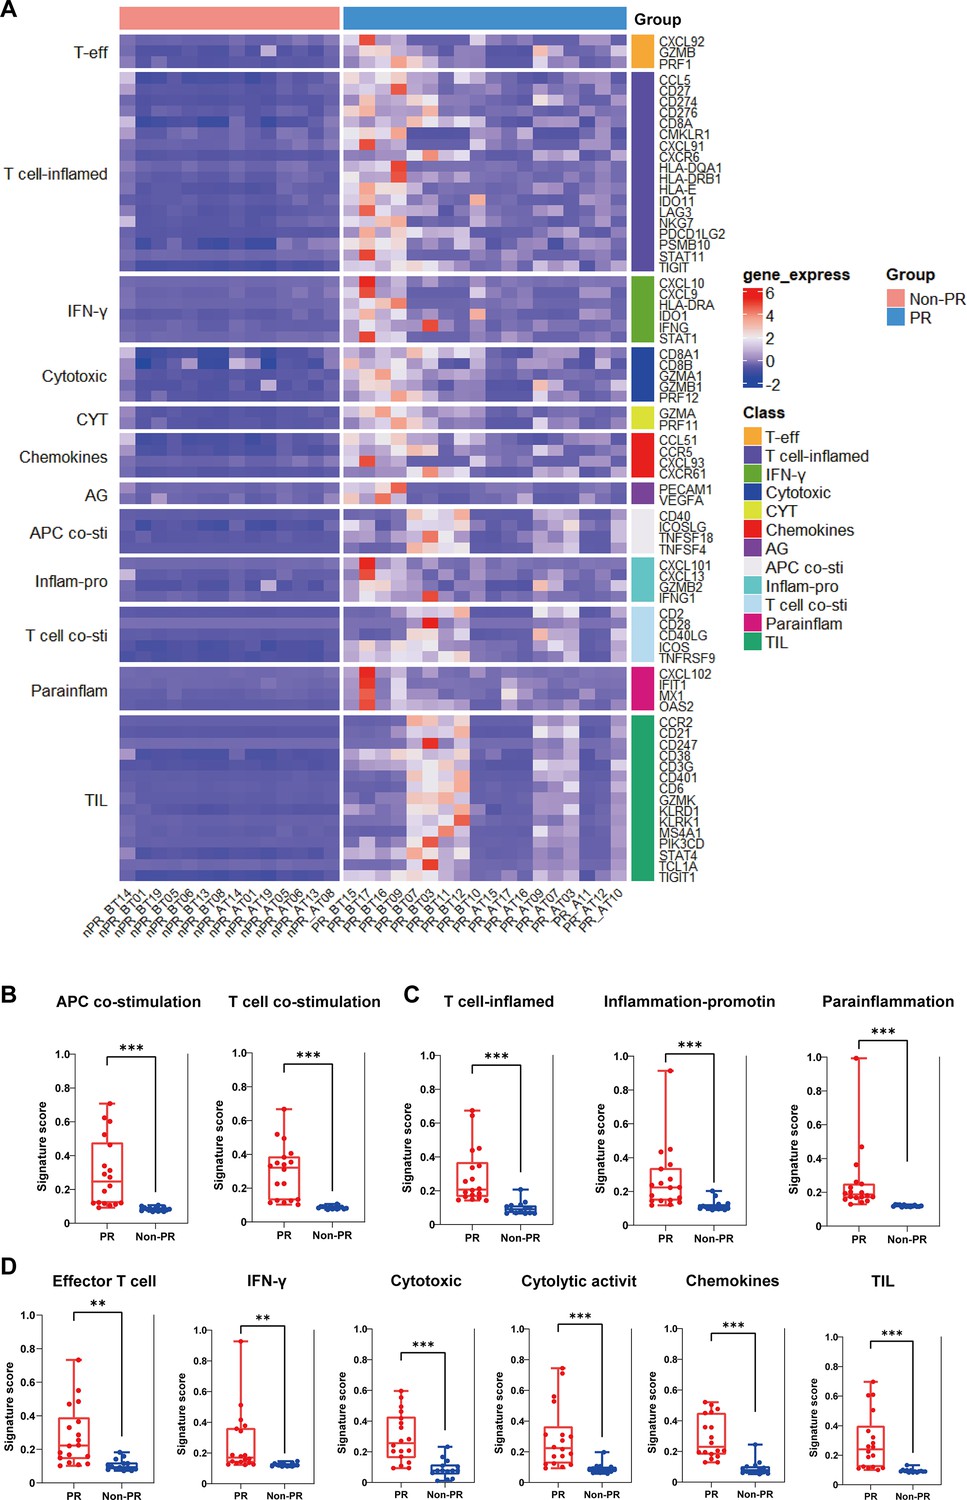
Additional immune signatures analysis.
(A) The expression of 12 gene sets previously reported to be associated with response to immunotherapy and prognosis between responders (PR) (n=18) and nonresponders (Non-PR) (n=14). (B–D) 11 gene sets of prognostic value were differentially expressed between responders (PR) (n=18) and nonresponders (Non-PR) (n=14). Box plots are indicated in terms of minima, maxima, center, bounds of box and whiskers (interquartile range value), and percentile in the style of Tukey. The Wilcoxon test was used to determine the statistical significance between subgroups.
Figure 4—figure supplement 1
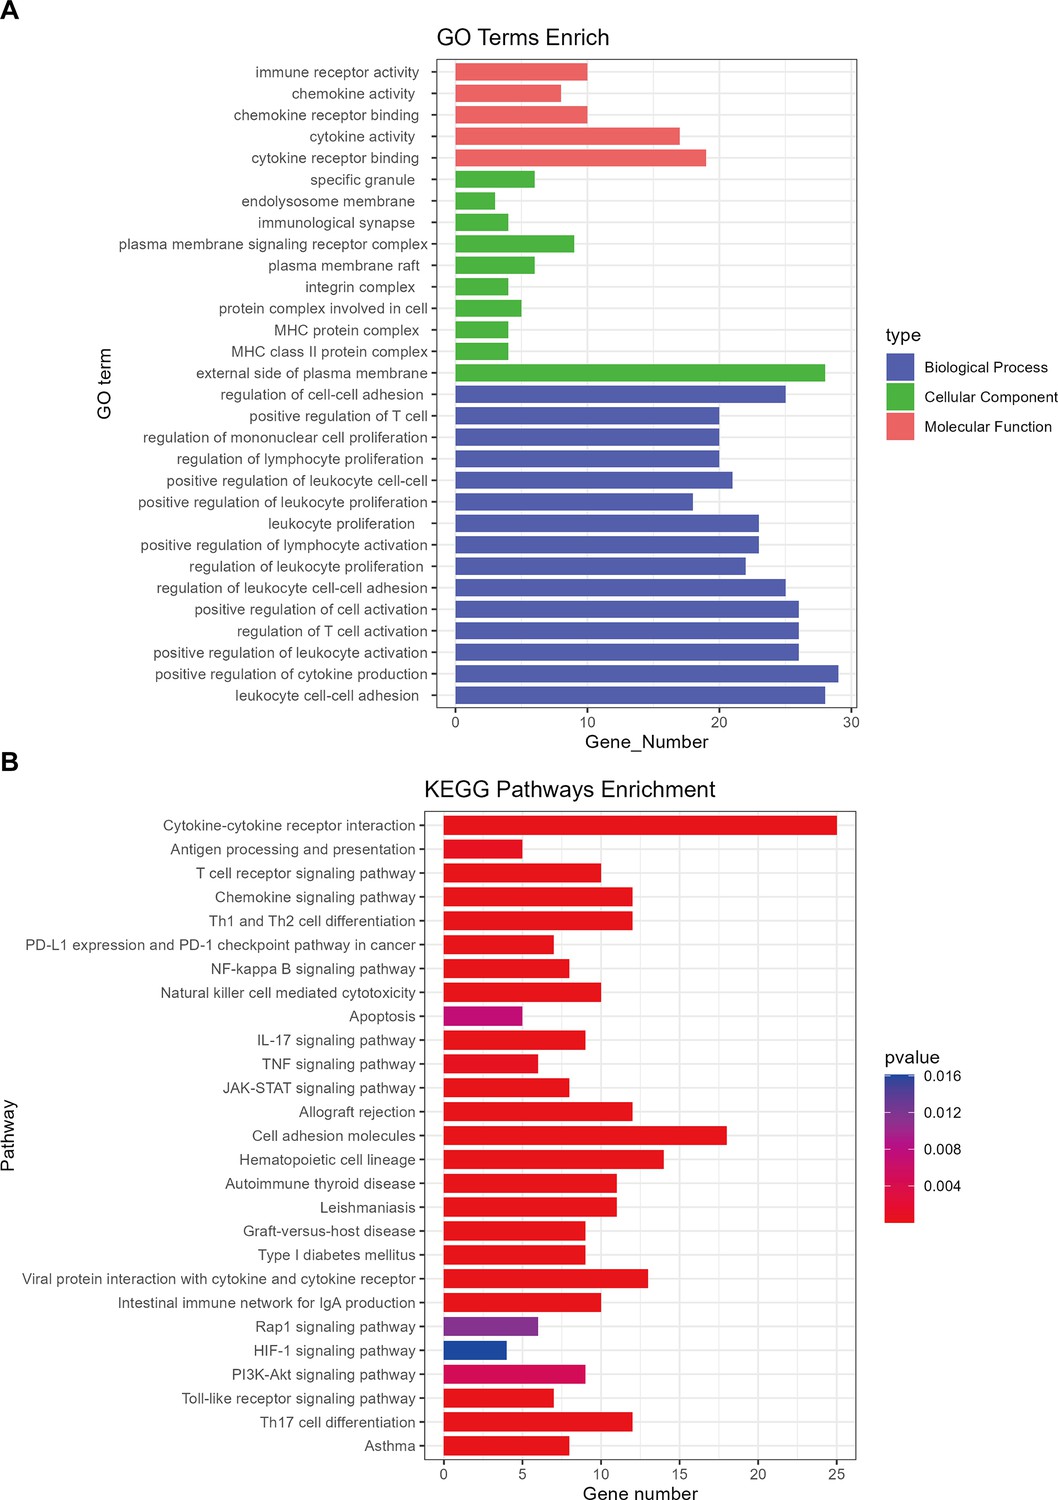
Gene Ontology (GO) enrichment and Kyoto Encyclopedia of Genes and Genomes (KEGG) pathways analysis of differential expression genes.
(A) GO enrichment analysis was performed to identify the biological process, cellular component, and molecular function of differential expression genes. (B) KEGG enrichment analysis of differential expression genes.
Figure 5 with 1 supplement
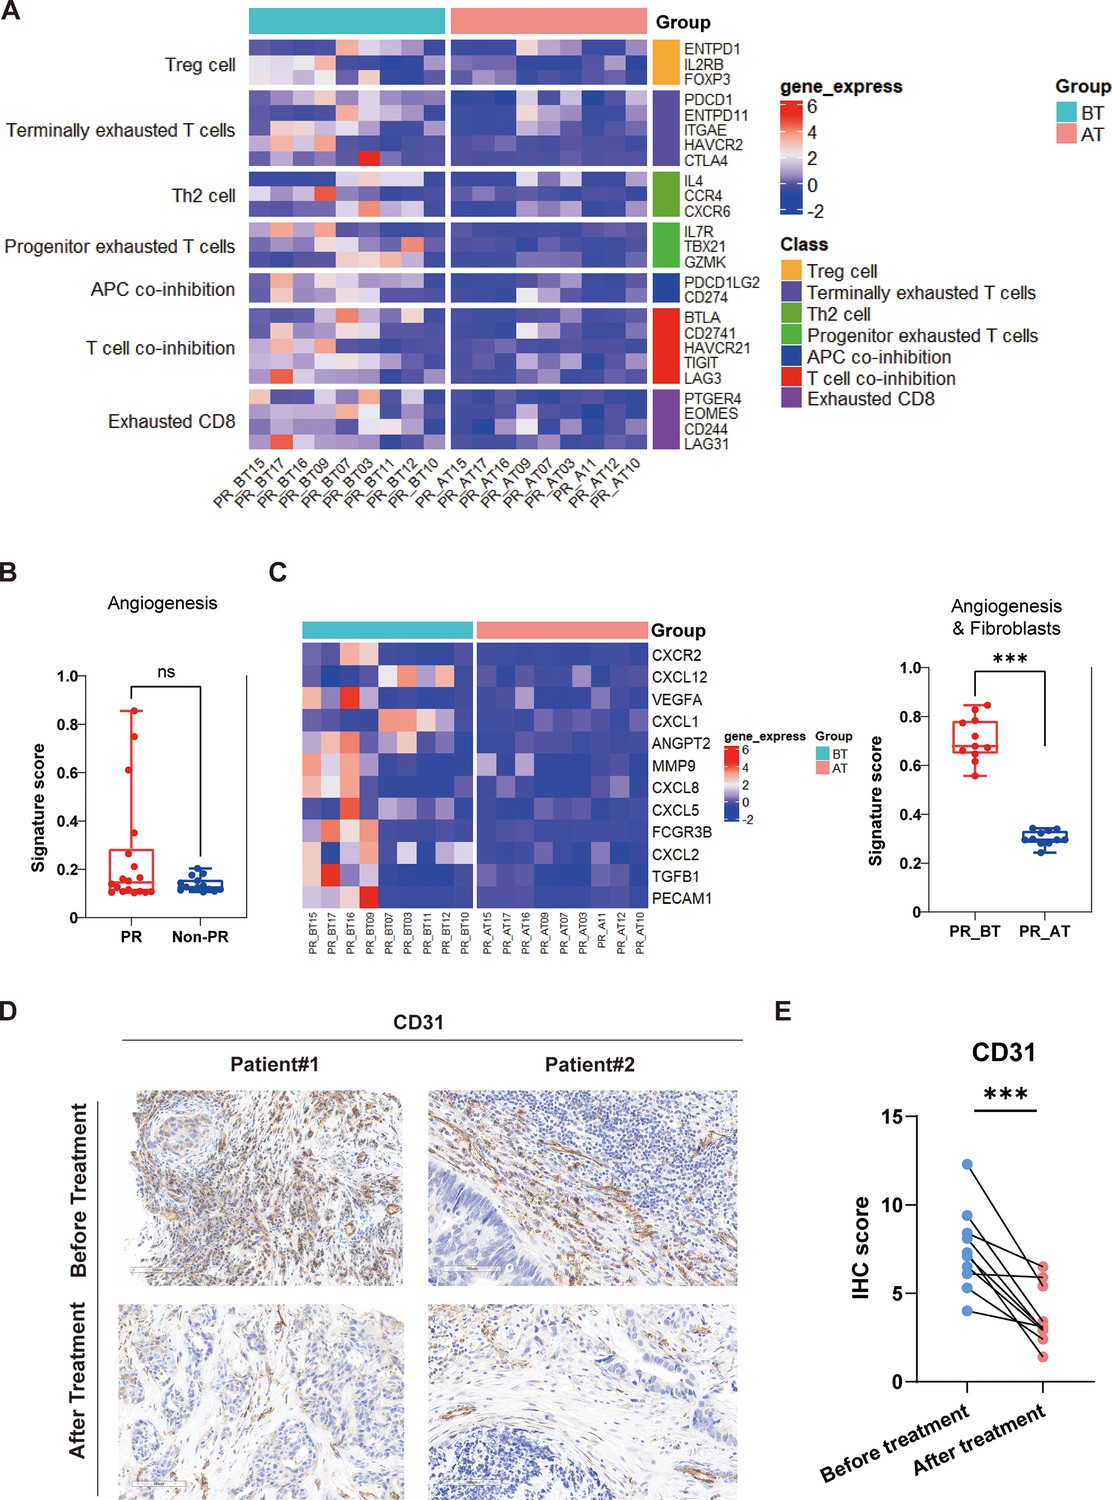
Comparison of responders before and after treatment.
(A) The expression of seven gene sets previously reported to be associated with response to immunosuppressive between before treatment (n=9) and after treatment (n=9) in the responders (PR). (B) The expression of angiogenesis sets between responders (PR) (n=18) and nonresponders (Non-PR) (n=14). (C) The expression of angiogenesis and fibroblasts sets between before treatment (n=9) and after treatment (n=9) in the responders. Box plots are indicated in terms of minima, maxima, center, bounds of box and whiskers (interquartile range value), and percentile in the style of Tukey. The Wilcoxon test was used to determine the statistical significance between subgroups. (D and E) Representative CD31 immunohistochemistry (IHC) staining of before and after treatment specimens of patients.
Figure 5—figure supplement 1
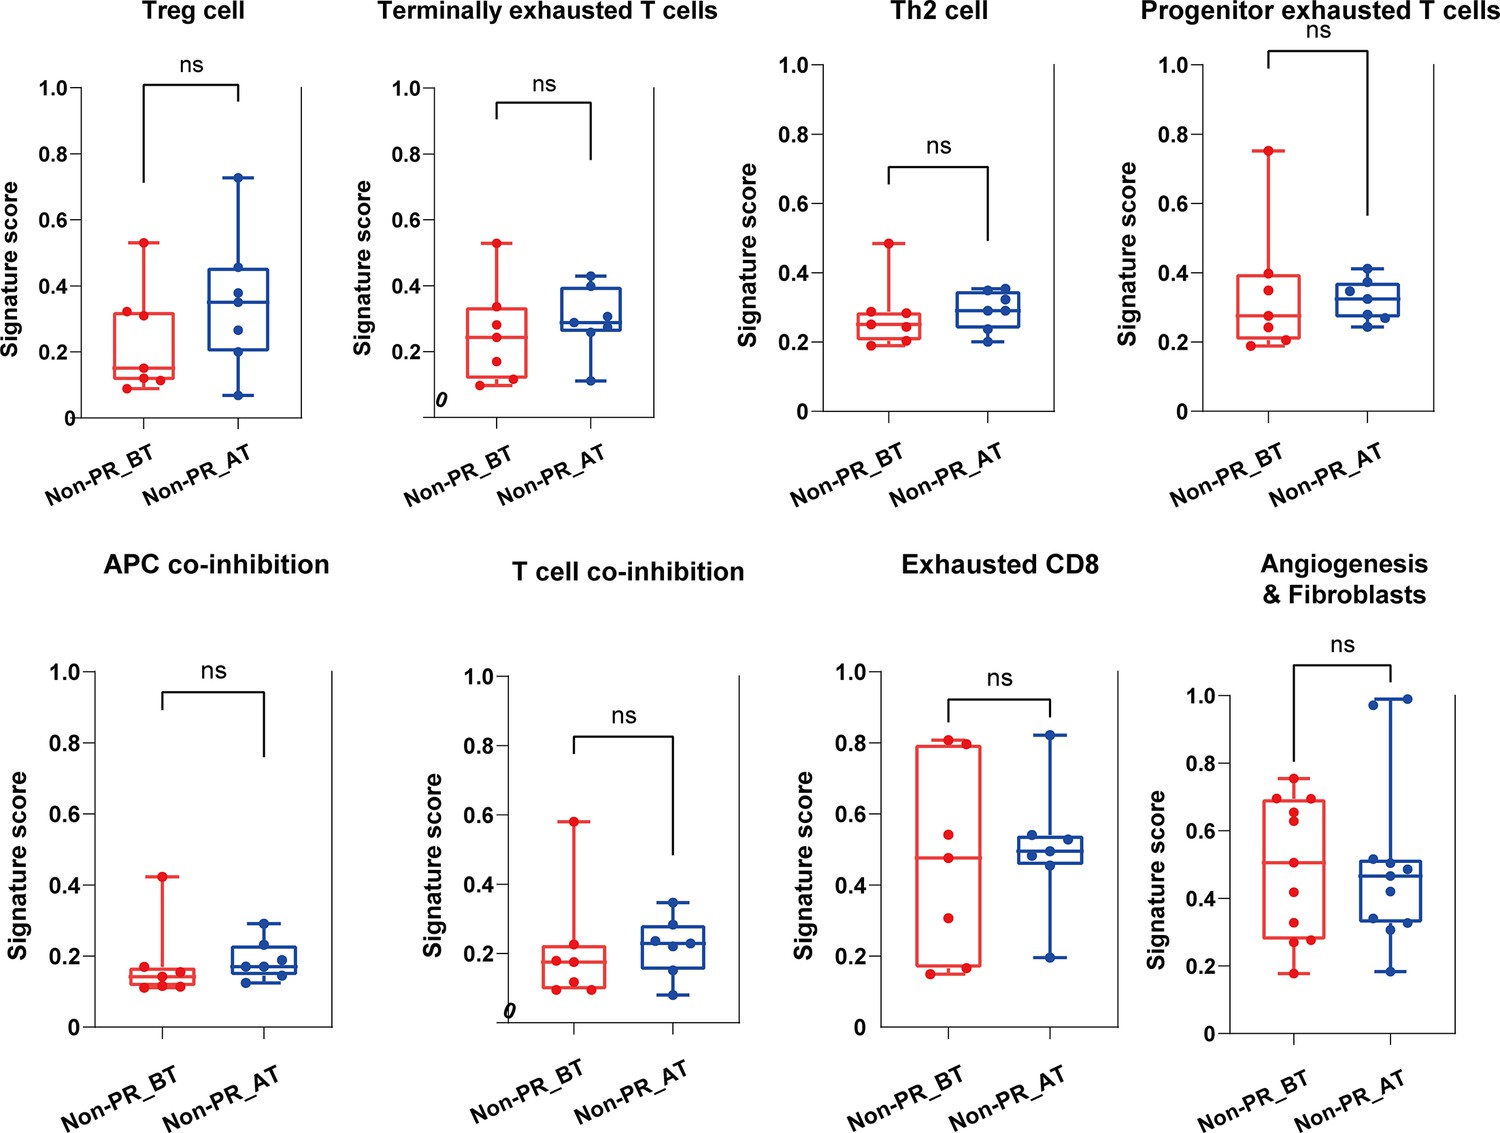
Comparison of nonresponders before and after treatment.
Tables
Table 1
Baseline demographic and clinical characteristics.
| Characteristics | Patients (n=20) |
|---|---|
| Age, years, median (IQR), n (%) | 60 (56–65) |
| <60 | 8 (40%) |
| ≥60 | 12 (60%) |
| Sex, n (%) | |
| Male | 15 (75%) |
| Female | 5 (25%) |
| ECOG performance status, n (%) | |
| 0 | 12 (60%) |
| 1 | 8 (40%) |
| Primary tumor location, n (%) | |
| Left colon and rectum | 17 (85%) |
| Right colon | 3 (15%) |
| Number of metastatic organs*, n (%) | |
| 1 | 14 (70%) |
| ≥2 | 6 (30%) |
| Metastatic organ, n (%) | |
| Liver | 14 (70%) |
| Lung | 7 (35%) |
| Lymph node | 2 (10%) |
| Other | 3 (15%) |
| Ras mutation type, n (%) | |
| KRAS | 5 (25%) |
| NRAS | 6 (30%) |
| Other | 9 (45%) |
| PD-L1 expression, CPS, n (%) | |
| CPS ≤1 | 12 (60%) |
| CPS>1 | 6 (30%) |
| Unknown | 2 (10%) |
| TMB (mut/Mb), median (IQR), n (%) | 4.62 (3.08–8.97) |
| TMB <5 | 4 (20%) |
| TMB ≥5, ≤10 | 3 (15%) |
| TMB >10 | 1 (5%) |
| Unknown | 12 (60%) |
-
Abbreviations: CPS, combined positive score; ECOG, Eastern Cooperative Oncology Group; IQR, interquartile range; TMB, tumor mutation burden.
-
*
Multiple answers allowed.
Table 2
Efficacy outcomes.
| All patients (N=20) | Liver metastasis (N=14) | Other metastasis (N=6) | |
|---|---|---|---|
| Best overall response | |||
| Complete response (CR), n (%) | 1 (5%) | 0 (0%) | 1 (17%) |
| Partial response (PR), n (%) | 12 (60%) | 8 (57%) | 4 (66%) |
| Stable disease (SD), n (%) | 6 (30%) | 5 (36%) | 1 (17%) |
| Progressive disease (PD), n (%) | 1 (5%) | 1 (7%) | 0 (0%) |
| ORR, n (%, 95% CI) | 13 (65%, 40.8–84.6%) | 8 (57.1%, 28.9–82.3%) | 5 (83.3%, 35.9–99.6%) |
| DCR, n (%, 95% CI) | 19 (95%, 75.1–99.9%) | 13 (92.9%, 66.1–99.8%) | 6 (100%, 54.1–100%) |
-
Abbreviations: ORR, objective response rate; DCR, disease control rate.
Table 3
Treatment-emergent adverse events (TEAEs) since the initiation of protocol-specified treatment.
| TEAEs, n (%) | Patient (N=20) | ||||
|---|---|---|---|---|---|
| Grade 1 | Grade 2 | Grade 3 | Grade 4 | Any grade | |
| Anemia | 9 (45%) | 2 (10%) | 0 | 0 | 11 (55%) |
| Neutropenia | 1 (5%) | 0 | 0 | 0 | 1 (5%) |
| Nausea | 10 (50%) | 3 (15%) | 0 | 0 | 13 (65%) |
| Poor appetite | 3 (15%) | 4 (20%) | 0 | 0 | 7 (35%) |
| Electrolyte disturbance | 7 (35%) | 2 (10%) | 0 | 0 | 11 (55%) |
| Hand-foot syndrome | 0 | 0 | 0 | 0 | 0 |
| Leukocytopenia | 2 (10%) | 0 | 0 | 0 | 2 (10%) |
| Aspartate transaminase increased | 2 (10%) | 2 (10%) | 0 | 0 | 4 (20%) |
| Lipase increased | 0 | 0 | 0 | 0 | 0 |
| Proteinuria | 0 | 0 | 0 | 0 | 0 |
| Thrombocytopenia | 2 (10%) | 2 (10%) | 0 | 0 | 4 (20%) |
| Vomiting | 1 (5%) | 3 (15%) | 0 | 0 | 4 (20%) |
| Hypothyroidism | 0 | 0 | 0 | 0 | 0 |
| Triglycerides increased | 0 | 0 | 0 | 0 | 0 |
| Fatigue | 6 (30%) | 3 (15%) | 0 | 0 | 9 (45%) |
| Blood bilirubin increased | 0 | 0 | 2 (10%) | 0 | 2 (10%) |
| Alanine transaminase increased | 2 (10%) | 1 (5%) | 0 | 0 | 3 (15%) |
| Peripheral neurotoxicity | 0 | 0 | 0 | 0 | 0 |
| Hoarseness | 0 | 0 | 0 | 0 | 0 |
| Rash | 4 (20%) | 0 | 0 | 0 | 4 (20%) |
| Thyroiditis | 0 (0%) | 0 | 0 | 0 | 0 |
| Diarrhea | 1 (5%) | 0 | 0 | 0 | 1 (5%) |
| Troponin increased | 0 | 0 | 0 | 0 | 0 |
| Fever | 0 | 0 | 0 | 0 | 0 |
| Alkaline phosphatase increased | 0 | 0 | 0 | 0 | 0 |
| Amylase increased | 0 | 0 | 0 | 0 | 0 |
| Hypertension | 0 | 0 | 0 | 0 | 0 |
Additional files
-
MDAR checklist
- https://cdn.elifesciences.org/articles/103559/elife-103559-mdarchecklist1-v1.docx
-
Supplementary file 1
COX analysis results.
- https://cdn.elifesciences.org/articles/103559/elife-103559-supp1-v1.xlsx
-
Supplementary file 2
Gene signature list.
- https://cdn.elifesciences.org/articles/103559/elife-103559-supp2-v1.xlsx
-
Source data 1
Nanostring panel RNA sequencing data.
- https://cdn.elifesciences.org/articles/103559/elife-103559-data1-v1.xlsx
Download links
A two-part list of links to download the article, or parts of the article, in various formats.
Downloads (link to download the article as PDF)
Open citations (links to open the citations from this article in various online reference manager services)
Cite this article (links to download the citations from this article in formats compatible with various reference manager tools)
Gamma Knife stereotactic radiotherapy combined with tislelizumab as later-line therapy in pMMR/MSS/MSI-L metastatic colorectal cancer: a phase II trial analysis
eLife 14:RP103559.
https://doi.org/10.7554/eLife.103559.3


