Unravelling druggable signalling networks that control F508del-CFTR proteostasis
- National Research Council, Italy
- Telethon Institute of Genetics and Medicine, Italy
- Sapienza University, Italy
- McGill University, Canada
- Institute of Giannina Gaslini, Italy
- University of Naples Federico II, Italy
- Istituto di Ricovero e Cura a Carattere Scientifico SDN, Italy
Figures
Figure 1 with 2 supplements
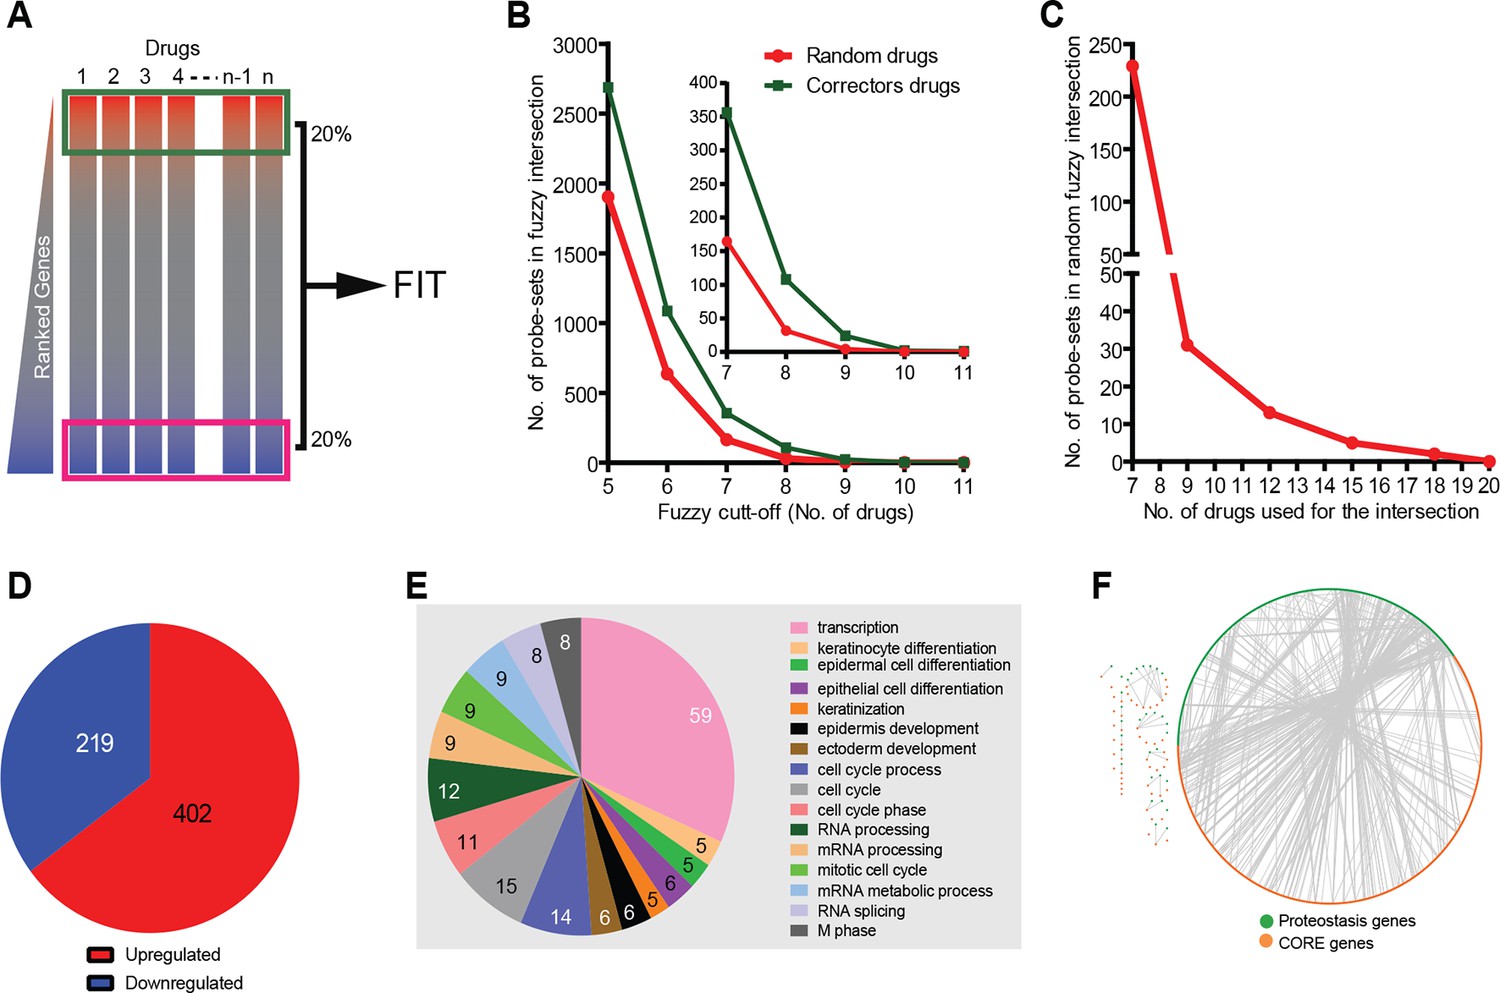
Corrector drugs modulate a set of CORE genes.
(A) Schema of the FIT method. The upregulated (red) and downregulated genes (blue) were fuzzy intersected to identify CORE genes. (B) The number of probe sets in the corrector drug profiles (MANTRA dataset) as well as random profiles from MANTRA database were intersected with variable fuzzy cut-offs (represented as number of drugs out of 11) to obtain optimal fuzzy cut-off for the analysis. The enlargement (inset) shows that at the optimal fuzzy cut-off (0.7; 8 out of 11 drugs), the signal-to-noise ratio was close to 3 (108 probe-sets in the corrector drug intersection vs 32 in the random drug intersection). (C) At a fuzzy cut-off of 0.7, the number of random drug profiles used was varied, and the number of probe-sets present in the intersection is shown. (D) Using the optimal parameters (see A, C ) the FIT analysis resulted in 402 upregulated and 219 downregulated CORE genes. (E) The number of CORE genes associated with the enriched GO terms is shown. Those genes that did not associate with enriched GO terms were excluded from the chart. (F) Protein-protein interactions between the CORE and the proteostasis genes (restricted to those that connect the two groups) are shown.
Figure 1—figure supplement 1

Corrector drugs (MANTRA dataset) have diverse transcriptional responses corresponding to their primary MOA.
As noted earlier, the correctors had few, if any, common principal MOA. First, we wished to identify sub-groups of correctors, if any, which might have shared correction-relevant MOA. The use of prototype ranked lists (PRLs) for the correctors present in the MANTRA dataset (Iorio et al., 2010) results in the loss of information about fold changes in transcript levels and corresponding p-values. Thus, these lists are not suitable for comparisons and cluster analyses made with traditional metrics (such as Correlation or Euclidian distance) and classic partitional or agglomerative/hierarchical clustering methods. However, we attempted to overcome this issue by a state-of-the-art method to 'cluster' the profiles. In the past, in an effort to cluster the drugs present in the connectivity map database (Iorio et al., 2010) based on their transcriptional response similarity, we had designed a novel gene set enrichment analysis (GSEA: [Subramanian et al., 2005]) based metric to obtain similarity scores between ranked lists (see [Iorio et al., 2010] for details). This study resulted in a network that contains clusters of densely interconnected drugs (named drug communities), whose corresponding ranked-lists had high 'similarity' scores. Since this network is basically the output of a state-of-the-art method to cluster the ranked-lists of genes derived from connectivity map, we mined this network in an attempt to cluster the F508del-CFTR corrector drugs. Shown here is the drug similarity network assembled, by iterative affinity propagation clustering. The topology of this network is hierarchical and derived from a gene set enrichment analysis (GSEA)-derived similarity metric applied to drug-induced transcriptional profiles (see [Iorio et al., 2010] for details). Each node represents a drug. An edge connects two nodes if the corresponding consensual transcriptional responses are significantly similar and its length is inversely proportional to the similarity of the response. The clusters (referred to as drug-communities) correspond to drugs with highly similar transcriptional responses. The F508del-CFTR correctors belonging to this network (from MANTRA dataset) are highlighted together with the identifier of the drug-community they belong to. The nodes (corrector drugs) are color-coded such that drugs belonging to the same community share the same color. The F508del-CFTR correctors do not cluster together, and most of them belong to drug-communities enriched for their primary MOA (Supplementary file 2).
Figure 1—figure supplement 2
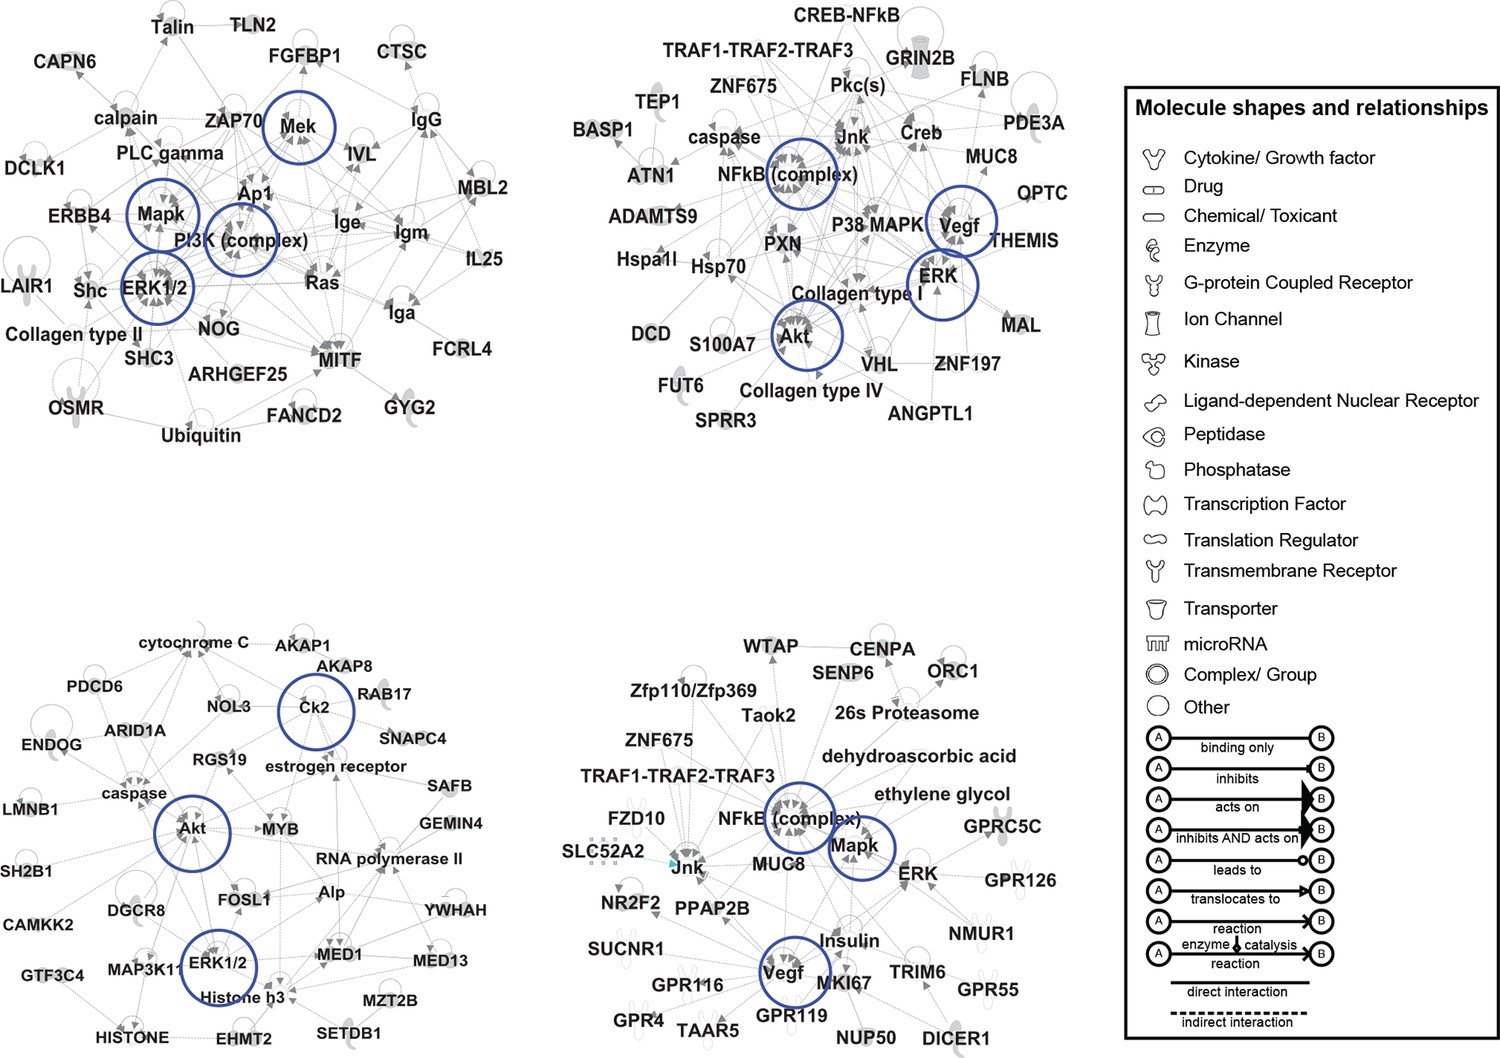
IPA based analysis uncovers networks of CORE genes.
The CORE genes were analyzed by the IPA-Core analysis function both together and individually as up and downregulated gene sets. Among the networks built by IPA using the downregulated CORE genes set, four significant ones are shown. The downregulated CORE genes are shown in gray while the nodes that were predicted by IPA to be part of the network are shown in white. The nodes predicted by IPA include NF-KB, AKT, VEGF, and PI3K complexes. The differences in the shape of the nodes indicate the protein families to which the nodes belong (see the panel legend for details). The blue circles indicate the network hubs that were tested in the screening assay (see Figure 2A–D).
Figure 2 with 3 supplements
Validation of the selected CORE genes.
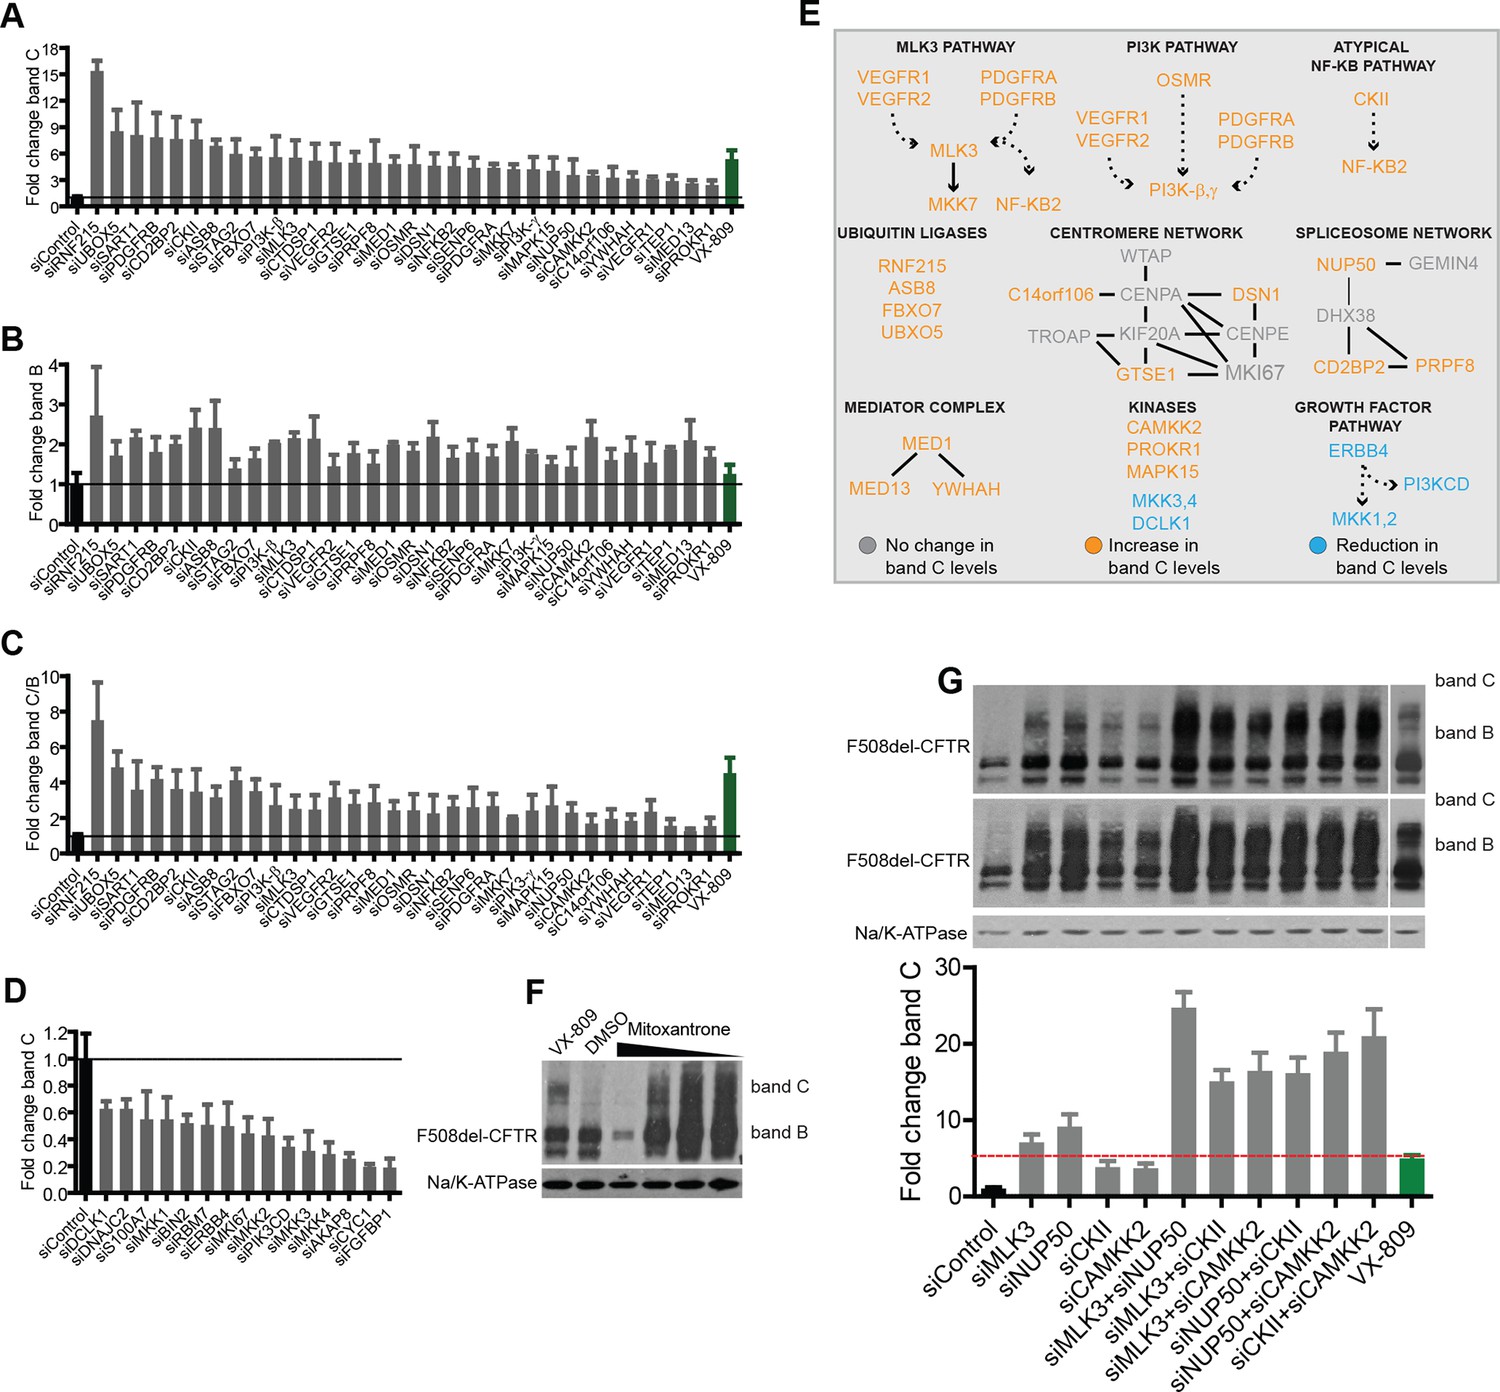
(A–D) CFBE cells were treated with siRNAs targeting CORE genes and changes in F508del-CFTR proteostasis monitored by western blotting. The fold change in the levels of band C obtained by downregulating anti-correction (A) and pro-correction (D) genes and the fold change in levels of band B (B) and band C/band B ratio (C) after downregulation of the anti-correction genes are shown. The effects of negative control siRNAs (dashed line) and VX-809 (green) are indicated. (E) The validated CORE genes (blue – pro-correction hits, orange – anti-correction hits, and gray – no action) were assembled into coherent networks based on information from databases. Non-directional interactions denote protein-protein interaction, directional interactions represent phosphorylation cascades and dashed arrows indicate indirect connections through intermediaries. (F) Western blot of CFBE cells treated with mitoxantrone (2.5-20 μM for 48 hr), a potential corrector identified using downregulation of anti-corrector genes as selection criteria. Mitoxantrone increased the levels of both band C and band B. (G) Treatment of CFBE cells with the indicated combinations of siRNAs targeting CORE genes led to a synergistic increase in the band C levels. Changes in the levels of band C were quantitated from western blotting are presented as mean ± SEM (n > 3). The representative blots are shown in the insert, the upper panel corresponds to a blot with lower exposure where the differences in band C levels can be easily appreciated, while the bottom panel corresponds to a blot with higher exposure where a faint band C can be seen even under control siRNA treatment.
Figure 2—figure supplement 1
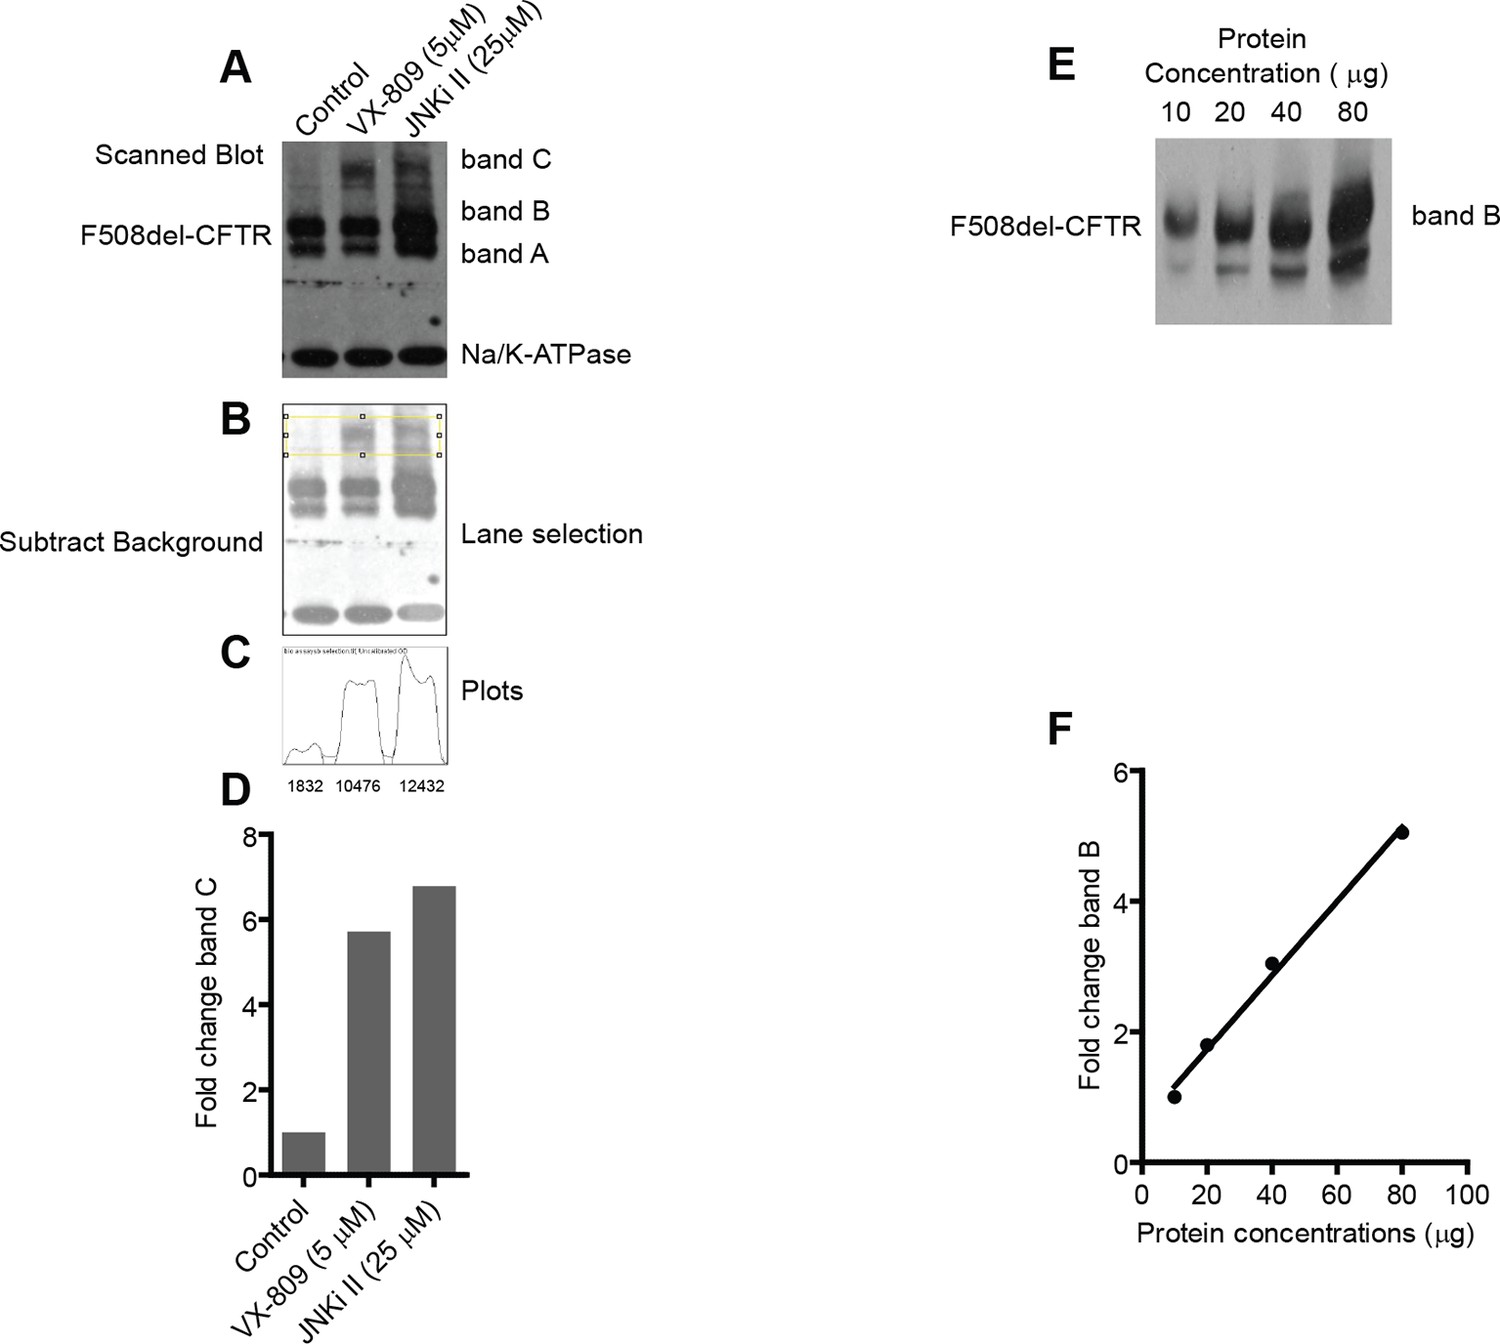
Characterization of biochemical assay to monitor F508del-CFTR correction.
(A) The changes in the F508del-CFTR proteostasis were monitored by a biochemical assay. This assay is sensitive and robust enough to detect even small changes in the proteostasis of CFTR. CFTR is resolved by SDS-PAGE into two distinct bands - one at ~140 kDa (band B; core glycosylated protein present in the ER) and another at ~170 kDa (band C; processed by Golgi-localized glycosylation enzymes). In the case of wild type CFTR, the majority of the protein is in the form of band C (not shown) while in the case of mutant F508del-CFTR the major form is band B. Sometimes a lower molecular weight band, termed band A, is also observed that probably corresponds to non-glycosylated CFTR. For the quantitation’s described in this manuscript, bands B and A were considered together as band B. Quantitation of the changes in the levels of bands B and C were carried out as outlined here in this example. CFBE cells were treated with indicated corrector drugs for 48 hr and were lysed and processed for western blotting as described in the Materials and methods. Treatment with corrector drugs increases the levels of both band B and band C of F508del-CFTR. Na+/K+-ATPase was used as loading control. To quantitate the levels of bands B and C, the X-ray films obtained were scanned using a flatbed scanner (Hewlett-Packard) at a resolution of 200–600 dpi and exported as 8-bit tiff images. (B) The scanned images were then imported into ImageJ for quantitation. First, the images were converted to grayscale and background of the image was removed using the 'subtract background' function with a rolling ball radius of 50–150 pixels. Next, using the rectangular selection tool, C bands (shown here) or B bands were selected. (C) The gel/blot analysis tool (Analyze>Gels) was then used for quantitation of the selected bands. First the 'select first lane' function was executed followed by the 'plot lane' function. This resulted in a plot as shown here. The area under the curve (as a measure of the density of bands) was then quantitated using the magic wand tool to select the peaks individually and exporting the density into a text file. The quantitated density values are indicated below the plot. We note that the method described here is semi-quantitative; nevertheless, the values obtained adequately describe the biological phenomenon observed. (D) The fold change in band C levels calculated using the measured values of density in (C) is plotted. (E, F) To test whether the semi-quantitative process described here is within the linear range of detection, we resolved indicated quantities of cell lysates prepared from CFBE cells by SDS-PAGE followed by western blotting, and the blots were processed as described before. The exposure time of the blots to the X-ray films was varied to get different intensity levels of the bands. Only one exposure of 30 s is shown here (E) for clarity. The intensity of the bands was calculated using ImageJ (see above) and expressed as fold change in band B (E) relative to the minimum value. As can be noted, the amounts of band B quantitated are linear in the range from 10 to 80 μg of cell lysate loaded. Similar results were obtained for band C. The linearity was also preserved for exposures that were twice or half of the time shown here. For experiments described in this manuscript the total amount of protein loaded ranged from 25 to 40 μg and exposure time of blots ranged from 30 to 45 s.
Figure 2—figure supplement 2

Downregulation of CORE genes rescues F508del-CFTR more efficiently than the corrector drugs used originally, without altering the F508del-CFTR mRNA levels.
(A) CFBE cells were treated with indicated corrector drugs for 48 hr and then lysed and prepared for western blotting, to assay the rescue of F508del-CFTR from ERQC. The changes in the levels of band C after drug treatment are shown as mean ± SEM (n > 3). (B) CFBE cells were treated with indicated siRNAs (targeting the anti-correction genes) for 72 hr, and then total RNA from the cells was purified. The levels of CFTR mRNA were quantitated by RT-PCR. The data are presented as mRNA levels relative to the negative control siRNAs. The values are expressed as mean ± SEM (n = 4). (C) Representative blot used for quantitations represented in Figure 2A–C. (D) Representative blot used for quantitations represented in Figure 2D
Figure 2—figure supplement 3
The siRNAs efficiently reduce the transcript levels of their target genes.
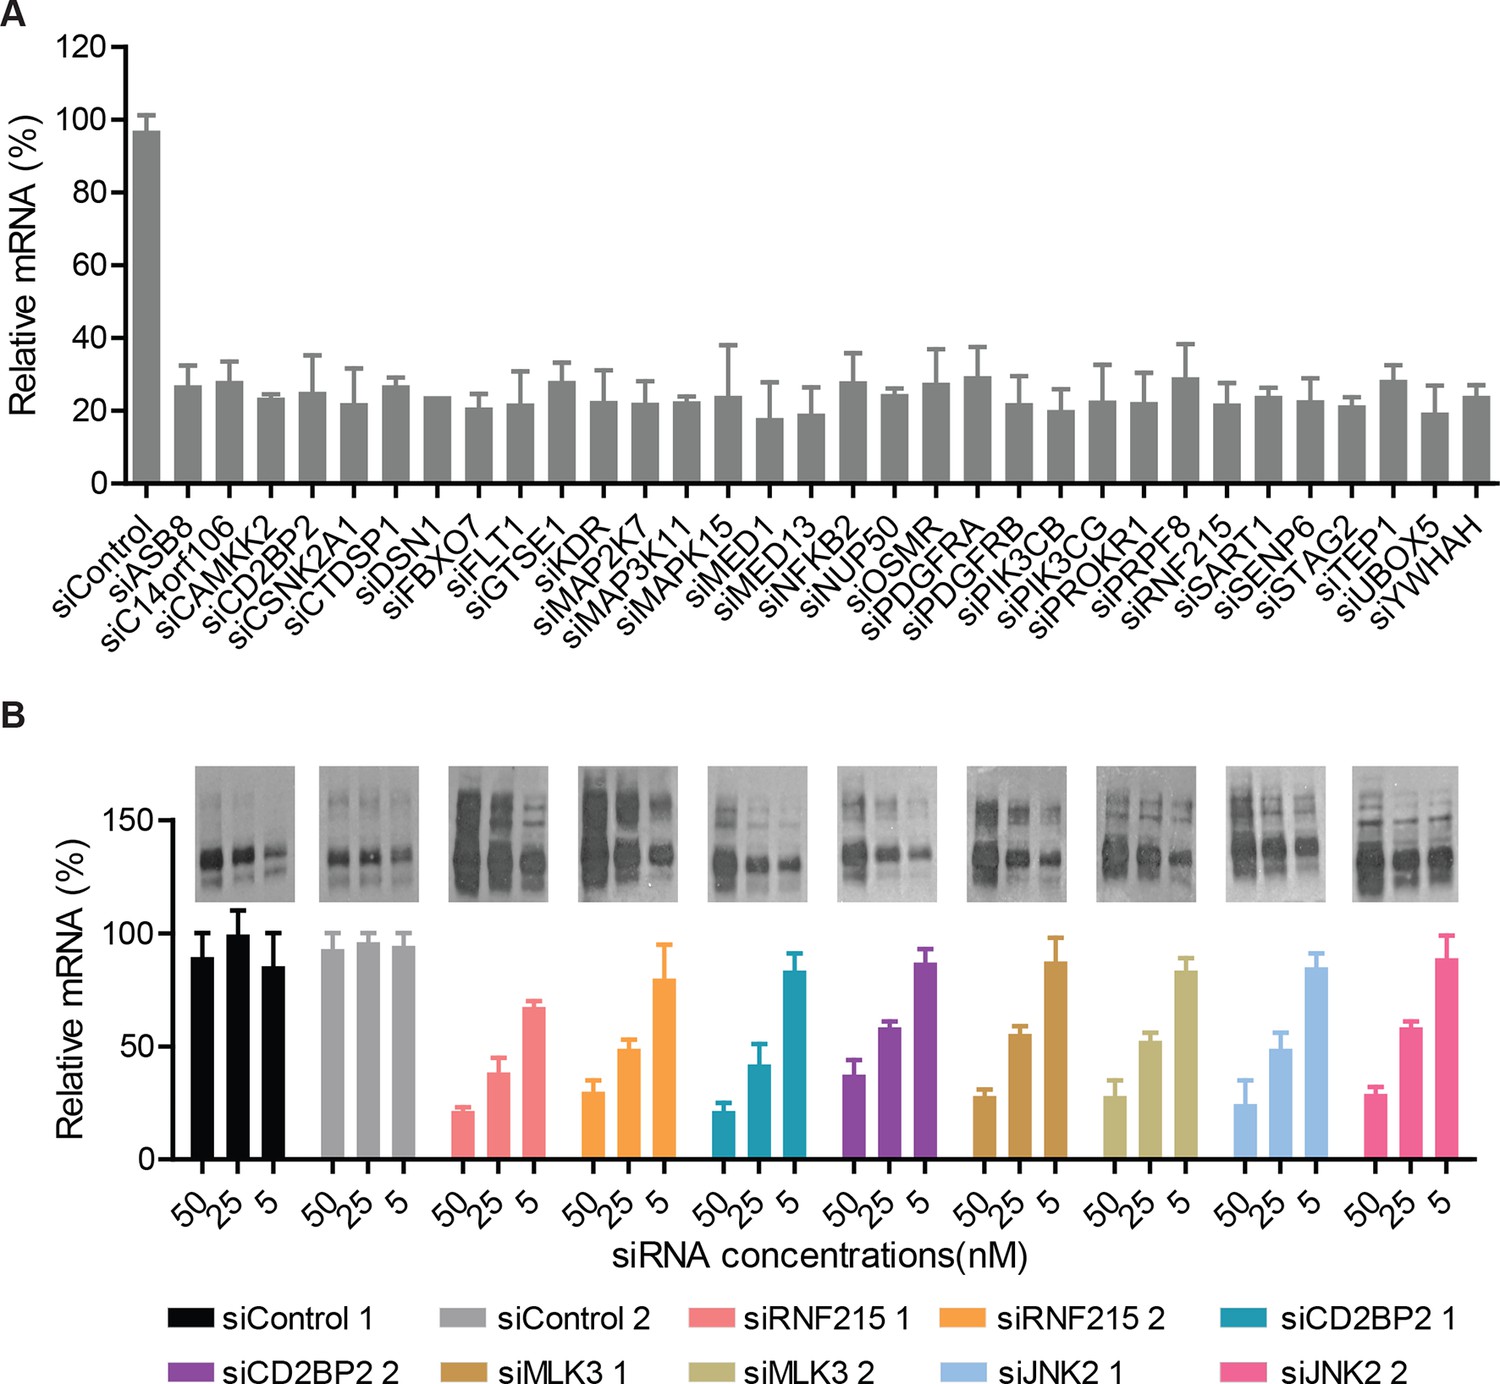
(A) CFBE cells were treated with indicated siRNAs for 72 hr. The efficiency of silencing for each gene was evaluated by quantitative RT-PCR and expressed as fold change represented as mean ± SEM (n = 3). The siRNA treatment reduced the mRNA levels of the target genes to ~10–30% of the levels present in control cells treated with non-targeting siRNA. (B) CFBE cells were treated with the indicated doses of siRNAs targeting the CORE genes for 72 hr. The change in the mRNA levels of the CORE genes was quantitated by RT-PCR and expressed as fold change represented as mean ± SEM (n > 3). The effect on F508del-CFTR proteostasis was also monitored by western blotting and shown in the insert. There was a positive correlation between the reduction in the levels of CORE genes and the change in proteostasis of F508del-CFTR.
Figure 3 with 1 supplement
Delineation of the MLK3 pathway branch that controls F508del-CFTR proteostasis.
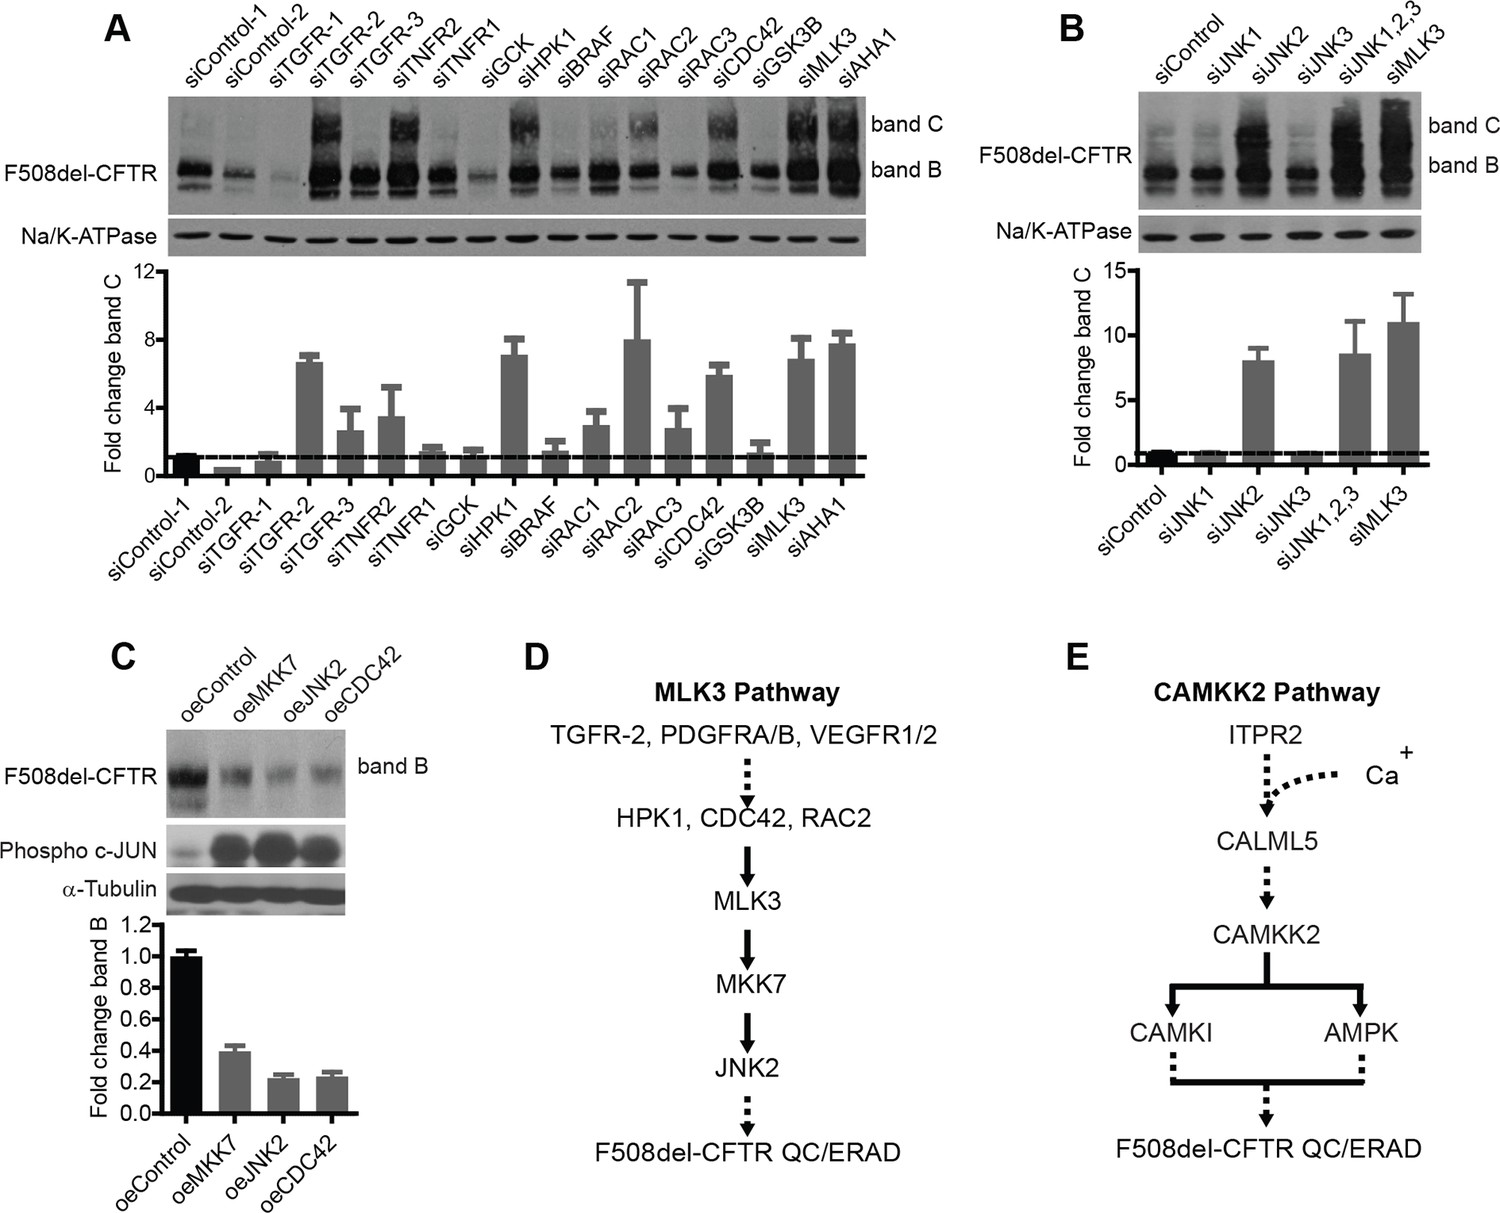
(A) CFBE cells were treated with indicated siRNAs targeting the upstream activators of MLK3 and their effect on F508del-CFTR proteostasis monitored by western blotting. The fold change in band C levels is shown as mean ± SEM (n > 3). Reduction in TGF receptor, HPK, CDC42 and RAC2 levels rescued F508del-CFTR from ERQC. The rescue obtained with TNFR2 siRNA was quite variable and thus was not considered further. (B) JNK isoforms were tested for their effect on F508del-CFTR proteostasis after siRNA-mediated downregulation of their levels. Downregulation of JNK2 leads to efficient rescue of F508del-CFTR that is comparable to that obtained with MLK3. The fold change in band C levels is presented as mean ± SEM (n > 3) with western blot in the insert. (C) CFBE cells were transfected with activators of the MLK3 pathway to study their effect on F508del-CFTR proteostasis. The fold change in the band B levels is shown as mean ± SEM (n > 3) with western blot in the insert. All of them reduced the levels of both band B and band C (not shown) of F508del-CFTR. The corresponding increase in the levels of phospho-c-jun indicates an increase activation of the MLK3 pathway activity. (D, E) Schematic representation of the proposed MLK3 (D) and CAMKK2 (E) pathways that regulate F508del-CFTR proteostasis. The directional interactions proposed between the components of the pathways are based on published literature.
Figure 3—figure supplement 1
Delineation of the MLK3 and CAMKK2 pathway branches that regulate F508del-CFTR proteostasis.
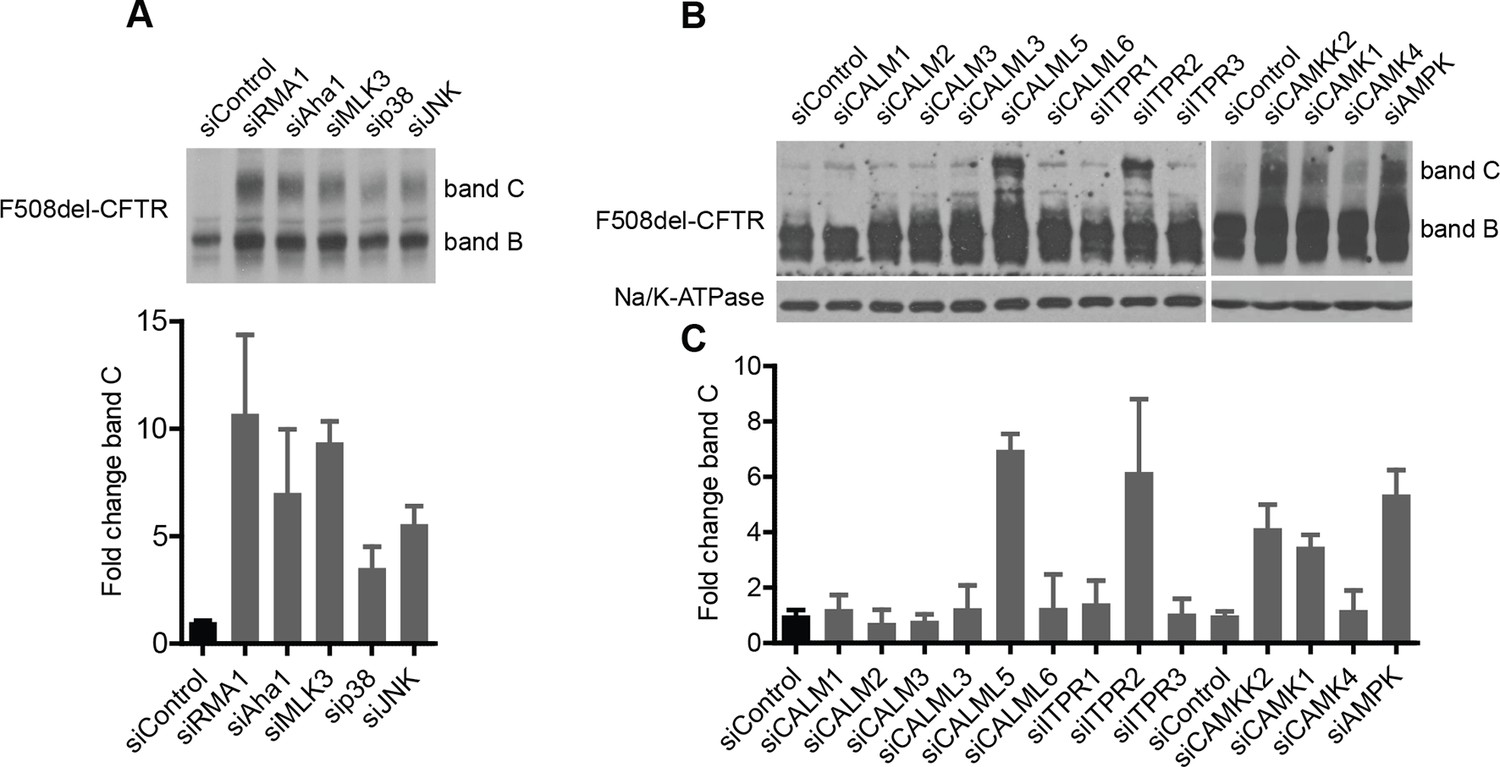
(A) HeLa cells [HeLa cells stably expressing HA-tagged F508del-CFTR] were treated with indicated siRNAs targeting MLK3 pathway components including p38 MAPK (mix of siRNAs targeting all four isoforms) and JNK (mix of siRNAs targeting all three JNKs). The effect on F508del-CFTR proteostasis monitored by western blotting. Fold change in the levels of band C was quantitated and presented as mean ± SEM (n > 3) with a representative blot shown in the insert. The downregulation of the MLK3 pathway components (including p38 MAPK) leads to the rescue of F508del-CFTR in HeLa cells. SiRNAs targeting Rma1 and Aha1 used as positive controls for rescue of F508del-CFTR. (B) Screening for F508del-CFTR proteostasis regulators among the CORE genes led to the identification of CAMKK2 as an anti-correction hit. Three downstream components and nine upstream components of the CAMKK2 signaling pathway (as derived from literature mining) were tested, by siRNA-mediated downregulation, for their role in regulation of F508del-CFTR proteostasis. CFBE cells were treated with the indicated siRNAs for 72 hr and their effect on F508del-CFTR proteostasis monitored by western blotting. Four of them (CALML5, ITPR2, CAMK4, and AMPK [by a mix of siRNAs targeting PRKAA1 and PRKAA2]) rescued F508del-CFTR from ERQC as seen by an increase in band C levels. (C) The changes in the levels of band C from (B) were quantitated and are represented as mean ± SEM (n > 3). See Figure 3 for a representation of the derived CAMKK2 pathway that regulates F508del-CFTR proteostasis.
Figure 4 with 1 supplement

MLK3 pathway regulates the degradation of F508del-CFTR.
(A, B) CFBE cells pretreated with siRNAs were treated with CHX (50 μg/mL) for indicated times and the levels of band B of F508del-CFTR was monitored (A). The levels were quantitated and represented in (B) as mean ± SEM (n > 3). Downregulation of MLK3 or JNK2 reduced the kinetics of reduction of band B of F508del-CFTR. (C, D). CHX chase assay (see above) after overexpression of the activators of MLK3 pathway. The activation of MLK3 pathway increases the rate of degradation of band B (C). Quantitation of the blot is shown in (D) as mean ± SEM (n > 3). (E, F) CFBE cells were treated with indicated siRNAs followed by incubation at 26°C for 6 hr followed by shift to 37°C for the indicated time periods. The changes in band C levels were monitored as measure of PQC (C). See (F) for quantitation of band C levels represented as mean ± SEM (n > 3). (G, H). PQC assay (see above) after overexpression of CDC42 or JNK2 shows an increased rate of degradation of band C (G) upon CDC42 overexpression. JNK2 overexpression has no effect on the PQC of F508del-CFTR. The blots were quantified and presented in (H) as mean ± SEM (n > 3).
Figure 4—figure supplement 1
Characterization of the mode of action of the MLK3 pathway on F508del-CFTR proteostasis.
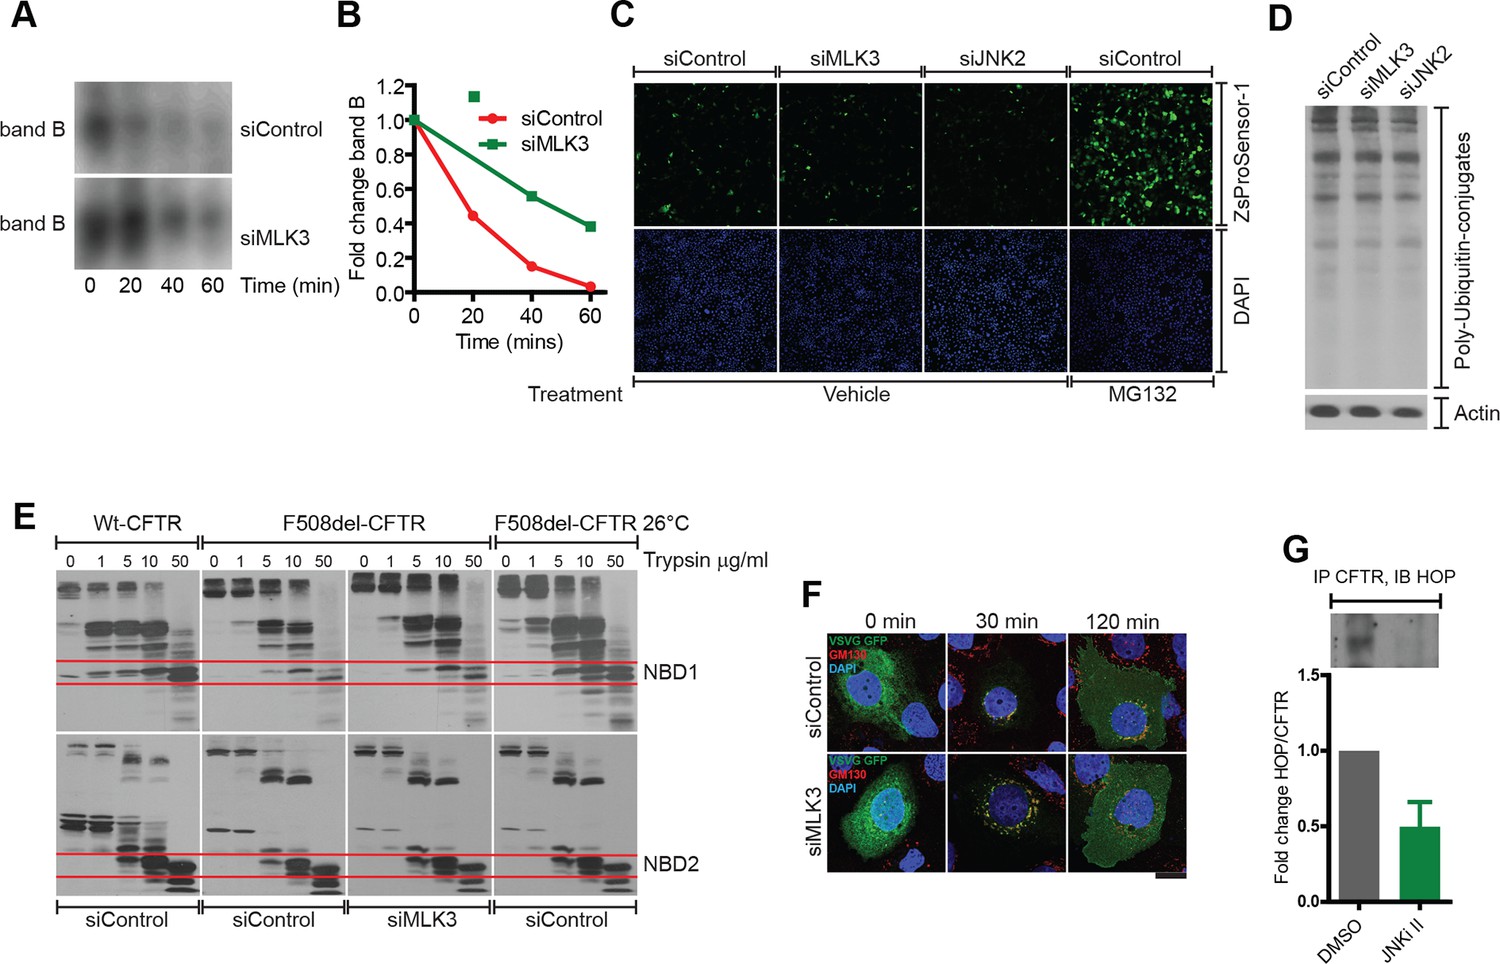
(A, B) CFBE cells treated with MLK3 siRNA were pulsed with radioactive [35S]-cysteine and methionine for 15 min, and then chased for the indicated times. CFTR was immunoprecipitated and processed for autoradiography (A). The signals corresponding to band B from (A) were quantitated and presented in (B). The data are representative of two independent experiments. Note the reduced degradation of F508del-CFTR upon downregulation of MLK3. (C) Downregulation of the MLK3-JNK pathway does not affect the activity of proteasomes. CFBE cells treated with MLK3 or JNK2 siRNA for 72 hr were transfected with Proteasome ZsProsensor-1 for the final 24 hr, and the levels Proteasome ZsProsensor-1 monitored by fluorescence microscopy. Treatment with MG132 (20 μg/ml for 3 hr), a proteasomal inhibitor, was used as a positive control. While treatment with MG132 increases the fluorescence levels of ZsProsensor-1 compared to untreated cells indicating a reduced proteasome activity, downregulation of MLK3 or JNK2 did not change the levels of fluorescence, suggesting that proteasome activity is not changed under these conditions. (D) CFBE cells were treated with MLK3 or JNK2 siRNA and processed for western blotting to monitor the accumulation of poly-ubiquitinated proteins. There was no change in the levels of poly ubiquitinated proteins suggesting that these treatments do not affect proteasome activity. (E) Downregulation of MLK3 does not affect the folding of F508del-CFTR. CFBE cells expressing wild type CFTR or F508del-CFTR were treated with MLK3 siRNA as indicated. Untreated CFBE cells incubated at 26°C for 24 hr were used as a positive control for the promotion of folding. Membrane fractions from the cells were isolated and subjected to trypsin digestion for 10 min on ice, followed by western blotting with M3A7 antibody that recognizes the NBD2 domain of F508del-CFTR, or with 3G11 antibody that recognizes NBD1. The wild-type CFTR and its NBD domains show more resistance to trypsin digestion compared to F508del-CFTR. There was no change in the stability of F508del-CFTR or its NBD domains upon downregulation of MLK3, while the low temperature treatment enhanced the stability of F508del-CFTR and its NBD1 domain. The western blots are representative of at least three different experiments. (F) Downregulation of MLK3 does not affect the exit of cargo from the ER. CFBE cells were treated with MLK3 siRNA for 72 hr, and during the final 16 hr they were transfected with VSVG-GFP and incubated at 40°C. The cells were then shifted to 32°C to allow the exit of cargoes from the ER. The cells were fixed at the indicated times after shift to 32°C and labeled for GM130 (red) to mark the Golgi apparatus and DAPI (blue) to stain the nucleus. The rate of transport of VSVG-GFP (green) either from ER to Golgi or from Golgi to the PM was not significantly affected by the downregulation of MLK3. Bar = 20 μm. G. HeLa cells were treated with JNKi II (2.5 μM) for 24 hr and F508del-CFTR was immunoprecipitated. The immunoprecipitate was subjected to western blotting to reveal the amount of associated HOP. The blots (like in the insert) were quantitated and normalized to the levels of F508del-CFTR (not shown). The values are presented as mean ± SD (n>3).
Figure 5
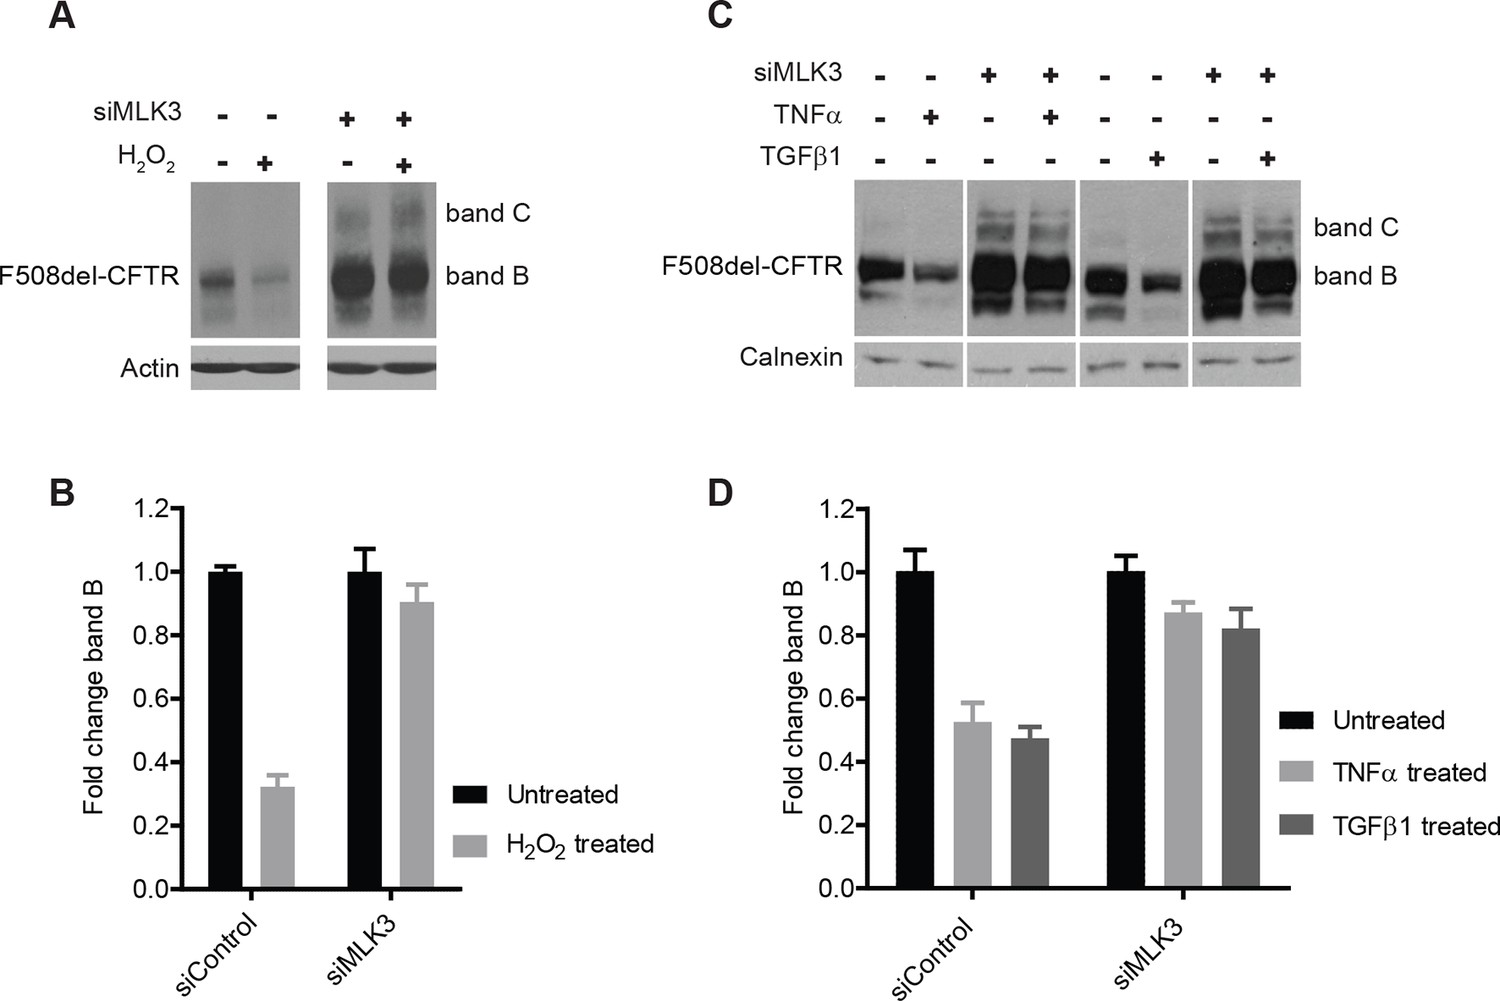
ROS and inflammatory cytokines control F508del-CFTR proteostasis via the MLK3 pathway.
(A) CFBE cells (pre-treated with MLK3 siRNA) were treated with 1 mM H2O2 for 30 min and levels of band B monitored by western blotting. Control cells show drastic reduction in F508del-CFTR levels upon treatment with H2O2 that is prevented by the downregulation of MLK3. (B) Quantitation of band B levels from (A) represented as mean ± SEM (n > 3). (C) CFBE cells (pre-treated with MLK3 siRNA) were treated with 50 ng/mL of TNF-α or TGF-β for 15 min and levels of band B monitored by western blotting. MLK3 downregulation prevents the decrease in band B levels brought about by treatment with the cytokines. (D) Quantitation of the band B levels from (C) represented as mean ± SEM (n > 3).
Figure 6 with 2 supplements
Inhibitors of the MLK3 pathway rescue F508del-CFTR.
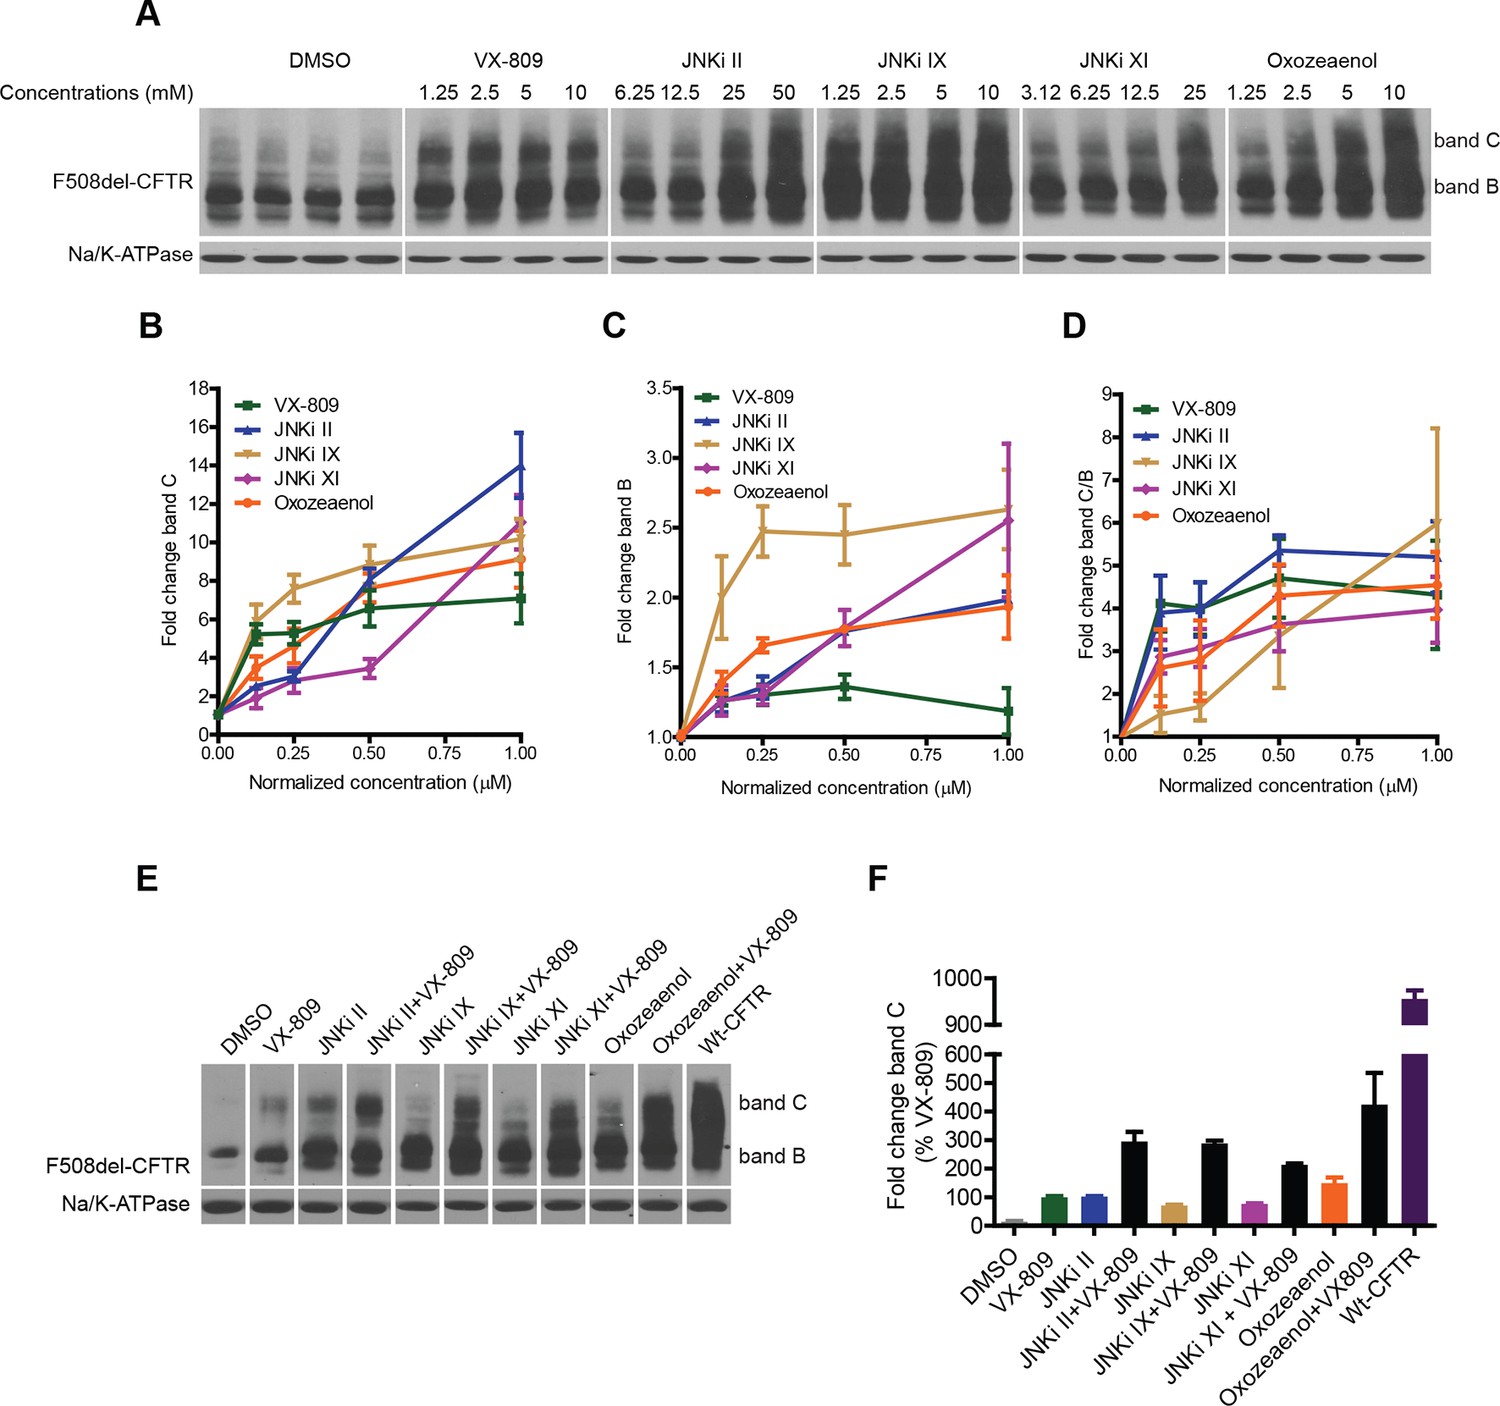
(A–D) CFBE cells were treated with the indicated inhibitors of the MLK3 pathway or VX-809 for 48 h, and the rescue of F508del-CFTR from ERQC was monitored (A). MLK3 pathway inhibitors rescue F508del-CFTR to levels comparable to or more than that achieved by VX-809. Changes in the levels of band C (B), band B (C) and the band C/band B ratio (D) were quantitated and shown mean ± SEM (n > 3). Normalized concentration (abscissa in panels B–D) refers to concentration (VX-809, JNKi IX and Oxozeaenol [1.25, 2.5, 5, 10 μM], JNKi II [6.25,12.5, 25, 50 μM], JNKi XI [3.12, 6.25,12.5, 25 μM]) values that were normalized to the maximum used concentrations of the respective drugs. Refer panel A for concentrations (µM) of the drugs used. (E) CFBE cells were treated with inhibitors of the MLK3 pathway and/or VX-809 (5 μM) for 48 hr and changes in band C levels monitored. The concentrations of the MLK3 pathway inhibitors used were: JNKi II (12.5 μM), JNKi IX (5 μM), JNKi XI (25 μM) and oxozeaenol (5 μM). Wild-type CFTR (wt-CFTR) was used as a control. (F) Quantitation of band C levels from (E) normalized to the levels of band C after VX-809 treatment are shown as mean ± SEM (n > 3). The results show that synergy obtained between the MLK3 pathway inhibitors and VX-809 brings the levels of band C to ~40% of the wild-type levels.
Figure 6—figure supplement 1

Small-molecule inhibitors of the MLK3 pathway rescue F508del-CFTR and other structurally related mutant proteins from degradation.
(A) CFBE cells were treated with indicated JNK inhibitors for 24 hr and processed for western blotting. The levels of phospho-c-jun as a measure of JNK inhibition was monitored. MLK3 pathway inhibitors reduce phospho-c-jun levels efficiently indicating a strong reduction in the activity of JNK and hence presumably of the MLK3 pathway. (B) CFBE cells were treated with TAK1 or MLK3 siRNA as indicated and changes in F508del-CFTR proteostasis were monitored by western blotting. TAK1 does not regulate F508del-CFTR proteostasis, as evidenced by the absence of change in the levels of bands C or B. The fold change in the band C levels was quantitated and plotted as mean ± SD (n = 2). (C) CFBE cells were treated with 5 μM oxozeaenol for 48 hr, or with MLK3 siRNA, or with both, and the correction of the F508del-CFTR folding/trafficking defect was monitored by changes in the levels of band C. There was no additive effect observed with the combination of MLK3 downregulation and oxozeaenol treatment. The quantitated band C levels are expressed as mean ± SD (n > 3). (D) CFBE cells were treated with 5 μM oxozeaenol for 24 hr, and the activity of the JNK pathway was measured by western blotting for phospho c-jun levels and F508del-CFTR. The levels of phospho c-jun were reduced, suggesting that oxozeaenol leads to a reduction in the activity of JNK. The increase in band C levels of F508del-CFTR show that the reduction in the activity of JNK is accompanied by a rescue of F508del-CFTR from ERQC. (E) CFBE cells were treated with flunarizine (at concentrations 6.25–50 μM) targeting the CAMKK2 pathway for 48 hr and the effect on F508del-CFTR proteostasis measured by western blotting. Treatment with flunarizine increased the levels of band C of F508del-CFTR. Other small molecules known to inhibit the CAMKK2 pathway components (verapamil and STO-609) did not show any effect on correction of F508del-CFTR. (F) CFBE cells transiently transfected with the P-glycoprotein mutant (P-gp DY490), the NCC mutant (R948X), or the hERG mutant (G601S) were treated with JNKi II for 24 hr, and the effect of the drug on their proteostasis monitored by western blotting. While the trafficking of P-gp DY490 out of the ER was enhanced by this treatment (seen as an increase in the Golgi-associated band C, indicated by arrows), other mutants are subjected to enhanced degradation upon drug treatment, as shown by a decrease in the levels of both bands B and C. (G) CFBE cells were treated with JNKi II at indicated concentrations (25, 50 µM) for 48 hr and the changes in the proteostasis of non-mutant endogenous proteins like E-cadherin, IGF1Rß and EGFR were monitored by western blotting. There was no significant change in the proteostasis of these proteins.
Figure 6—figure supplement 2
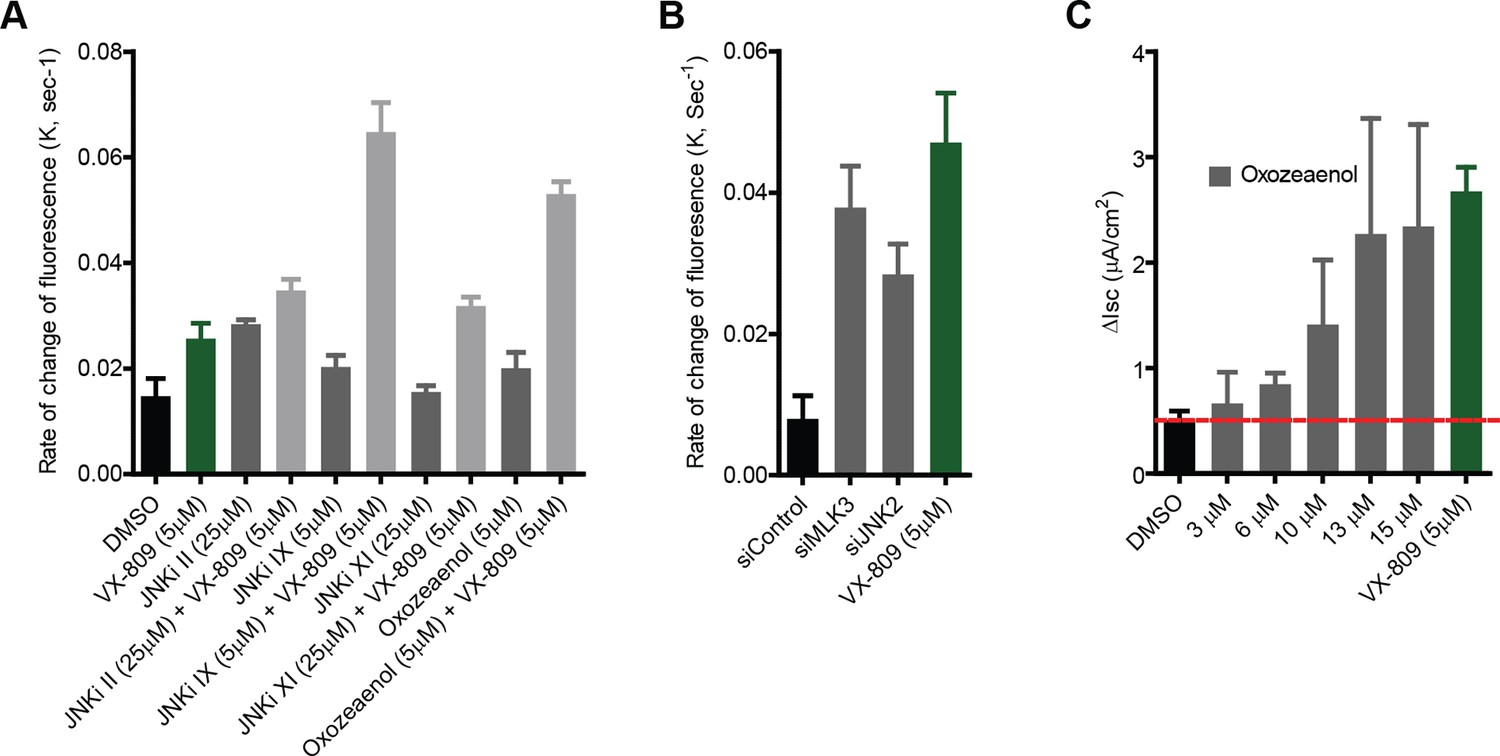
Small molecule inhibitors of MLK3 pathway rescue channel function of F508del-CFTR.
(A) CFBE-YFP cells were treated with MLK3 pathway inhibitors and/or VX-809 for 48 hr, and the anion transport measured as described in the Materials and methods. The rate constants of the decrease in YFP fluorescence (K), a measure of anion conductance, after inhibitor treatments are shown. The data are expressed as mean ± SEM (n > 3). (B) Anion transport was measured in CFBE-YFP cells after downregulating the MLK3 pathway activity by siRNA-mediated knockdown MLK3 or JNK2. The rate constants of the decrease in YFP fluorescence (K), a measure of anion conductance, after downregulation of the indicated MLK3 pathway components are shown. The data are expressed as mean ± SEM (n > 3). Treatment with VX-809 was used as a positive control for the rescue. (C) CFBE41o- cells were grown under polarizing conditions before addition of oxozeaenol at indicated concentrations for 48 hr, followed by the measurement of short circuit currents using Ussing chamber assays (see Materials and methods). The columns show the measured values of the short-circuit current after oxozeaenol treatment at the indicated concentrations. The values are mean ± SEM (n>3).
Tables
Table 1
The list of corrector drugs used in this study with their corresponding known primary MOAs (related to Figure 1).
| Drugs of the CFBE dataset (Reference for correction activity) | Primary Use/Class |
|---|---|
| 4-AN, PARP1 inhibitor (Anjos et al., 2012) | PARP1 inhibitor |
| ABT888 (Anjos et al., 2012) | A poly(ADP-ribose) polymerase (PARP) -1 and -2 inhibitor with chemosensitizing and antitumor activities. ABT-888 inhibits PARPs, thereby inhibiting DNA repair and potentiating the cytotoxicity of DNA-damaging agents. |
| Glafenine (Robert et al., 2010) | An anthranilic acid derivative with analgesic properties used for the relief of all types of pain (1) |
| GSK339 (DY Thomas lab, unpublished) | Androgen receptor ligand (Norris et al., 2009). |
| Ibuprofen (Carlile et al., 2015) | Ibuprofen is a nonsteroidal anti-inflammatory drug. It is a non-selective inhibitor of cyclooxygenase. |
| JFD03094 | PARP inhibitor |
| KM11060 (Robert et al., 2008) | PDE5 inhibitor (an analog of sildenafil). |
| Latonduine (Carlile et al., 2012) | PARP3 inhibitor |
| Minocycline H (D Y Thomas lab unpublished) | A tetracycline analog that inhibits protein synthesis in bacteria. Also known to inhibit 5-lipooxygenase in the brain (2). |
| Ouabagenin (Zhang et al., 2012) | A cardiaoactive glycoside obtained from the seeds of Strophanthus gratus. Acts by inhibiting Na+/K+-ATPase, resulting in an increase in intracellular sodium and calcium concentrations (2). |
| Ouabain (Zhang et al., 2012) | A cardiaoactive glycoside obtained from the seeds of Strophanthus gratus. Acts by inhibiting Na+/K+-ATPase, resulting in an increase in intracellular sodium and calcium concentrations (2). |
| PJ34 (Anjos et al., 2012) | PARP1 inhibitor |
| Low temperature (Denning et al., 1992) | |
| Chloramphenicol (Carlile et al., 2007) | Inhibitor bacterial protein synthesis by binding to 23S rRNA and preventing peptidyl transferase activity (2). |
| Chlorzoxazone (Carlile et al., 2007) | Muscle relaxant. Acts by inhibiting degranulation of mast cells and preventing the release of histamine and slow-reacting substance of anaphylaxis. It acts at the level of the spinal cord and subcortical areas of the brain where it inhibits multi-synaptic reflex arcs involved in producing and maintaining skeletal muscle spasm (2). |
| Dexamethasone (Caohuy et al., 2009) | A synthetic glucocorticoid agonist. Its anti-inflammatory properties are thought to involve phospholipase A2 inhibitory proteins, lipocortins (2). |
| Doxorubicin (Maitra et al., 2001) | DNA intercalator that inhibits topoisomerase II activity by stabilizing the DNA-topoisomerase II complex (2). |
| Glafenine (Robert et al., 2010) | An anthranilic acid derivative with analgesic properties used for the relief of all types of pain (1). |
| Liothyronine (Carlile et al., 2007) | L-triiodothyronine (T3, liothyronine) thyroid hormone is normally synthesized and secreted by the thyroid gland. Most T3 is derived from peripheral monodeiodination of T4 (L-tetraiodothyronine, levothyroxine, L-thyroxine). The hormone finally delivered and used by the tissues is mainly T3. Liothyronine acts on the body to increase the basal metabolic rate, affect protein synthesis and increase the body's sensitivity to catecholamines (such as adrenaline). It is used to treat hypothyroidism (2). |
| MS-275 (Hutt et al., 2010) | Also known as Entinostat. An inhibitor of Class Ihistone deacetylases (preferentially HDAC 1, also HDAC 3) (Hu et al., 2003). |
| Scriptaid (Hutt et al., 2010) | An inhibitor of Class I histone deacetylases (HDAC1, HDAC3 and HDAC8) (Hu et al., 2003). |
| Strophanthidin (Carlile et al., 2007) | A cardioactive glycoside that inhibits Na+/K+-ATPase. Also known to inhibit the interaction of MDM2 and MDMX (1). |
| Thapsigargin (Egan et al., 2002) | A sesquiterpene lactone found in roots of Thapsia garganica. A non-competitive inhibitor of sarco/endoplasmic Ca2+-ATPase (SERCA) (1). |
| Trichostatin-A (Hutt et al., 2010) | An inhibitor of histone deacetylases (HDAC1, HDAC3, HDAC8 and HDAC7) (Hu et al., 2003). |
-
(2) www.drugbank.ca
Additional files
-
Supplementary file 1
The microarray data for the CFBE dataset (related to Figure 1).
- https://doi.org/10.7554/eLife.10365.019
-
Supplementary file 2
Drug communities containing the 11 MANTRA drugs extracted from the MANTRA drug similarity network assembled in (Iorio et al., 2010) (related to Figure 1—figure supplement 1).
- https://doi.org/10.7554/eLife.10365.020
-
Supplementary file 3
The CORE genes obtained using the FIT analysis and list of genes selected for experimental validation (related to Figures 1 and 2).
- https://doi.org/10.7554/eLife.10365.021
-
Supplementary file 4
The proteostasis genes used for this study (related to Figure 1).
- https://doi.org/10.7554/eLife.10365.022
-
Supplementary file 5
The regulatory and proteostasis genes present in the CORE genes list (related to Figure 1).
- https://doi.org/10.7554/eLife.10365.023
-
Supplementary file 6
The siRNAs used in this study (related to Figure 2).
- https://doi.org/10.7554/eLife.10365.024
Download links
A two-part list of links to download the article, or parts of the article, in various formats.
Downloads (link to download the article as PDF)
Open citations (links to open the citations from this article in various online reference manager services)
Cite this article (links to download the citations from this article in formats compatible with various reference manager tools)
Unravelling druggable signalling networks that control F508del-CFTR proteostasis
eLife 4:e10365.
https://doi.org/10.7554/eLife.10365


