Salmonella exploits host- and bacterial-derived β-alanine for replication inside host macrophages
- National Key Laboratory of Intelligent Tracking and Forecasting for Infectious Diseases, TEDA Institute of Biological Sciences and Biotechnology, Nankai University, China
Figures
Figure 1 with 8 supplements
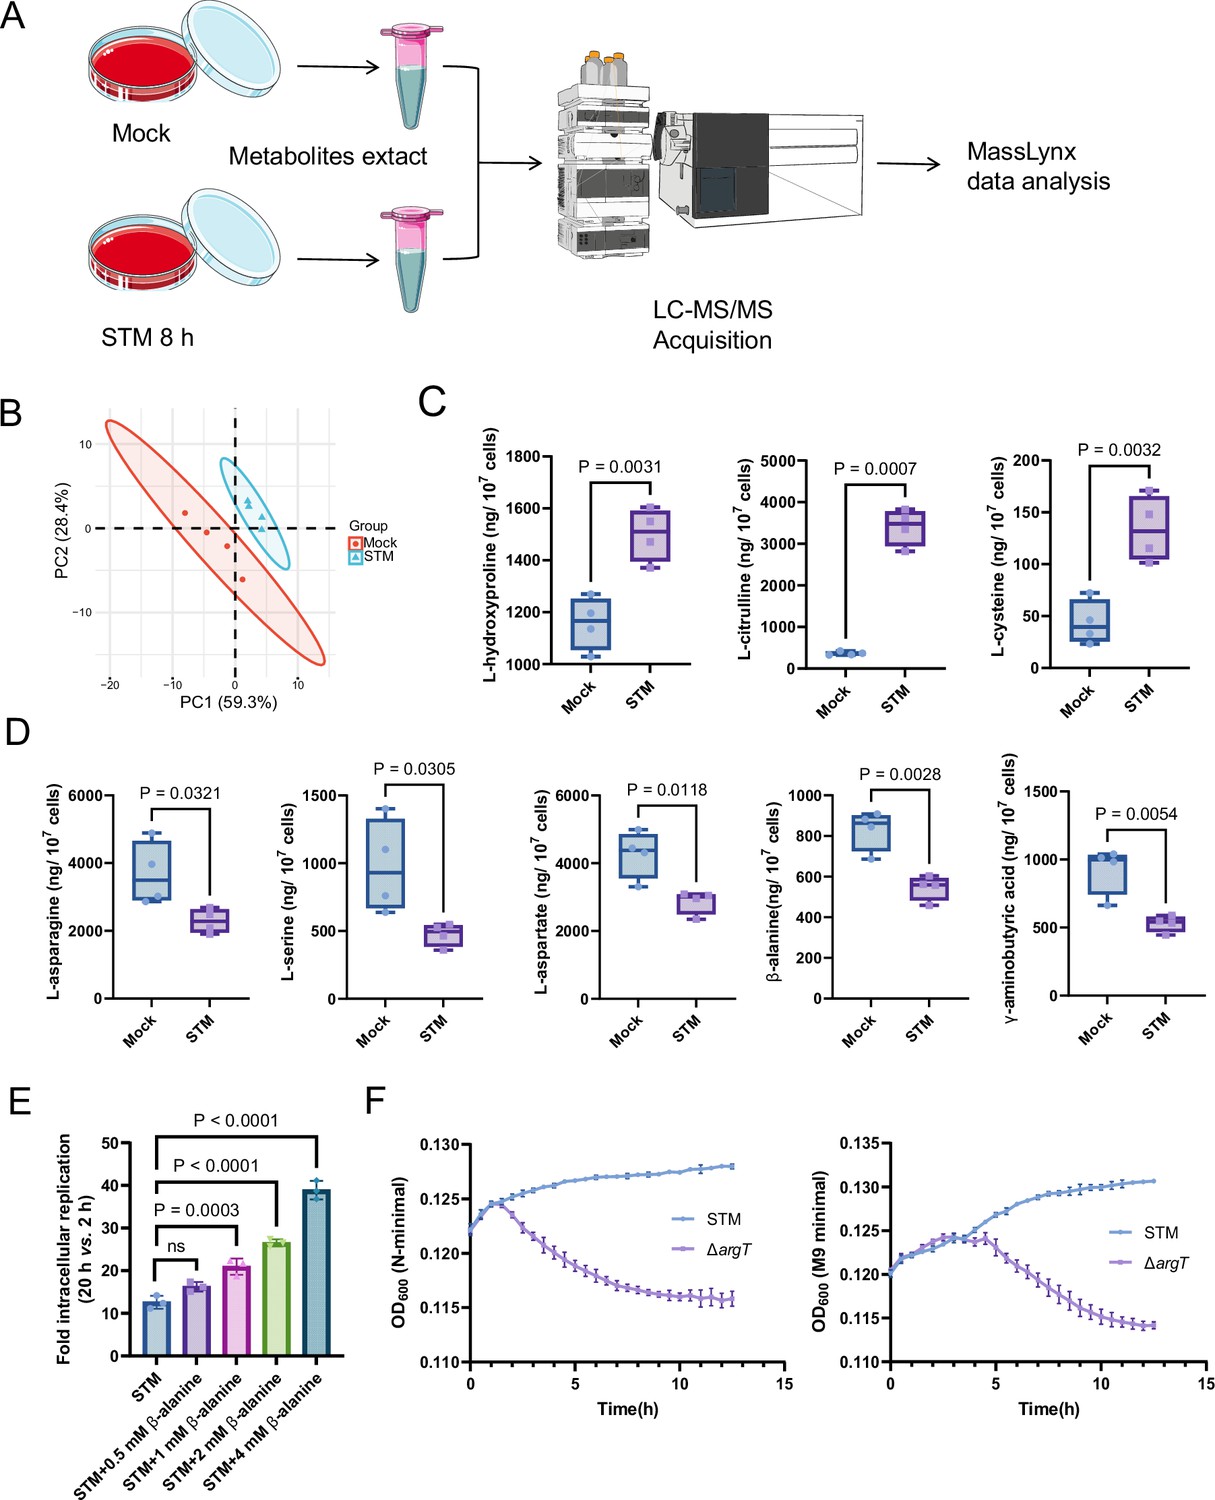
Host-derived β-alanine promotes Salmonella replication inside macrophages.
(A) Schematic workflow for targeted metabolomics investigation of mock- and Salmonella-infected (STM) mouse RAW264.7 macrophages. Picture materials were used from bioicons (https://bioicons.com/). (B) Principal component analysis (PCA) score plots of metabolic profiles in the mock- and Salmonella-infected (STM) groups (n=4 biologically independent samples). (C) The concentrations of upregulated amino acids in the mock- and Salmonella-infected groups (n=4 biologically independent samples). (D) The concentrations of downregulated amino acids in the mock- and Salmonella-infected groups (n=4 biologically independent samples). (E) Fold intracellular replication (20 hr vs. 2 hr) of Salmonella WT in RAW264.7 cells in the presence of 0.5, 1, 2, 4 mM β-alanine. Data are presented as the mean ± SD, n=3 independent experiments. (F) Growth curves of Salmonella WT and the argT mutant (ΔargT) in N-minimal (left) and M9 minimal (right) medium supplemented with β-alanine (1 mM) as the sole carbon source. Data are presented as mean ± SD, n=4 independent experiments. Statistical significance was assessed using two-sided Student’s t-test (C, D) and one-way ANOVA (E).
-
Figure 1—source data 1
The numerical source data corresponds to Figure 1.
- https://cdn.elifesciences.org/articles/103714/elife-103714-fig1-data1-v1.xlsx
Figure 1—figure supplement 1
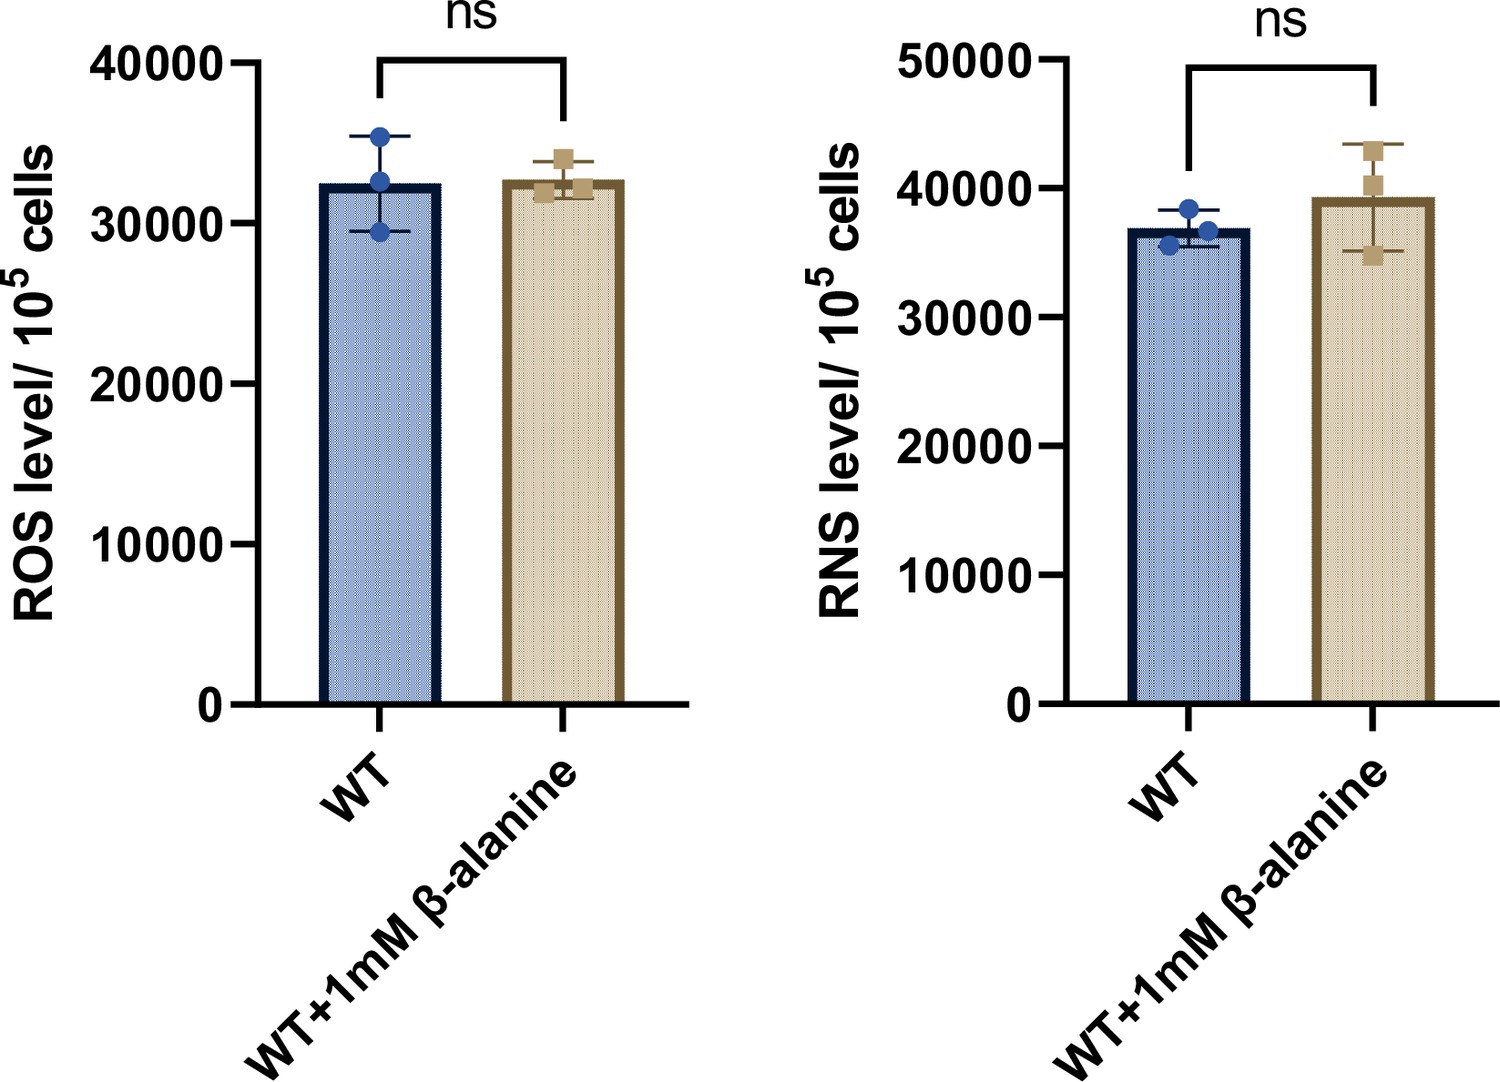
The levels of reactive oxygen species (ROS) and reactive nitrogen species (RNS) in RAW264.7 cells after infection with Salmonella WT for 8 hr, in the presence or absence of 1 mM β-alanine.
Data are presented as mean ± SD, n=3 independent experiments. Statistical significance was assessed using a two-sided Student’s t-test. ns, not Significant.
-
Figure 1—figure supplement 1—source data 1
The numerical source data corresponds to Figure 1—figure supplement 1.
- https://cdn.elifesciences.org/articles/103714/elife-103714-fig1-figsupp1-data1-v1.xlsx
Figure 1—figure supplement 2
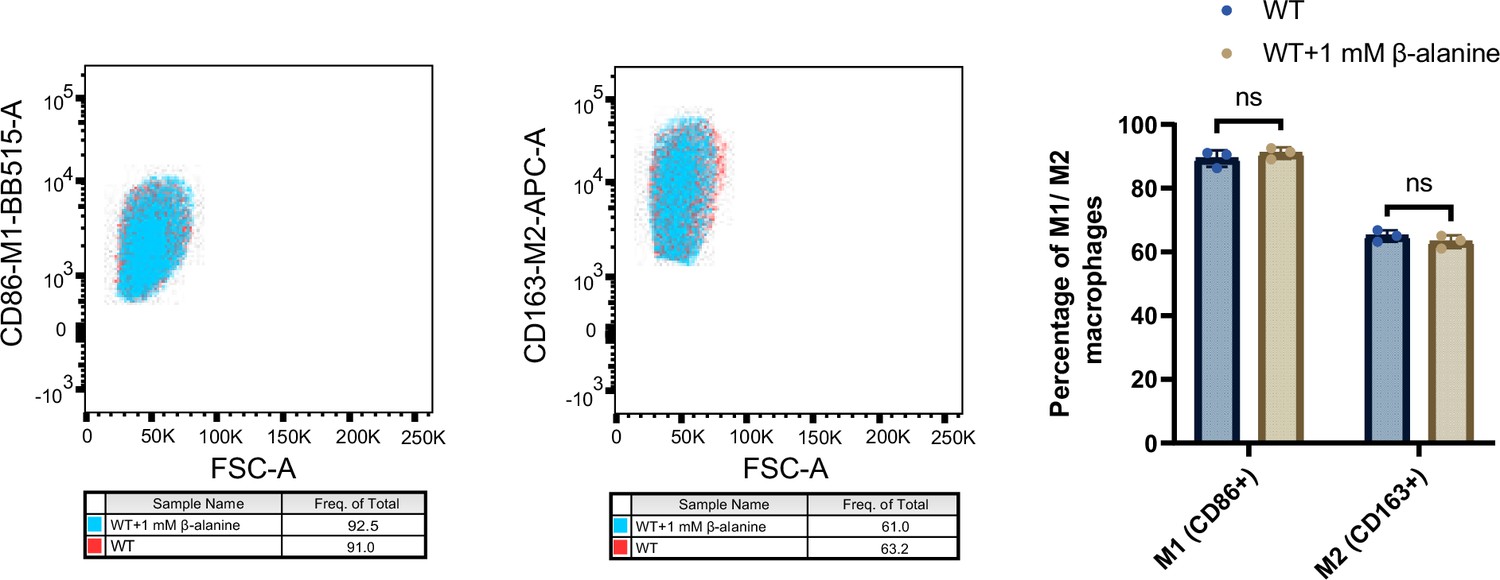
Flow cytometry analysis was conducted to determine the percentage of pro-inflammatory M1 macrophages (CD86+) and anti-inflammatory M2 macrophages (CD163+).
RAW264.7 cells were infected with Salmonella wild-type (WT) for 8 hr, in the presence or absence of 1 mM β-alanine. Subsequently, the infected cells were collected for flow cytometry analysis. Representative dot plots and quantification of M1 (CD86+) and M2 (CD163+) macrophages are displayed in the left and right panels, respectively. Data are presented as mean ± SD, n=3 independent experiments. Statistical significance was assessed using two-way ANOVA. ns, not Significant.
-
Figure 1—figure supplement 2—source data 1
The numerical source data corresponds to Figure 1—figure supplement 2.
- https://cdn.elifesciences.org/articles/103714/elife-103714-fig1-figsupp2-data1-v1.xlsx
Figure 1—figure supplement 3

Growth curves of Salmonella wild-type (WT) and the cycA mutant (ΔcycA) in N-minimal medium supplemented with β-alanine (1 mM) as the sole carbon source.
Data are presented as mean ± SD, n=3 independent experiments.
-
Figure 1—figure supplement 3—source data 1
The numerical source data corresponds to Figure 1—figure supplement 3.
- https://cdn.elifesciences.org/articles/103714/elife-103714-fig1-figsupp3-data1-v1.xlsx
Figure 1—figure supplement 4
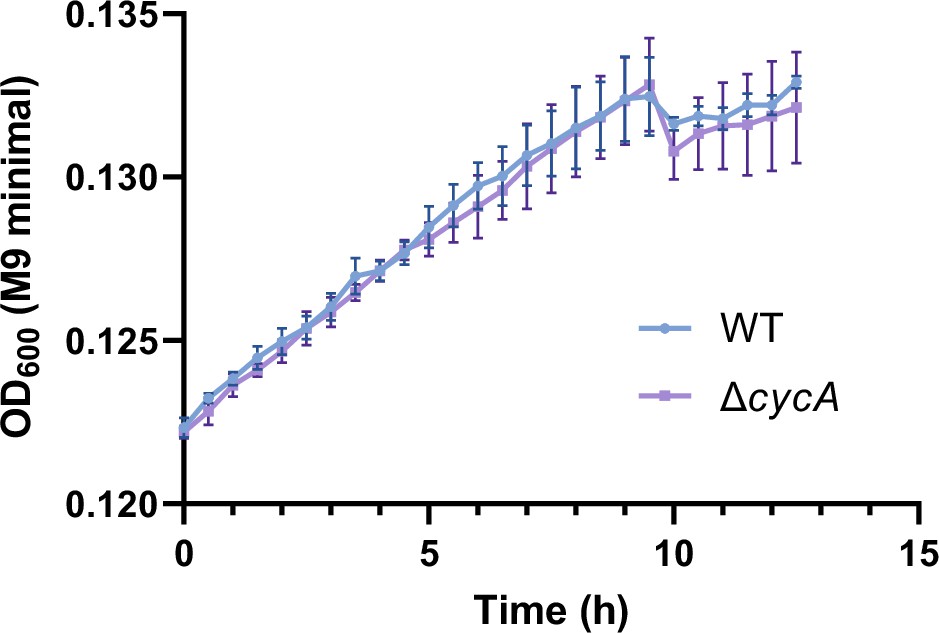
Growth curves of Salmonella wild-type (WT) and the cycA mutant (ΔcycA) in M9 minimal medium supplemented with β-alanine (1 mM) as the sole carbon source.
Data are presented as mean ± SD, n=3 independent experiments.
-
Figure 1—figure supplement 4—source data 1
The numerical source data corresponds to Figure 1—figure supplement 4.
- https://cdn.elifesciences.org/articles/103714/elife-103714-fig1-figsupp4-data1-v1.xlsx
Figure 1—figure supplement 5
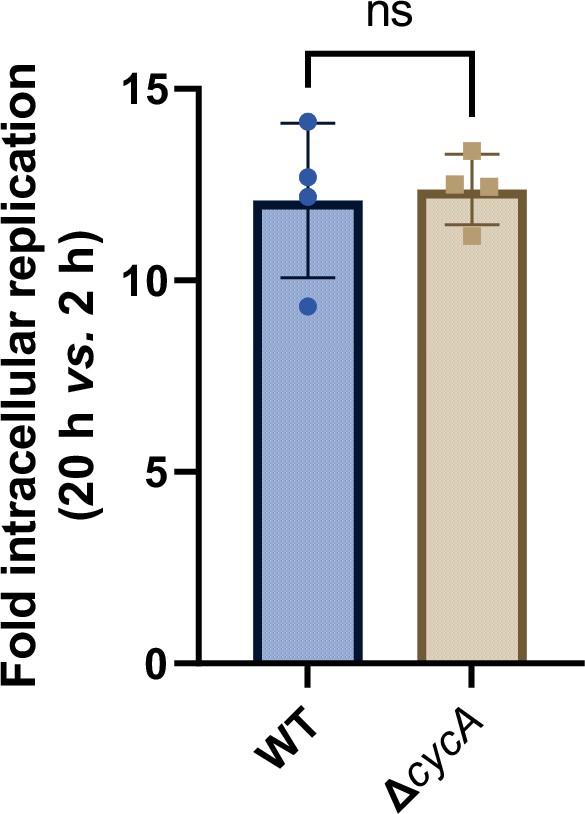
Fold intracellular replication (20 hr vs. 2 hr) of Salmonella wild-type and ΔcycA in RAW264.7 cells.
Data are presented as mean ± SD, n=4 independent experiments. Statistical significance was assessed using two-way ANOVA. ns, not Significant.
-
Figure 1—figure supplement 5—source data 1
The numerical source data corresponds to Figure 1—figure supplement 5.
- https://cdn.elifesciences.org/articles/103714/elife-103714-fig1-figsupp5-data1-v1.xlsx
Figure 1—figure supplement 6
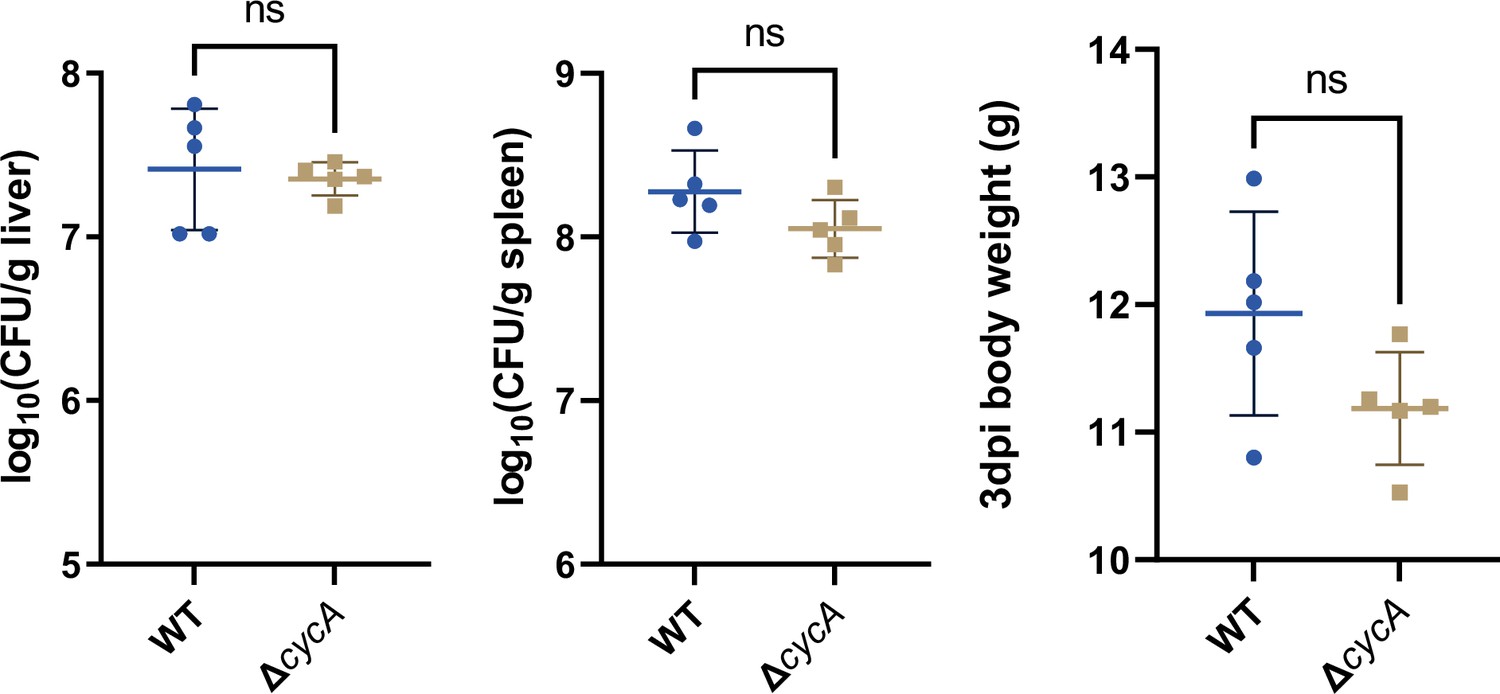
Liver and spleen bacterial burdens, and body weight of mice infected with Salmonella wild-type (STM) and cycA mutant (ΔcycA), at day 3 post-infection.
n=5 mice per group. Statistical significance was assessed using the Mann-Whitney U test. ns, not Significant.
-
Figure 1—figure supplement 6—source data 1
The numerical source data corresponds to Figure 1—figure supplement 5.
- https://cdn.elifesciences.org/articles/103714/elife-103714-fig1-figsupp6-data1-v1.xlsx
Figure 1—figure supplement 7

Growth curves of Salmonella wild-type (WT) and the gabP mutant (ΔgabP) in N-minimal medium supplemented with β-alanine (1 mM) as the sole carbon source.
Data are presented as mean ± SD, n=3 independent experiments.
-
Figure 1—figure supplement 7—source data 1
The numerical source data corresponds to Figure 1—figure supplement 5.
- https://cdn.elifesciences.org/articles/103714/elife-103714-fig1-figsupp7-data1-v1.xlsx
Figure 1—figure supplement 8

Growth curves of Salmonella wild-type (WT) and the gabP mutant (ΔgabP) in M9 minimal medium supplemented with β-alanine (1 mM) as the sole carbon source.
Data are presented as mean ± SD, n=3 independent experiments.
-
Figure 1—figure supplement 8—source data 1
The numerical source data corresponds to Figure 1—figure supplement 5.
- https://cdn.elifesciences.org/articles/103714/elife-103714-fig1-figsupp8-data1-v1.xlsx
Figure 2 with 3 supplements
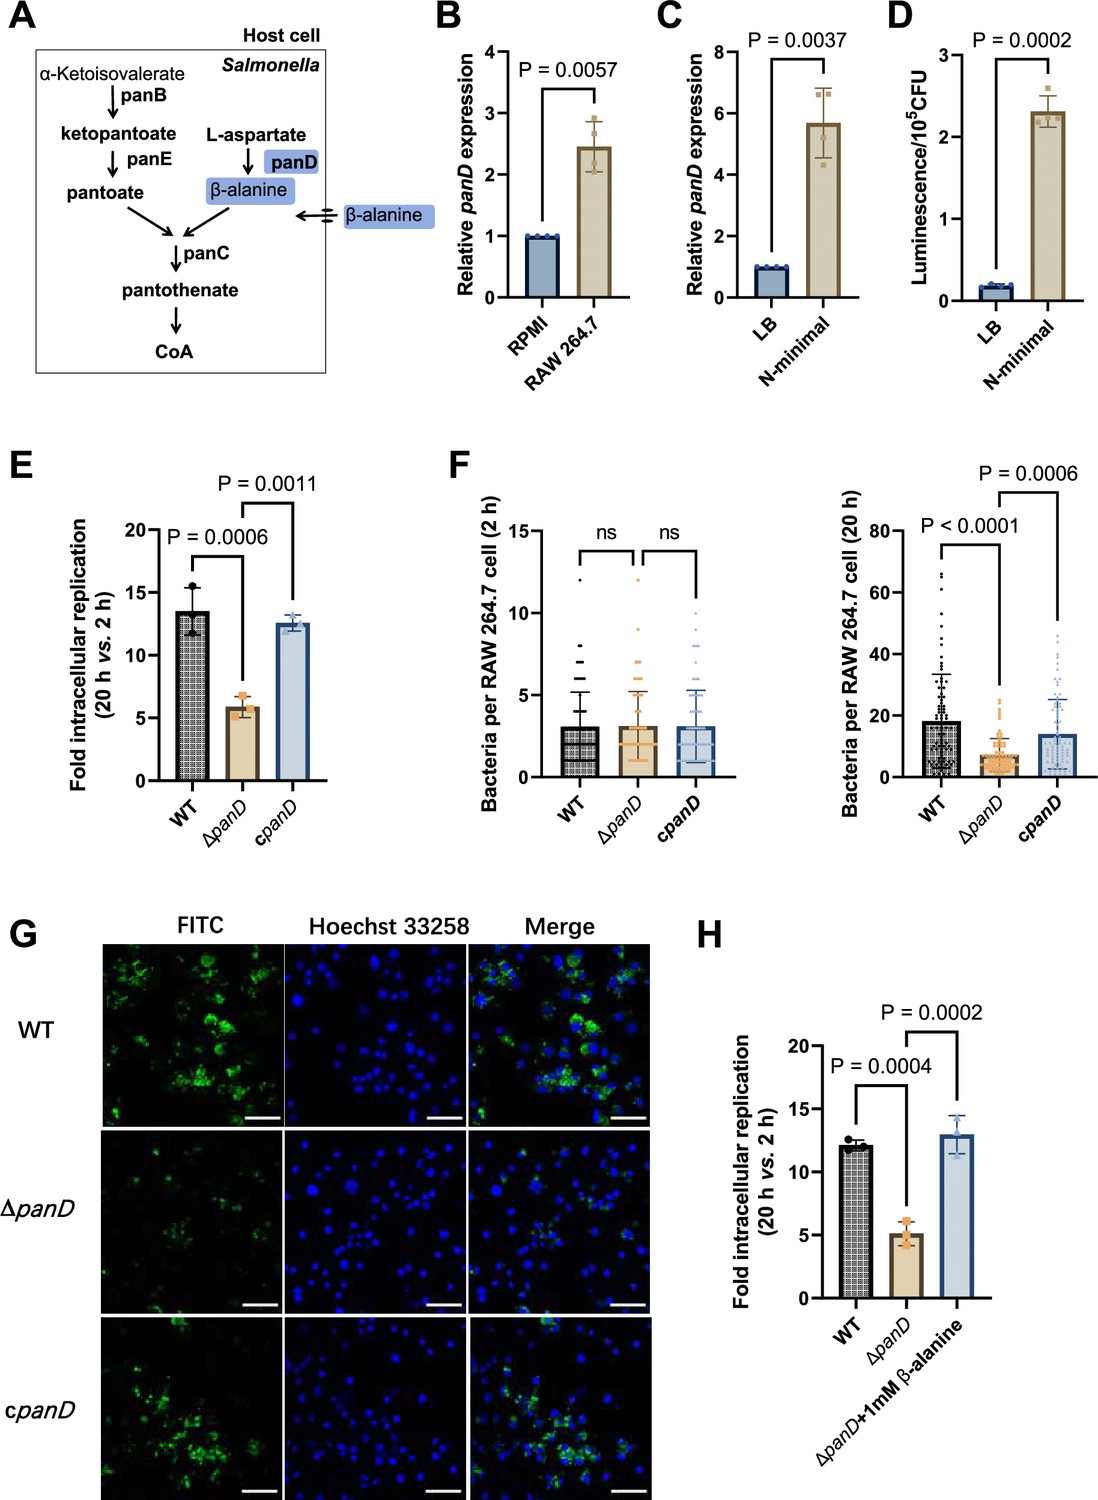
De novo β-alanine synthesis is critical for Salmonella replication inside macrophages.
(A) Scheme of β-alanine and the downstream CoA biosynthesis pathway in Salmonella. (B) Quantitative real-time PCR (qRT‒PCR) analysis of the expression of the Salmonella panD gene in RAW264.7 cells (8 hr post-infection) and RPMI-1640 medium. (C) qRT‒PCR analysis of the expression of the Salmonella panD gene in N-minimal medium and LB medium. (D) Expression of the panD-lux transcriptional fusion in N-minimal medium and LB medium. Luminescence values were normalized to 105 bacterial CFUs. (E) Fold intracellular replication (20 hr vs. 2 hr) of Salmonella Typhimurium 14,028 s wild-type (WT), the panD mutant (ΔpanD), and the complemented strain (cpanD) in RAW264.7 cells. (F) Number of intracellular Salmonella WT, ΔpanD, and cpanD strains per RAW264.7 cell at 2 and 20 hr post-infection. The number of intracellular bacteria per infected cell was estimated in random fields, n=80 cells per group from three independent experiments. (G) Representative immunofluorescence images of Salmonella WT, ΔpanD, and cpanD in RAW264.7 cells at 20 hr post-infection (green, Salmonella; blue, nuclei; scale bars, 50 µm). Images are representative of three independent experiments. (H) Replication of Salmonella WT and ΔpanD in RAW264.7 cells in the presence or absence of 1 mM β-alanine. The data are presented as the mean ± SD, n=3 (B–E, H) independent experiments. Statistical significance was assessed using a two-sided Student’s t-test (B–D) or one-way ANOVA (E, F, H). ns, not Significant.
-
Figure 2—source data 1
The numerical source data corresponds to Figure 2.
- https://cdn.elifesciences.org/articles/103714/elife-103714-fig2-data1-v1.xlsx
Figure 2—figure supplement 1

Growth curves of Salmonella wild-type (WT), panD mutant (ΔpanD), and the complemented strain (cpanD) in LB medium.
Data are presented as mean ± SD, n=4 independent experiments.
-
Figure 2—figure supplement 1—source data 1
The numerical source data corresponds to Figure 2—figure supplement 1.
- https://cdn.elifesciences.org/articles/103714/elife-103714-fig2-figsupp1-data1-v1.xlsx
Figure 2—figure supplement 2

Growth curves of Salmonella wild-type (WT), panD mutant (ΔpanD) and the complemented strain (cpanD) in RPMI-1640 medium (B).
Data are presented as mean ± SD, n=4 independent experiments.
-
Figure 2—figure supplement 2—source data 1
The numerical source data corresponds to Figure 2—figure supplement 2.
- https://cdn.elifesciences.org/articles/103714/elife-103714-fig2-figsupp2-data1-v1.xlsx
Figure 2—figure supplement 3

Fold intracellular replication (20 hr vs. 2 hr) of Salmonella enterica serovar Typhi Ty2 wild-type (WT), the panD mutant (ΔpanD) in human THP-1 monocyte-like cell line (ATCC TIB-22).
Data are presented as mean ± SD, n=4 independent experiments. Statistical significance was assessed using a two-sided Student’s t-test. ns, not Significant.
-
Figure 2—figure supplement 3—source data 1
The numerical source data corresponds to Figure 2—figure supplement 3.
- https://cdn.elifesciences.org/articles/103714/elife-103714-fig2-figsupp3-data1-v1.xlsx
Figure 3
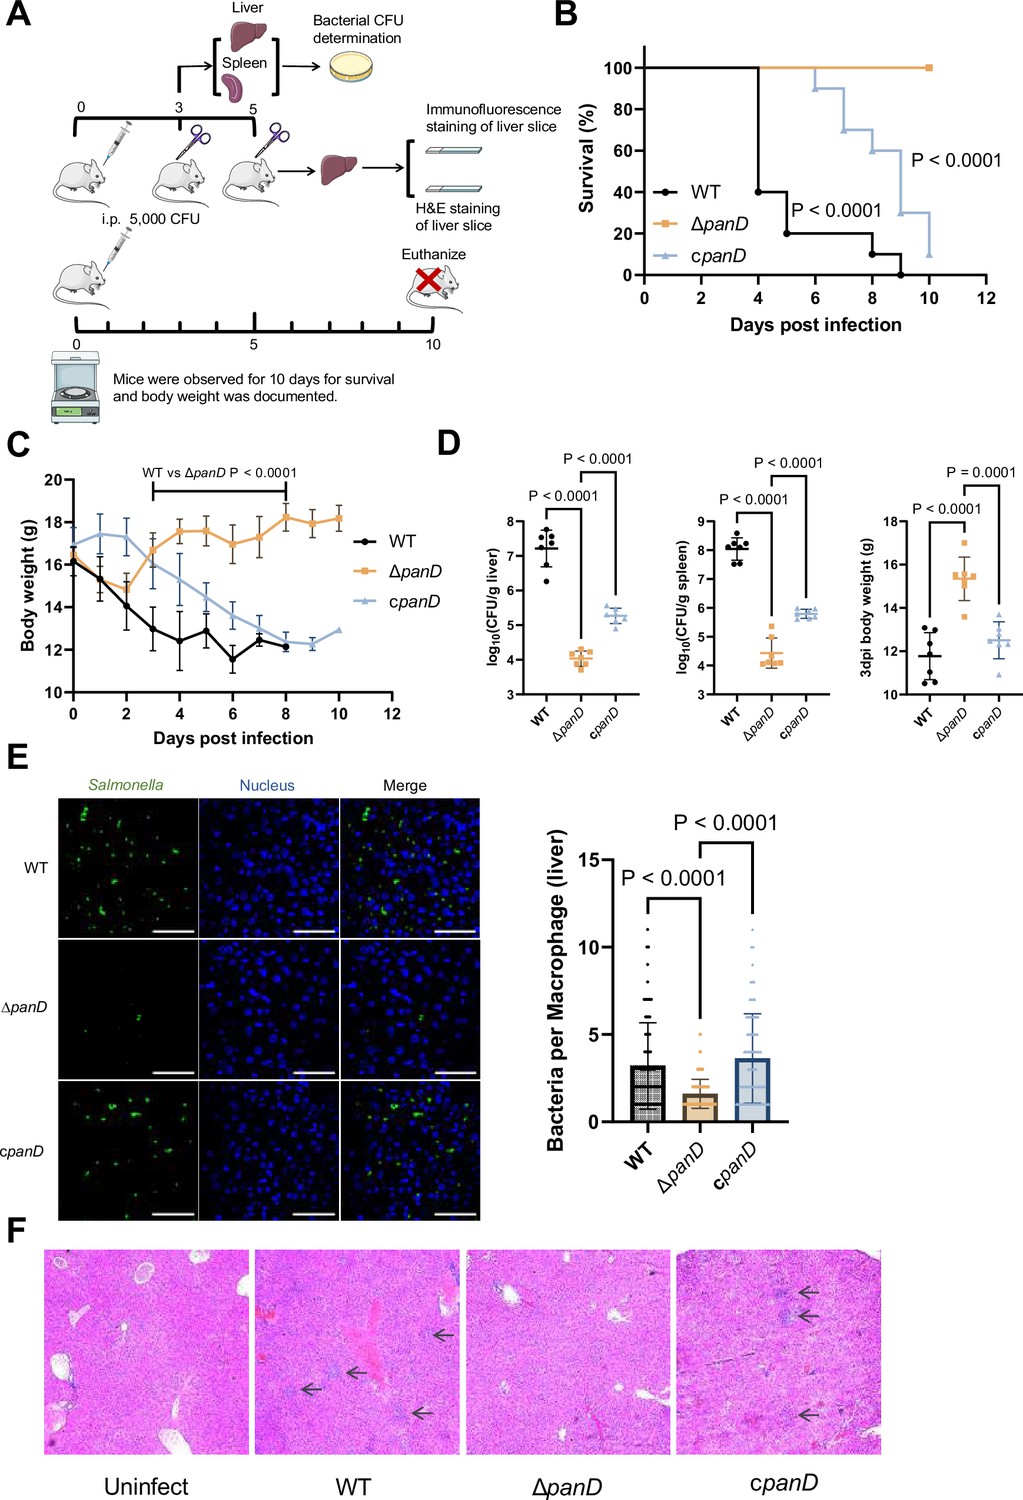
De novo β-alanine synthesis is critical for systemic Salmonella infection in mice.
(A) Schematic illustration of the mouse infection assays. Picture materials were used from bioicons (https://bioicons.com/). (B, C) Survival curves (B) and body weight dynamics (C) of mice infected i.p. with Salmonella wild-type (WT), ΔpanD, or cpanD. n=10 randomly assigned mice per group. (D) Liver and spleen bacterial burdens and body weights of mice infected with Salmonella WT, ΔpanD, or cpanD on day 3 post-infection. n=7 randomly assigned mice per group. (E) Representative immunofluorescence images and intracellular bacterial counts of Salmonella WT, ΔpanD, and cpanD in mouse liver at 5 d post-infection (green, Salmonella; blue, nuclei; scale bars, 50 µm). Images are representative of three independent experiments. The number of intracellular bacteria per infected cell was estimated in random fields, with n=80 cells per group from three independent experiments. (F) Representative H&E-stained liver sections from mice that were left uninfected or infected with Salmonella WT, ΔpanD, or cpanD on day 5 post-infection. Arrows indicate severe inflammatory cell infiltration in the mouse liver. Images are representative of three independent experiments. The data are presented as the mean ± SD (B–E). Statistical significance was assessed using the log-rank Mantel–Cox test (B), two-sided Student’s t-test (C), or one-way ANOVA (D, E).
-
Figure 3—source data 1
The numerical source data corresponds to Figure 3.
- https://cdn.elifesciences.org/articles/103714/elife-103714-fig3-data1-v1.xlsx
Figure 4 with 3 supplements
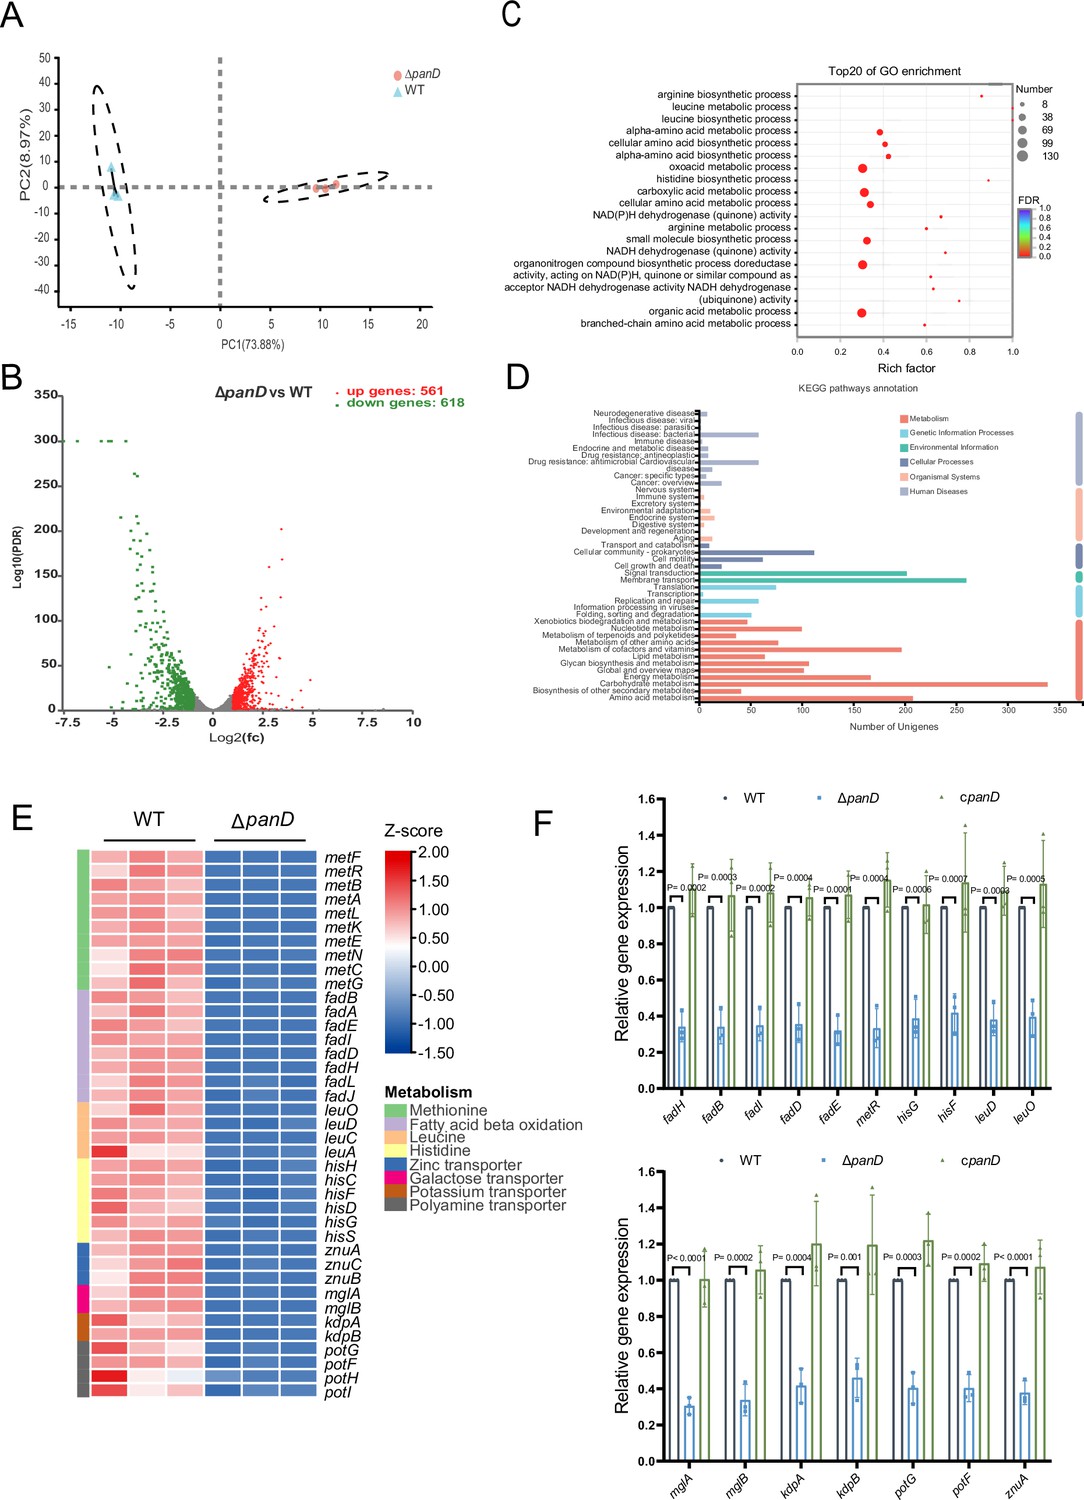
β-Alanine is involved in the regulation of several metabolic pathways in Salmonella.
(A) Principal component analysis (PCA) score plots of transcriptomic profiles of Salmonella wild-type (WT) and ΔpanD (n=3 biologically independent samples). (B) Volcano plot of the differentially expressed genes (DEGs) in Salmonella WT versus ΔpanD. The upper right section (red dots) indicates the upregulated DEGs, and the upper left section (green dots) indicates the downregulated DEGs. (C) Gene Ontology (GO) enrichment analysis of DEGs. Bubble chart showing the top 20 enriched Gene Ontology (GO) terms. (D) Kyoto Encyclopedia of Genes and Genomes (KEGG) pathway enrichment analysis of DEGs. (E) Expression of the downregulated pathways (activated by PanD) is shown in the Z score-transformed heatmap, with red representing higher abundance and blue representing lower abundance. (F) Quantitative real-time PCR (qRT‒PCR) analysis of the mRNA levels of 16 selected downregulated DEGs in Salmonella WT, ΔpanD, and cpanD. The data are presented as the mean ± SD, n=3 independent experiments. Statistical significance was assessed using two-way ANOVA.
-
Figure 4—source data 1
The numerical source data corresponds to Figure 4.
- https://cdn.elifesciences.org/articles/103714/elife-103714-fig4-data1-v1.xlsx
Figure 4—figure supplement 1
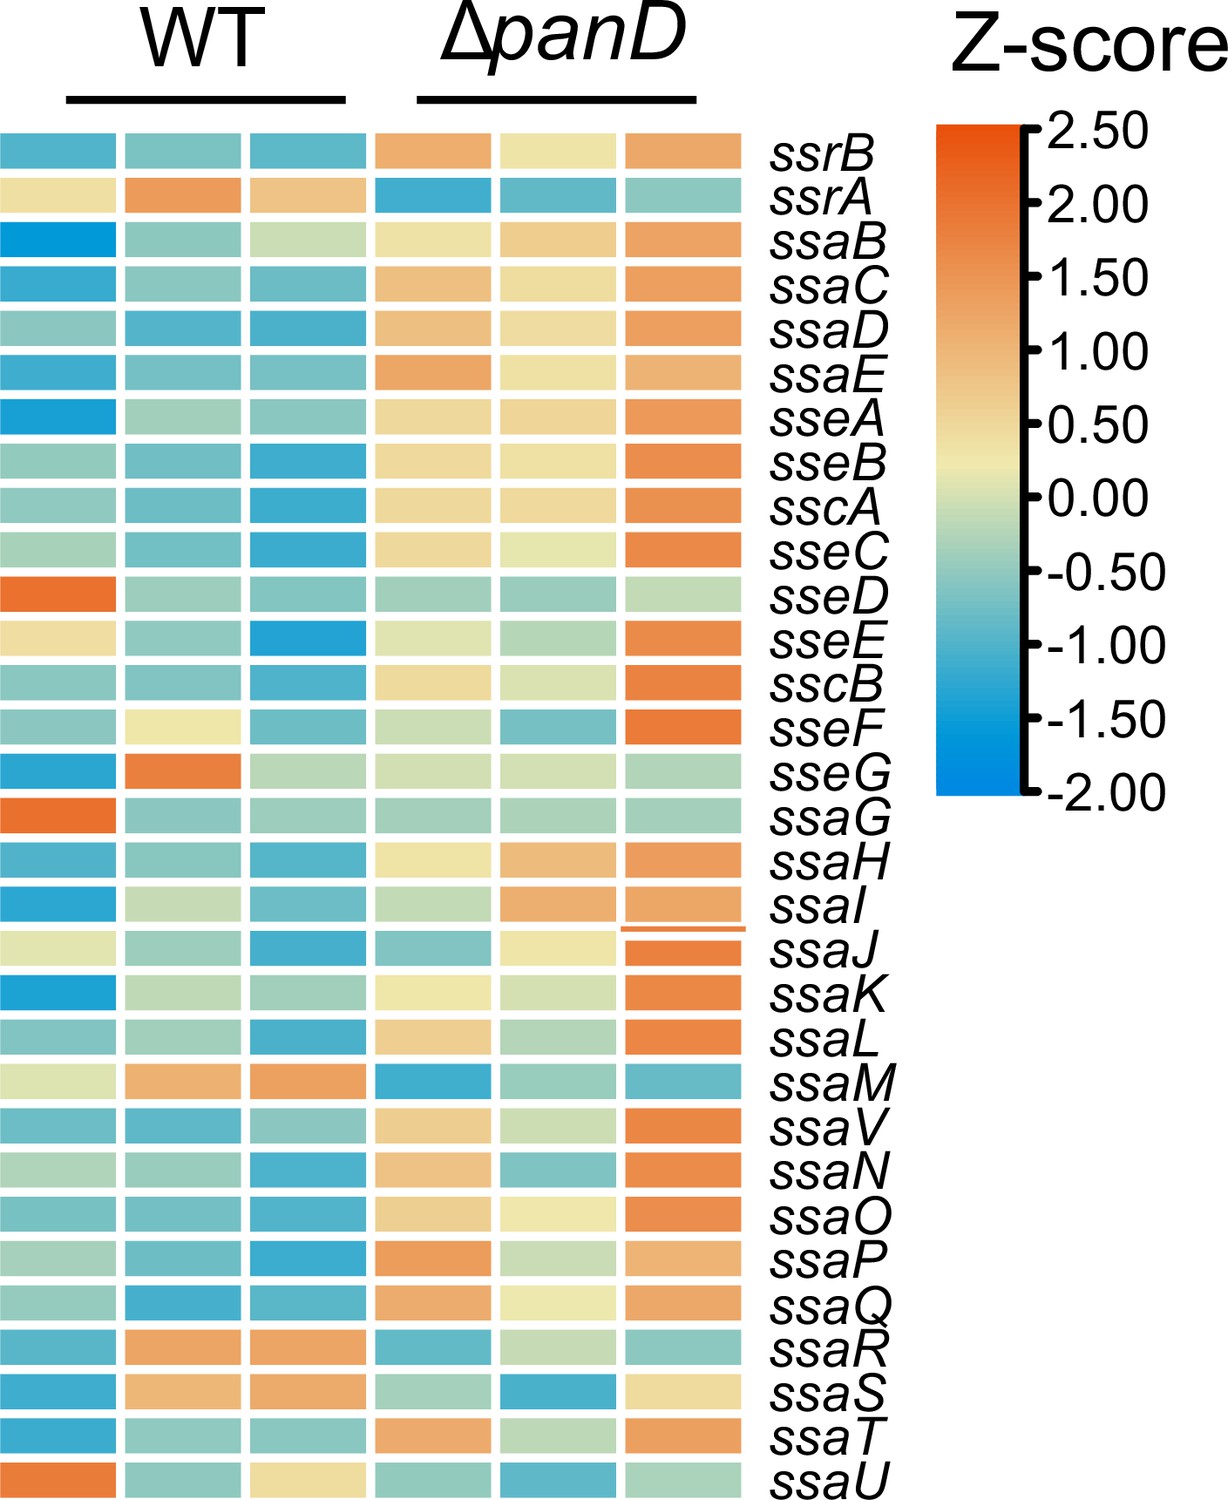
Expression of SPI-2 is shown in the Z-score transformed heatmap, with orange representing higher and blue representing lower abundance.
-
Figure 4—figure supplement 1—source data 1
The numerical source data corresponds to Figure 4—figure supplement 1.
- https://cdn.elifesciences.org/articles/103714/elife-103714-fig4-figsupp1-data1-v1.xlsx
Figure 4—figure supplement 2
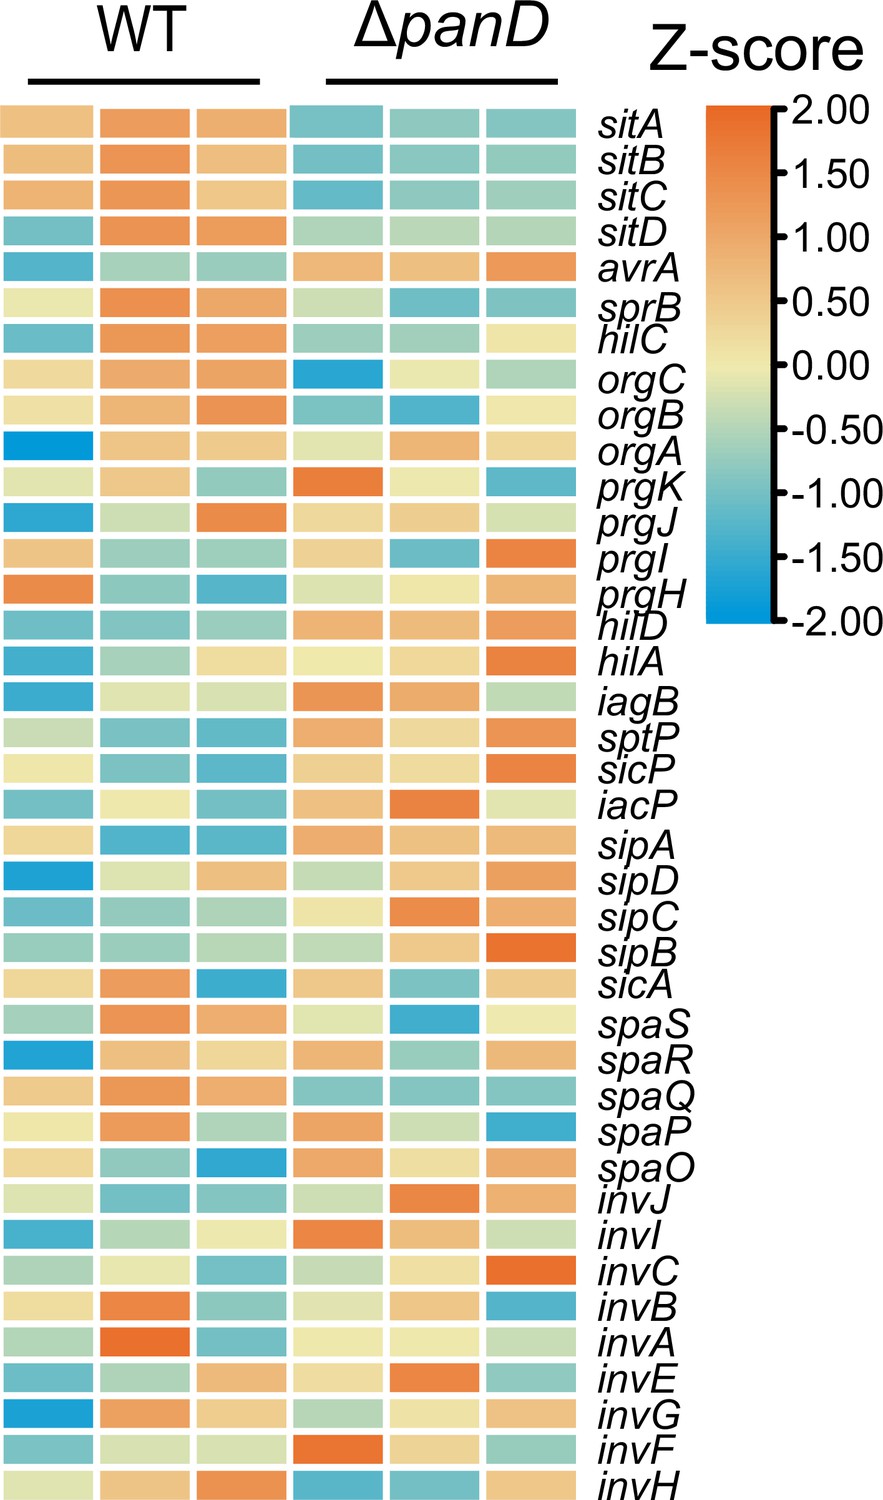
Expression of SPI-1 is shown in the Z-score transformed heatmap, with orange representing higher and blue representing lower abundance.
-
Figure 4—figure supplement 2—source data 1
The numerical source data corresponds to Figure 4—figure supplement 2.
- https://cdn.elifesciences.org/articles/103714/elife-103714-fig4-figsupp2-data1-v1.xlsx
Figure 4—figure supplement 3

Expression of SPI-3, SPI-4, and SPI-5 genes is shown in the Z-score transformed heatmap, with orange representing higher and blue representing lower abundance.
-
Figure 4—figure supplement 3—source data 1
The numerical source data corresponds to Figure 4—figure supplement 3.
- https://cdn.elifesciences.org/articles/103714/elife-103714-fig4-figsupp3-data1-v1.xlsx
Figure 5
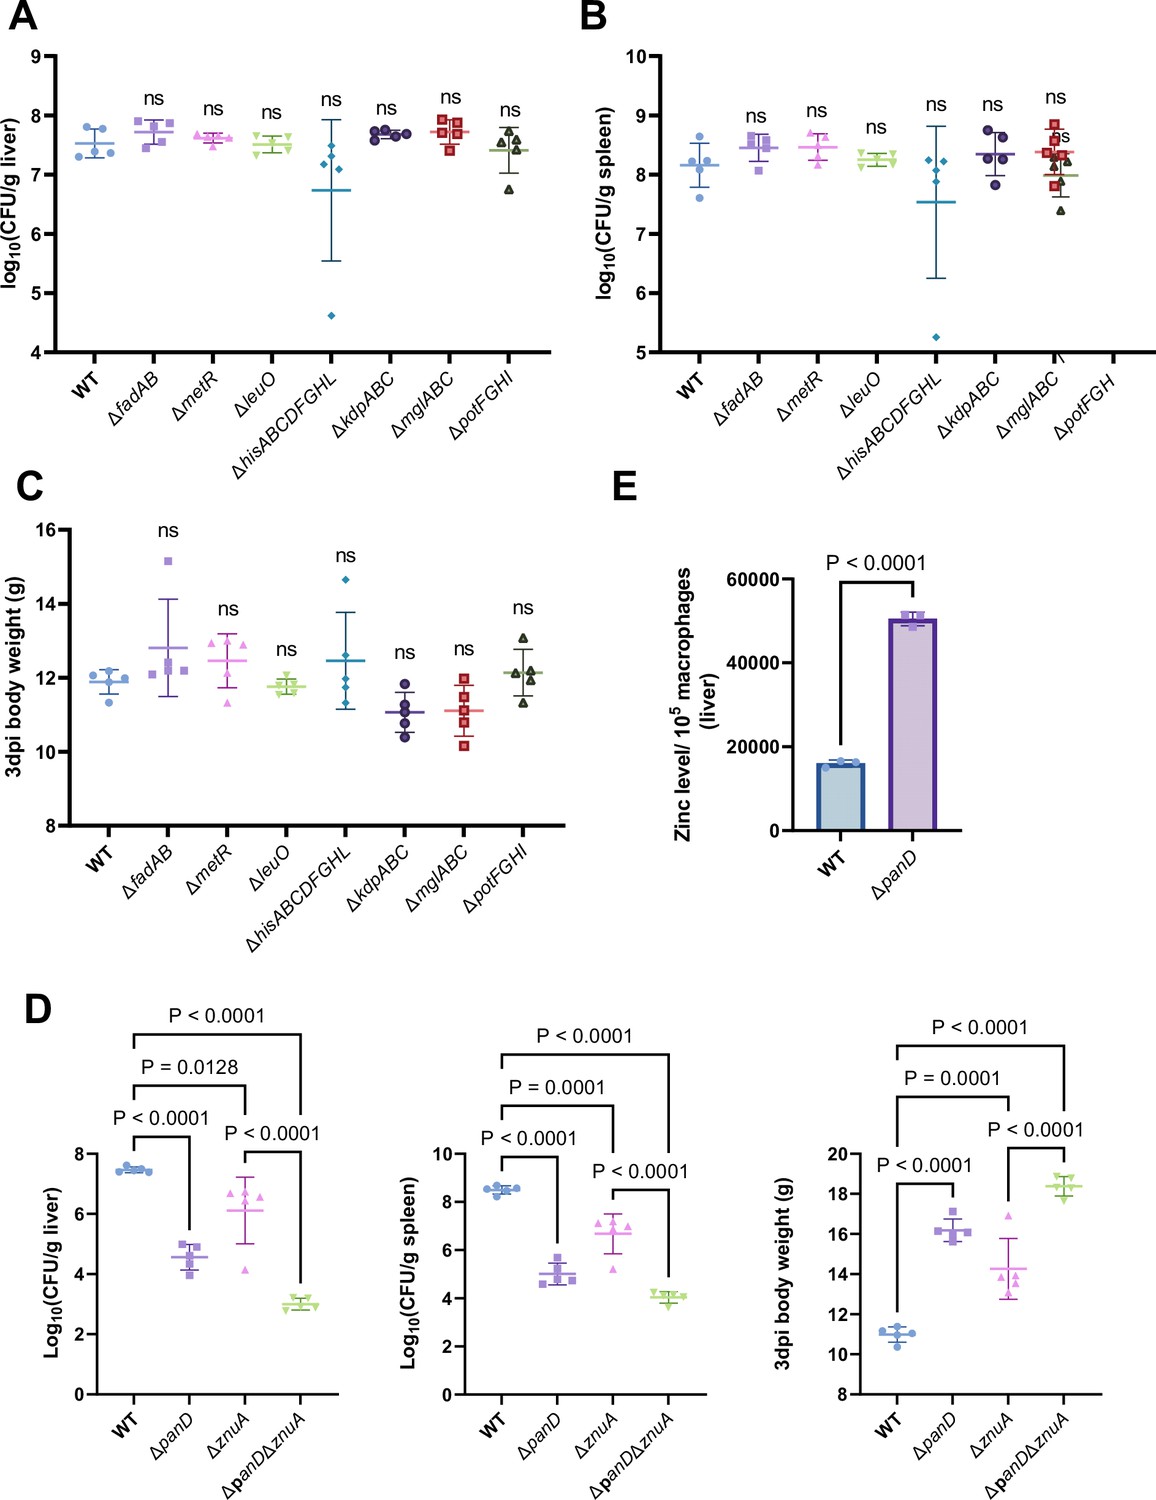
β-alanine promotes Salmonella virulence in vivo partially by increasing the expression of zinc transporter genes.
(A, B, C) Liver (A) and spleen (B) bacterial burdens and body weight (C) of mice infected with Salmonella wild-type (WT), ΔfadAB, ΔmetR, ΔhisABCDFGHL, ΔkdpABC, ΔmglABC, ΔpotFGHI, or ΔleuO on day 3 post-infection. n=5 mice per group. (D) Liver and spleen bacterial burdens and body weights of mice infected with Salmonella WT, ΔpanD, ΔznuA or ΔpanDΔznuA on day 3 post-infection. n=5 mice per group. (E) The zinc levels in the livers of mice infected with either Salmonella WT or ΔpanD for 3 d, n=5 mice per group. The data are presented as the mean ± SD (A–E). Statistical significance was assessed using one-way ANOVA (A-D), two-sided Student’s t-test (E). ns, not Significant.
-
Figure 5—source data 1
The numerical source data corresponds to Figure 5.
- https://cdn.elifesciences.org/articles/103714/elife-103714-fig5-data1-v1.xlsx
Figure 6
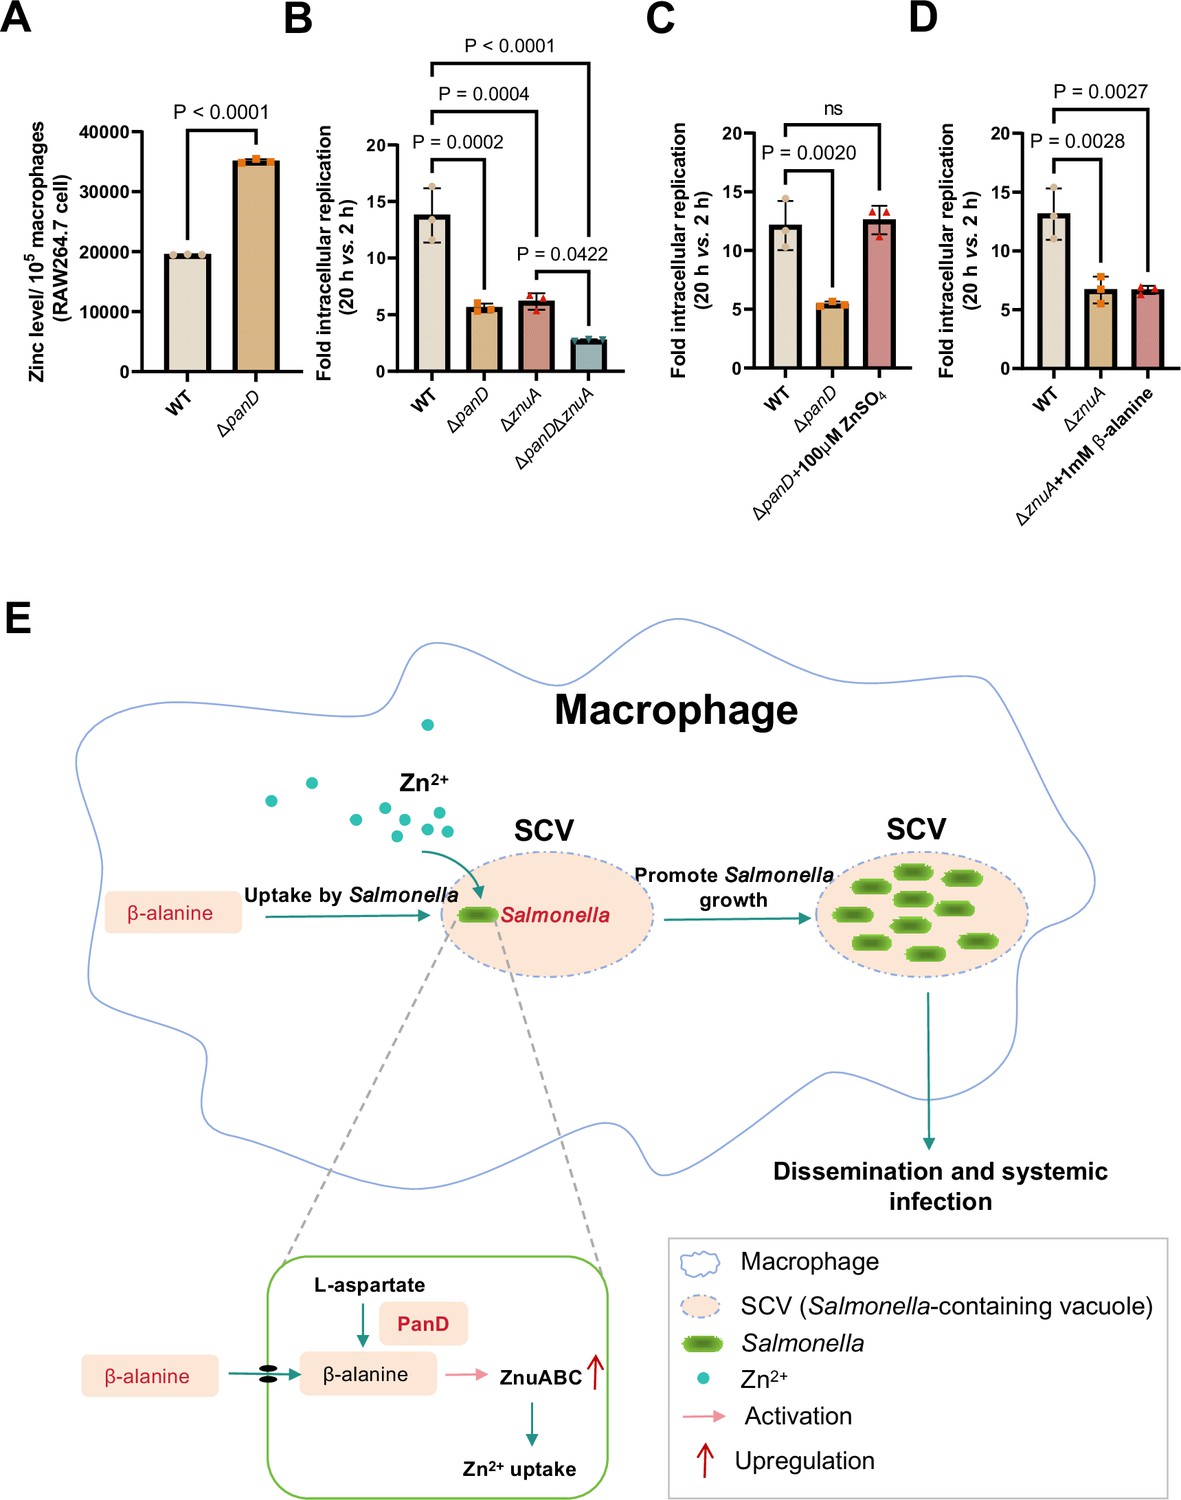
β-alanine promotes Salmonella replication within macrophages partially by increasing the expression of zinc transporter genes.
(A) The zinc levels in RAW264.7 cells after infection with Salmonella wild-type (WT) or ΔpanD for 8 hr. (B) Replication of Salmonella WT, ΔpanD, ΔznuA, and ΔpanDΔznuA in RAW264.7 cells. (C) Replication of Salmonella WT and ΔpanD in RAW264.7 cells in the presence or absence of 100 μM ZnSO4. (D) Replication of Salmonella WT and ΔznuA in RAW264.7 cells in the presence or absence of 1 mM β-alanine. The data are presented as the mean ± SD, n=3 independent experiments (A–D). Statistical significance was assessed using a two-sided Student’s t-test (A), one-way ANOVA (B-D). ns, not Significant. (E) Schematic model of β-alanine-mediated Salmonella replication inside macrophages. In macrophages, Salmonella acquires β-alanine both via the uptake of β-alanine from host macrophages and the de novo synthesis of β-alanine. β-alanine promotes the expression of zinc transporter genes ZnuABC, which facilitate the uptake of zinc by intracellular Salmonella, therefore, promote Salmonella replication in macrophages and subsequent systemic infection.
-
Figure 6—source data 1
The numerical source data corresponds to Figure 6.
- https://cdn.elifesciences.org/articles/103714/elife-103714-fig6-data1-v1.xlsx
Author response image 1

Tables
Key resources table
| Reagent type (species) or resource | Designation | Source or reference | Identifiers | Additional information |
|---|---|---|---|---|
| Biological sample (M. musculus) | BALB/c mice | Beijing Vital River Laboratory Animal Technology | Cat# 213 | 6-wk-old female |
| Cell line (M. musculus) | RAW264.7 | ATCC | Cat# TIB-71; RRID:CVCL_0493 | mouse macrophage-like cell line |
| Antibody | FITC-conjugated anti-Salmonella antibody (Rabbit polyclonal) | Abcam | Cat# ab20320; RRID:AB_445509 | IF (1:100) |
| Antibody | anti-CD86 antibody (Rat monoclonal) | Abcam | Cat# ab119857; RRID:AB_10902800 | Flow Cyt (1:100) |
| Antibody | anti-CD163 antibody (Rabbit monoclonal) | Abcam | Cat# ab182422; RRID:AB_2753196 | Flow Cyt (1:100) |
| Antibody | goat anti-rat IgG H&L (Alexa Fluor 488) antibody | Abcam | Cat# ab150165; RRID:AB_2650997 | Flow Cyt (1:100) |
| Antibody | donkey anti-rabbit IgG H&L (Alexa Fluor 647) antibody | Abcam | Cat# ab150075; RRID:AB_2752244 | Flow Cyt (1:100) |
| Chemical compound, drug | β-alanine | Solarbio | Cat# A9770 | N/A |
| Commercial assay or kit | EASYspinPlus bacterial RNA rapid extraction kit | Aidlab | Cat# RN0802 | N/A |
| Commercial assay or kit | 2×RealStar Power SYBR qPCR Mix | Genstar | Cat# A304 | N/A |
| Commercial assay or kit | StarScript III RT Kit | Genstar | Cat# A232 | N/A |
| Commercial assay or kit | ROS fluorescence probe (BBoxiProbe O06) | Bestbio | Cat# BB-46051 | N/A |
| Commercial assay or kit | RNS fluorescence probe (BBoxiProbe O52) | Bestbio | Cat# BB-470567 | N/A |
| Commercial assay or kit | gentleMACS/Mouse Liver Dissociation Kit | Miltenyi Biotec | Cat# 130-105-807 | N/A |
| Commercial assay or kit | Zinc fluorescence probe (Zinquin ethyl ester) | MKBio | Cat# MX4516 | N/A |
| Commercial assay or kit | Hematoxylin-Eosin(HE) staining kit | Sangon Biotech | Cat# E607318 | N/A |
| Software, algorithm | GraphPad Prism 9.5.1 | GraphPad | RRID:SCR_002798 | http://www.graphpad.com/ |
| Software, algorithm | Bowtie 2 | Bowtie | RRID:SCR_016368 | https://bowtie-bio.sourceforge.net/bowtie2/index.shtml |
| Software, algorithm | Xcalibur 4.0 | Thermo Fisher | RRID:SCR_014593 | https://www.thermofisher.cn/order/catalog/product/OPTON-30965?SID=srch-srp-OPTON-30965 |
| Software, algorithm | ZEN 2.3 ((blue edition)) | Carl Zeiss | RRID:SCR_013672 | https://www.zeiss.com/microscopy/en/products/software/zeiss-zen.html |
| Software, algorithm | Image J | National Institutes of Health | RRID:SCR_003070 | https://imagej.nih.gov/ij/ |
| Other | DAPI stain | Invitrogen | Cat# 21490 | N/A |
Additional files
-
Supplementary file 1
Strains and plasmids used in this study.
- https://cdn.elifesciences.org/articles/103714/elife-103714-supp1-v1.docx
-
Supplementary file 2
Primers involved in this study.
- https://cdn.elifesciences.org/articles/103714/elife-103714-supp2-v1.docx
-
MDAR checklist
- https://cdn.elifesciences.org/articles/103714/elife-103714-mdarchecklist1-v1.docx
Download links
A two-part list of links to download the article, or parts of the article, in various formats.
Downloads (link to download the article as PDF)
Open citations (links to open the citations from this article in various online reference manager services)
Cite this article (links to download the citations from this article in formats compatible with various reference manager tools)
Salmonella exploits host- and bacterial-derived β-alanine for replication inside host macrophages
eLife 13:RP103714.
https://doi.org/10.7554/eLife.103714.4


