Female-germline specific protein Sakura interacts with Otu and is crucial for germline stem cell renewal and differentiation and oogenesis
- Department of Cell Biology Johns Hopkins University School of Medicine, United States
Figures
Figure 1 with 1 supplement

Sakura expression pattern and mutant allele.
(A) Schematic illustration of Drosophila ovary and germarium. Drosophila female has a pair of ovaries, each consisting of 12–16 ovarioles (cyan). The germarium (outlined with magenta) is located at the anterior tip of the ovarioles and consists of both germ cells and somatic cells. Germ cells include germline stem cells (GSCs), cystoblasts, cysts, and differentiating oocytes. Somatic cells include terminal filament (TF) cells, cap cells (CCc), escort cells (ECs), and follicle cells (FCs). GSCs and cystoblasts have spherical, unbranched spectrosomes, whereas cysts possess branched fusomes. The distinct regions of the germarium—1, 2 a, 2b, and 3—are indicated. (B) Drosophila Sakura protein (Sakura/CG14545) and its null mutant allele were generated in this study. (C) Western blot of dissected fly tissues. (D) Western blot of ovary lysates. (E) Confocal images of the germarium from the sakura-EGFP transgenic fly. Sakura-EGFP (green), Hts (red), and DAPI (blue). Scale bar: 10 μm. (F) Confocal images of the egg chambers from the sakura-EGFP transgenic fly. Sakura-EGFP (green), Vasa (red), and DAPI (blue). Sakura-EGFP is expressed in nurse cells and enriched in the developing oocyte (yellow arrow). Scale bar: 20 μm.
-
Figure 1—source data 1
Original uncropped gel blot images used in Figure 1C and D, indicating the relevant bands.
- https://cdn.elifesciences.org/articles/103828/elife-103828-fig1-data1-v1.pdf
-
Figure 1—source data 2
Original uncropped, unedited gel blot image files used in Figure 1C and D.
- https://cdn.elifesciences.org/articles/103828/elife-103828-fig1-data2-v1.zip
Figure 1—figure supplement 1

sakura mRNA expression pattern.
Data obtained from http://flybase.org/reports/FBgn0040602.htm.
Figure 2 with 1 supplement
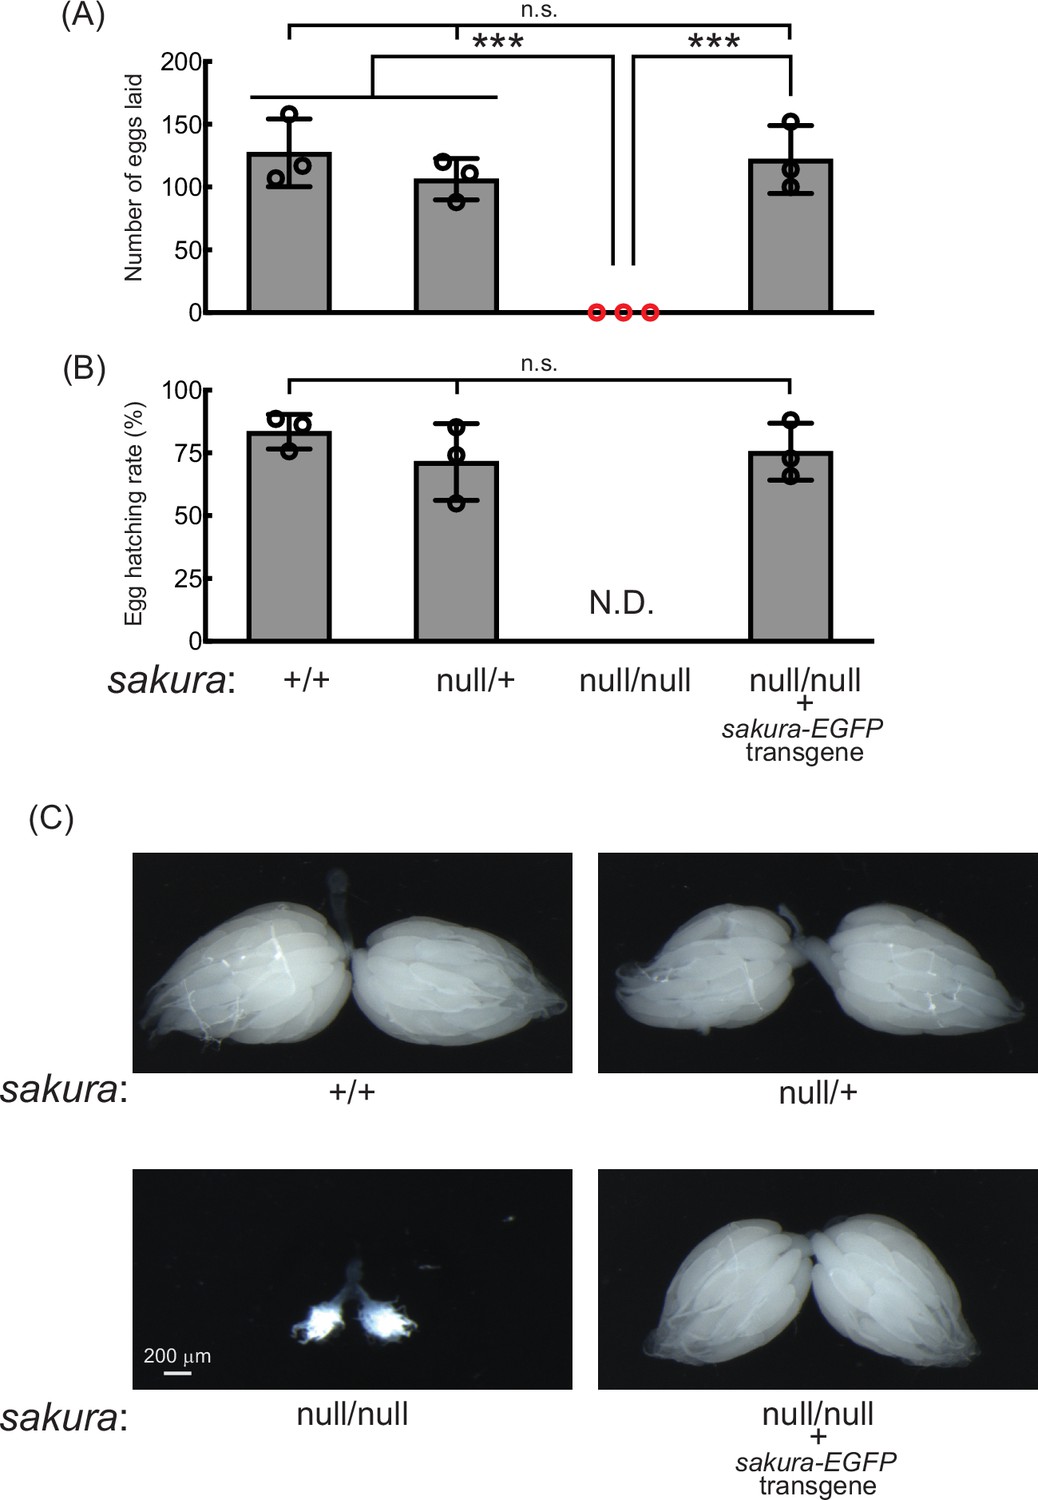
sakura mutant flies are female-sterile and have rudimentary ovaries.
(A–B) Female fertility assays. (A) The number of eggs laid by test females crossed with OregonR wild-type males and (B) hatching rates of the eggs. Mean ± SD (n = 3). P-value < 0.001 (Student’s t-test, unpaired, two-tailed) is indicated by ***. (C) Stereomicroscope images of dissected whole ovaries. Scale bar: 200 μm.
Figure 2—figure supplement 1

Male fertility assay.
The numbers of the progeny flies obtained from crosses between test males and wild-type (OregonR) virgin females are shown. Mean ± SD (n=5).
Figure 3 with 2 supplements
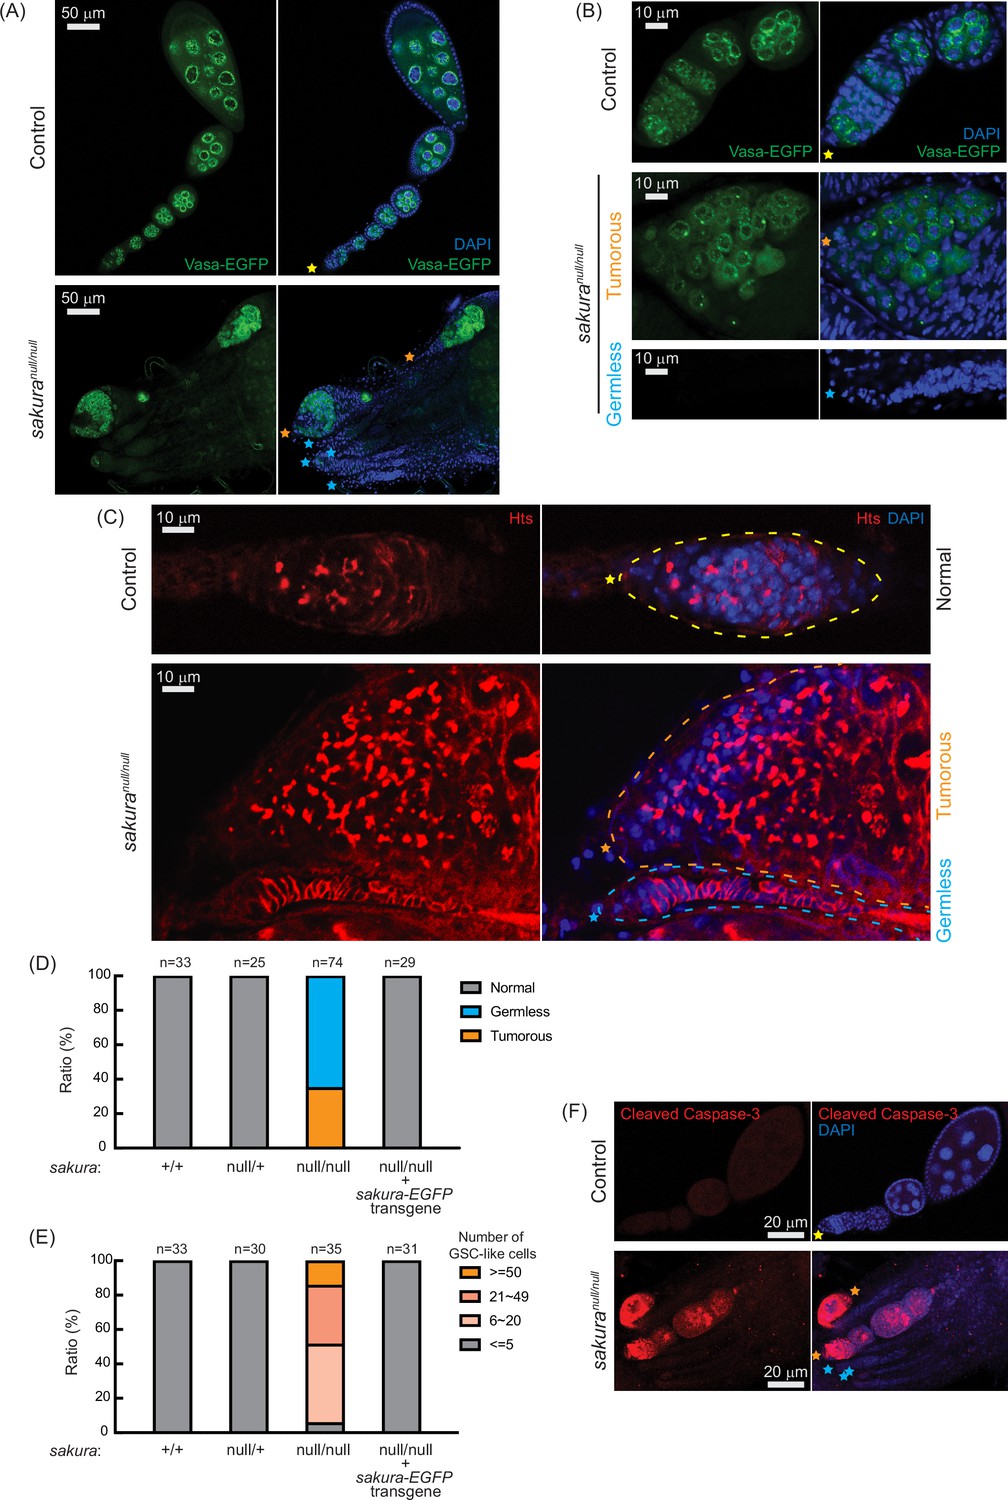
sakuranull ovaries are germless and tumorous.
(A, B) Confocal images of the ovaries from control (sakuranull/+) and sakuranull/null expressing Vasa-EGFP. Vasa-EGFP (green) and DAPI (blue). Yellow stars indicate the anterior tip of normal ovarioles, while orange and cyan stars indicate the anterior tips of tumorous and germless ovarioles, respectively, in Figure 3. Higher-magnification images of the germarium regions are shown in (B). Scale bars: 50 μm for (A) and 10 μm for (B). (C) Confocal images of control (sakuranull/+) and sakuranull/null ovaries stained with anti-Hts antibody to label spectrosomes and fusomes. Hts (red) and DAPI (blue). Yellow, orange, and cyan dotted lines mark the normal, tumorous, and germless germaria, respectively. Scale bars: 10 μm. (D) Ratio (%) of normal, germless, and tumorous ovarioles of indicated genotypes (ages 2–5 days; n=33, 25, 74, 29, respectively). (E) Quantification of germline stem cell (GSC)-like cell number per germarium in the indicated genotypes (ages 2–5 days; n=33, 30, 35, and 31 respectively). (F) Confocal images of control (sakuranull/+) and sakuranull/null ovaries stained with anti-cleaved Caspase-3 antibody. Cleaved caspase-3 (red) and DAPI (blue). Scale bars: 20 μm.
Figure 3—figure supplement 1

sakuranull ovaries are tumorous.
Violin plots of germline stem cell (GSC)-like cell numbers in germaria of indicated genotypes of 2–5-days-old flies. Mean ± SD and the biological replicate number n are also shown. P-value < 0.001 (Student’s t-test, unpaired, two-tailed) is indicated by ***.
Figure 3—figure supplement 2
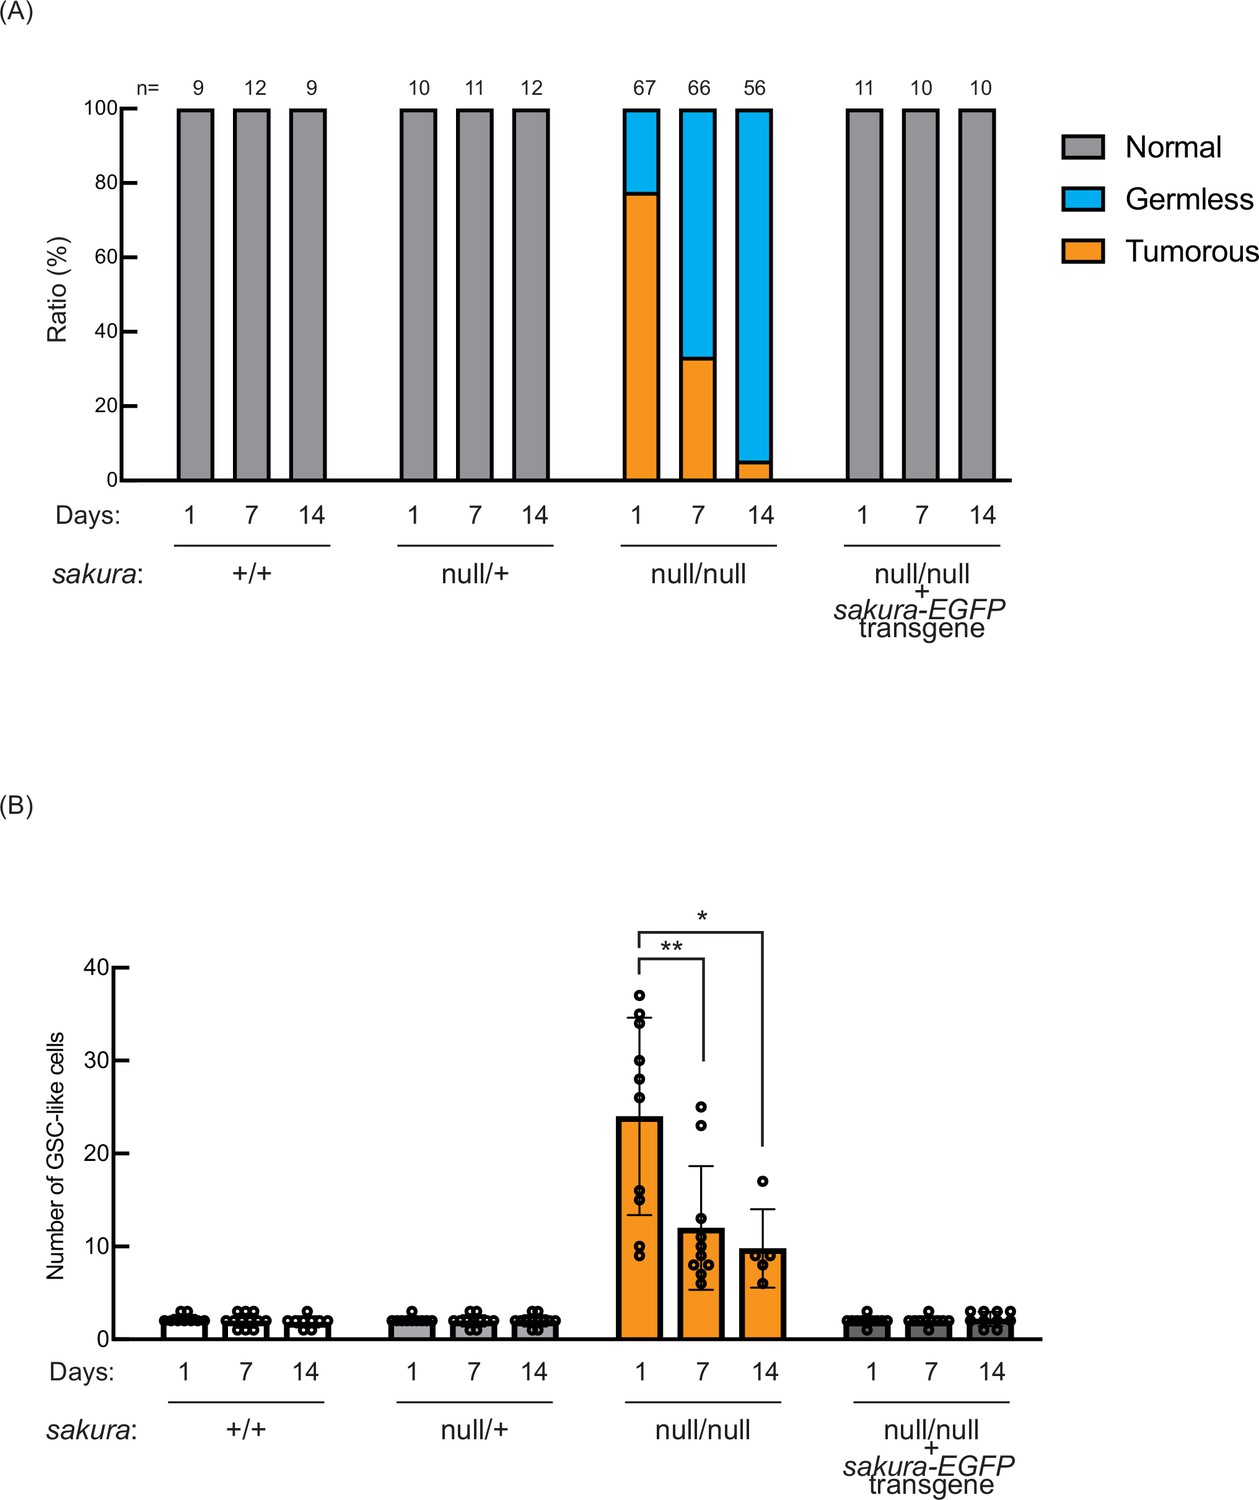
The ratio of germless ovarioles increases over time in sakuranull ovaries.
(A) Ratio (%) of normal, germless, and tumorous ovarioles of the indicated genotypes at 0–1 days, 7 days, and 14 days post-eclosion. (B) Quantification of germline stem cell (GSC)-like cell numbers in ovarioles of the indicated genotypes at 0–1 days, 7 days, and 14 days post-eclosion (Mean ± SD). Germless ovarioles were excluded from this analysis.
Figure 4 with 1 supplement
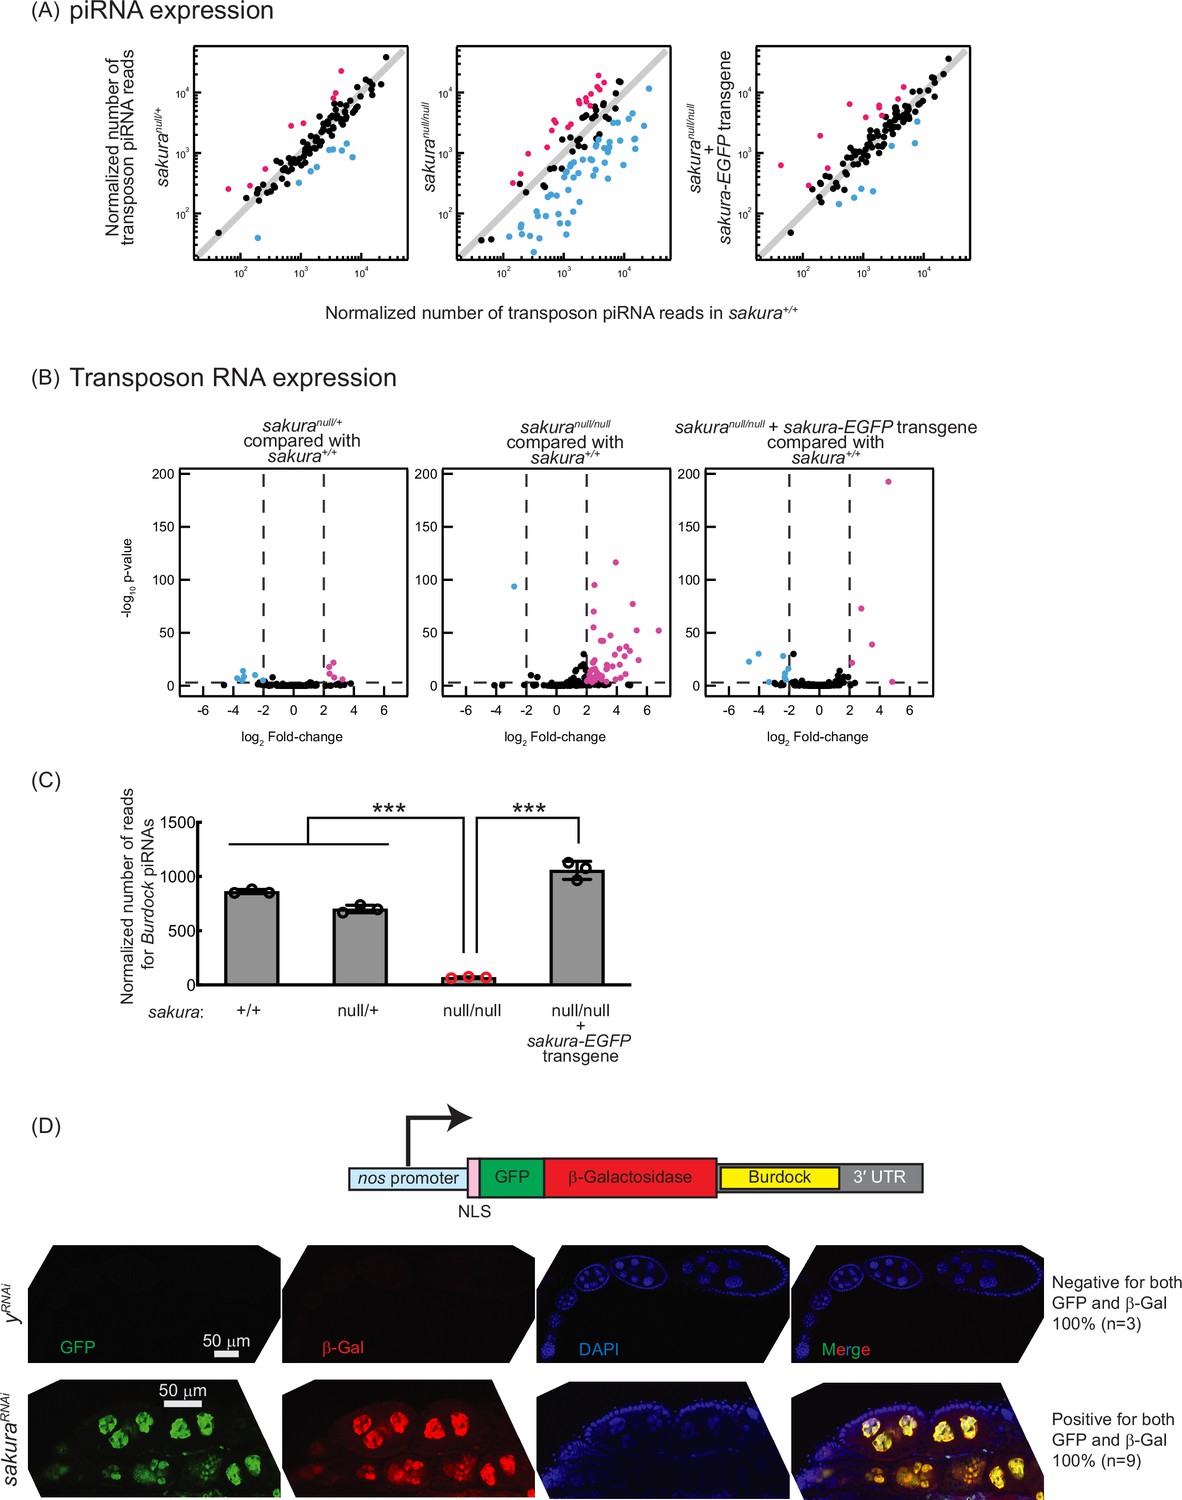
Loss of sakura results in lower piwi-interacting RNA (piRNA) levels and loss of piRNA-mediated transposon silencing.
(A) Scatter plots of normalized number of transposon piRNA reads from small RNA-seq of indicated genotypes compared with sakura+/+. Means of three biological replicates are plotted. Downregulated (fold-change <0.5) and upregulated (fold-change >2) transposon piRNAs are shown in cyan and magenta, respectively. (B) Volcano plots of transposon RNAs from RNA-seq of indicated genotypes compared with sakura+/+. Three biological replicates per genotype were analyzed. Downregulated (adjusted p-value < 0.001 and log2(fold-change) < –2) and upregulated (adjusted p-value < 0.001 and log2(fold-change) >2) transposons are shown in cyan and magenta, respectively. (C) Normalized number of reads for Burdock piRNAs from small RNA-seq. Mean ± SD (n = 3). P-value < 0.001 (Student’s t-test, unpaired, two-tailed) is indicated by ***. (D) The Burdock sensor harbors a nanos promoter, a nuclear localization signal (NLS) appended to GFP and β-gal coding sequences, and a target sequence for Burdock piRNAs in the 3’UTR. Confocal images of ovaries from control (yRNAi) and sakuraRNAi flies harboring the Burdock sensor, where RNAi knockdown was specifically driven in the female germline with UAS-Dcr2 and NGT-Gal4. GFP (green), β-gal (red), and DAPI (blue). Scale bars: 50 μm. Three out of three tested control samples were negative for both GFP and β-gal, while 9 out of 9 tested sakuraRNAi samples were positive for both markers.
Figure 4—figure supplement 1
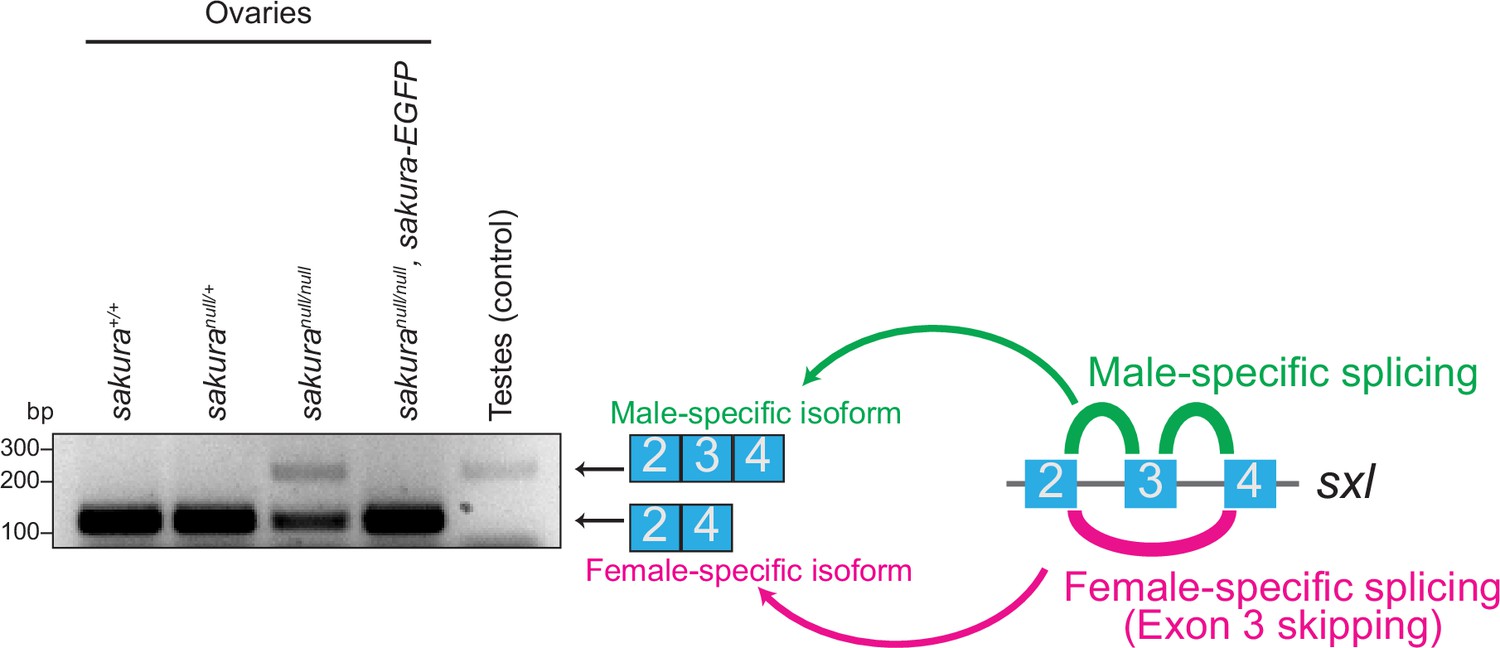
Sex-specific alternative splicing of sex-lethal (sxl) is dysregulated in sakuranull ovaries.
Sex-specific alternative splicing of sxl was analyzed by RT-PCR followed by agarose gel electrophoresis and SYBR Safe staining. Ovaries from controls and sakura-EGFP rescue flies showed the expected female-specific sxl isoform, while testes from control flies exhibited the male-specific isoform. sakuranull ovaries showed increased expression of the male-specific isoform and reduced levels of female-specific isoform.
-
Figure 4—figure supplement 1—source data 1
Original uncropped gel image used in Figure 4—figure supplement 1, indicating the relevant bands.
- https://cdn.elifesciences.org/articles/103828/elife-103828-fig4-figsupp1-data1-v1.zip
-
Figure 4—figure supplement 1—source data 2
Original uncropped, unedited gel image file used in Figure 4—figure supplement 1.
- https://cdn.elifesciences.org/articles/103828/elife-103828-fig4-figsupp1-data2-v1.zip
Figure 5 with 1 supplement
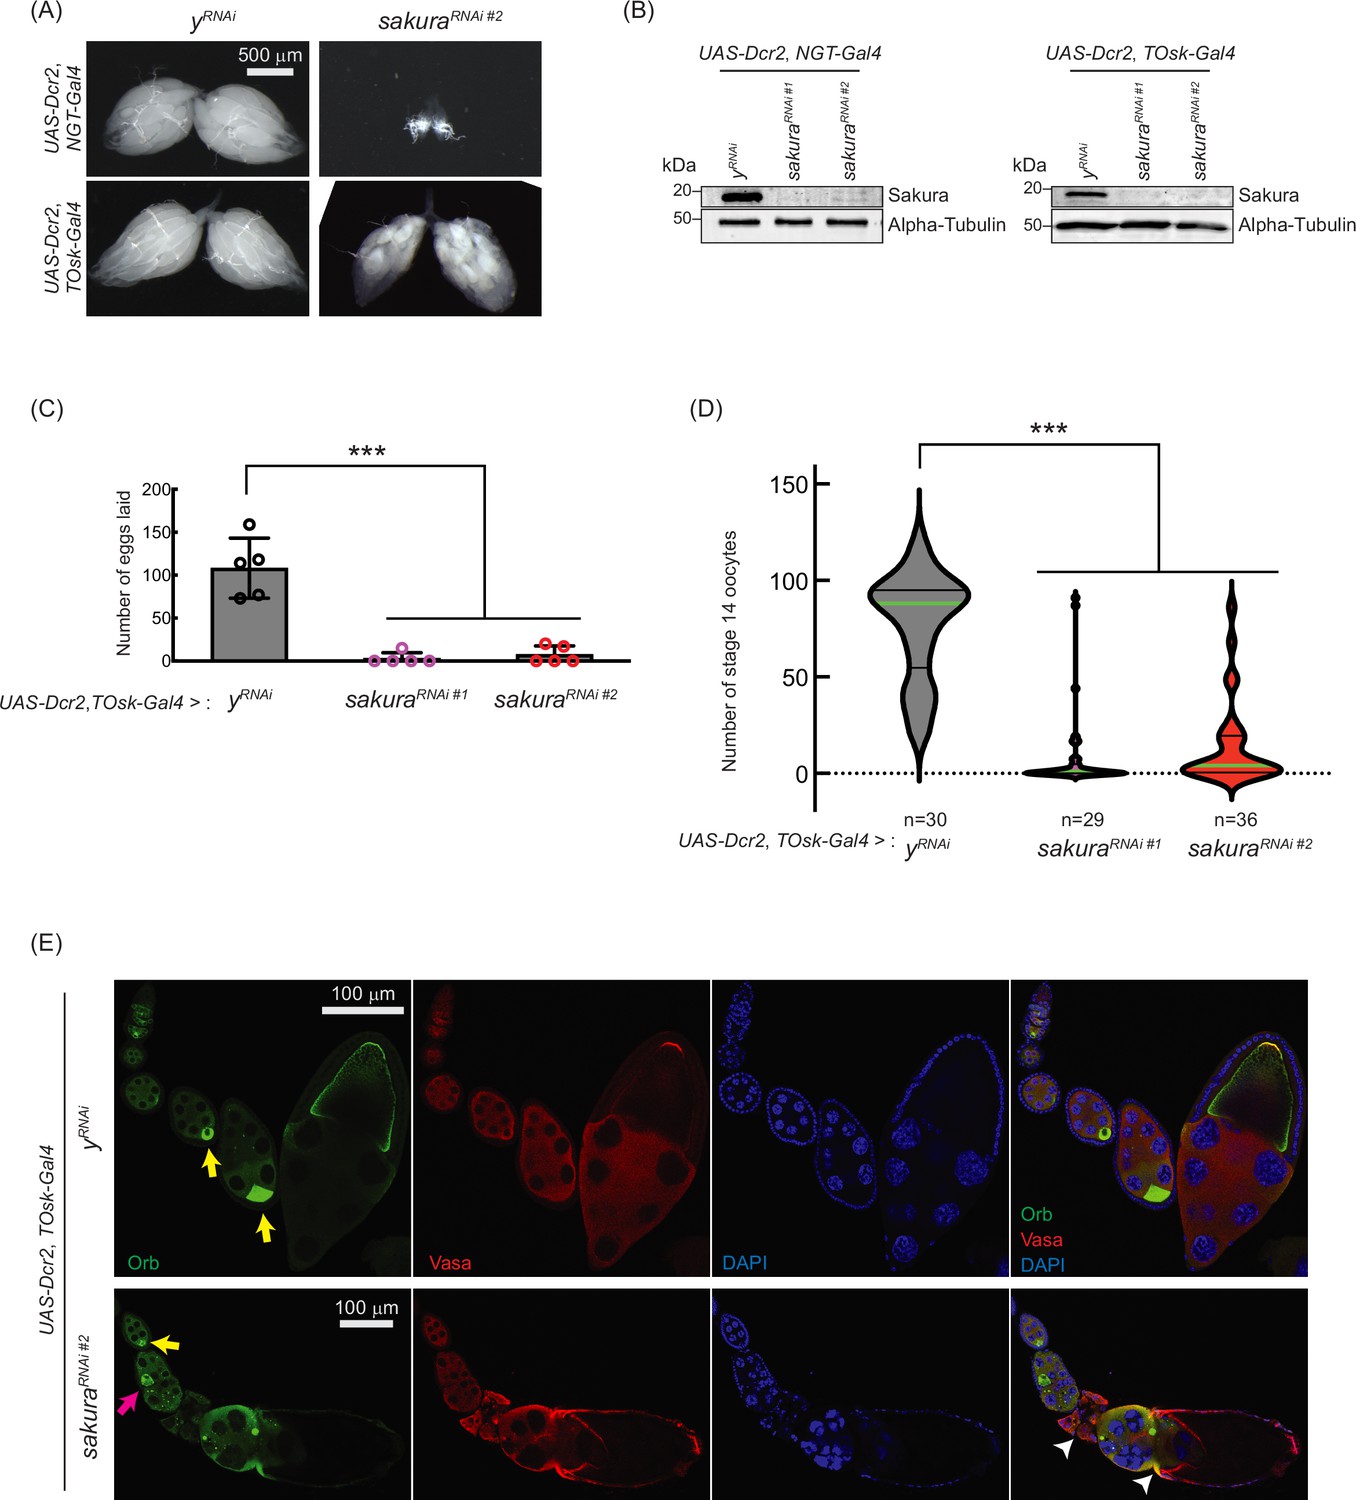
sakura is important for oogenesis in later-stage egg chambers.
(A) Stereomicroscope images of dissected whole ovaries. Scale bar: 500 μm. (B) Western blot of dissected ovary lysates. sakuraRNAi #1 and sakuraRNAi #2 are two independent RNAi lines. (C) Number of eggs laid by sakura RNAi knockdown driven by UAS-Dcr2 and TOsk-Gal4. Mean ± SD (n = 5). P-value < 0.001 (Student’s t-test, unpaired, two-tailed) is indicated by ***. (D) Number of stage 14 oocytes in ovaries of sakura RNAi knockdown flies driven by UAS-Dcr2 and TOsk-Gal4. The numbers of stage 14 oocytes per fly (per a pair of ovaries) are shown. n is the number of flies examined. P-value < 0.001 (Student’s t-test, unpaired, two-tailed) is indicated by ***. (E) Confocal images of the ovaries from sakura RNAi knockdown flies driven by UAS-Dcr2 and TOsk-Gal4, stained with anti-Oo18 RNA-binding protein (Orb) and anti-Vasa antibodies. Orb (green), Vasa (red), and DAPI (blue). Yellow arrows label the normal enrichment of Orb in the developing oocytes. Magenta arrow labels mislocalized developing oocyte. White arrowheads label egg chambers with cytoskeletal disorganization. Scale bars: 100 μm. In A-E, y-RNAi was used as a control.
-
Figure 5—source data 1
Original uncropped gel blot images used in Figure 5B, indicating the relevant bands.
- https://cdn.elifesciences.org/articles/103828/elife-103828-fig5-data1-v1.pdf
-
Figure 5—source data 2
Original uncropped, unedited gel blot image files used in Figure 5B and D.
- https://cdn.elifesciences.org/articles/103828/elife-103828-fig5-data2-v1.zip
Figure 5—figure supplement 1
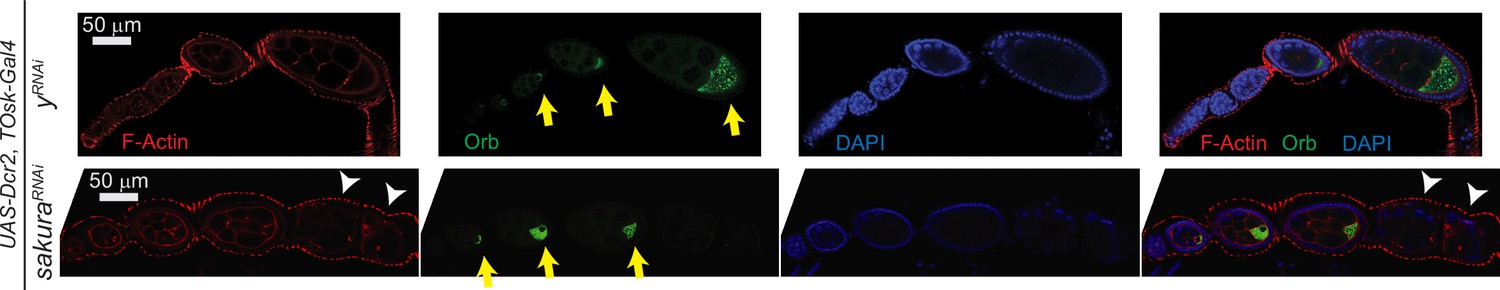
sakura is important for oogenesis in later-stage egg chambers.
Confocal images of ovaries from sakura RNAi knockdown flies (UAS-Dcr2, TOsk-Gal4 >sakura RNAi) stained with phalloidin (F-Actin) and anti-Oo18 RNA-binding protein (Orb) antibodies. F-Actin (red), Orb (green), and DAPI (blue). Yellow arrows indicate normal Orb enrichment at the posterior of developing oocytes. White arrowheads indicate egg chambers exhibiting cytoskeletal disorganization. Scale bars: 50 μm.
Figure 6 with 1 supplement

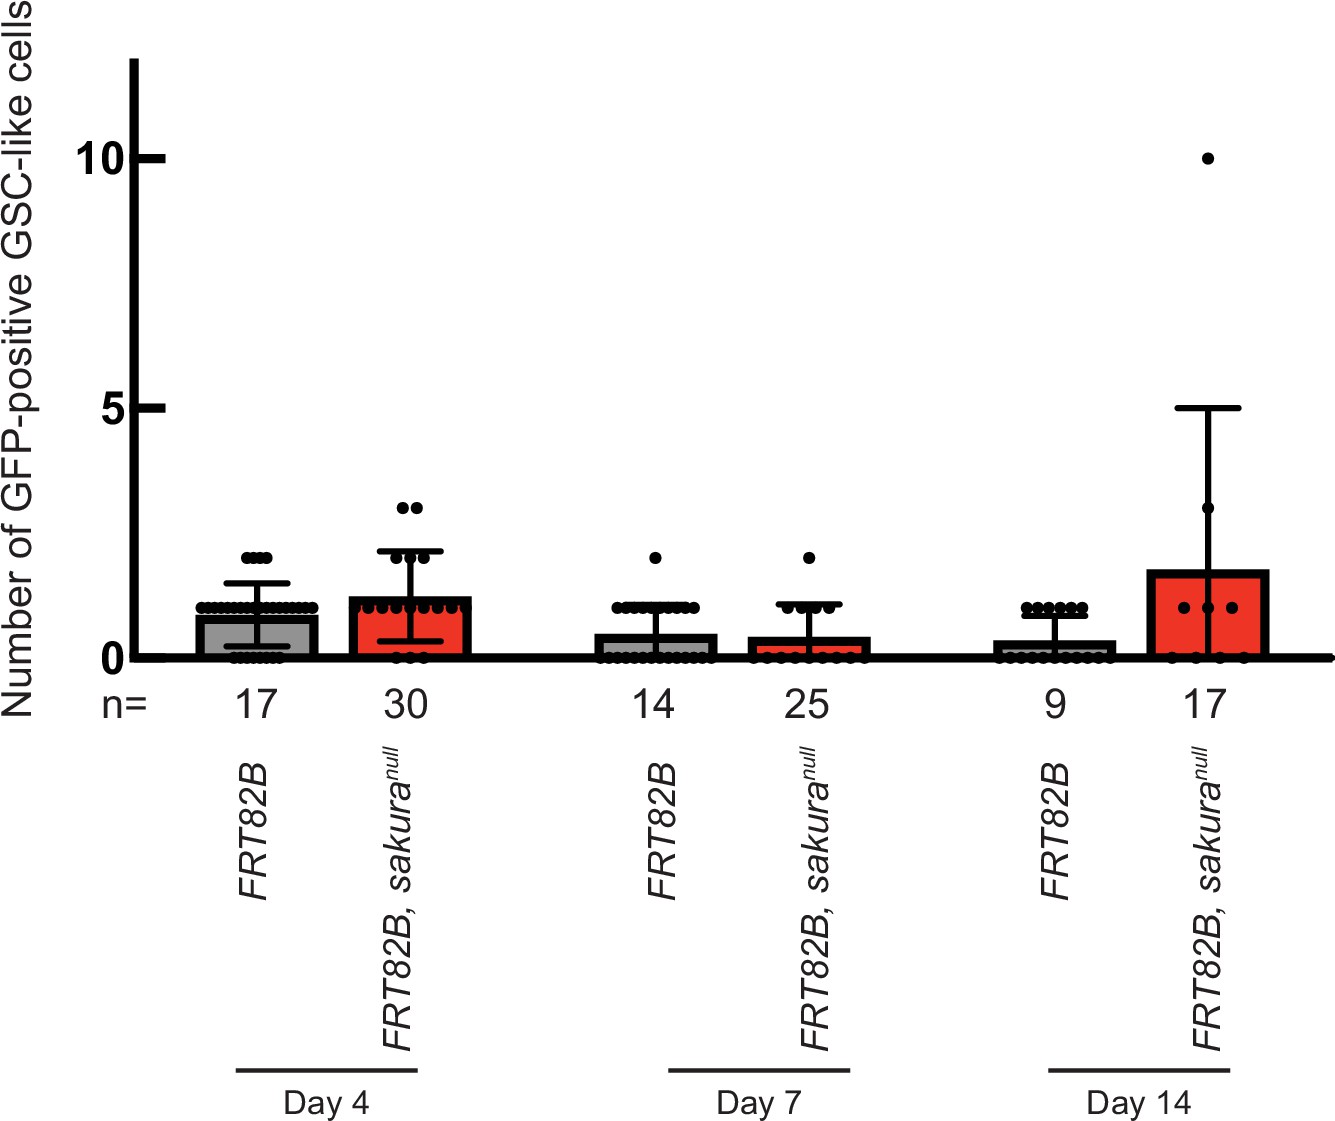
Germline clonal analysis of sakuranull.
(A) Percentage of germaria with marked germline stem cell (GSC) clones indicated by the absence of GFP at 4, 7, and 14 days after clone induction at the adult stage. Arrows indicate the percent decrease of marked GSC clones compared to day 4. The genotype, actual percentage, and total number of germaria examined are shown in the adjacent table. P-value < 0.01 (Chi-squared test) is indicated by **. (B) Confocal images of germ cell clones. sakuranull and control clones were marked by the absence of GFP. GFP (green), Hts (red), and DAPI (blue). Scale bars: 10 μm. (C) Number of marked (GFP-negative) GSC-like cells in germaria with marked GSCs of the indicated genotypes at 4, 7, and 14 days after clone induction. Mean ± SD. GSC-like cells containing round spectrosomes were identified through immunostaining with anti-Hts antibody. P-value < 0.05 and < 0.001 (Student’s t-test, unpaired, two-tailed) is indicated by * and ***, respectively.
Figure 6—figure supplement 1
sakuranull clone germline cells intrinsically cause tumorous phenotype.
Number of GFP-positive germline stem cell (GSC)-like cells in germaria with marked (GFP-negative) GSCs of the indicated genotypes at 4, 7, and 14 days after clone induction. Mean ± SD. GSC-like cells containing round spectrosomes were identified through immunostaining with anti-hu-li tai shao (Hts) antibody.
Figure 7 with 4 supplements
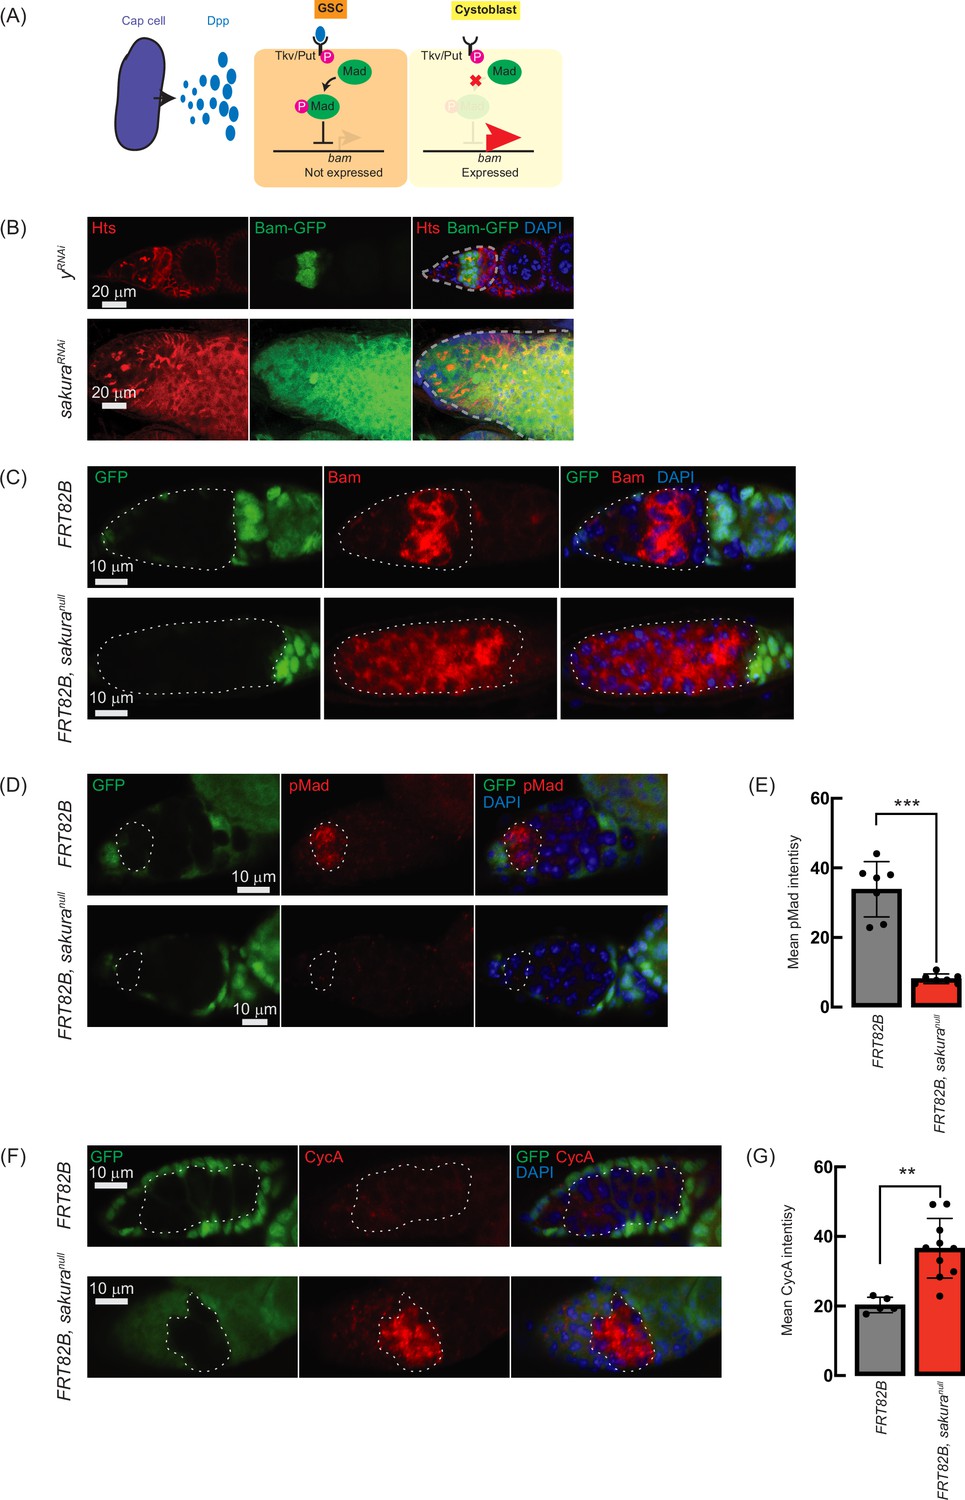
Loss of sakura inhibits Dpp/bone morphogenetic protein (BMP) signaling.
(A) Schematic illustration of bam expression regulation. Cap cells secrete diffusible Decapentaplegic (Dpp), which is received by its receptor, a heterodimer of Thick vein (Tkv) and Punt (Put), in germline stem cells (GSCs). The activated Dpp signaling eventually phosphorylates Mother-against-dpp (Mad). The phosphorylated Mad (pMad) represses the transcription of bag-of-marbles (bam). The repression of bam in GSCs is crucial for maintaining their stemness. Cystoblasts do not receive Dpp, and Bam expression is crucial for promoting cystoblast differentiation from GSCs. (B) Confocal images of ovaries from control (yRNAi) and sakuraRNAi flies harboring the bam-GFP reporter, where RNAi knockdown was specifically driven in the female germline with UAS-Dcr2 and NGT-Gal4. Bam-GFP (green), Hts (red), and DAPI (blue). Germarium are outline ad by dotted line. Scale bars: 20 μm. (C, D) Confocal images of germaria with germline clones of sakuranull stained with (C) anti-Bam antibody and (D) anti-pMad antibody. GFP (green), Bam or pMad (red), and DAPI (blue). Scale bars: 10 μm. (E) Mean pMad intensity in the germline clones of the indicated genotypes. Mean ± SD (n = 7). P-value < 0.001 (Student’s t-test, unpaired, two-tailed) is indicated by *** (F) Confocal images of germaria with germline clones of sakuranull stained with anti-CycA antibody. GFP (green), CycA (red), and DAPI (blue). Scale bars: 10 μm. (G) Mean CycA intensity in the germline clones of the indicated genotypes. Mean ± SD (n=5 and 10 for FRT82B and FRT82B, sakuranull, respectively). P-value < 0.01 (Student’s t-test, unpaired, two-tailed) is indicated by **. In C, D, and F, clones were marked with the absence of GFP.
Figure 7—figure supplement 1
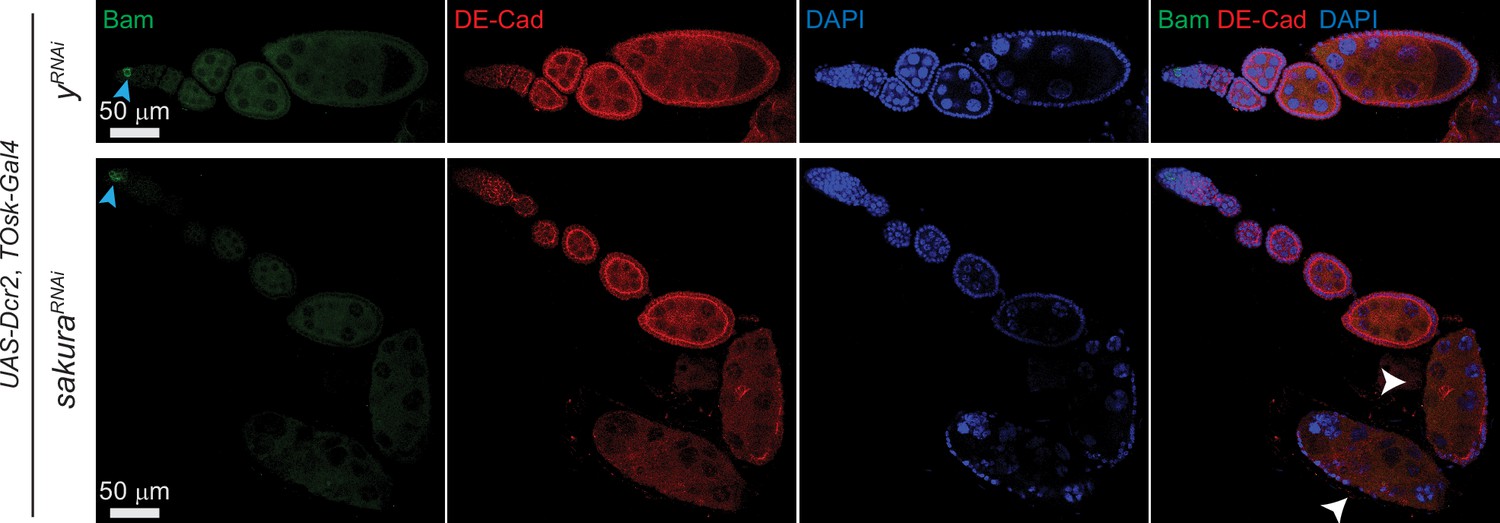
Bag-of-marbles (Bam) is not misexpressed in TOsk-Gal4 >sakuraRNAi egg chambers.
Confocal images of ovaries from sakura RNAi knockdown flies driven by UAS-Dcr2 and TOsk-Gal4, stained with anti-Bam and anti-DE-Cadherin (DE-Cad) antibodies. y-RNAi was used as a control. Bam (green), DE-Cad (red), and DAPI (blue). Cyan arrowheads indicate high Bam expression in 8 cell cysts within the germarium. White arrowheads indicate egg chambers with cytoskeletal disorganization. Scale bars: 50 μm.
Figure 7—figure supplement 2
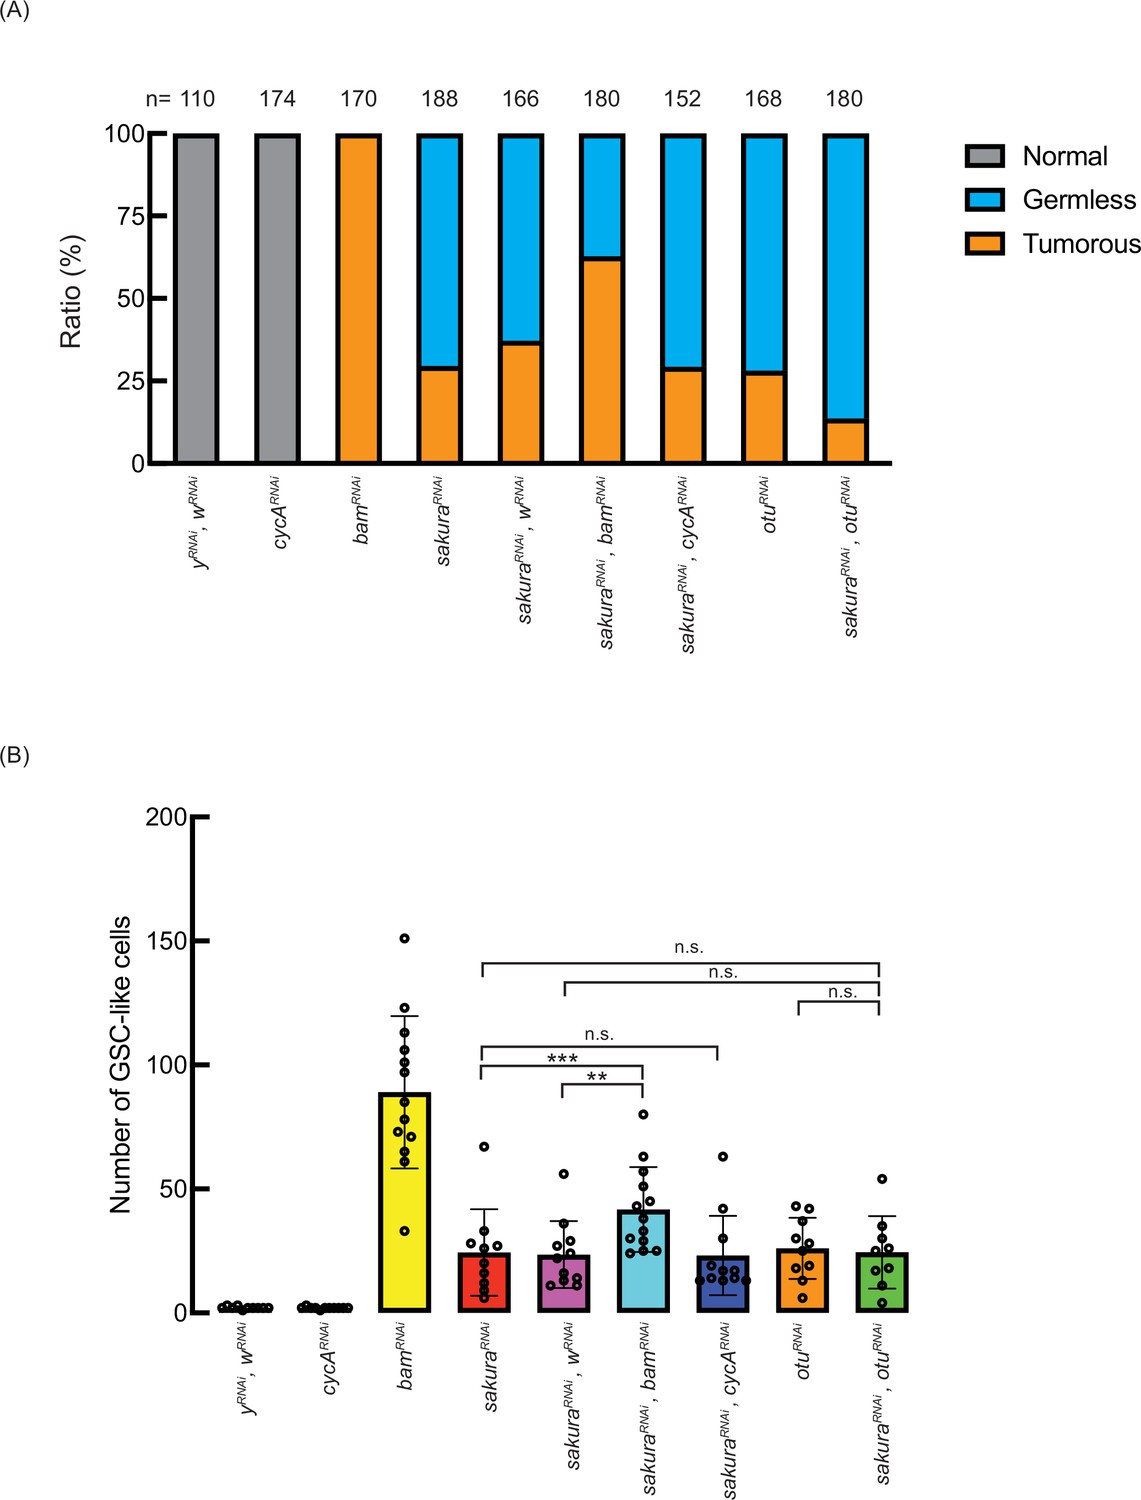
Ratio of germless and tumorous phenotypes from double RNAi knockdown of sakura with bag-of-marbles (bam), cyclin A (cycA), or ovarian tumor (otu).
(A) Ratio (%) of normal, germless, and tumorous ovarioles in double RNAi knockdown of sakura with bam, cycA, or otu. UAS-Dcr2 and NGT-Gal4 were used to drive RNAi knockdown in the germline. n is the total number of ovarioles examined for the indicated genotypes of 2–5 day-old flies. (B) Quantification of germline stem cell (GSC)-like cell number in germaria of indicated genotypes of 2–5 day-old flies. Mean ± SD. Germless ovarioles were excluded from this analysis.
Figure 7—figure supplement 3
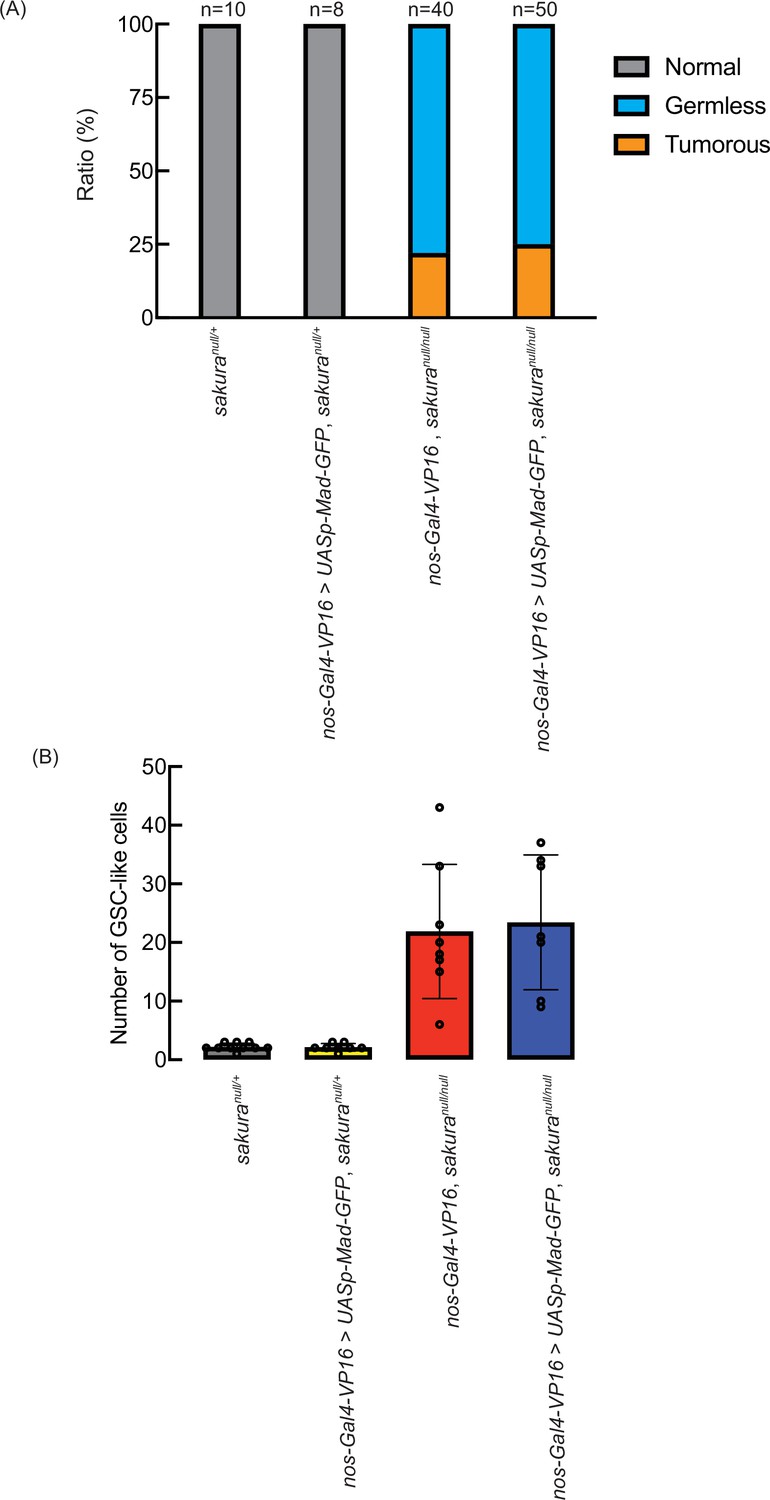
nos-Gal4-VP16>UASp-Mad-GFP did not rescue the sakuranull phenotypes.
(A) Ratio (%) of normal, germless, and tumorous ovarioles in the indicated genotypes of 2–5 day-old flies. n denotes the total number of ovarioles examined for each genotype. (B) Quantification of germline stem cell (GSC)-like cell number in germaria of the indicated genotypes from 2–5-day-old flies. Mean ± SD. Germless ovarioles were excluded from this analysis.
Figure 7—figure supplement 4
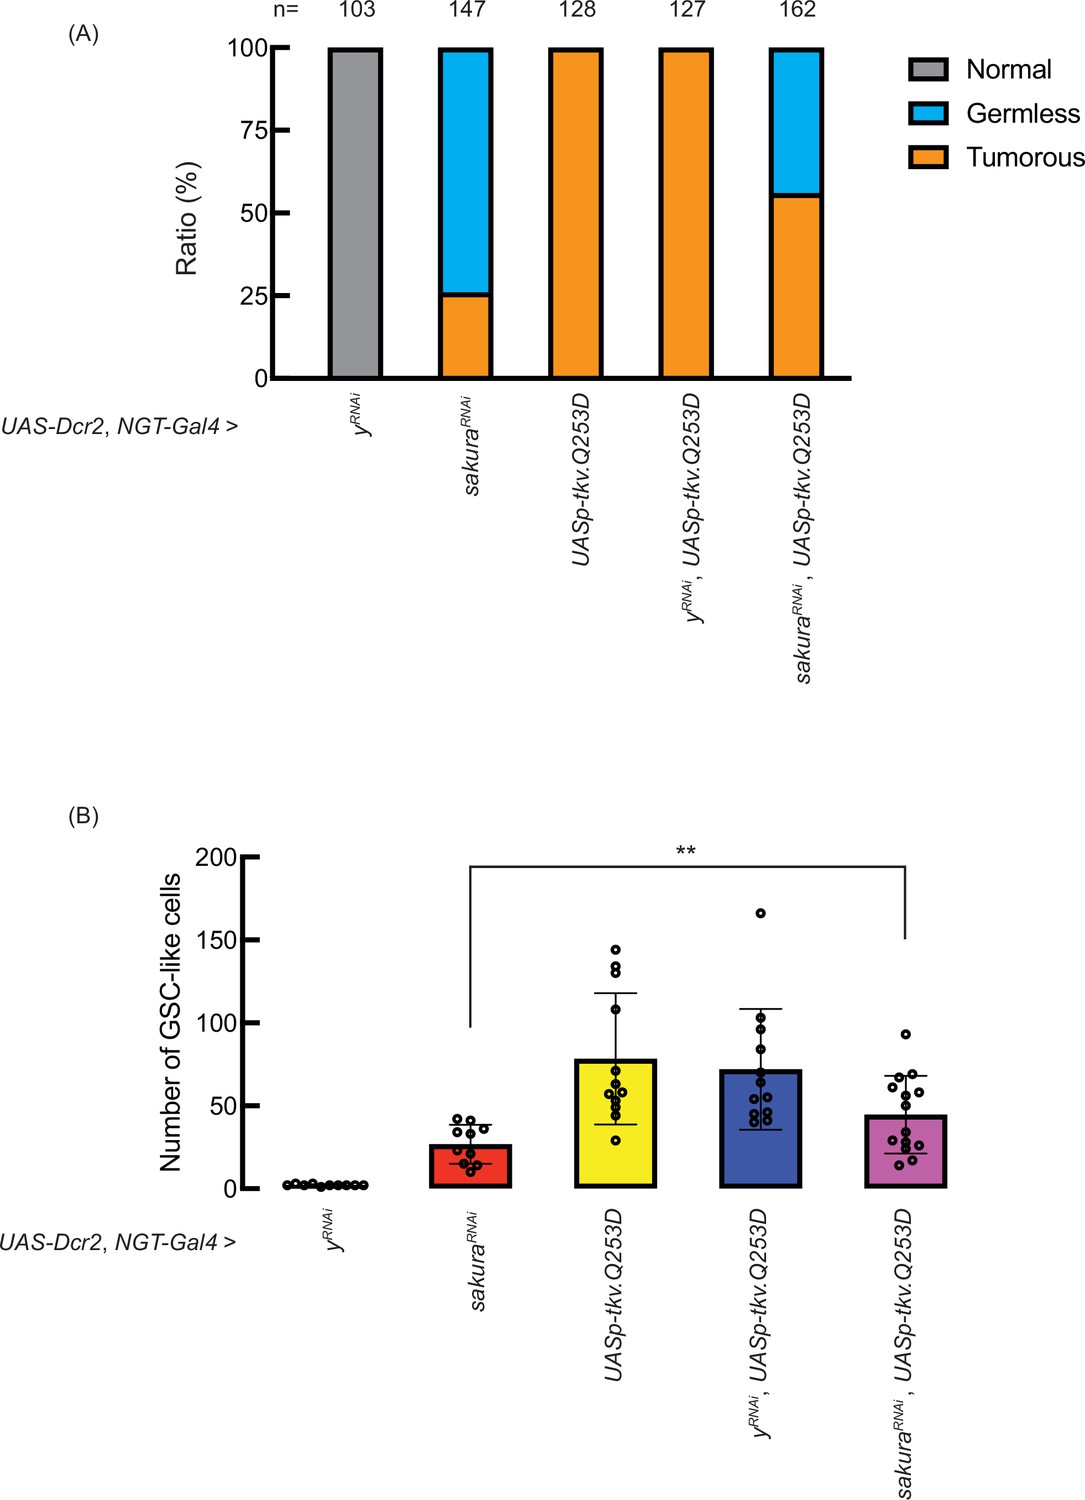
Ratio of germless and tumorous phenotypes in sakura RNAi knockdown and NGT-Gal4 >UASp tkv.
Q253D. (A) Ratio (%) of normal, germless, and tumorous ovarioles in the indicated genotypes of 2–5-day-old flies. RNAi knockdown and UASp-tkv.Q253D expression were driven with UAS-Dcr2 and NGT-Gal4. n indicates the total number of ovarioles examined for each genotype. (B) Quantification of germline stem cell (GSC)-like cell number in germaria of the indicated genotypes from 2–5-day-old flies. Mean ± SD. Germless ovarioles were excluded from this analysis.
Figure 8 with 1 supplement
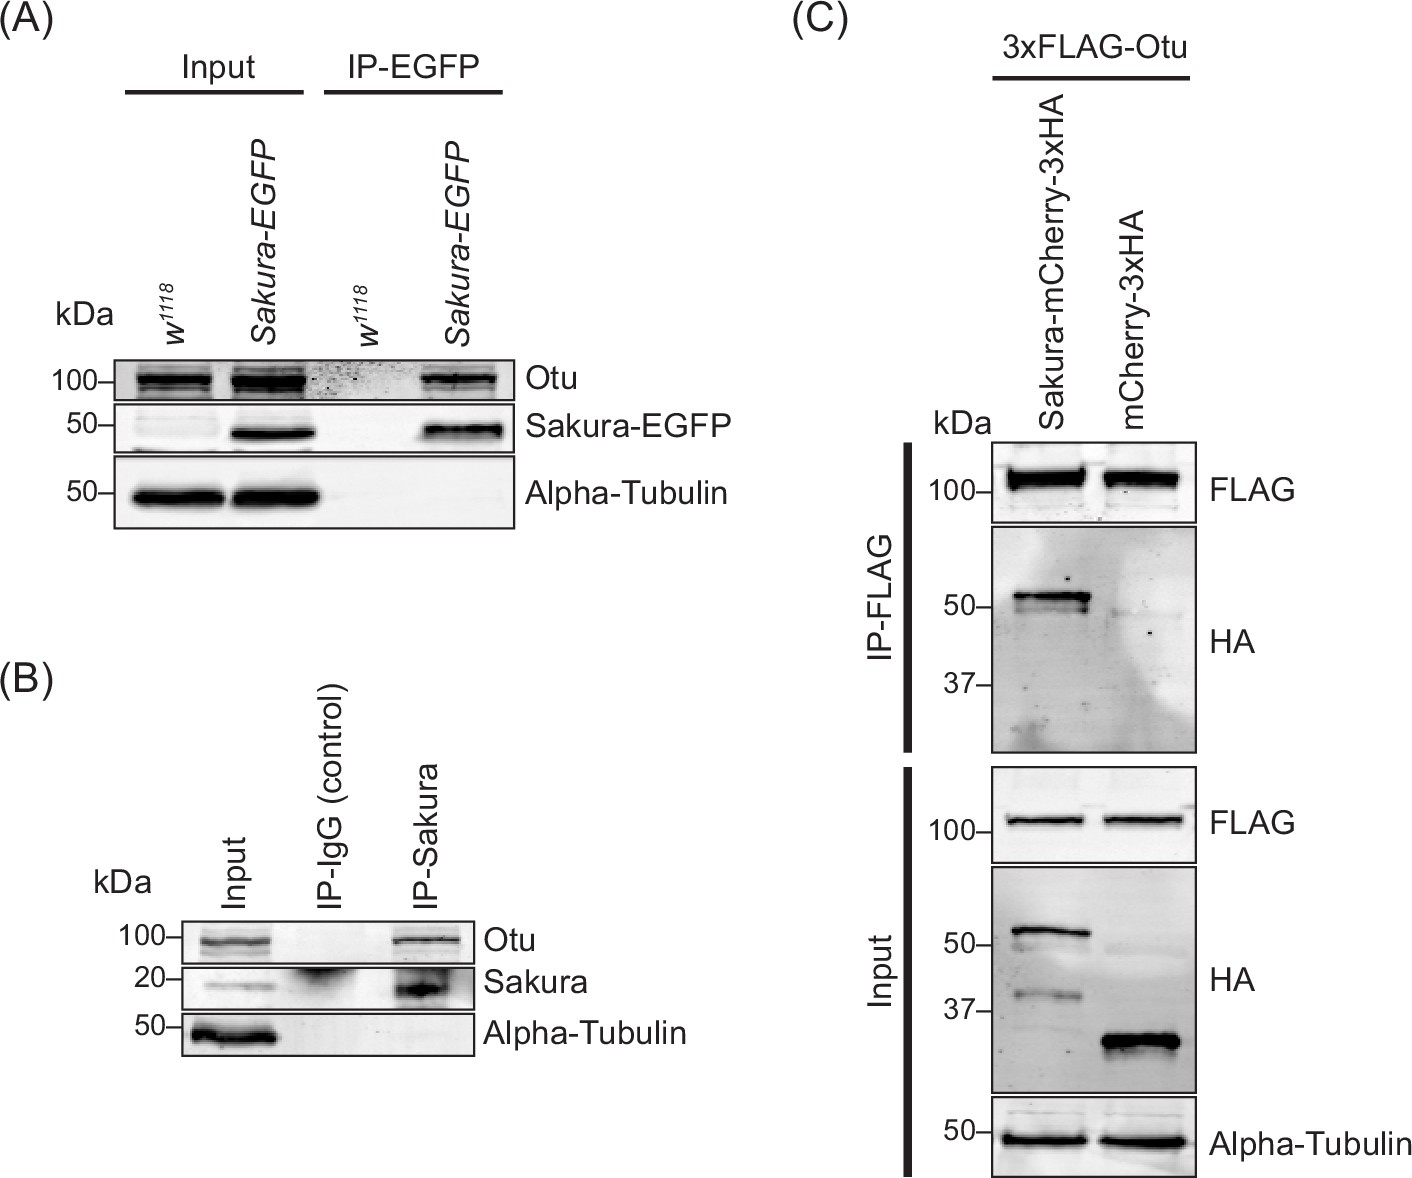
Sakura interacts with ovarian tumor (Otu).
(A) Co-immunoprecipitation using anti-GFP magnetic beads followed by Western blotting. Ovary lysates expressing Sakura-EGFP in sakura+/+ background and those from w1118 negative control were tested. (B) Co-immunoprecipitation using beads bound with rabbit anti-Sakura followed by Western blotting. Ovary lysates from w1118 flies were used. Rabbit IgG was used as a control IP. (C) Co-immunoprecipitation using beads bound with anti-FLAG antibody followed by Western blotting. S2 cell lysates expressing 3xFLAG-Otu and Sakura-mCherry-3xHA or mCherry-3xHA (negative control) were used.
-
Figure 8—source data 1
Original uncropped gel blot images used in Figure 8A, B, C and Figure 8—figure supplement 1 indicating the relevant bands.
- https://cdn.elifesciences.org/articles/103828/elife-103828-fig8-data1-v1.pdf
-
Figure 8—source data 2
Original uncropped, unedited gel blot image files used in Figure 8A, B, C and Figure 8—figure supplement 1.
- https://cdn.elifesciences.org/articles/103828/elife-103828-fig8-data2-v1.zip
Figure 8—figure supplement 1
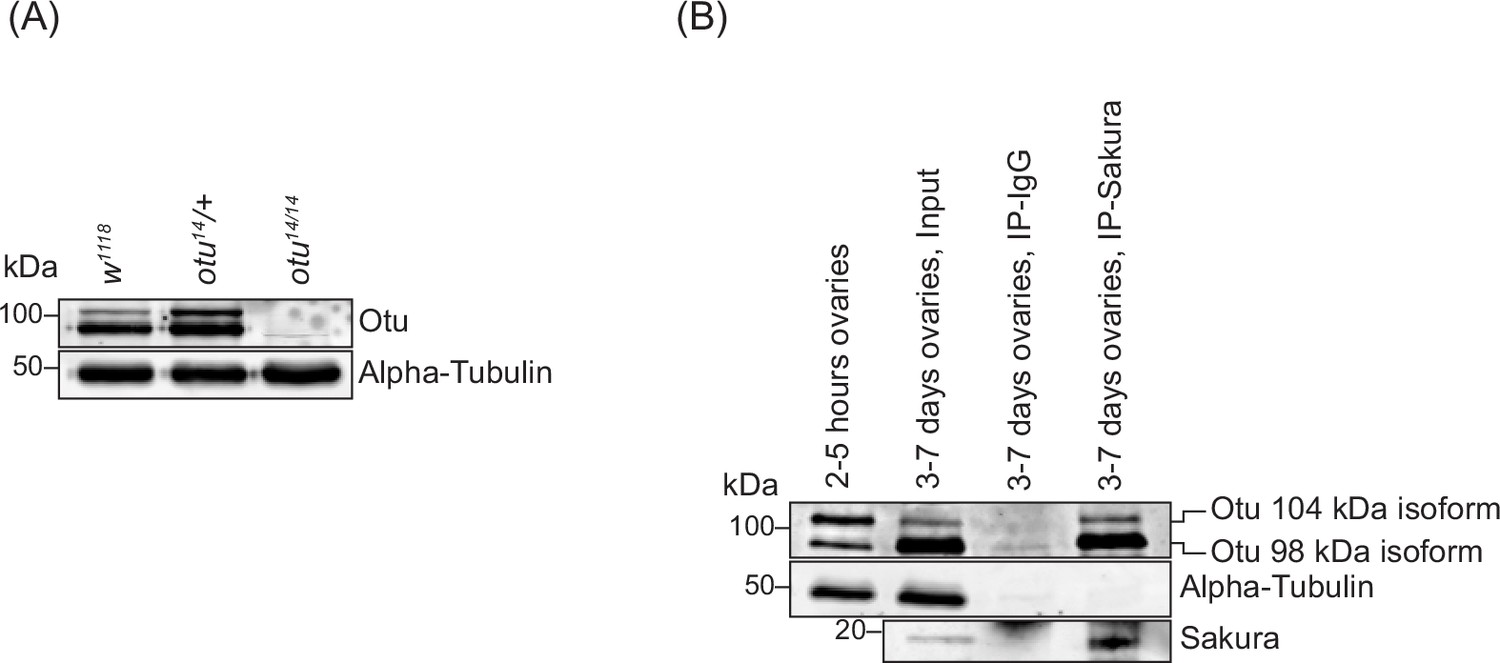
Anti-ovarian tumor (Otu) western blot of dissected ovary lysates.
(A) Western blot of dissected ovary lysates. (B) Western blot of dissected ovary lysates prepared from flies 2–5 hr and 3–7 days post eclosion and co-IP with anti-Sakura. The SDS-PAGE gel was run for a longer duration to better separate the 104 kDa and 98 kDa Otu isoforms. In 2–5 hr ovaries, the 104 kDa Otu isoform is more abundant, while in 3–7 day ovaries, the 98 kDa isoform predominates. Both Otu isoforms co-IPed with Sakura. The same 3–7 day ovary input and IP samples used for Figure 8B were used for anti-Otu and anti-Alpha-Tubulin Western. The anti-Sakura image is the same as shown in Figure 8B.
Figure 9 with 1 supplement

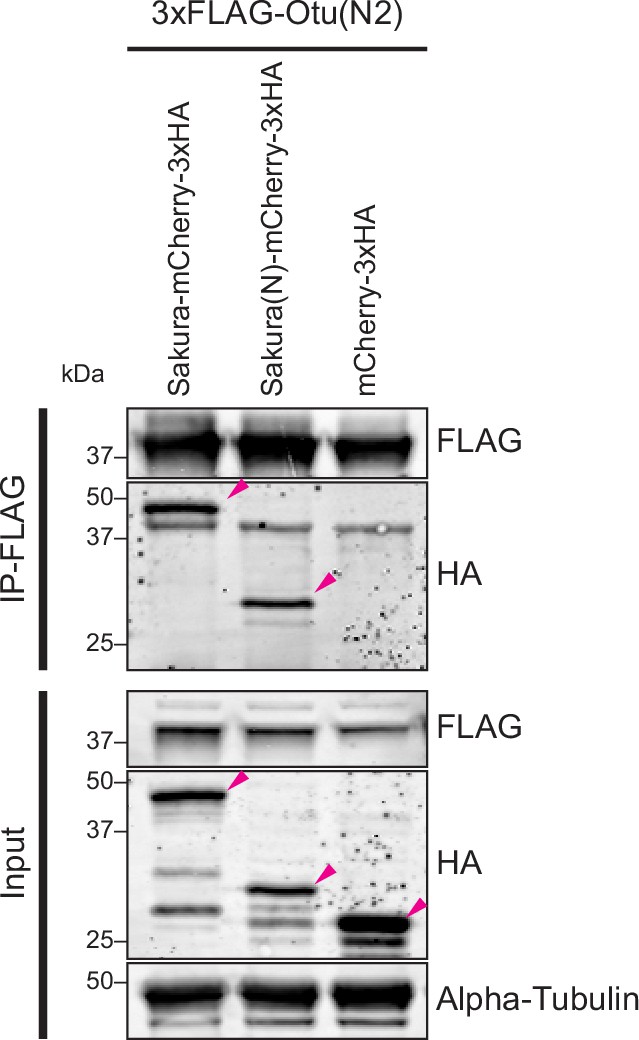
N-terminal regions of Sakura and ovarian tumor (Otu) are important for interaction.
(A) Predicted structure of the Sakura and Otu protein complex made by AlphaFold. Full-length Sakura and N-terminal Otu fragment (N1. 1-405aa) were used for prediction. (B) Full-length Otu and Otu fragments tested in co-immunoprecipitation assays. The binding assay results from (D) is summarized. (C) Full-length Sakura and Sakura fragments tested in co-immunoprecipitation assays (N: N-terminal, M: middle, C: C-terminal). The binding assay results from (E) is summarized. (D, E, F) Co-immunoprecipitation using anti-HA magnetic beads followed by Western blotting. S2 cell lysates expressing HA-tagged mCherry were used as negative controls.
-
Figure 9—source data 1
Original uncropped gel blot images used in Figure 9D, E, F, Figure 9—figure supplement 1 indicating the relevant bands.
- https://cdn.elifesciences.org/articles/103828/elife-103828-fig9-data1-v1.pdf
-
Figure 9—source data 2
Original uncropped, unedited gel blot image files used in Figure 9D, E, F, Figure 9—figure supplement 1.
- https://cdn.elifesciences.org/articles/103828/elife-103828-fig9-data2-v1.zip
Figure 9—figure supplement 1
Co-immunoprecipitation assay to test interaction between N-terminal fragments of Sakura and ovarian tumor (Otu) in S2 cells.
Co-immunoprecipitation assay using beads bound with anti-FLAG antibody followed by Western blotting. S2 cell lysates expressing mCherry-3xHA were used as controls. This is the reciprocal co-immunoprecipitation of Figure 9F.
Figure 10 with 1 supplement
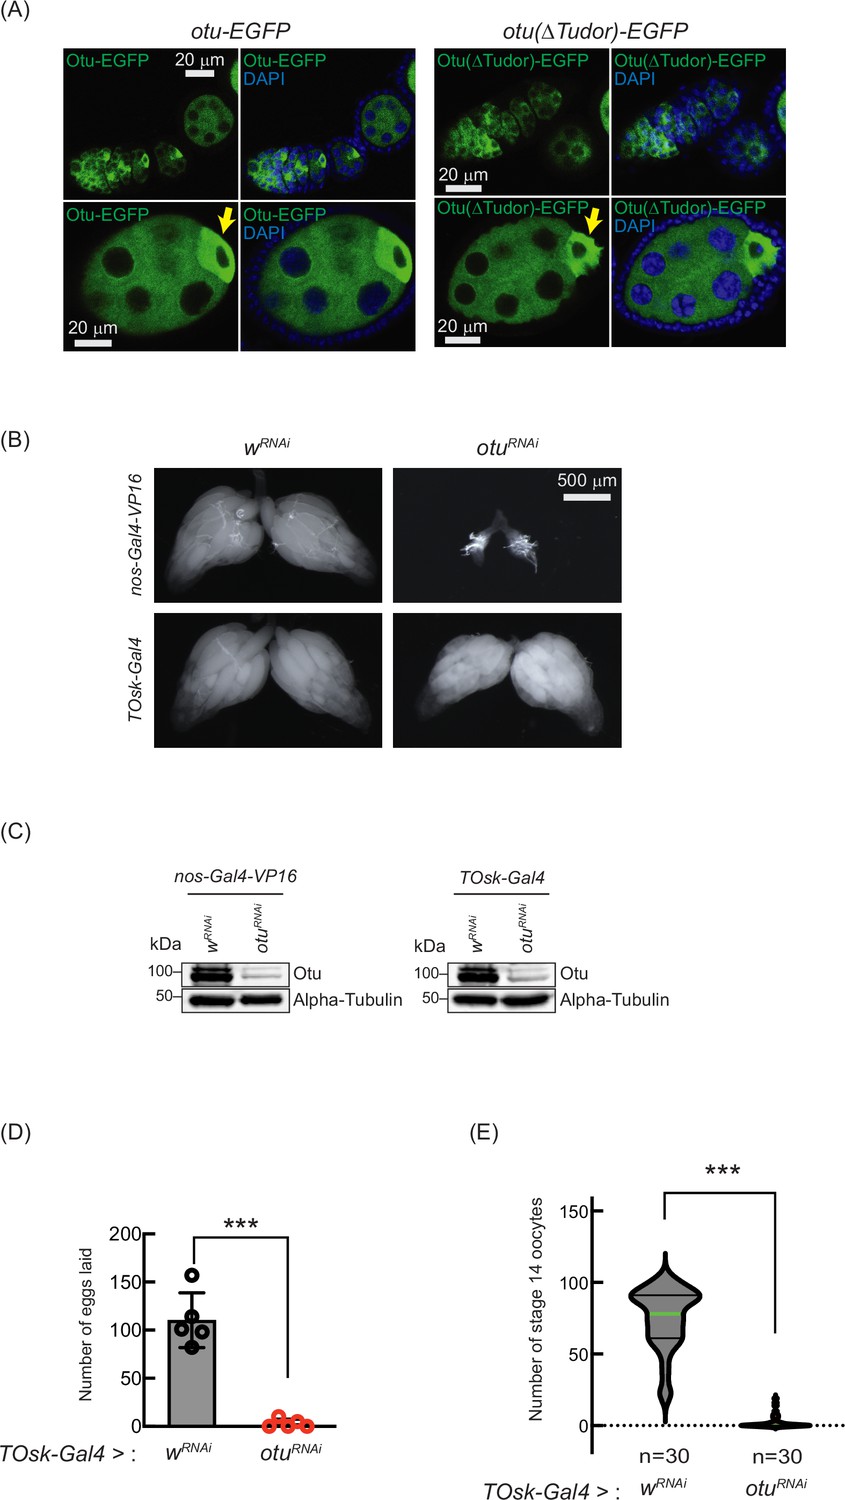
Loss of ovarian tumor (otu) phenocopies loss of sakura.
(A) Confocal images of ovaries from otu-EGFP and otu(∆Tudor)-EGFP transgenic flies. Otu-EGFP and Otu(∆Tudor)-EGFP (green), DAPI (blue). Yellow arrows show the enrichment of Otu-EGFP and Otu(∆Tudor)-EGFP in developing oocytes. Scale bars: 20 μm. (B) Stereomicroscope images of dissected whole ovaries from wRNAi (control) and otuRNAi flies where RNAi knockdown was driven in the female germline with nos-Gal4-VP16 or TOsk-Gal4. Scale bar: 500 μm. (C) Western blot of dissected ovary lysates. (D) Number of eggs laid by TOsk-Gal4 >wRNAi and TOsk-Gal4 >otuRNAi flies. Mean ± SD (n = 5). P-value < 0.001 (Student’s t-test, unpaired, two-tailed) are indicated by ***. (E) Violin plots of the number of stage 14 oocytes produced in TOsk-Gal4 >wRNAi and TOsk-Gal4 >otuRNAi flies. n=30. P-value < 0.001 (Student’s t-test, unpaired, two-tailed) is indicated by ***.
-
Figure 10—source data 1
Original uncropped gel blot images used in Figure 10C, Figure 10—figure supplement 1, indicating the relevant bands.
- https://cdn.elifesciences.org/articles/103828/elife-103828-fig10-data1-v1.pdf
-
Figure 10—source data 2
Original uncropped, unedited gel blot image files used in Figure 10C, Figure 10—figure supplement 1.
- https://cdn.elifesciences.org/articles/103828/elife-103828-fig10-data2-v1.zip
Figure 10—figure supplement 1

Depletion of Sakura does not deplete ovarian tumor (Otu) and depletion of Otu does not deplete Sakura.
(A) Western blot of dissected ovary lysates. The same samples used for Figure 5B were used for anti-Otu Western. The anti-Sakura and anti-Alpha tubulin images are the same as shown in Figure 5B. (B) The same samples used for Figure 10C were used for anti-Sakura Western. The anti-Otu and anti-Alpha tubulin images are the same as shown in Figure 10C.
Figure 11
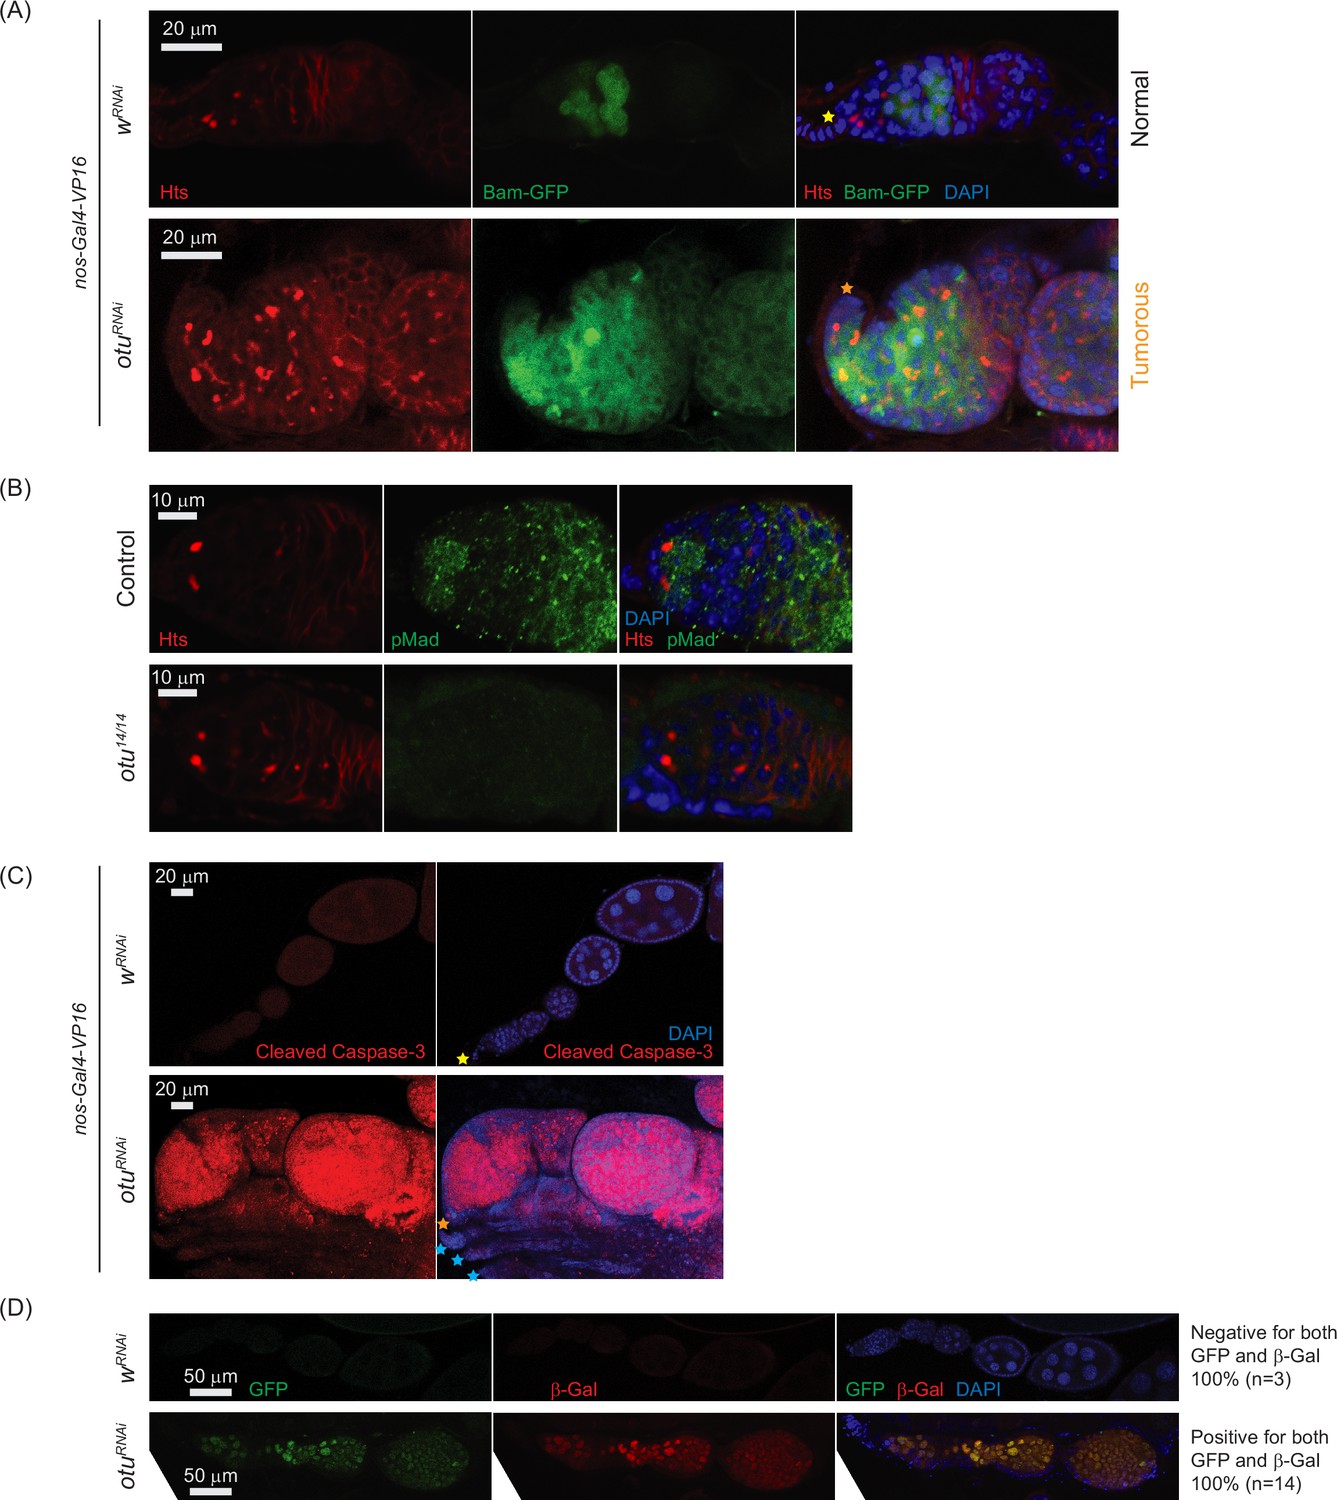
Loss of ovarian tumor (otu) results in low levels of phosphorylated Mad (pMad) and derepression of bag-of-marbles (bam) in the germaria.
(A) Confocal images of the ovaries from control (wRNAi) and otuRNAi flies harboring the bam-GFP reporter, where RNAi knockdown was driven in the female germline with nos-Gal4-VP16. Bam-GFP (green), Hts (red), and DAPI (blue). Scale bars: 20 μm. (B) Confocal images of germaria from control (otu14/+) and otu14/14 mutant flies stained with anti-pMad (green) and anti-Hts (red) antibodies. Scale bars: 10 μm. (C) Confocal images of the ovaries from nos-Gal4-VP16>wRNAi and nos-Gal4-VP16>otuRNAi flies stained with anti-cleaved Caspase 3 antibody. Cleaved Caspase-3 (red) and DAPI (blue). Scale bars: 20 μm. (D) Confocal images of the ovaries from wRNAi and otuRNAi flies carrying the Burdock sensor, with RNAi driven in the female germline using UAS-Dcr2, NGT-Gal4, and nos-Gal4-VP16. GFP (green), β-gal (red), and DAPI (blue). Scale bars: 50 μm. Three out of three tested control samples were negative for both GFP and β-gal, while 14 out of 14 tested otuRNAi samples were positive for GFP and β-gal.
Figure 12 with 1 supplement
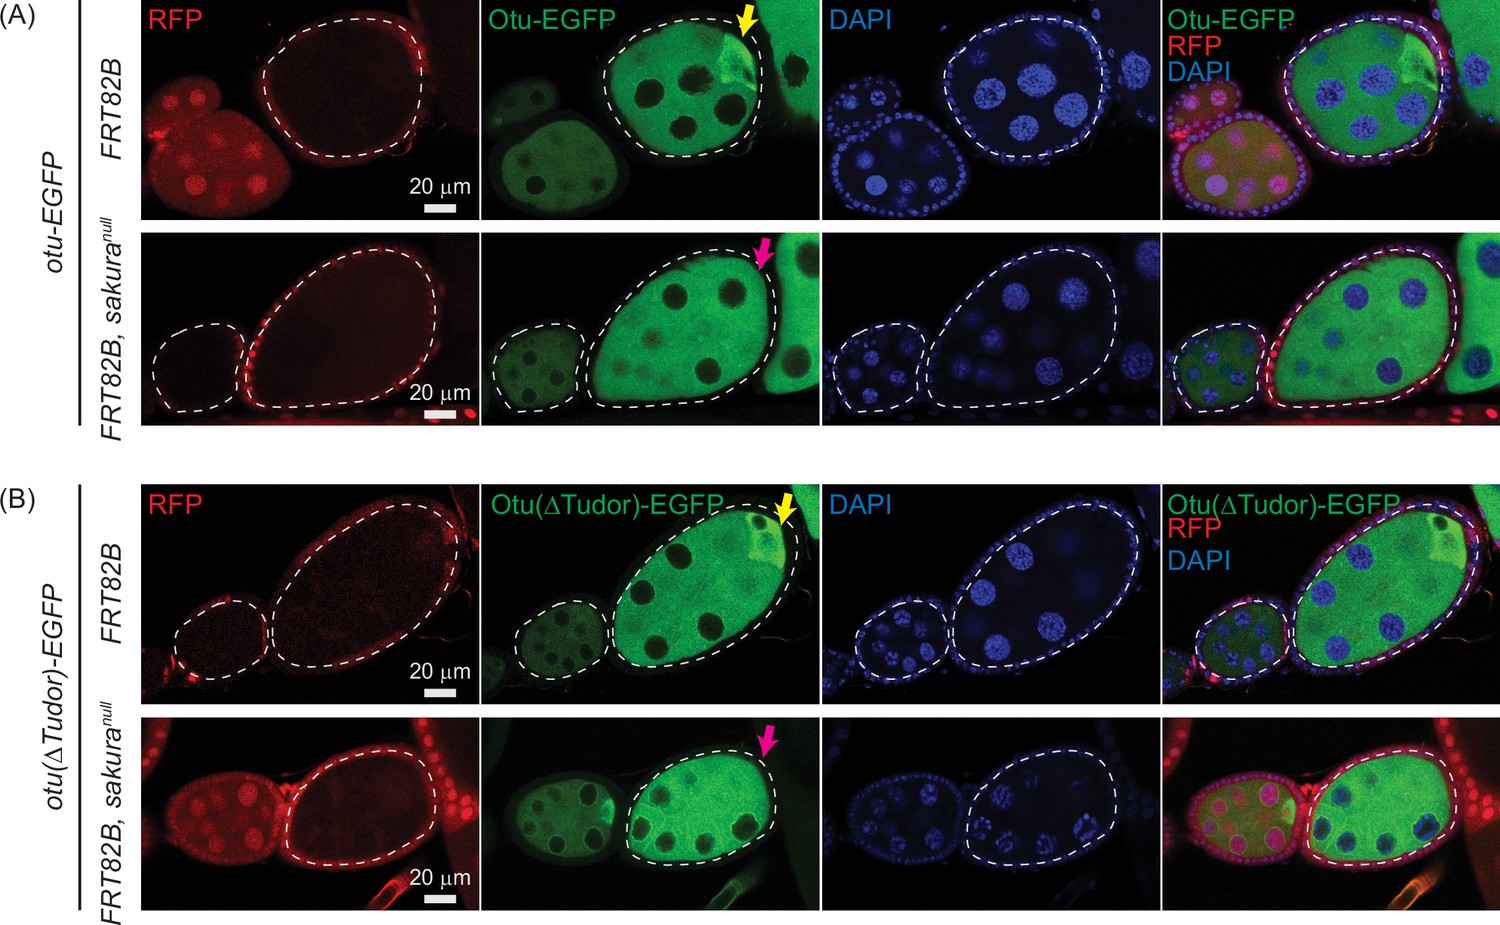
Otu enrichment to the posterior within egg chambers is lost in sakuranull.
Confocal images of egg chambers with germline clones of sakuranull expressing (A) Otu-EGFP or (B) Otu(ΔTudor)-EGFP. Fly genotypes used: hs-flp/w; otu-EGFP/+; FRT82B, ubi-RFP/FRT82B. hs-flp/w; otu-EGFP/+; FRT82B, ubi-RFP/FRT82B, sakuranull. hs-flp/w; otu(ΔTudor)-EGFP/+; FRT82B, ubi-RFP/FRT82B. hs-flp/w; otu(ΔTudor)-EGFP /+; FRT82B, ubi-RFP/FRT82B, sakuranull. RFP (red), Otu-EGFP or Otu(ΔTudor)-EGFP (green), and DAPI (blue). Scale bars: 20 μm. Marked clones (RFP-negative) are outlined with white dotted lines. Yellow arrows indicate normal posterior enrichment of Otu-EGFP and Otu(ΔTudor)-EGFP signal; magenta arrows indicate the loss of this posterior enrichment in sakuranull clones.
Figure 12—figure supplement 1
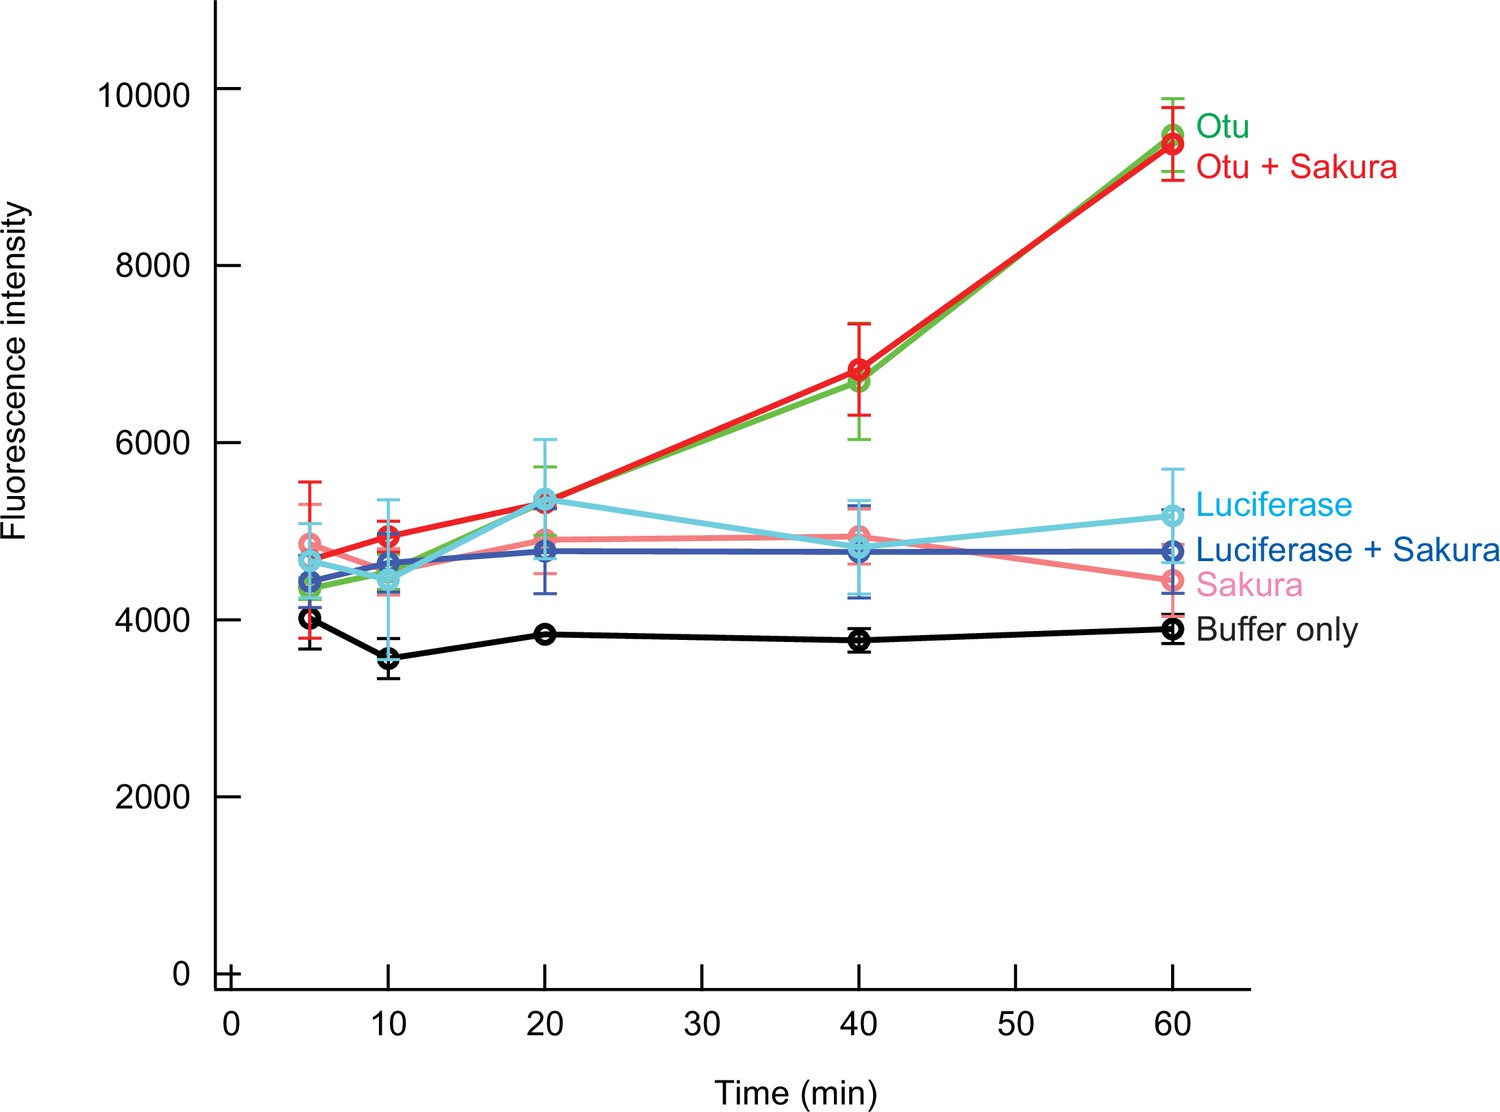
In vitro deubiquitination assay.
The mean fluorescence intensity of three replicates was plotted. Error bars (+/-) are standard deviations. Firefly Luciferase was used as a negative control.
Tables
Table 1
Number of unique peptide counts detected by mass spec.
Proteins with peptide signals present in all three biological replicates of the Sakura-EGFP samples without any signals in any of the three biological replicates of the negative control are shown.
| Identified protein name | Gene ID | Unique peptide counts | |||||
|---|---|---|---|---|---|---|---|
| Sakura-EGFP samples | w1118 samples(negative control) | ||||||
| Replicate 1 | Replicate 2 | Replicate 3 | Replicate 1 | Replicate 2 | Replicate 3 | ||
| Ovarian tumor (Otu) | CG12743 | 44 | 38 | 18 | 0 | 0 | 0 |
| Uncharacterized protein Dmel_CG4679 | CG4679 | 17 | 8 | 2 | 0 | 0 | 0 |
| Uncharacterized protein Dmel_CG14997 | CG14997 | 17 | 7 | 2 | 0 | 0 | 0 |
| Mitochondrial ribosomal protein S22 | CG12261 | 14 | 6 | 1 | 0 | 0 | 0 |
| Tudor | CG9450 | 15 | 1 | 1 | 0 | 0 | 0 |
| Mitochondrial ribosomal protein S5 | CG40049 | 10 | 4 | 1 | 0 | 0 | 0 |
| HECT and RLD domain containing protein 2 | CG11734 | 4 | 9 | 1 | 0 | 0 | 0 |
| Mitochondrial ribosomal protein S10 | CG4247 | 5 | 3 | 1 | 0 | 0 | 0 |
| Mitochondrial ribosomal protein S31 | CG5904 | 3 | 1 | 1 | 0 | 0 | 0 |
| Uncharacterized protein Dmel_CG1316 | CG1316 | 2 | 1 | 1 | 0 | 0 | 0 |
Additional files
Download links
A two-part list of links to download the article, or parts of the article, in various formats.
Downloads (link to download the article as PDF)
Open citations (links to open the citations from this article in various online reference manager services)
Cite this article (links to download the citations from this article in formats compatible with various reference manager tools)
Female-germline specific protein Sakura interacts with Otu and is crucial for germline stem cell renewal and differentiation and oogenesis
eLife 13:RP103828.
https://doi.org/10.7554/eLife.103828.4


