Self-other generalisation shapes social interaction and is disrupted in borderline personality disorder
- Department of Psychology, Royal Holloway, University of London, United Kingdom
- Institute of Psychiatry, Psychology and Neuroscience, King’s College London, United Kingdom
- Centre for AI and Machine Learning, Edith Cowan University, Australia
- Department for Clinical, Educational, and Health Psychology, Division of Psychology and Language Sciences, University College London, United Kingdom
- Anna Freud, United Kingdom
- Department of Neuroscience, Washington University in St. Louis, United States
- Centre for Human Neuroscience Research, Virginia Tech, United States
- Max Planck Institute of Biological Cybernetics, Germany
- University of Tübingen, Germany
Figures
Figure 1
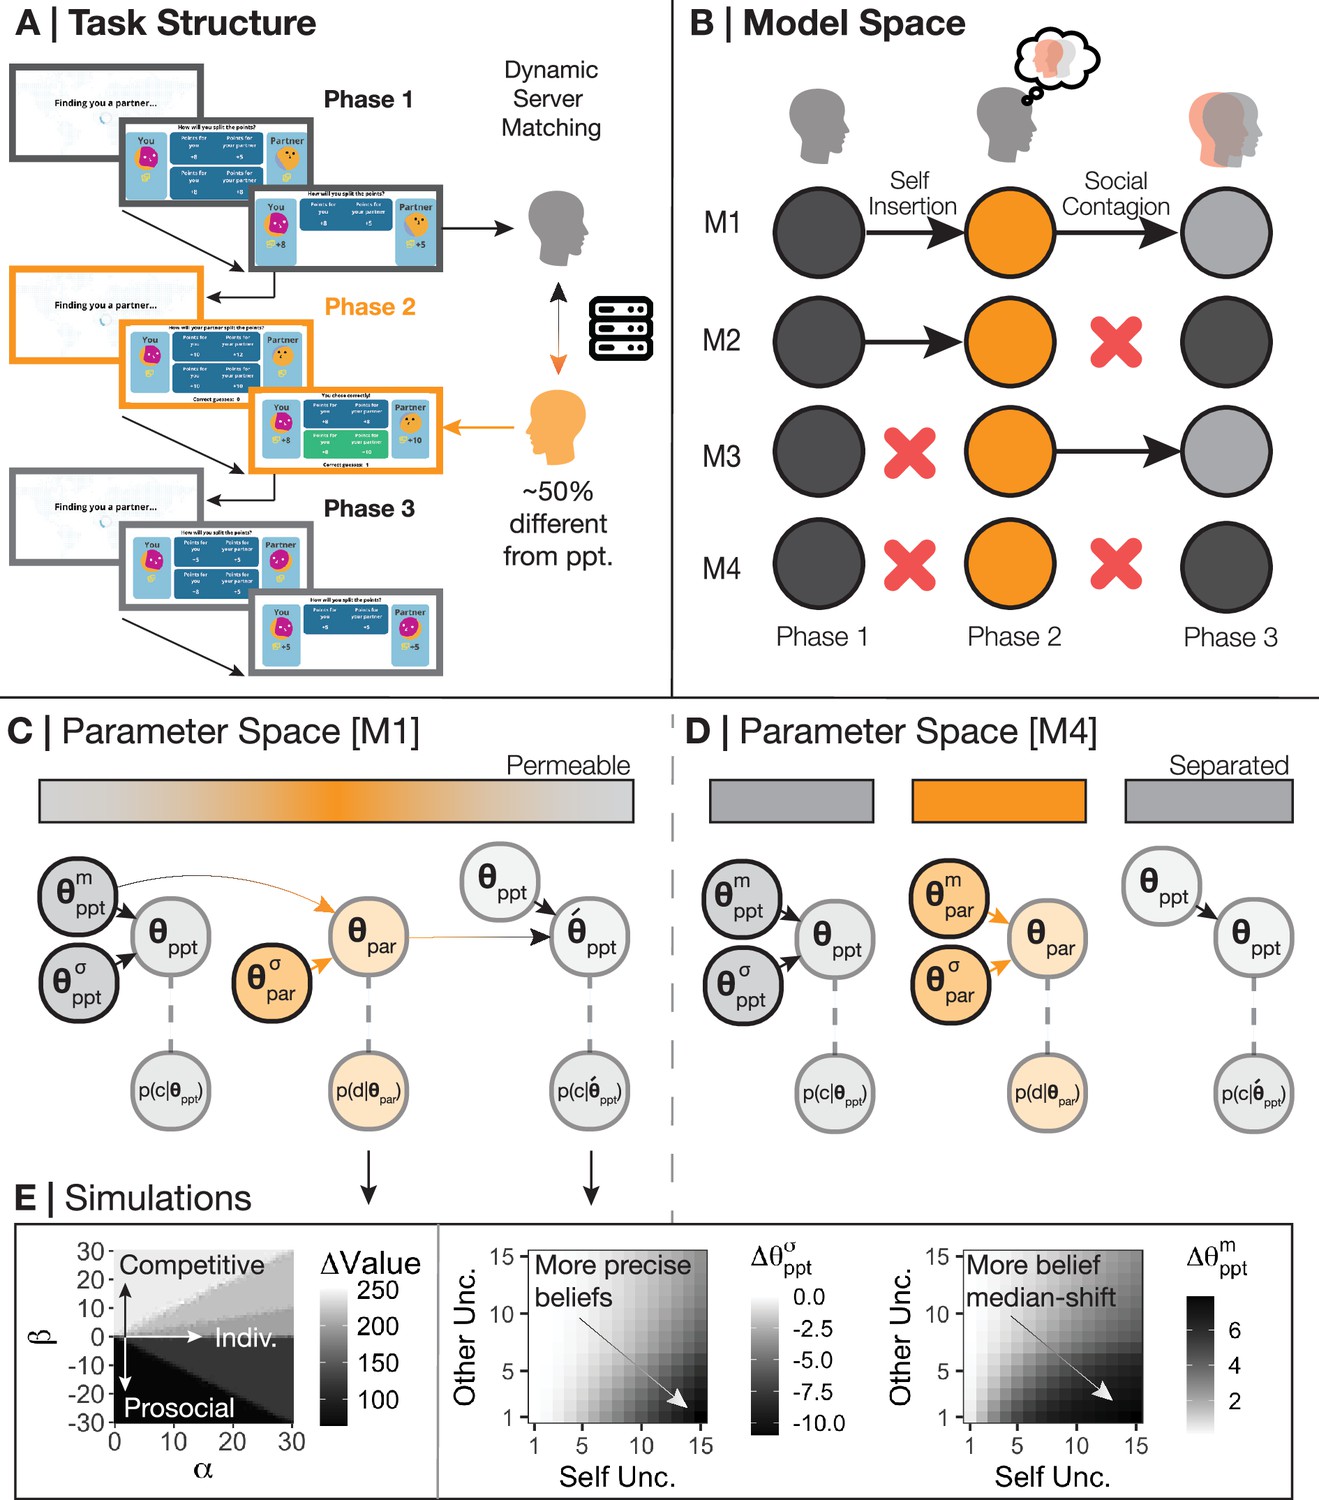
Task and model space.
(A) Participants were invited to play a three-phase, repeated social value orientation paradigm – the Intentions Game – with virtual partners. Phase 1 of the Intentions Game lasted 36 trials and asked participants to make a forced choice between two options as to how to split points with an anonymous virtual partner. An example of a prosocial-individualistic pair of options could be (self = 5, other = 5) or (self = 10, other = 5) – if the participant chooses option 1, they could be viewed as less individualistic and more prosocial as the outcomes to the other do not change, but the self would earn less. In phase 2, lasting 54 trials, participants were asked to predict the decisions of a new anonymous partner using the same two-forced choice set-up and the same option pairs; participants were given feedback on whether they were correct or incorrect in their prediction. We used Amazon Web Services to create a novel server architecture to match participants and (virtual) partners (Burgess and Barnby, 2023). Partners in phase 2 were matched to be approximately 50% different from the participant with respect to their choices in phase 1 to ensure all participants needed to learn about their phase 2 partner, and to provide a mechanism to examine whether beliefs about partners had an effect on the self. Phase 3 was identical to phase 1, although participants were informed that they were matched with a third anonymous partner, unconnected to the partners in phases 1 and 2. At the end of the game, if participants collected over 1000 points overall, they were entered into a lottery to win a bonus. (B) We created four models that may explain the data and to test theories of social generalisation. Model M1 assumes participants are subject to both self-insertion and social contagion, i.e., participants used their own preferences as a prior to their partner in phase 2, and partner behaviour subsequently influenced participants’ preferences in phase 3. Model M4 assumes participants are subject to neither self-insertion nor social contagion, instead forming a novel prior around the phase 2 partner rather than using their own preferences and failing to be influenced by their partner after observation. Models M2 and M3 suggest participants are only explained by either self-insertion or social contagion, not both. (C) We assume that participants' choices in phase 1 are governed by both a median () and standard deviation (). Participants insert their median preferences () into their prior beliefs over their partner in phase 2, but with a different standard deviation to allow for flexibility and learning (). The combination of the prior and posterior belief uncertainty about the partner (; ), the precision participants have over their own preferences (), and the median posterior of the participant and partner (; ) form the new median and standard deviation over participant preferences in phase 3 (). (D) In contrast to M1, M4 generates a new central tendency over the partner in phase 2 () which disconnects participant preferences and prior beliefs. M4 also assumes that the same parameters that generated participant choices in phase 1 also generate choices in phase 3. (E) Simulating our model demonstrates how different combinations of (preferences for absolute self-reward) and (preferences for relative reward; prosocial-competitiveness) lead to changes in the discrepancy of value between participants and partners (left panel). We also show how increasing uncertainty over self-beliefs and higher precision over partners causally draws participants more toward the beliefs of their partner in phase 3 and increases their precision over their phase 3 beliefs (Moutoussis et al., 2016).
Figure 2 with 6 supplements
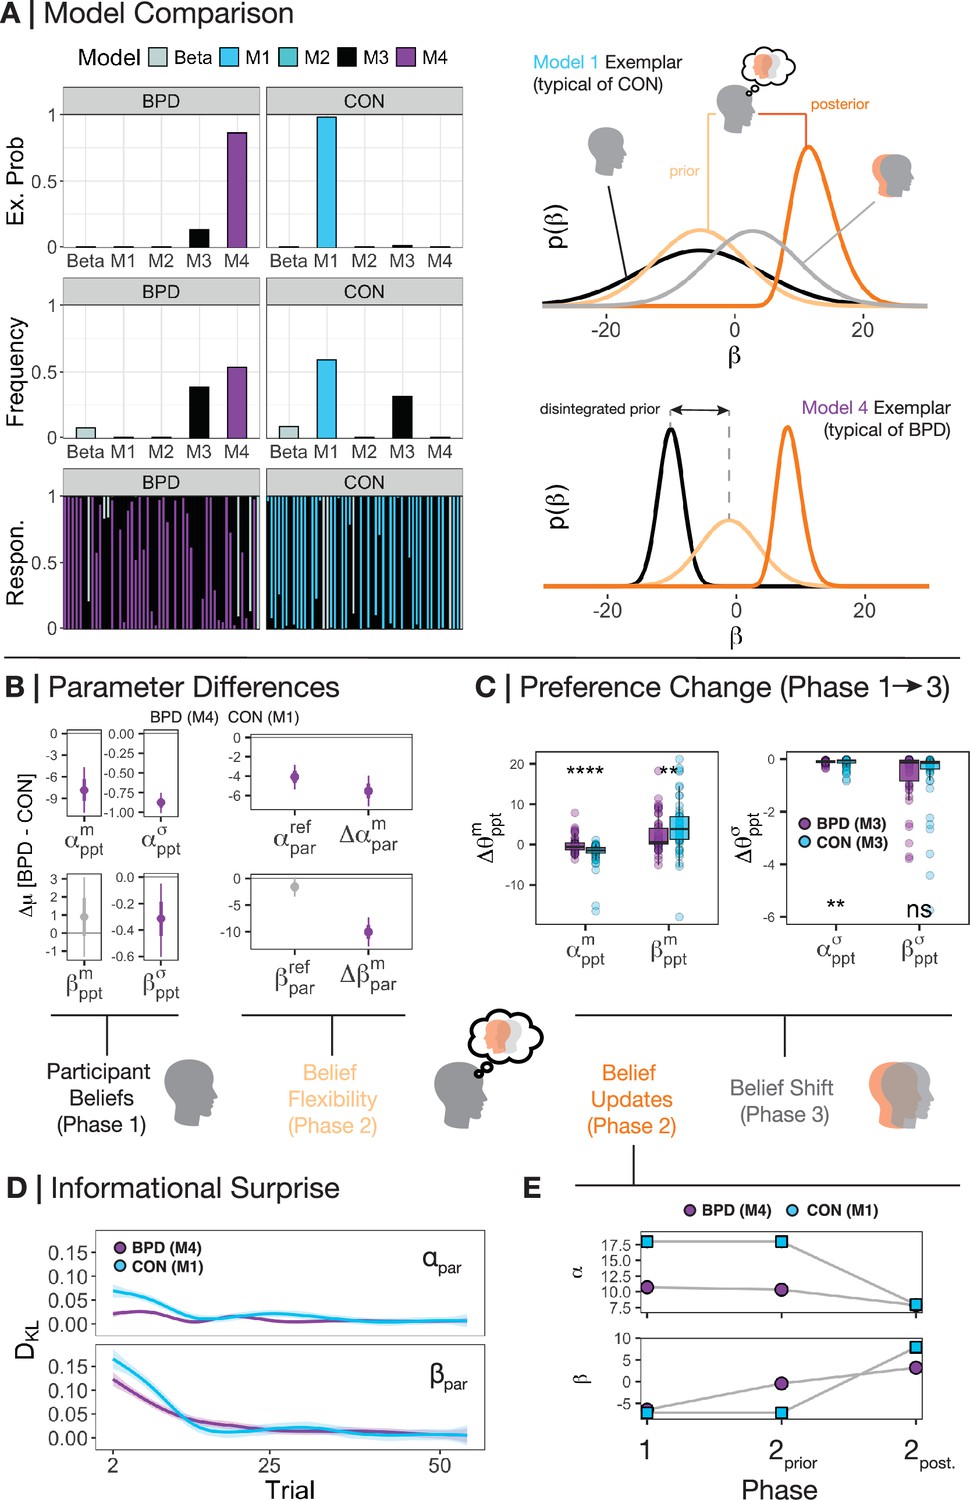
Beliefs between groups and within phases.
(A) We used random-effects hierarchical model fitting and comparison to jointly estimate group-level and individual-level parameters based on real data from participants (Piray and Daw, 2021). CON participants were best fit by M1, whereas borderline personality disorder (BPD) participants were best fit by M4 on a group level. Looking within each model by simulating the beliefs of each participant reveals that – as expected – CON participants use the median of their self-preferences (black distribution) as a basis for their prior beliefs about partners (light orange distribution), and that the precision of their posterior beliefs about partners (dark orange distribution) and of their own self-preferences leads to a shifted model of the self (grey distribution). BPD participants, on the other hand, have a disintegrated prior over their partner which is not subject to their own self-representation. Likewise, there is no change in self-preferences following learning, and thus an absence of the light grey distribution. For illustration, we focus on beliefs over relative preferences () and use real individual participants as exemplars for illustration. (B) Across models, we extracted the common parameters that generate the behaviour of both CON and BPD participants – i.e., their median and standard deviation over both (absolute reward preferences) and (relative value preferences), the flexibility over participants’ prior beliefs about their partners over each dimension, and the absolute change in posterior beliefs in phase 2 over each dimension (; ). Using hierarchical Bayesian t-tests, we demonstrated the mean difference in parameter values between groups. Purple values lower than 0 indicate that the BPD participants had significantly smaller parameter values. Here, we find that BPD participants were less individualistic, equally prosocial, and more certain about their self-preferences. BPD participants were also less flexible over their beliefs about a partner’s absolute reward preferences and updated their beliefs less across the board. (C) Examining participants under a blanket assumption that participants in both BPD and CON groups were influenced by their partner (model M3) revealed that BPD participants were significantly less influenced by their partner across the board, both with respect to their phase 3 median and standard deviation of beliefs. Kruskal-Wallis tests were used between groups within the visualisation. *=p<0.05, **=p<0.01, ***=p<0.001, ****=p<0.0001. (D) We also calculated the Kullback-Leibler divergence (DKL) of beliefs between each trial (t-1 vs t) on each trial during phase 2. We observed three things: (1) All participants display larger belief updates initially, (2) all participants ‘cool off’ in their belief updating over the course of phase 2, and (3) BPD participants update beliefs significantly less throughout the course of phase 2 vs CON participants. (E) Examining the shift in central tendencies across both groups demonstrates that between phase 1 and the start of phase 2, BPD participants shifted their central tendency only over beliefs about the relative reward preferences of partners’. They held lower expectations about a partner’s absolute reward preferences consistent with their own preferences.
Figure 2—figure supplement 1
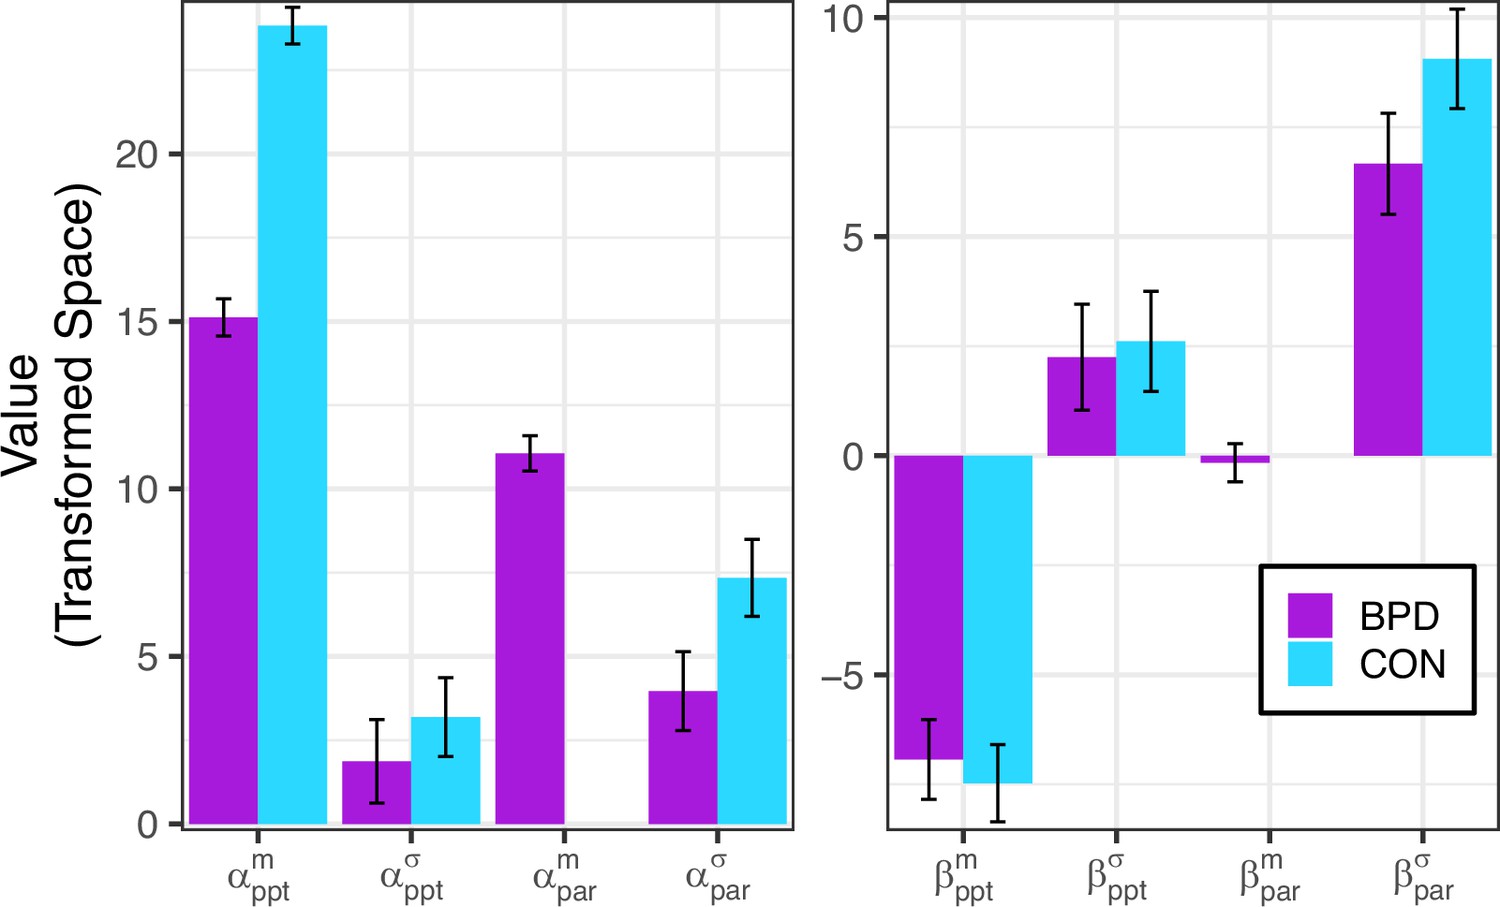
Group-level parameter values.
Borderline personality disorder (BPD) participants were explained by M4, which has two extra free parameters than CON participants who were best explained by M1.
Figure 2—figure supplement 2
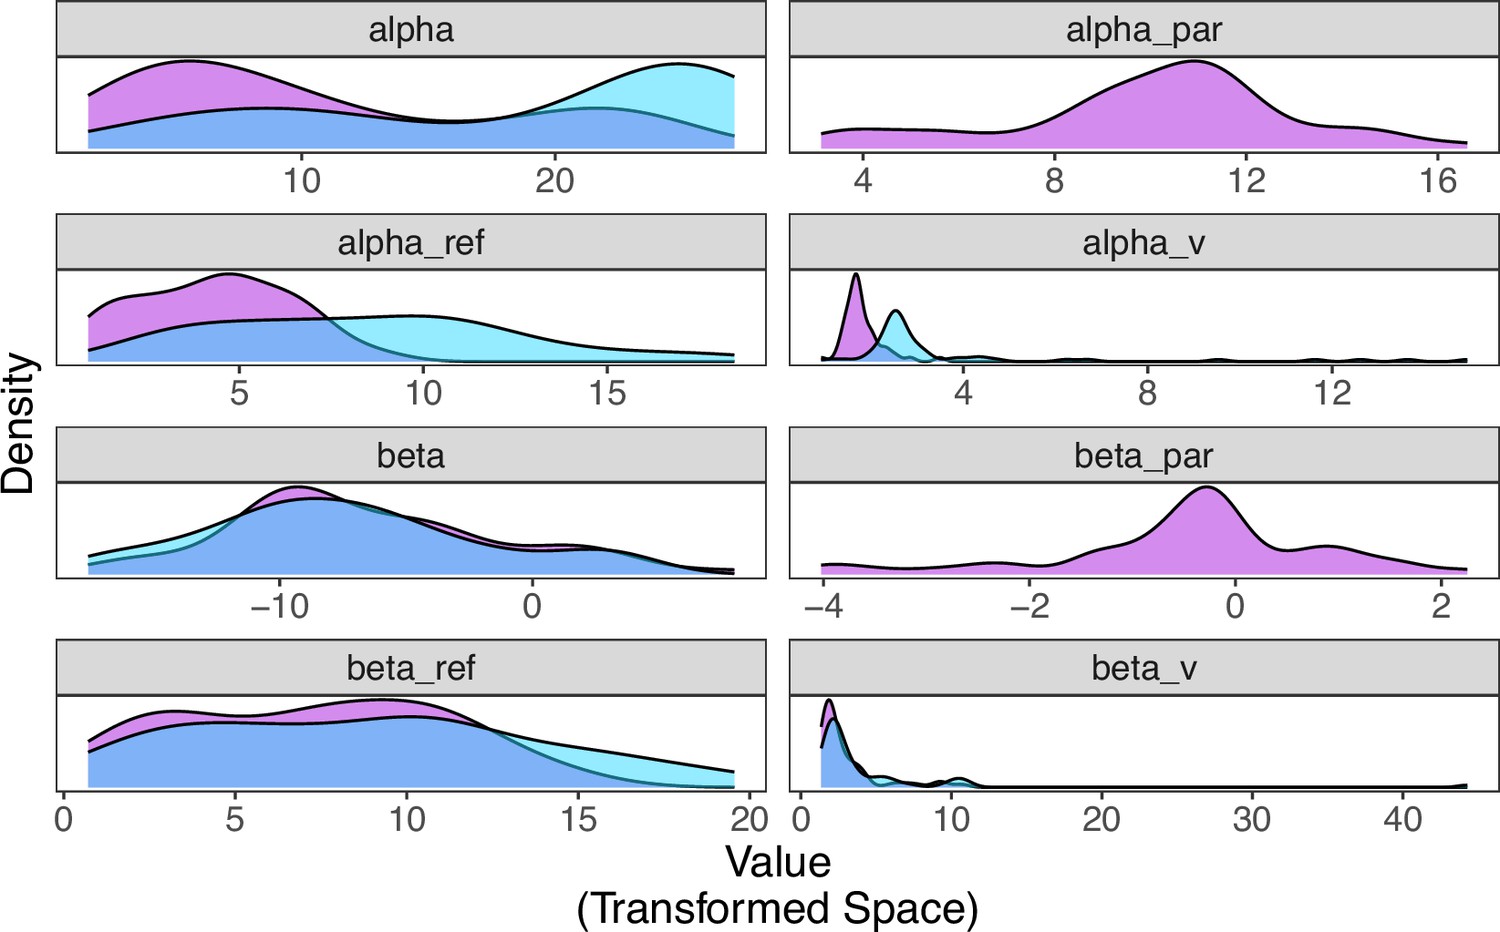
Individual-level parameter distributions per group.
Borderline personality disorder (BPD) (purple) participants were explained by M4, which has two extra free parameters (alpha_par) and (beta_par) than CON participants (blue), who were best explained by M1.
Figure 2—figure supplement 3

Group Distributions Across Phase 1 and 2.
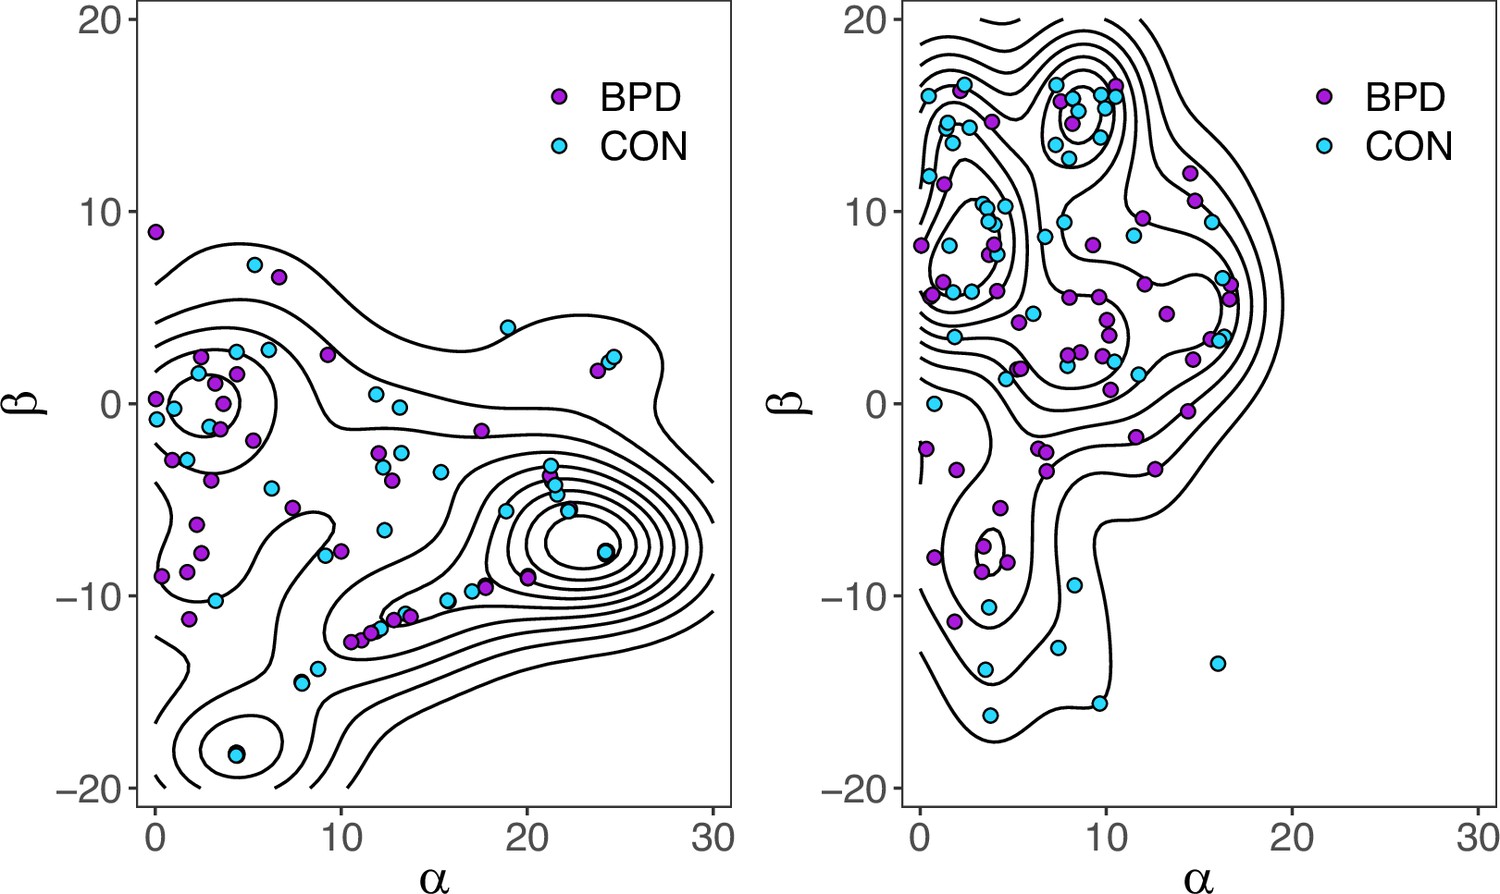
(Top) Exemplar distribution from an individual with a diagnosis of borderline personality disorder (BPD) who was competitive in phase 1 and matched with a partner who was prosocial in phase 2. We note that irrespective of the valence of BPD participants’ preferences, there was still a neutral prior generated that was not integrated into the model of self. (Bottom) distribution of individual-level parameter estimates for phase 1 beliefs (self; red) and phase 2 prior beliefs (other; grey) about partners for both prosocial-competitive (left) and individualistic (right) beliefs. As reported in the main text, BPD priors about their partner’s prosocial preferences were centred closely around 0 ( = –0.39, 95%HDI: −0.77,–0.05), and the shift between and is large ( = 6.0, 95%HDI: 4.7, 7.3). This is not true of the shift between and (=–0.8, 95%HDI: –2.7, 1.1).
Figure 2—figure supplement 4
2D distribution of participant and partner parameters estimated through Bayesian inference at the Amazon Web Service (AWS) server backend during the participant-partner matching protocol.
As a sanity check, we also assessed the degree to which server-derived participant parameters () matched model-fitting-derived model parameters; any discrepancy may have inappropriately matched partners to participants on the server side. We observed excellent correlations between server-derived participants (not used for analysis; only for partner matching in game) and model-derived phase 1 parameters [r(, ) = 0.85, p<0.001; r(, )=0.83, p<0.001].
Figure 2—figure supplement 5

Relationship between belief updates and reaction times.
(Top) Linear random effects relationship between reaction time (ms) and belief updating. Reaction times and belief updates in phase 2 were significantly coupled, such that larger shifts in posterior beliefs along both axes were associated with larger reaction times (linear estimate =0.044, 95% CI: 0.027, 0.06, t=5.01, p<0.001; linear estimate =0.021, 95% CI: 0.005, 0.039, t=2.49, p=0.012). Grey lines are individual participants. Black line is the average linear effect. Reaction time is capped at 10,000 ms for visual illustration, but linear models do not apply an upper limit. (Bottom) All participants were slower at the start of phase 2 and sped up over time (linear estimate = –15.03, 95% CI: −21.06,–8.99; t=–4.88, p<0.001). Baseline participant-partner similarity did not have an overall effect on reaction time but did interact with trial – as participant-partner similarity (red = high similarity; black = low similarity) increased, reaction times early in phase 2 were significantly slower and this effect attenuated over time (linear estimate = –0.53, 95% CI: −0.75,–0.32; t=–4.91, p<0.001). Reaction time did not vary between groups: both borderline personality disorder (BPD) and CON participants displayed the same effect.
Figure 2—figure supplement 6
Uncorrected psychometric correlations.
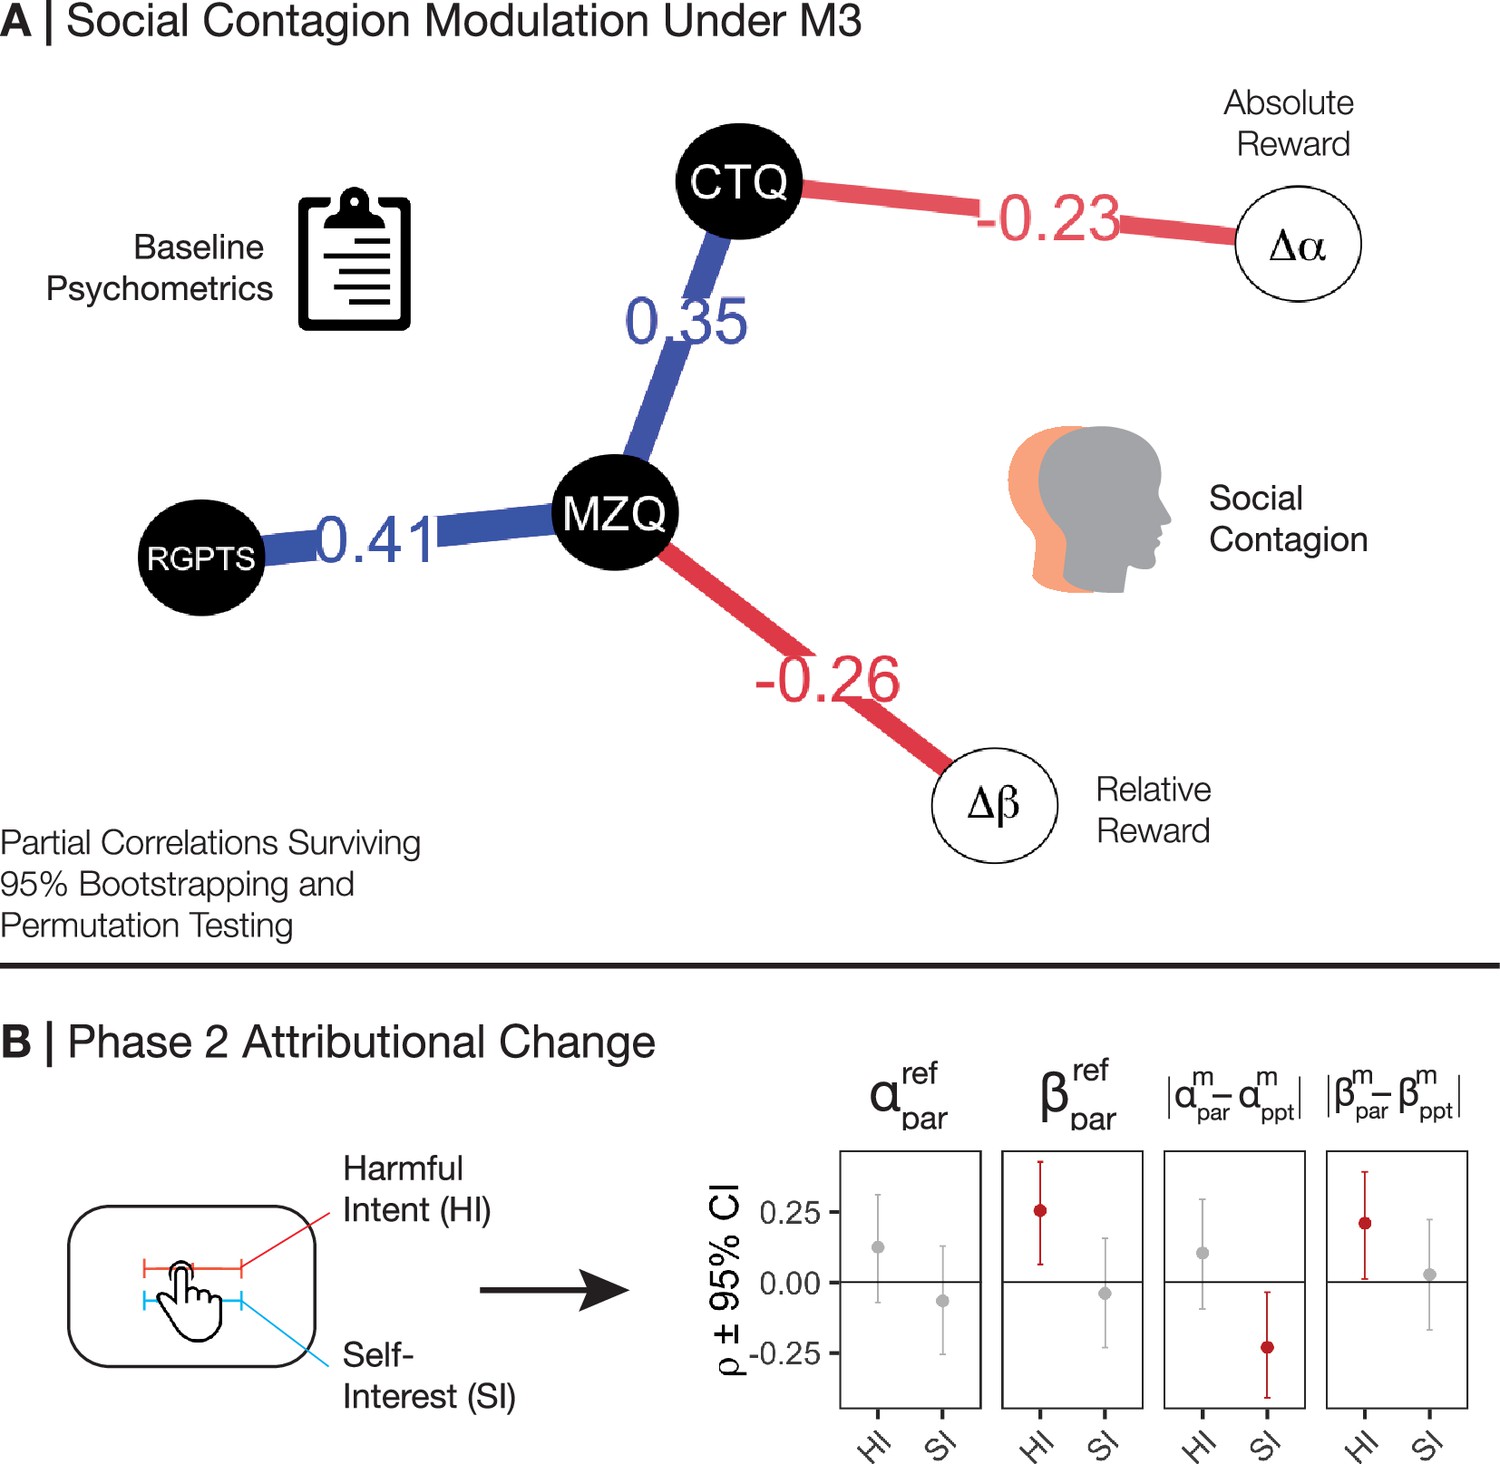
(A) We conducted partial correlations between MZQ, CTQ, RGPTSB, and changes in between phases 1 and 3 across the entire population under M3 to allow parameter comparison on the same scale. We performed bootstrapped resampling (5000 reps) and kept the edges that survived for visualisation. We then performed permutation analysis (5000 reps) to control for multiple comparisons within the partial network. Blue edges = positive partial correlation; red edges = negative partial correlation. Note: the edge between the CTQ and missed conventional significance after correction (p=0.065) and did not survive group correction (B). Uncorrected ranked Spearman correlations between belief flexibility () and absolute partner-participant dissimilarity () – with respect to server-derived parameters – in phase 2, controlling for group status. Only flexibility over relative reward preferences in phase 2 was associated with harmful intent attributions. Increased absolute participant-partner dissimilarity was trend-level associated with lower self-interest attributions, and increased relative participant-partner dissimilarity was associated with high harmful intent attributions, but did not survive correction.
Figure 3 with 4 supplements
Model accuracy.
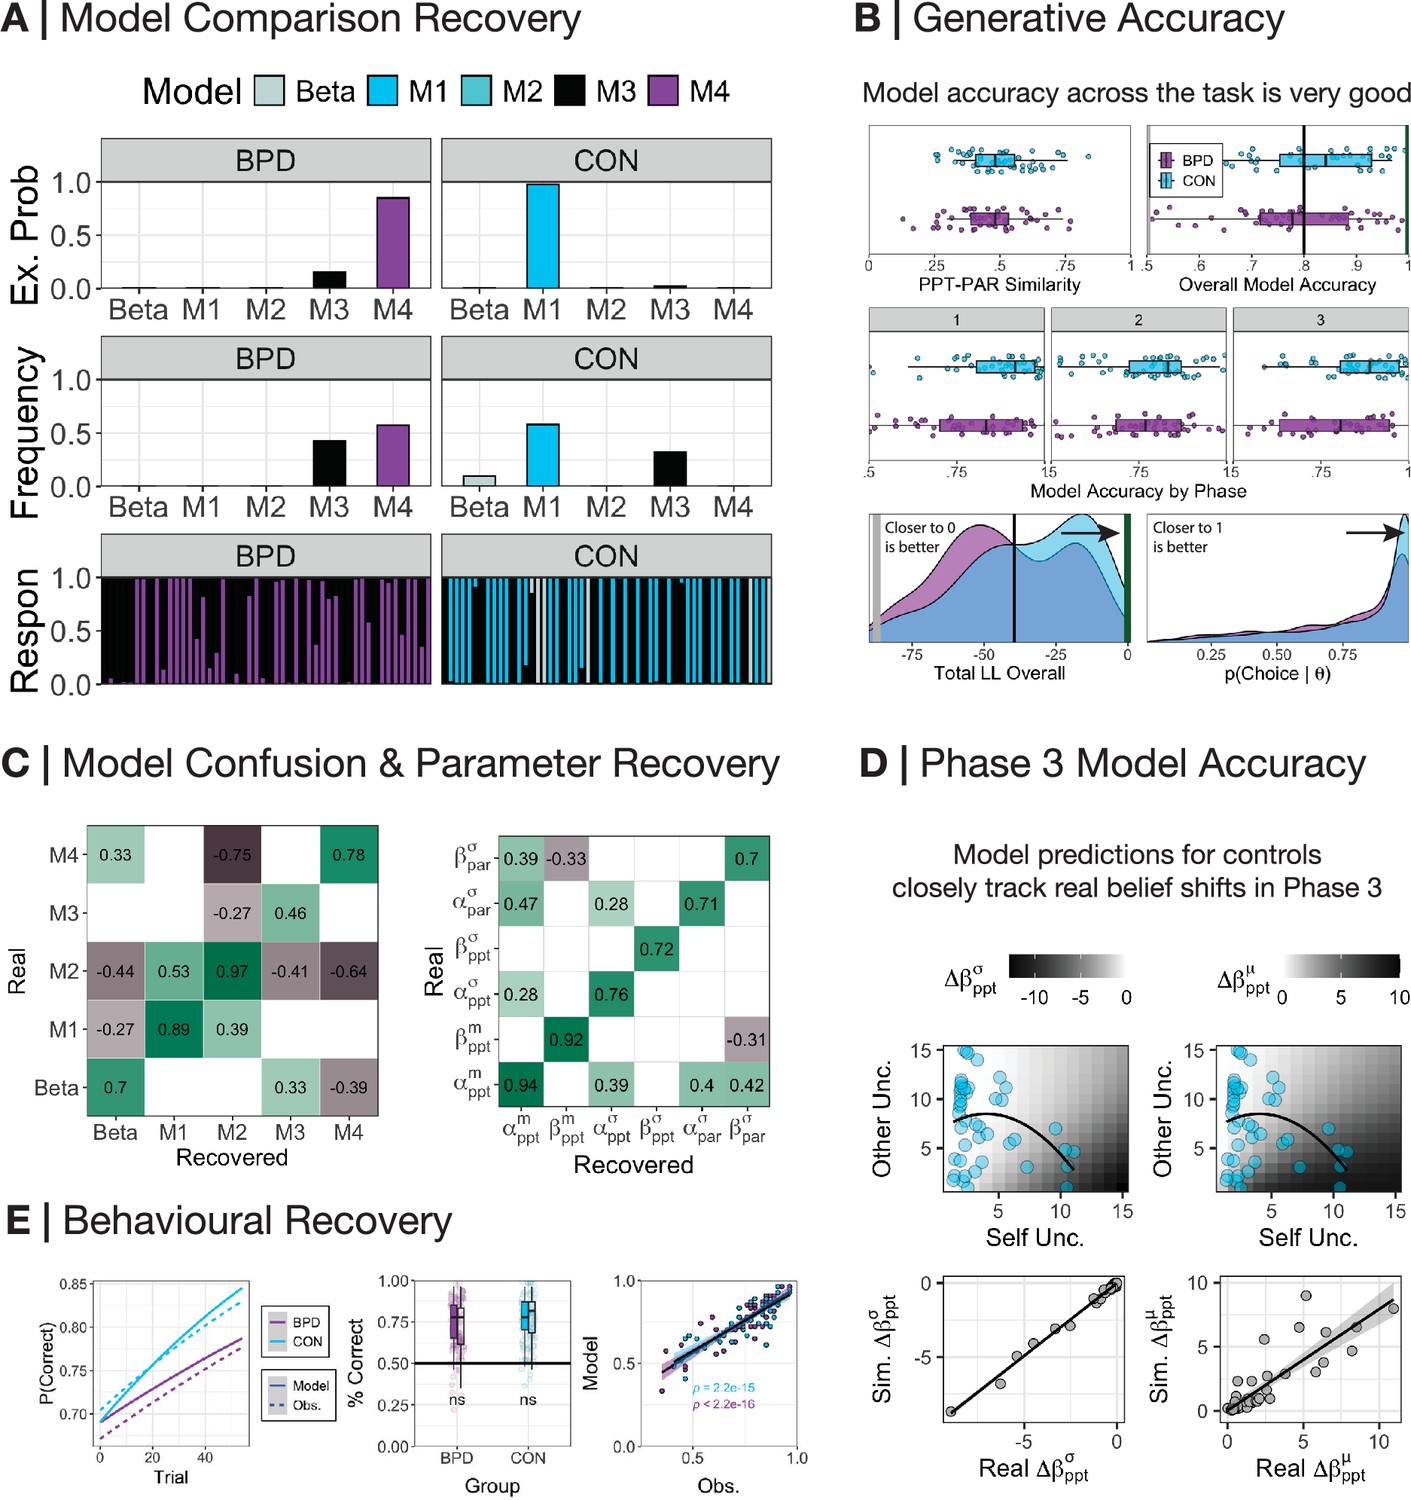
(A) We used random-effects hierarchical model fitting and comparison to jointly estimate group-level and individual-level parameters on simulated data (Piray et al., 2019). CON participants were best fit by M1, whereas borderline personality disorder (BPD) participants were best fit by M4. (B) Server matching between participant and partner in phase 2 was successful, with participants being approximately 50% different to their partners with respect to the choices each would have made on each trial in phase 2 (mean similarity = 0.49, SD = 0.12). Model accuracy across the task was very high (mean accuracy = 0.8, SD = 0.12). Model accuracy within each phase was very high (mean accuracy[phase1]=0.83, SD[phase1]=0.16; mean accuracy[phase2]=0.77, SD[phase2]=0.14; mean accuracy[phase3]=0.82, SD[phase3]=0.17). Log-likelihood values were also well above what would be expected had the model fitted the data by chance (median = −40.68, SD = 22.7; chance value = −87.33). Choice probabilities generated by the model on each trial were also well above chance thresholds (median = 0.91, SD = 0.24; chance value = 0.5). (C) The Spearman association between the responsibility allocated for each participant during real and recovered model comparison was highly correlated on the diagonal. There was some correlation between M1 and M2, but this was due to M2 being a nested model of M1, sharing similar free parameters; this was not worrying in light of excellent model identifiability overall in the synthetic comparison. Associations between real and recovered parameters from the dominant model within each BPD and CON participants were very high with few cross correlations on the off-diagonal. In both confusion and parameter recovery matrices, white spaces indicate insignificant associations at the p>0.01 level. (D) (Top panel) The relationship between uncertainty over the self and uncertainty over the other with respect to the change in the precision (left) and median shift (right) in phase 3 relative reward preferences (). CON participant self and other uncertainty is overlaid onto the plot to demonstrate the degree to which their beliefs should change in phase 3 according to the model. (Bottom panel) Correlating the model-predicted median shift in beliefs and derived change in beliefs between phases 1 and 3 demonstrates a very strong association (r=0.88, p<0.001). For the purposes of visualisation, we cap real and simulated values <15 for compactness, although the true correlation reported is irrelevant to this visual constraint. (E) (Left panel) We overlay model-predicted (solid line) and real observed (dashed line) trial-by-trial probabilities extracted from a linear model for a correct prediction by participants. For raw trial-by-trial updating, see Figure 3—figure supplement 1. Both closely match. (Middle panel) There was no significant difference (ns) for BPD and CON participants with respect to their total correct answers over phase 2. (Right panel) Model-predicted and real observations in phase 2 total scores were highly correlated in both groups (CON r=0.84, p<0.001; BPD r=0.89, p<0.001).
Figure 3—figure supplement 1
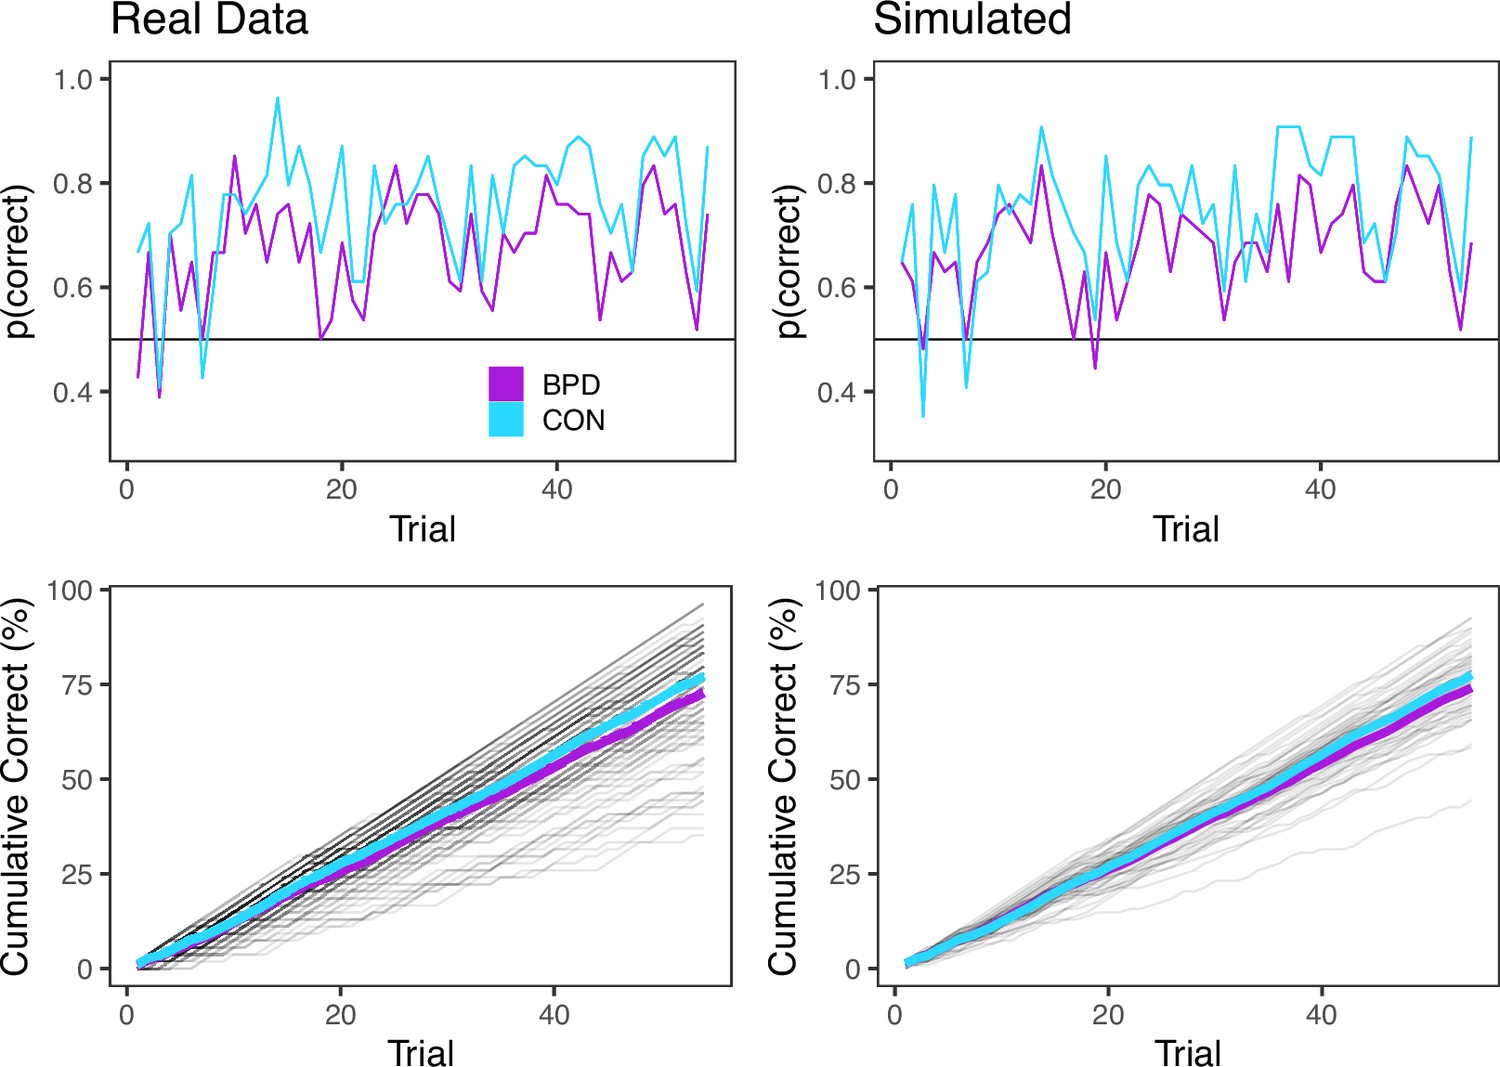
Generative Capacity of the Winning Model.
(Top panels) Raw trial-wise probability of correct responses from real and model-simulated observations for each group. Probabilities were approximated by grouping by trial across each group, summing the total correct responses and dividing by 54. (Bottom panel) Cumulative percentage of correct predictions in phase 2 for each group is shown as thick solid lines. Individual cumulative scores are depicted as thin translucent lines.
Figure 3—figure supplement 2
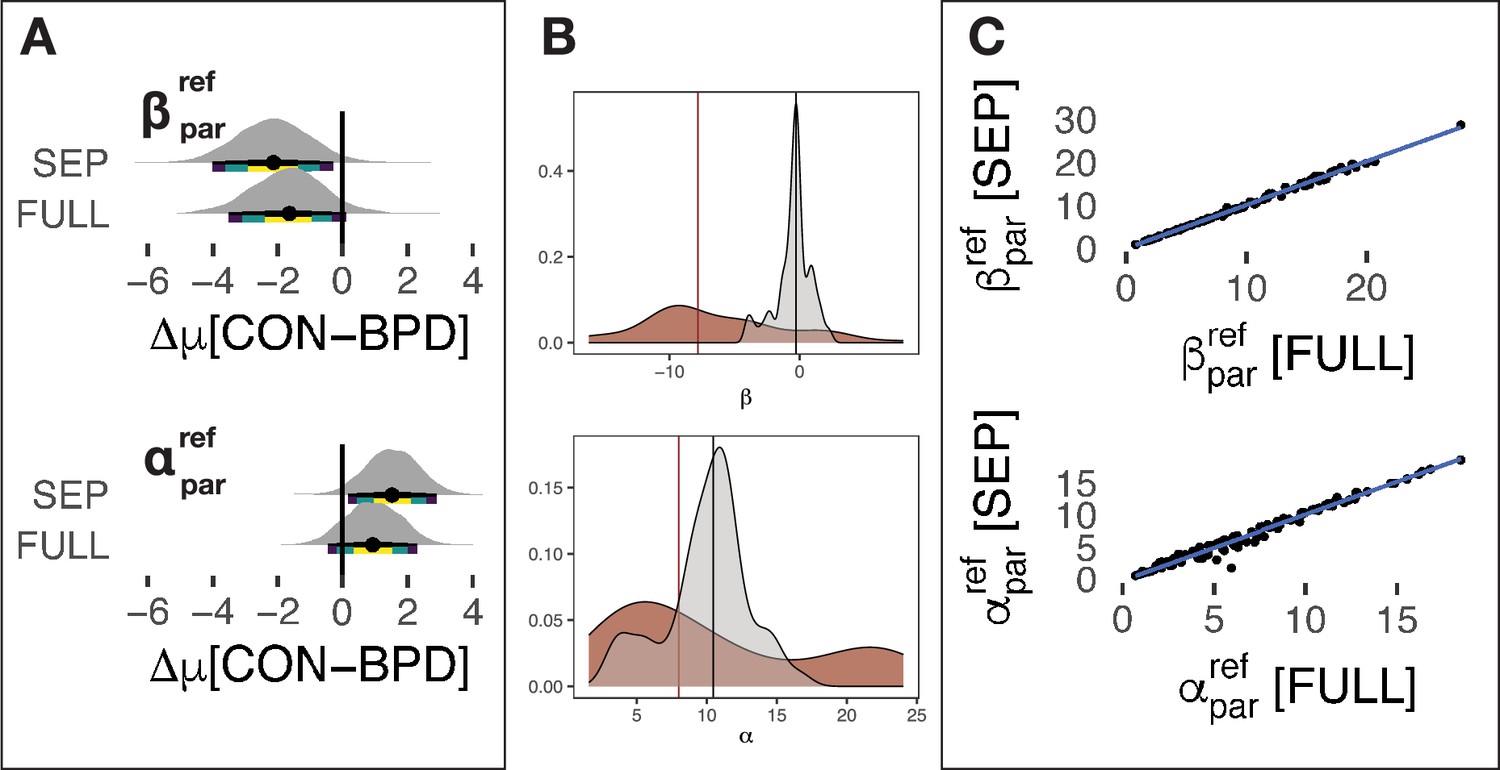
Phase 2 prior belief flexibility following forced hierarchical fit of model M1 to all (FULL) participants and separate (SEP) groups.
(A) Bayesian general linear model estimates of the differences in the mean of (top) and (bottom) between CON and borderline personality disorder (BPD) participants for both full (: coefficient = –1.7, 90%HDI = –3.1,–0.3; coefficient = 0.9, 90%HDI = –0.1, 2.0) and separate (: coefficient = –2.1, 90%HDI = –3.5,–0.7; coefficient = 1.5, 90%HDI = 0.4, 2.6) hierarchical fits. was consistently larger in BPD participants across both SEP and FULL fits. (B) The need for a new central tendency in phase 2 in BPD participants is further emphasised by examining the central tendency of prior beliefs about partners under model M4 for BPD participants (also see Figure 3—figure supplement 3). Displayed is the distribution of individual parameter estimates (; left and ; right) for BPD participants in phase 2. Prosocial-competitive beliefs () have a large shifted central tendency between self (red) and other prior beliefs (grey). In contrast, individualistic beliefs () have a relatively smaller self-other discrepancy. (C) The statistical agreement in the estimation of (top) and (bottom) for both SEP and FULL M1 models. Distortion is minimal (but non-zero).
Figure 3—figure supplement 3
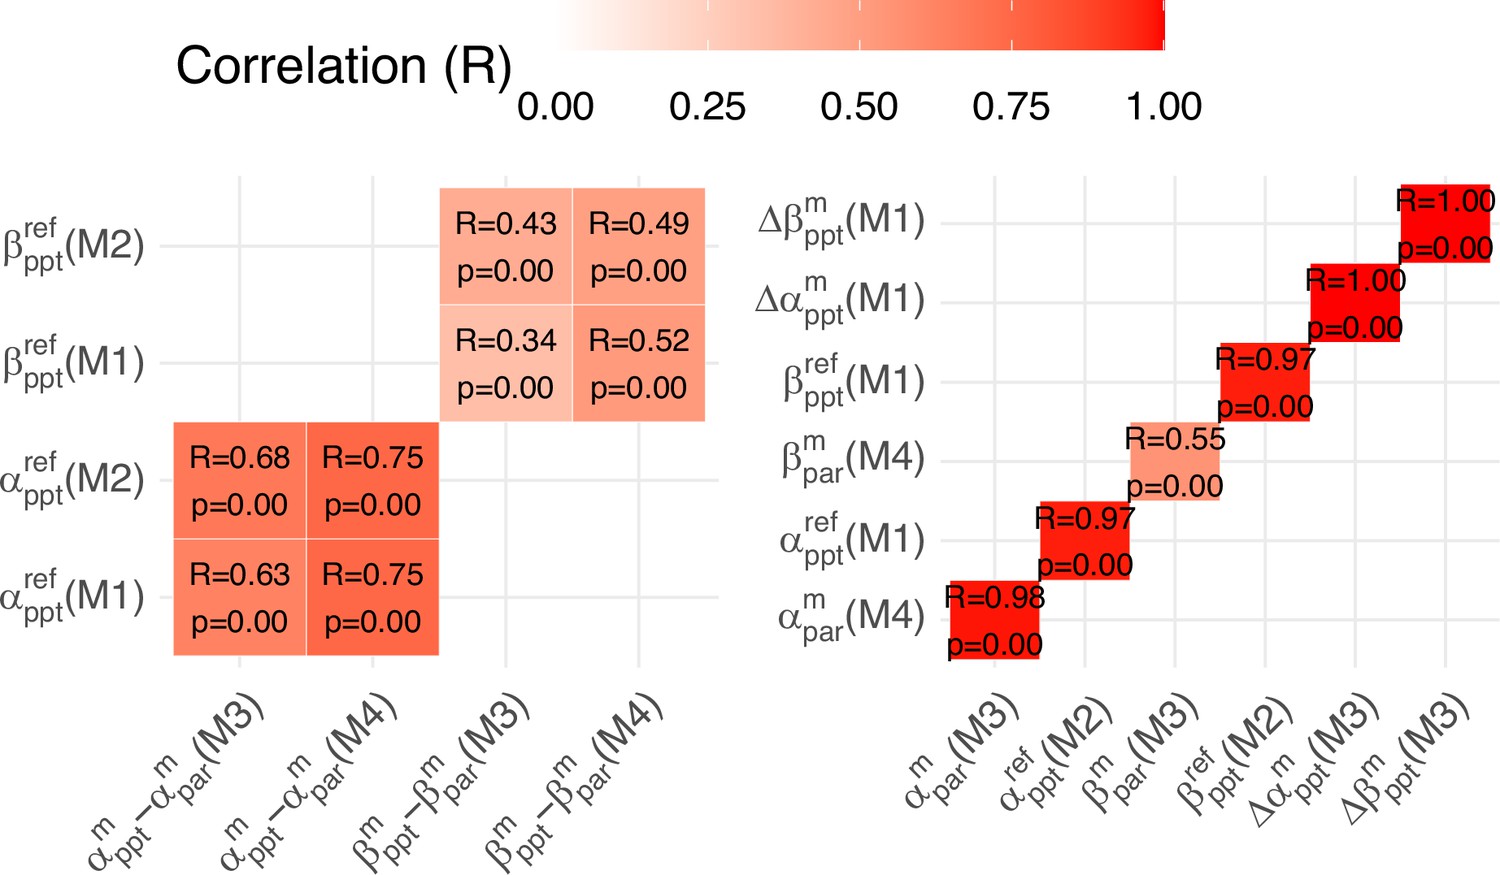
Pearson correlation between parameters of equivalence across models M1-M4.
All models were hierarchically fitted (using the HBM package; Piray et al., 2019) without comparison to each group. We then compared prior flexibility over others in M1 and M2 (which allow for self-insertion) to the absolute difference in median shift of beliefs between phase 1 and phase 2 under M3 and M4 (which do not allow for self-insertion). We also correlated prior flexibility over others in phase 2 estimated under M1 and M2, as well as central tendency over new priors over others under M3 and M4. We find excellent convergence between approximated parameters of equivalent meaning across models.
Figure 3—figure supplement 4

Simulation of phase 2 priors that may be drawn from a memory of an aversive other vs from the self alone.
We can imagine a scenario where a prosocial participant (typical of borderline personality disorder [BPD] and CON) has a strong impression of another from memory who is particularly aversive (competitive). Using a mixture of the median belief of the self ( classified in phase 1) and a mixture of the belief about how this notional competitive other () would act, we can create a causal model of how priors in phase 2 about an anonymous partner might draw on different sources. Here, the median of the prior over the partner in phase 2 is a mixture of median belief of self and ‘notional’ other []. An equal mixture of self and other belief would equally explain the naïve prior BPD participants hold over their partner in phase 2. However, as mentioned, given that BPD participants hold a naïve prior even when they are themselves competitive goes against this hypothesis. It is worth testing.
Tables
Table 1
Demographics of participants.
CTQ = Childhood Trauma Questionnaire, MZQ = Mentalisation Questionnaire, RGPTSB = Revised Green Paranoid Thoughts Scale (Persecutory Subscale), RGPTSA = Revised Green Paranoid Thoughts Scale (Referential Subscale), CAMSQ = Certainty About Mental States Questionnaire. ETMCQ = Epistemic Trust, Mistrust, and Credulity Questionnaire, M=Male, F=Female, O=Other. For continuous variables, all means are stated with corresponding standard deviation in brackets. Significant differences are highlighted in bold.
| BPD | CON | Test | |
|---|---|---|---|
| DEMOGRAPHICS | |||
| n | 50 | 53 | |
| Age | 31.2 [11.16] | 30.0 [8.64] | t=−0.61; p=0.54 |
| Gender (M:F:O) | 8:39:2 | 14:36:3 | t=−1.25; p=0.21 |
| Education (years) | 14.39 [3.38] | 14.8 [3.10] | t=0.62; p=0.53 |
| Soc. Dep. Index | 12834.94 [7911] | 11967.63 [7567] | t=−0.54; p=0.59 |
| PSYCHOMETRICS | |||
| RGPTSB | 14.53 [1.07] | 5.33 [0.72] | t=4.67; p<0.001 |
| RGPTSA | 16.79 [0.96] | 7.29 [0.70] | t=6.47; p<0.001 |
| CTQ (trauma) | 64.88 [0.90] | 42.27 [0.78] | t=6.48; p<0.001 |
| CAMSQ (self) | 4.95 [1.42] | 5.02 [0.22] | t=−0.07; p=0.94 |
| CAMSQ (other) | 5.32 [1.42] | 5.15 [0.17] | t=−0.71; p=0.48 |
| MZQ (mentalizing) | 55.94 [0.59] | 38.16 [0.85] | t=9.39; p<0.001 |
| ETMCQ (Mistrust) | 5.25 [0.93] | 4.21 [0.84] | t=5.27; p<0.001 |
| ETMCQ (Trust) | 4.86 [1.13] | 5.04 [0.86] | t=−0.87, p=0.39 |
| ETMCQ (Credulity) | 4.35 [1.06] | 3.34 [0.77] | t=4.14; p<0.001 |
Table 2
Parameter and model specification.
Grey shading = parameters relevant to representations of the self (ppt). Orange shading = parameters relevant to representations of the other (par). Free = parameters are random variables to fit through model inversion. Derived = parameter is calculated from latent values within the model. SD = standard deviation.
| M1 | M2 | M3 | M4 | Beta | Description | Type | Phase | |
|---|---|---|---|---|---|---|---|---|
| X | X | X | X | Median of absolute reward preferences | Free | 1 | ||
| X | X | X | X | X | Median of relative reward preferences | Free | 1 | |
| X | X | X | X | SD of absolute reward preferences | Free | 1 | ||
| X | X | X | X | X | SD of relative reward preferences | Free | 1 | |
| X | X | Prior beliefs median over absolute reward preferences | Free | 2 | ||||
| X | X | Prior beliefs median over relative reward preferences | Free | 2 | ||||
| X | X | X | X | Prior beliefs SD over absolute reward preferences | Free | 2 | ||
| X | X | X | X | X | Prior beliefs SD over relative reward preferences | Free | 2 | |
| X | X | X | Posterior belief median over absolute reward preferences | Derived | 2 | |||
| X | X | X | X | Posterior belief median over relative reward preferences | Derived | 2 | ||
| X | X | X | Posterior belief SD over absolute reward preferences | Derived | 2 | |||
| X | X | X | X | Posterior belief SD over relative reward preferences | Derived | 2 | ||
| X | X | Shifted median of absolute reward preferences | Derived | 3 | ||||
| X | X | X | Shifted median of relative reward preferences | Derived | 3 | |||
| X | X | Shifted SD of absolute reward preferences | Derived | 3 | ||||
| X | X | X | Shifted SD of relative reward preferences | Derived | 3 | |||
| No. Free | 6 | 6 | 8 | 8 | 3 | |||
Additional files
-
Supplementary file 1
Supplementary Table 1, SVO Choices.
Option pair rewards for each phase and their corresponding ‘type’. Within phase, the order of trials was randomised. P=Prosocial, I=Individualistic, C=Competitive. S1=reward to self for option 1. S2=reward to self for option 2. O1=reward to other for option 1. O2=reward to other for option 2.
- https://cdn.elifesciences.org/articles/104008/elife-104008-supp1-v1.docx
-
Supplementary file 2
Supplementary Table 2, Individual Model Parameters.
Model parameters of M1-M4 following independent hierarchical fitting for all participants.
- https://cdn.elifesciences.org/articles/104008/elife-104008-supp2-v1.docx
-
Supplementary file 3
Supplementary Table 3, Individual Parameter Relationships.
Random-effect linear relationships between DKL, trial, group, and preferences type for each model (M1-M4) following independent hierarchical fitting for all participants. Estimates are the scaled change in DKL as a result of each fixed effect. ID was used as a random variable to control for within-subject effects. Group effects (CON vs borderline personality disorder [BPD]) were analysed for the DKL within each preference type.
- https://cdn.elifesciences.org/articles/104008/elife-104008-supp3-v1.docx
-
Supplementary file 4
Supplementary Table 4, Network Correlations.
Bootstrapped results with their 95% CI with and without group status regressed against psychometric variables.
- https://cdn.elifesciences.org/articles/104008/elife-104008-supp4-v1.docx
-
Supplementary file 5
Reaction times in the Intentions Game.
- https://cdn.elifesciences.org/articles/104008/elife-104008-supp5-v1.docx
-
MDAR checklist
- https://cdn.elifesciences.org/articles/104008/elife-104008-mdarchecklist1-v1.docx
Download links
A two-part list of links to download the article, or parts of the article, in various formats.
Downloads (link to download the article as PDF)
Open citations (links to open the citations from this article in various online reference manager services)
Cite this article (links to download the citations from this article in formats compatible with various reference manager tools)
Self-other generalisation shapes social interaction and is disrupted in borderline personality disorder
eLife 14:RP104008.
https://doi.org/10.7554/eLife.104008.4


