Human formin FHOD3-mediated actin elongation is required for sarcomere integrity in cardiomyocytes
- Department of Chemistry and Biochemistry, University of California, Los Angeles, United States
- Department of Molecular, Cell, and Developmental Biology, University of California, Los Angeles, United States
- Eli and Edythe Broad Center of Regenerative Medicine and Stem Cell Research, University of California, Los Angeles, United States
- Department of Computational Medicine, University of California, Los Angeles, United States
- Department of Medicine, Divison of Pulmonary and Critical Care Medicine, Geffen School of Medicine, University of California, Los Angeles, United States
- Molecular Biology Institute, University of California, Los Angeles, United States
- Department of Molecular Physiology, The Jikei University School of Medicine, Japan
Figures
Figure 1 with 1 supplement
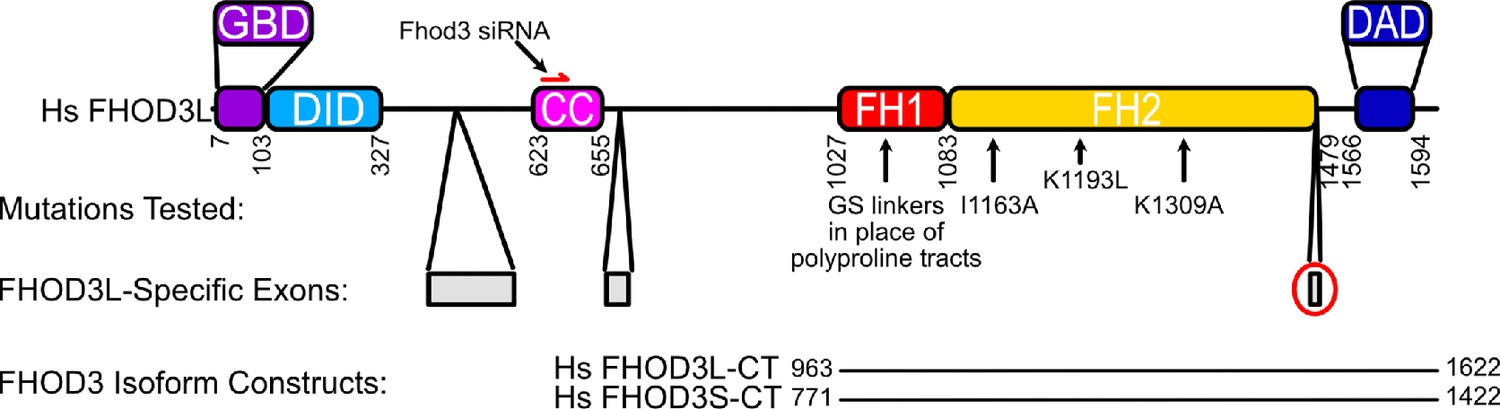
Domain structure of human FHOD3.
GBD = GTPase binding domain, DID = diaphanous inhibitory domain, CC = coiled coil (putative), FH = formin homology, DAD = diaphanous autoregulatory domain. Mutations tested in this study are indicated with black arrows. Numbers correspond to the FHOD3L sequence (Uniprot isoform 4). The FHOD3L-CT construct spans residues 963–1622, including the FH1 domain, FH2 domain, and tail. The FHOD3S-CT construct spans residues 771–1422 (Uniprot isoform 1 numbering). FHOD3L-specific exons are in gray. The eight-residue exon (T(D/E)5XE) that distinguishes FHOD3L-CT from FHOD3S-CT is circled in red.
Figure 1—figure supplement 1
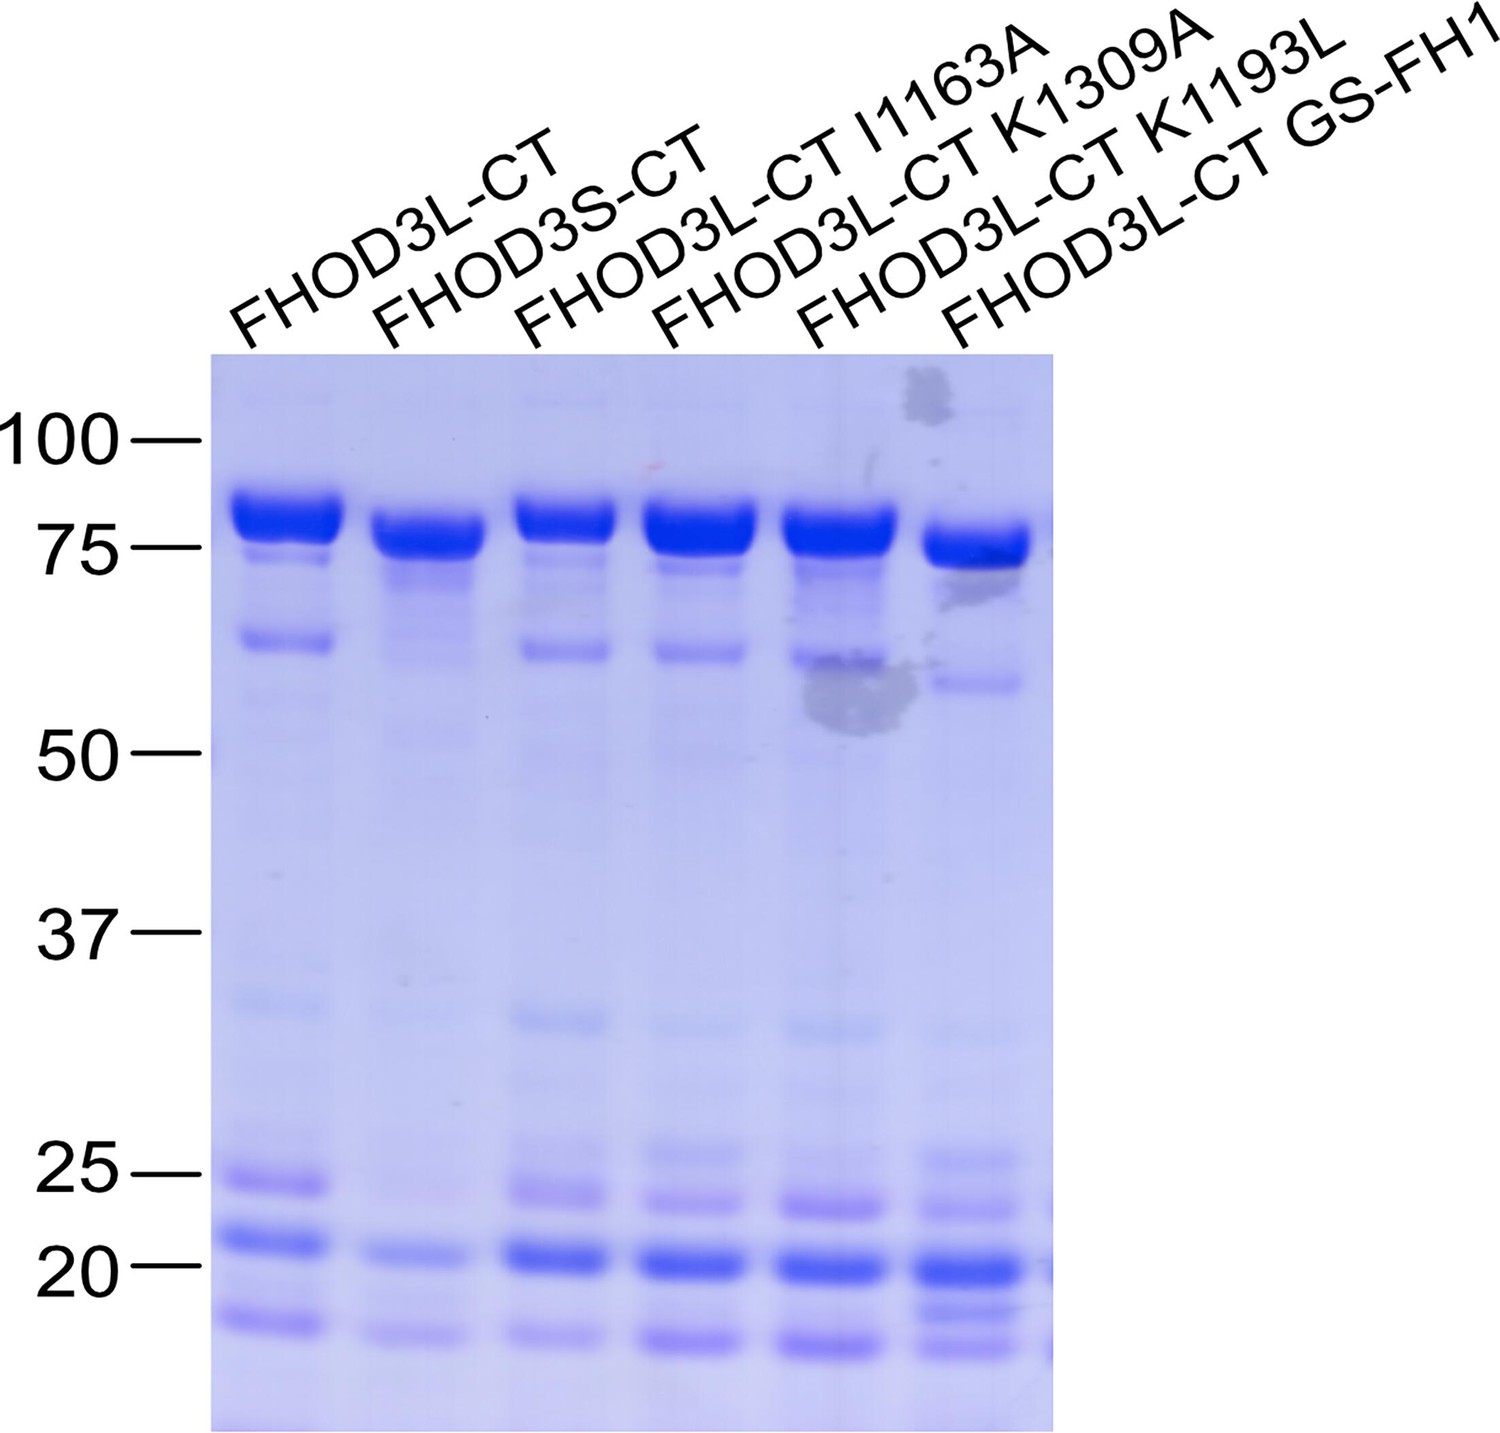
Coomassie-stained polyacrylamide gel of purified FHOD3 constructs.
Lower molecular weight contaminants were difficult to remove, were relatively consistent for each construct, and had no detectable impact on FHOD activity.
-
Figure 1—figure supplement 1—source data 1
PDF file containing original file for Coomasie-stained SDS-PAGE gel displayed in Figure 1—figure supplement 1, indicating the relevant bands and treatments.
- https://cdn.elifesciences.org/articles/104048/elife-104048-fig1-figsupp1-data1-v1.pdf
-
Figure 1—figure supplement 1—source data 2
Original file for Coomasie-stained SDS-PAGE gel displayed in Figure 1—figure supplement 1.
- https://cdn.elifesciences.org/articles/104048/elife-104048-fig1-figsupp1-data2-v1.tif
Figure 2 with 3 supplements
Biochemical characterization of human FHOD3L.
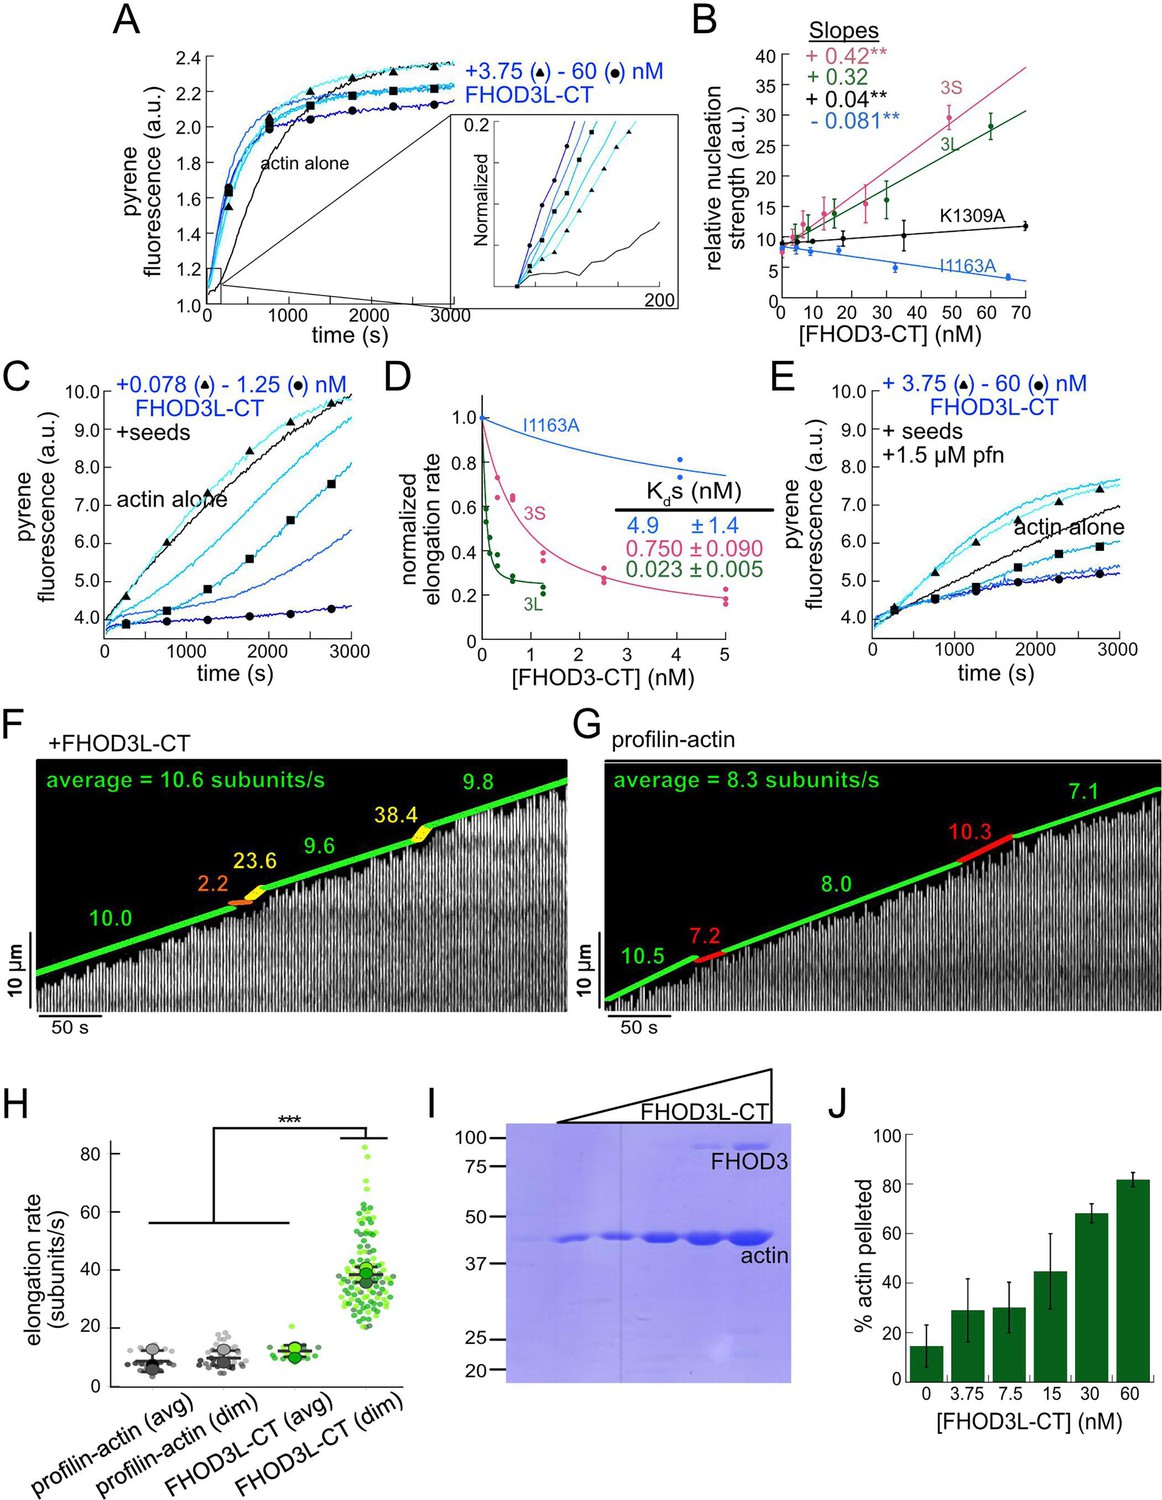
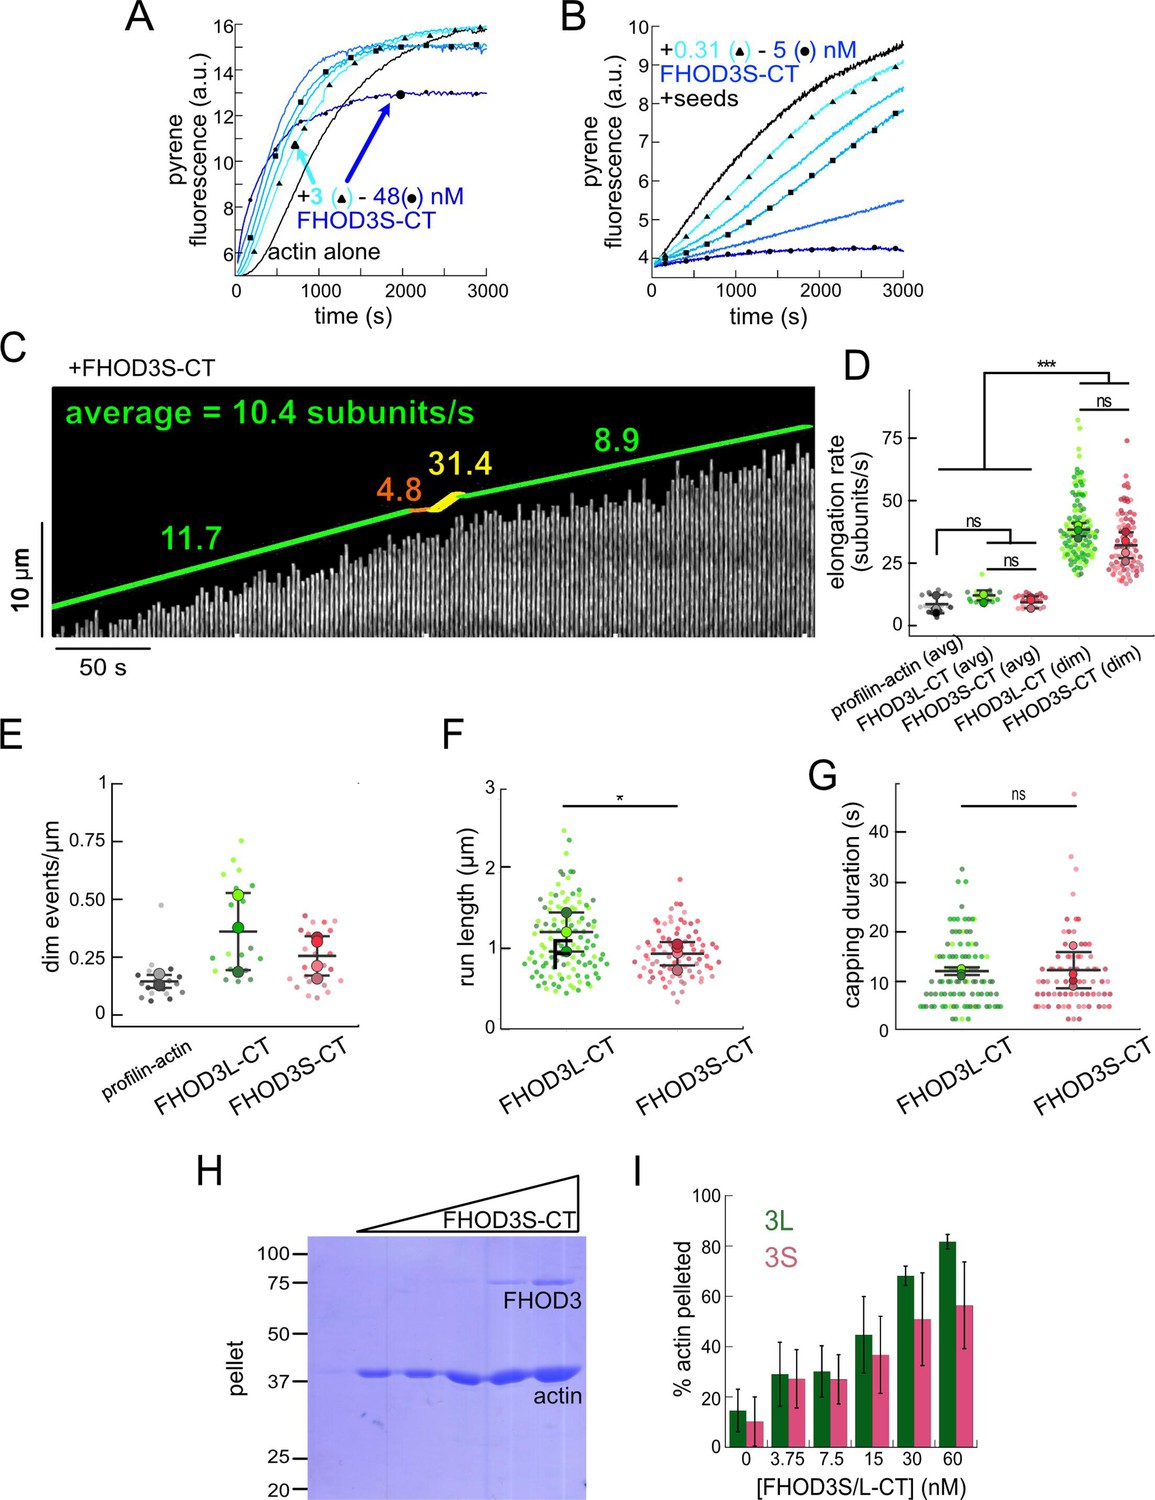
(A) Assembly of 4 µM actin (5% pyrene-labeled) and the indicated concentrations of FHOD3L-CT from a twofold dilution series. (Higher concentrations of FHOD3L-CT are darker shades of blue. Symbols reflect the highest, middle, and lowest concentrations tested. In this case, circle = 60 nM, square = 15 nM, and triangle = 3.75 nM FHOD3LT-CT.) The inset shows the first 200 s of data normalized to the plateau of actin alone. (B) Relative nucleation activities of FHOD3L-CT (n=5), FHOD3S-CT (n=4), FHOD3L-CT K1309A (n=3), and I1163A (n=3). Nucleation strength is described by the rate of assembly (i.e. slopes from traces like those in A), at an early timepoint, when nucleation dominates (t1/8), as a function of formin added. Data points are means, and error bars are standard deviations. Slopes reported are the average slopes of independent experiments. The asterisks indicate significance of difference from FHOD3L-CT (see below for details). (C) Barbed-end elongation assay. Final conditions were 0.25 µM F-actin seeds (~0.1 nM barbed ends), 0.5 µM actin (10% pyrene-labeled), and indicated concentrations of FHOD3L-CT. (D) Quantification of barbed-end affinity for FHOD3L-CT (from C), FHOD3S-CT (from Figure 2—figure supplement 2B), and FHOD3L-CT I1163A (see Figure 2—figure supplement 1C for extended axes). Raw data are shown, and lines are fit to all data points. The Kds reported are the averages of three independent trials (n=3, each; mean ± SD). (E) Barbed-end elongation assay with profilin. Final conditions as in (C) plus 1.5 µM Schizosaccharomyces pombe profilin. (F) Kymograph of a growing filament from a total internal reflection fluorescence (TIRF) assay with FHOD3L-CT. Conditions: 1 µM actin (10%-Alexa Fluor 488-labeled), 5 µM Hs profilin-1, and 0.1 nM FHOD3L-CT. The green lines indicate bright regions of growing filament. The yellow lines represent dim regions. The orange line is a pause. Rates calculated for each region are reported as subunits/s. (G) Kymograph of a growing filament from a TIRF assay without added FHOD3L-CT. Conditions: 1 µM actin (10%-Alexa Fluor 488-labeled), 5 µM Hs profilin-1. The green lines indicate bright regions of growing filament. The red lines represent dim regions. Rates calculated for each region are reported as subunits/s. (H) Elongation rates from TIRF assays. Average elongation rates (10–100 s of seconds) and elongation rates from brief (1–10 s) dim regions are shown separately (n=21, profilin-actin [avg]; n=27 profilin-actin [dim]; n=20, FHOD3L-CT [avg]; n=112, FHOD3L-CT [dim]; 3 channels for all samples; mean ± SD). (I) Coomassie-stained polyacrylamide gel of pellet fractions from low-speed bundling assays with 5 µM actin and 0–60 nM FHOD3L-CT. (J) Quantification of bundling from (I) via densitometry (n=3 each group; mean ± SD). *p<0.05, **p<0.001, ***p<0.0001. p-Values were determined by one-way ANOVA with post hoc Tukey test.
-
Figure 2—source data 1
PDF file containing original file for Coomasie stained SDS-PAGE gels displayed in Figure 2I, Figure 2—figure supplement 2H, indicating the relevant bands and treatments.
- https://cdn.elifesciences.org/articles/104048/elife-104048-fig2-data1-v1.pdf
-
Figure 2—source data 2
Original file for Coomasie-stained SDS-PAGE gels displayed in Figure 2I, Figure 2—figure supplement 2H.
- https://cdn.elifesciences.org/articles/104048/elife-104048-fig2-data2-v1.tif
Figure 2—figure supplement 1
Extended biochemical characterization of human FHOD3L.
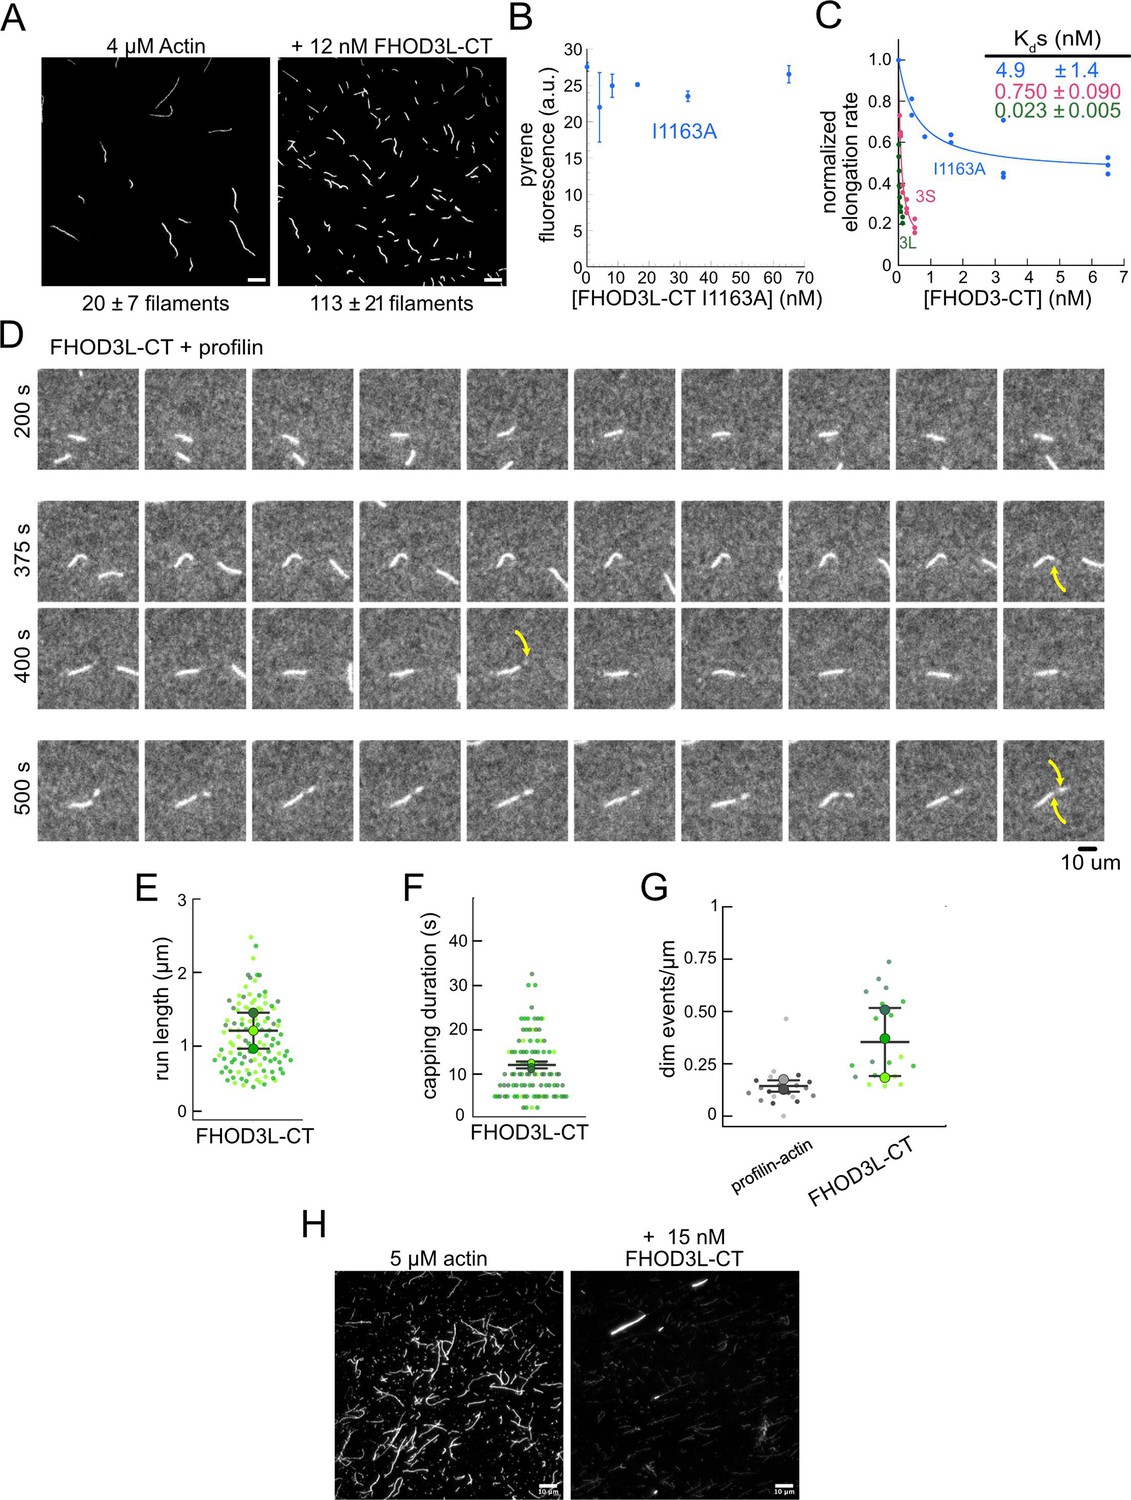
(A) Actin polymerized in the absence or presence of 12 nM FHOD3L-CT, stabilized with fluorescent phalloidin diluted to 5 nM (n=3, each; mean ± SD). Scale bars, 10 µm. (B) Pyrene fluorescence readings of 4 µM actin filaments (5% pyrene-labeled) incubated with different concentrations of FHOD3L-CT I1163A for 5 min (n=2; mean ± SD). (C) Quantification of barbed-end affinity (from Figure 2C and D) with axes extended. (D) Time-lapse images from total internal reflection fluorescence (TIRF) microscopy. Conditions: 1 µM actin (10%-Alexa Fluor 488-labeled), 5 µM Hs profilin-1 ±0.1 nM FHOD3L-CT. Yellow arrows indicate the beginning and end of the dim portion of the filament elongated by FHOD3L-CT. 2.5 s/frame. Scale bar, 10 µm. (E) Quantification of (dim) run lengths for FHOD3L-CT TIRF assays. (F) Duration of pauses observed before bursts in TIRF assays. (For E–F, n=112, FHOD3L-CT [dim]; 3 flow channels for all samples; mean ± SD.) (G) Comparison of dim event frequencies as a function of filament length. (H) Epifluorescence micrographs of phalloidin-stabilized filaments from low-speed bundling assays. Conditions: 5 µM actin without or with 15 nM FHOD3L-CT, diluted to 5 nM actin after centrifugation. Scale bars, 10 µm.
Figure 2—figure supplement 2
Comparison of FHOD3S to FHOD3L.
(A) Assembly of 4 µM actin (5% pyrene-labeled) and the indicated concentrations of FHOD3S from a twofold dilution series. (Higher concentrations of FHOD3L-CT are darker shades of blue. Symbol reflects the highest, middle, and lowest concentration tested. In this case, circle = 48 nM, square = 12 nM, and triangle = 3 nM FHOD3LT-CT.) (B) Barbed-end elongation assay. Final conditions: 0.25 µM F-actin seeds (~0.1 nM barbed ends), 0.5 µM G-actin (10% pyrene-labeled), and 312.5 pM-5 nM FHOD3S-CT. (C) Kymograph of a growing filament from a total internal reflection fluorescence (TIRF) assay with FHOD3S-CT. Conditions: 1 µM actin (10%-Alexa Fluor 488-labeled), 5 µM Hs profilin-1, and 1 nM FHOD3S-CT. The green lines indicate bright regions of growing filament. The yellow lines represent dim regions. The orange lines are pauses. Rates calculated for each region are reported as subunits/s. (D) Elongation rates from TIRF assays. Average elongation rates (over 10 s of seconds) and formin-mediated elongation rates (dim) are shown separately. Conditions: 1 µM actin (10%-Alexa Fluor 488-labeled), 5 µM Hs profilin-1 ±0.1 nM FHOD3L-CT or 1 nM FHOD3S-CT (n=21, profilin-actin; n=20, 3L [avg]; n=24, 3S [avg], n=112, 3L [dim], n=78, 3S [dim]; 4 flow channels for 3S, 3 flow channels for all others; mean ± SD, p-values by one-way ANOVA with post hoc Tukey test). (E) Comparison of dim event frequencies as a function of filament length. (F) Quantification of (dim) run lengths for FHOD3S/L-CT TIRF assays (n=97, FHOD3L-CT; n=73, FHOD3S-CT; 3 flow channels for 3L, 4 flow channels for 3S; mean ± SD, p-values by Mann-Whitney U test). (G) Duration of capping events, i.e., pauses before bursts, by FHOD3L-CT vs FHOD3S-CT observed by TIRF microscopy (n=97, FHOD3L-CT; n=73, FHOD3S-CT; 3 flow channels for 3L, 4 flow channels for 3S; mean ± SD, p>0.05 by Mann-Whitney U test). (H) Coomassie-stained polyacrylamide gel of pellet fractions from low-speed bundling assays with 5 µM actin and 0–60 nM FHOD3S-CT. (I) Comparison of bundling for FHOD3S/L-CT via densitometry (n=3 each group; mean ± SD). *p<0.05, ***p<0.0001.
Figure 2—video 1
FHOD3S/L-CT pause actin filament elongation before brief acceleration.
Total internal reflection fluorescence (TIRF) elongation assays with either 100 pM FHOD3L-CT wild-type (WT) or 1 nM FHOD3S-CT WT. Conditions as in Figure 2F.
Figure 3 with 2 supplements
Biochemical validation of function-separating mutants.
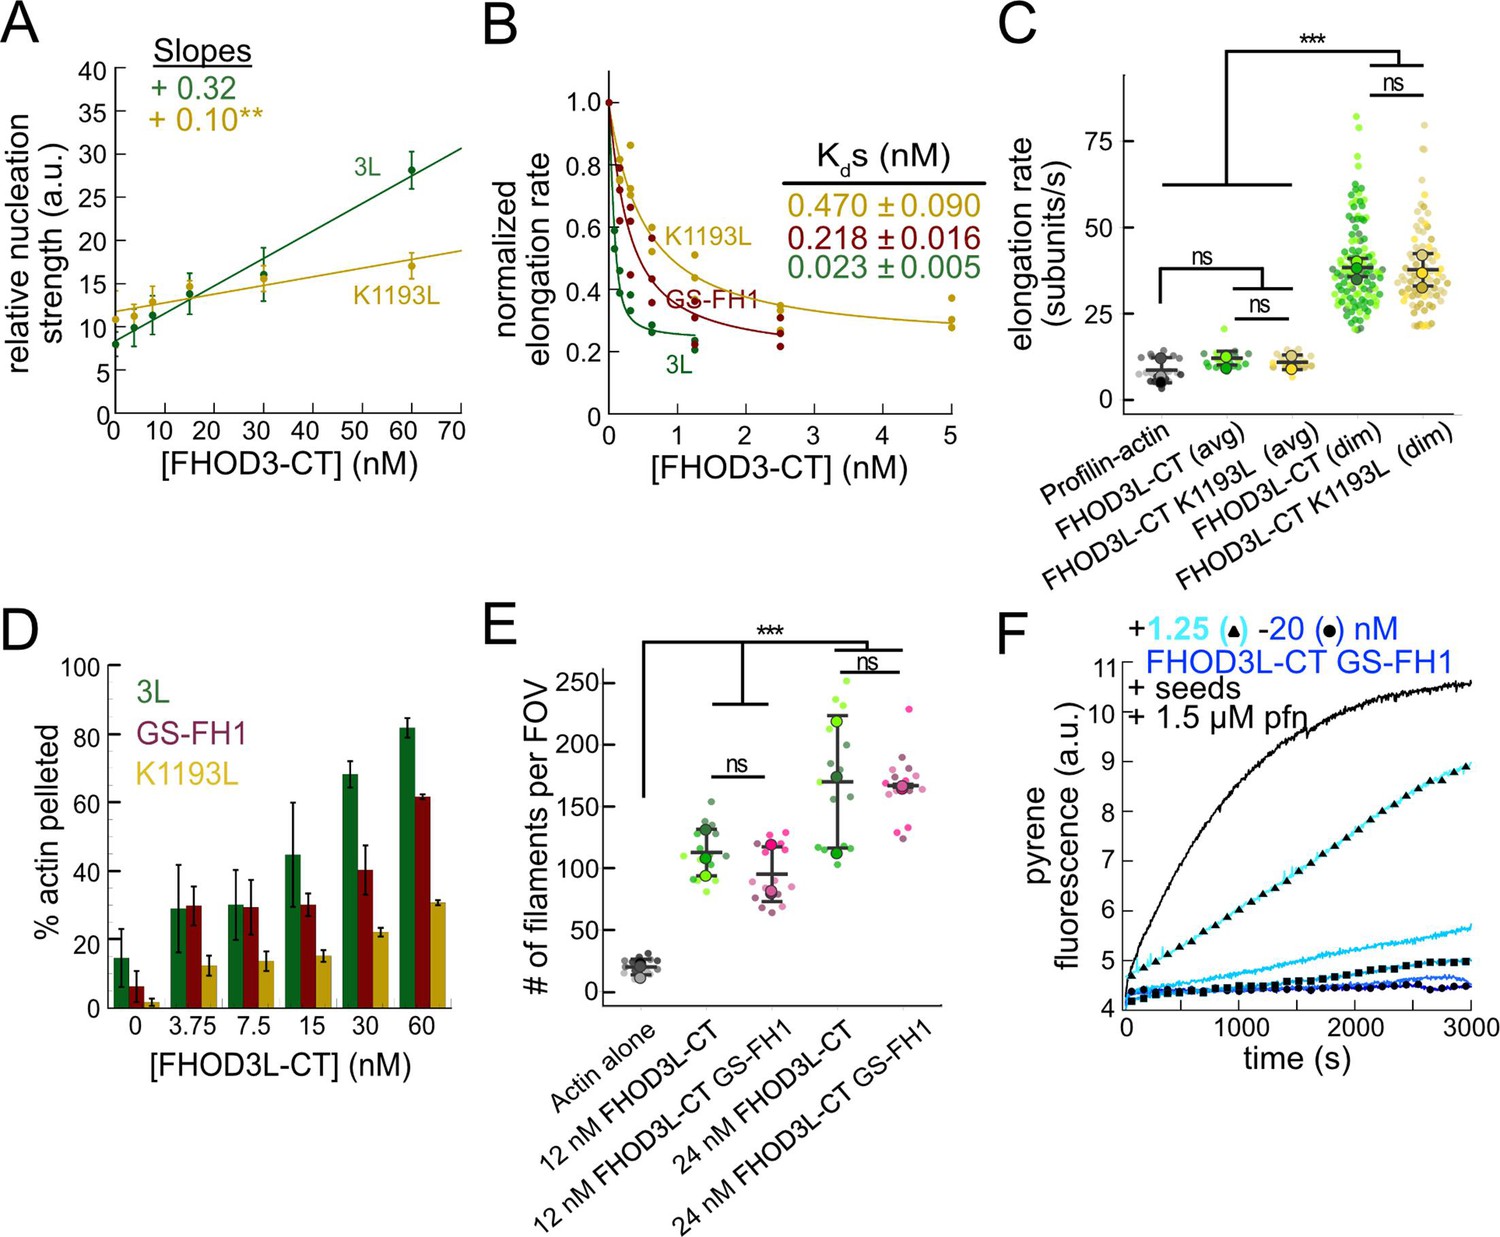
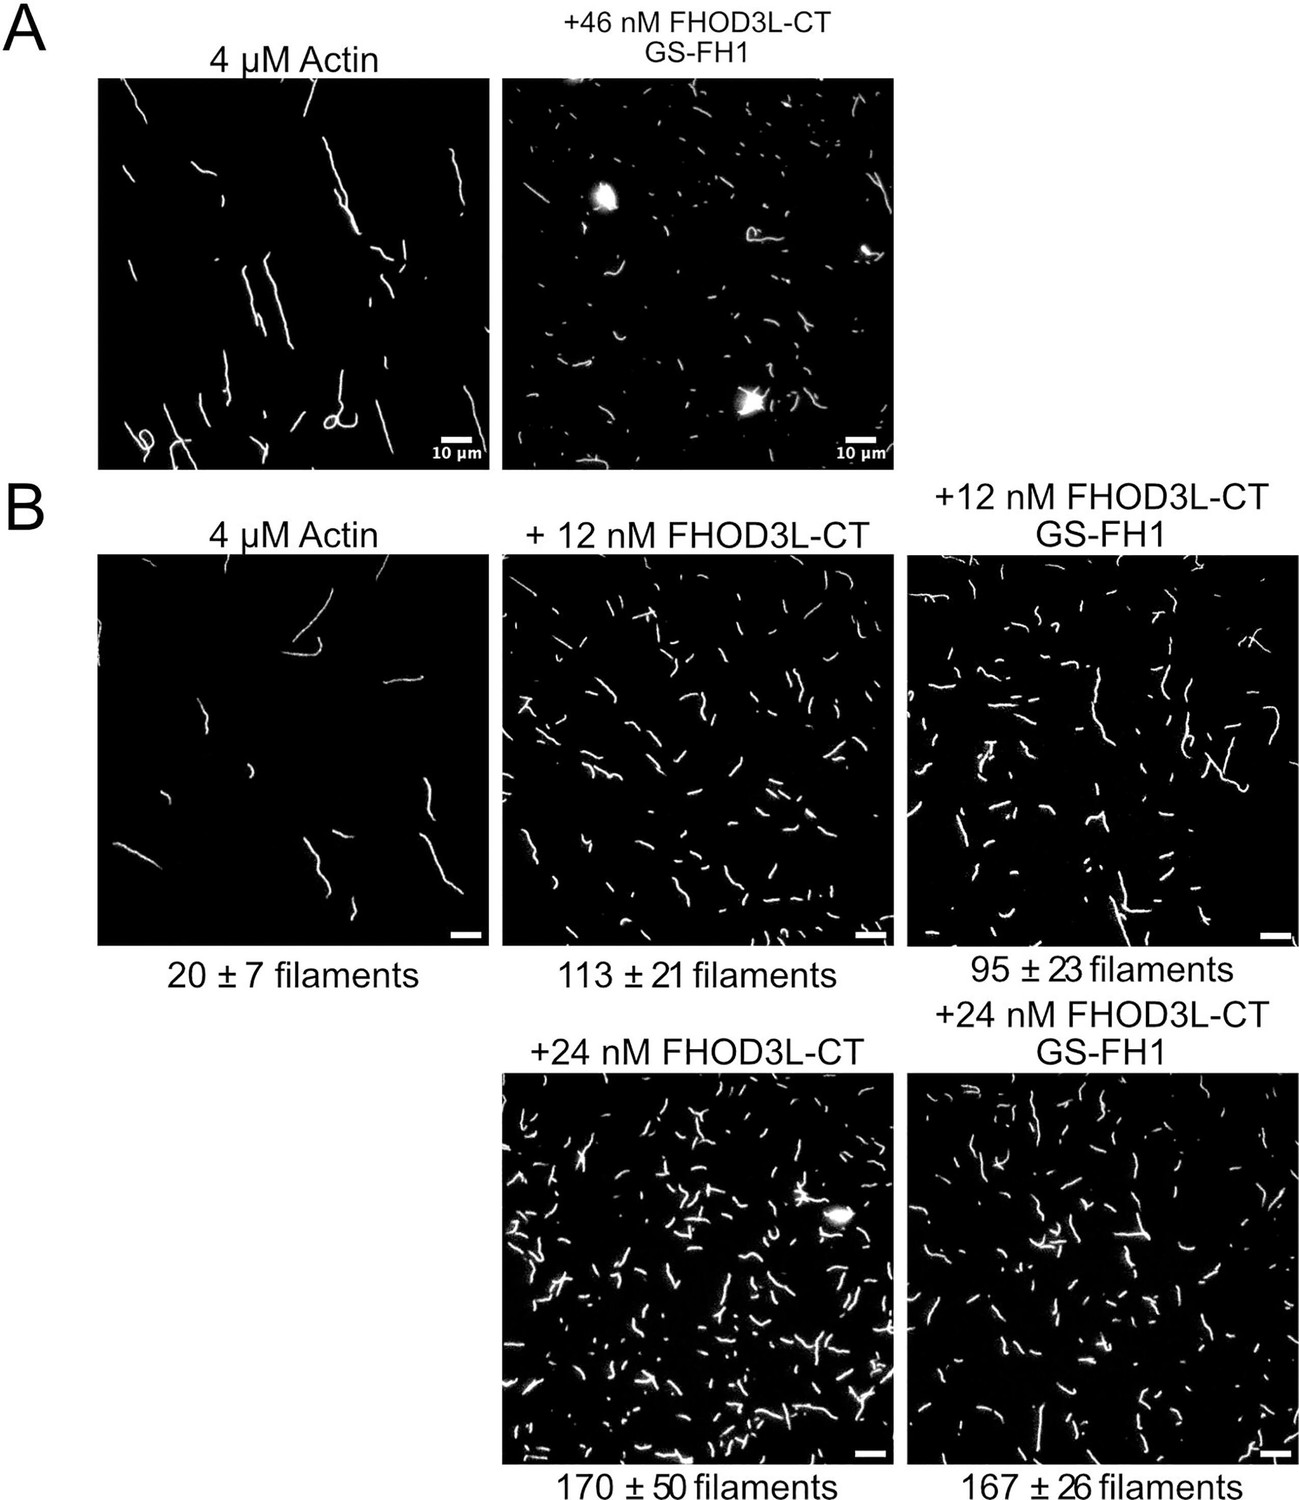
(A) Relative nucleation activity for FHOD3L-CT (n=5) and FHOD3L-CT K1193L (n=5). Data points are means, and error bars are standard deviations. Slopes reported are the average slopes of independent experiments. (B) Barbed-end affinity measurements for FHOD3L-CT, FHOD3L-CT GS-FH1, and FHOD3L-CT K1193L. Raw data are shown, and the line is a fit to all data points. The Kds reported are the average of three independent trials (n=3, each; mean ± SD). (C) Elongation rates from total internal reflection fluorescence (TIRF) assays. Conditions: 1 µM actin (10%-Alexa Fluor 488-labeled), 5 µM Hs profilin-1 ± 0.1 nM FHOD3L-CT or 1 nM FHOD3L-CT K1193L. Average elongation rates (over 10–100 s of seconds) and formin-mediated elongation rates (dim) are shown separately (n=19, FHOD3L-CT K1193L [avg]; n=67, FHOD3L-CT K1193L [dim]; 3 flow channels; mean ± SD, p-values by one-way ANOVA with post hoc Tukey test). (D) Quantification of bundling by FHOD3L-CT GS-FH1 and K1193L (n=3, each; mean ± SD). (E) Nucleation test. Quantification of the number of filaments per field of view (FOV) for FHOD3L-CT and FHOD3L-CT GS-FH1. Conditions: 4 µM actin with indicated construct. Reaction was diluted in Alexa Fluor 488 Phalloidin to 5 nM actin for visualization. Five images were taken per independent experiment (n=15 images, each; 3 biological replicates, each; mean ± SD, p-values by one-way ANOVA with post hoc Tukey test). Representative images are shown in Figure 3—figure supplement 2B. (F) Barbed-end elongation assay for FHOD3L-CT GS-FH1 in the presence of profilin. (Higher concentrations of FHOD3L-CT are darker shades of blue. Symbols highlight the highest, middle, and lowest concentrations tested. In this case, circle = 20 nM, square = 5 nM, and triangle = 1.25 nM FHOD3LT-CT.) Final conditions: 0.25 µM F-actin seeds (~0.1 nM barbed ends), 0.5 µM actin (10% pyrene-labeled), 1.5 µM S. pombe profilin, and 1.25 nM-20 nM FHOD3L-CT GS-FH1 (n=2; mean ± SD). **p<0.001, ***p<0.0001.
Figure 3—figure supplement 1

FHOD3L-CT K1193L elongation data.
(A) Kymograph of a growing filament from a total internal reflection fluorescence (TIRF) assay with FHOD3L-CT K1193L. Conditions: 1 µM actin (10%-Alexa Fluor 488-labeled), 5 µM Hs profilin-1, and 1 nM FHOD3L-CT K1193L. The green lines indicate bright regions of growing filament. The yellow lines represent dim regions. The orange line is a pause. Rates calculated for each region are given as subunits/s. (B) Quantification of run lengths for FHOD3L-CT and FHOD3L-CT K1193L (p>0.05 by Mann-Whitney U test). (C) Duration of capping events by FHOD3L-CT and FHOD3L-CT K1193L observed by TIRF microscopy (p>0.05 by Mann-Whitney U test).
Figure 3—figure supplement 2
Visualization of nucleation.
(A) Total internal reflection fluorescence (TIRF) micrographs from nucleation assays using 4 µM actin diluted to 5 nM actin in the presence or absence of 46 nM FHOD3L-CT GS-FH1. Aggregates are apparent in the presence of FHOD3L CT GS-FH1. (B) TIRF micrographs from nucleation assays using 4 µM actin and indicated concentration of FHOD3 construct. Samples were diluted to 5 nM actin in Alexa Fluor 488 Phalloidin for visualization. The number of aggregates was negligible at lower concentrations of FHOD3L-CT GS-FH1. Quantification is shown in Figure 3E. Scale bars, 10 µm.
Figure 4 with 1 supplement
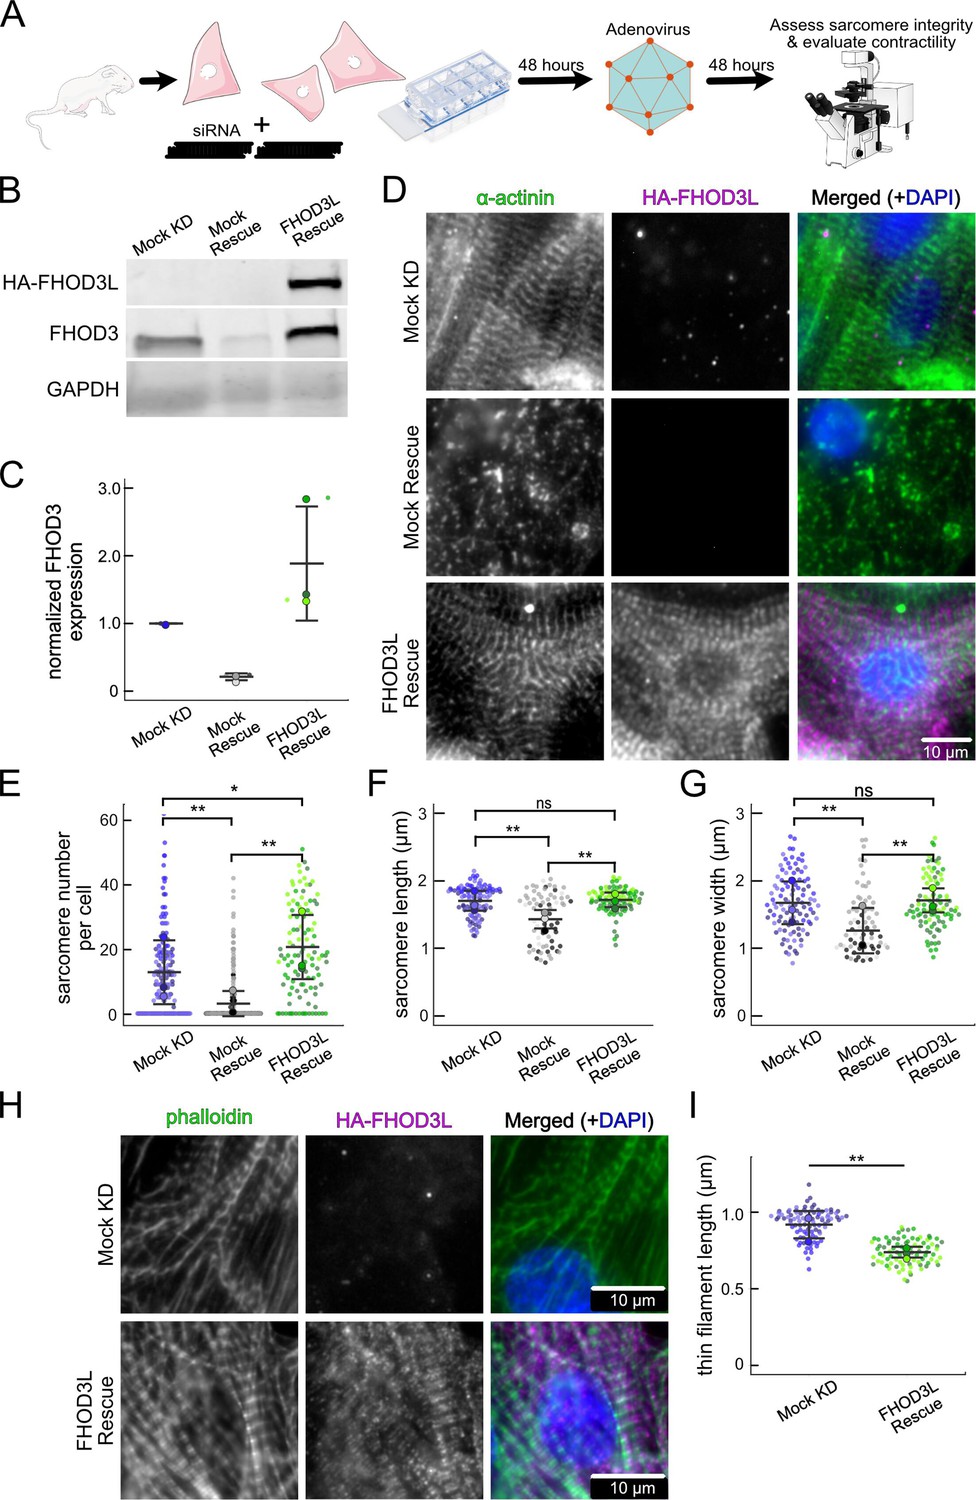
FHOD3L rescues sarcomere organization in neonatal rat ventricular myocytes (NRVMs).
(A) Overview of the rescue-experiment protocol. Reverse transfection of small interfering RNA (siRNA) upon plating NRVMs followed by infection with adenovirus to drive exogenous expression. (B) Western blot showing depletion of endogenous FHOD3 after knockdown, and exogenous FHOD3L expression levels after rescue. GAPDH used as a loading control. (C) Quantification of western blot in (B) normalized to GAPDH for each lane and then normalized to endogenous levels in the mock knockdown (n=3, each; mean ± SD). (D) Sarcomere integrity indicated by immunofluorescent staining of α-actinin (green). Localization of exogenous HA-FHOD3L is shown in magenta. DAPI (blue) is included in the merged images. Wheat germ agglutinin (WGA) is not shown for clarity. (E) Quantification of sarcomere number per NRVM (n=160 cells, mock KD; n=334 cells, mock rescue; n=110 cells, FHOD3L rescue). (F) Average sarcomere lengths per NRVM (n=100 cells, mock KD; n=71 cells, mock rescue; n=92 cells, FHOD3L rescue). (G) Average sarcomere widths (Z-line lengths) per NRVM (n=100 cells, mock KD; n=71 cells, mock rescue; n=92 cells, FHOD3L rescue). (H) Epifluorescent micrographs showing mock knockdown and FHOD3L-rescued NRVMs stained, with phalloidin (green) to visualize thin filaments and anti-HA (magenta) to show expression of exogenous FHOD3L. (I) Quantification of thin filament lengths for mock knockdown and FHOD3L-rescued NRVMs (n=94 cells, mock KD; n=84 cells, wild-type [WT] rescue). For (E, F, G, I), data from three biological replicates for each condition are represented by different shades. Mean ± SD is shown. p-Values were calculated with Mann-Whitney U tests, *p<0.05; **p<0.001.
-
Figure 4—source data 1
PDF files containing original file western blots displayed in Figure 4B, indicating the relevant bands and treatments.
- https://cdn.elifesciences.org/articles/104048/elife-104048-fig4-data1-v1.zip
-
Figure 4—source data 2
Originals file for westerns blots displayed in Figure 4B.
- https://cdn.elifesciences.org/articles/104048/elife-104048-fig4-data2-v1.zip
Figure 4—figure supplement 1
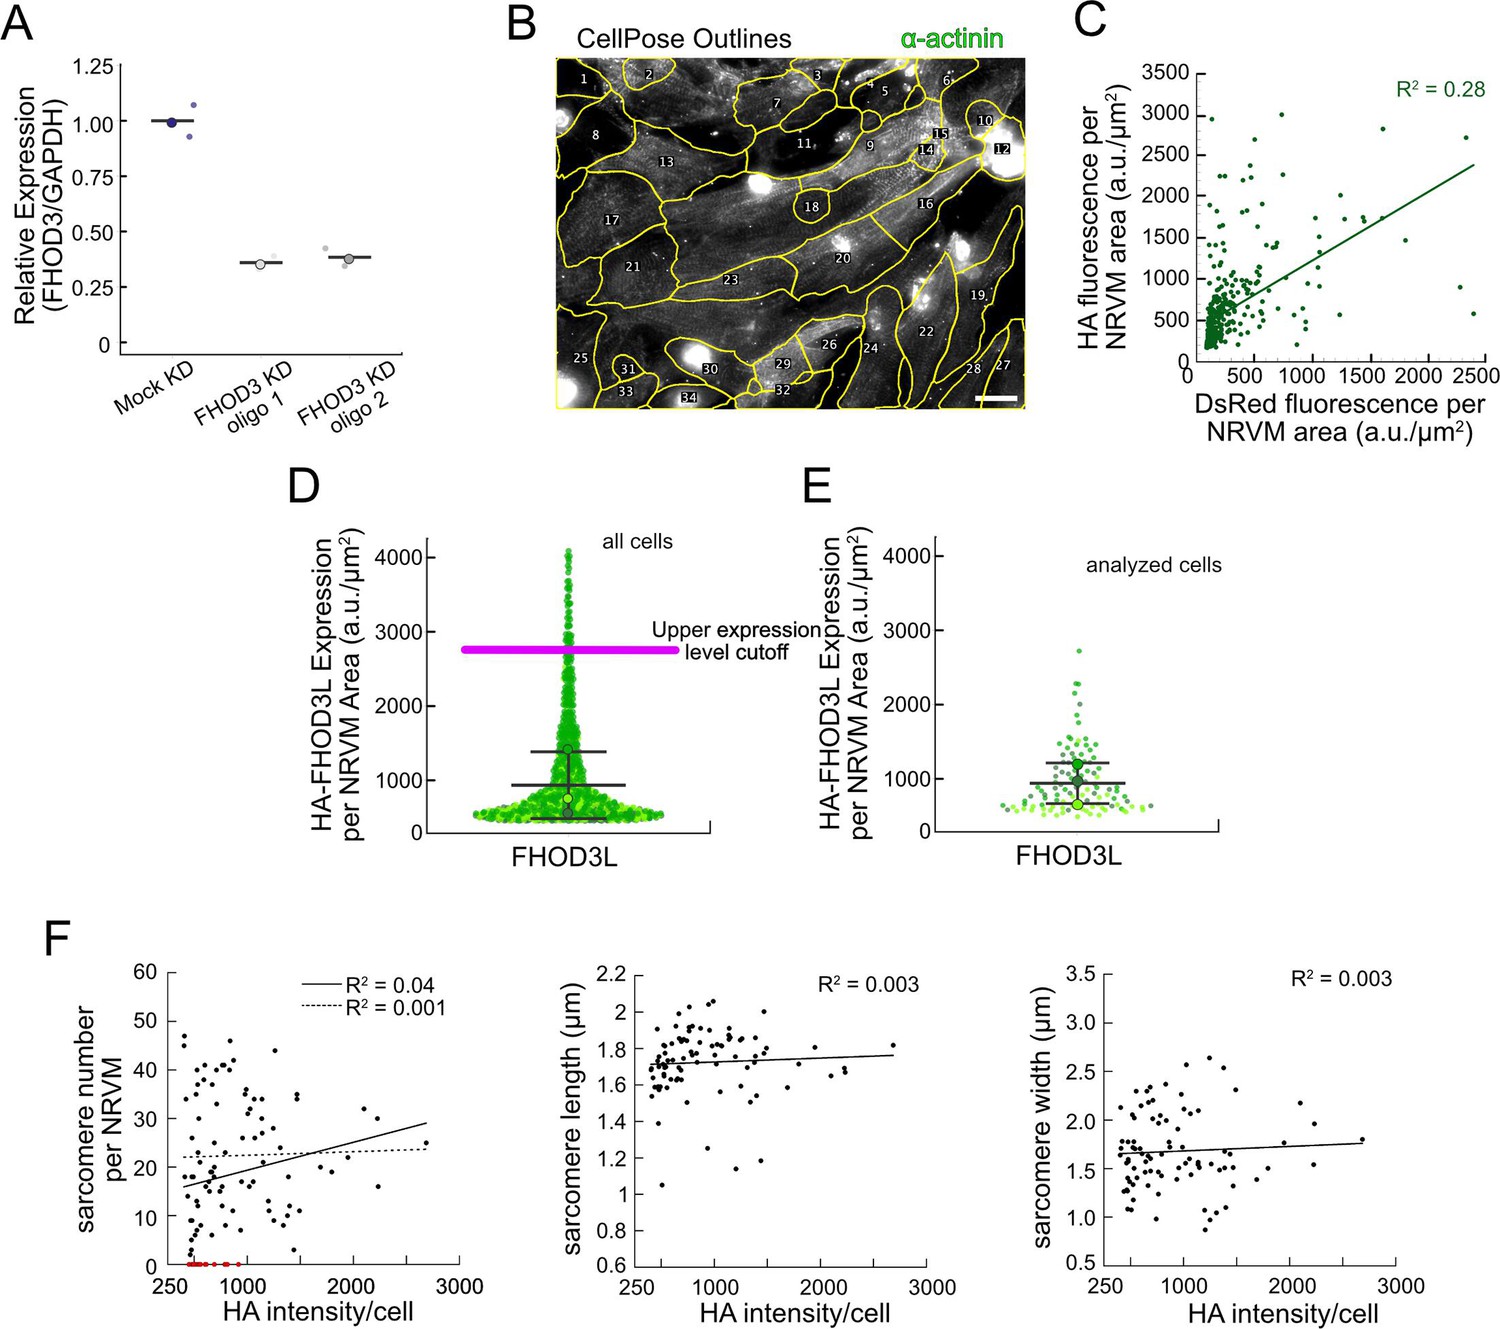
Method establishment for FHOD3L rescues in neonatal rat ventricular myocytes (NRVMs).
(A) Relative mRNA expression of FHOD3 in NRVMs after knockdown with two different small interfering RNA (siRNA) oligos compared to GAPDH mRNA expression (n=2 wells, 1 biological replicate; mean). (B) Typical image of CellPose segmentation of wild-type FHOD3L-rescued NRVMs, used for per cell quantification of sarcomeres, overlaid with the α-actinin channel. Regions of interest (ROIs) are numbered. Scale bar, 20 µm. (C) Pairwise correlation of normalized DsRed vs HA fluorescence intensity from FHOD3L rescue, plotted per NRVM area. Correlation is too weak to use DsRed as an expression level reporter (n=347 cells; 1 biological replicate). (D) Normalized and background-corrected 3xHA-FHOD3L fluorescence intensity per NRVM area from rescue experiments. Magenta line indicates the upper expression level cutoff (2700 a.u./µm2) used to select cells for further analysis (n=913 cells; 3 biological replicates; mean ± SD). (E) Normalized and background-corrected 3xHA-FHOD3L fluorescence intensity per NRVM area from the same three replicates as in (D). These cells were randomly selected for further analysis. (F) Pairwise correlation of HA fluorescence intensity vs sarcomere number, sarcomere length, or sarcomere width from FHOD3L rescue, plotted per NRVM area. No correlation is detected. (Dashed line shows trend when cells lacking sarcomeres [red] are excluded. Solid line shows the trend for all cells analyzed.)
Figure 5 with 3 supplements
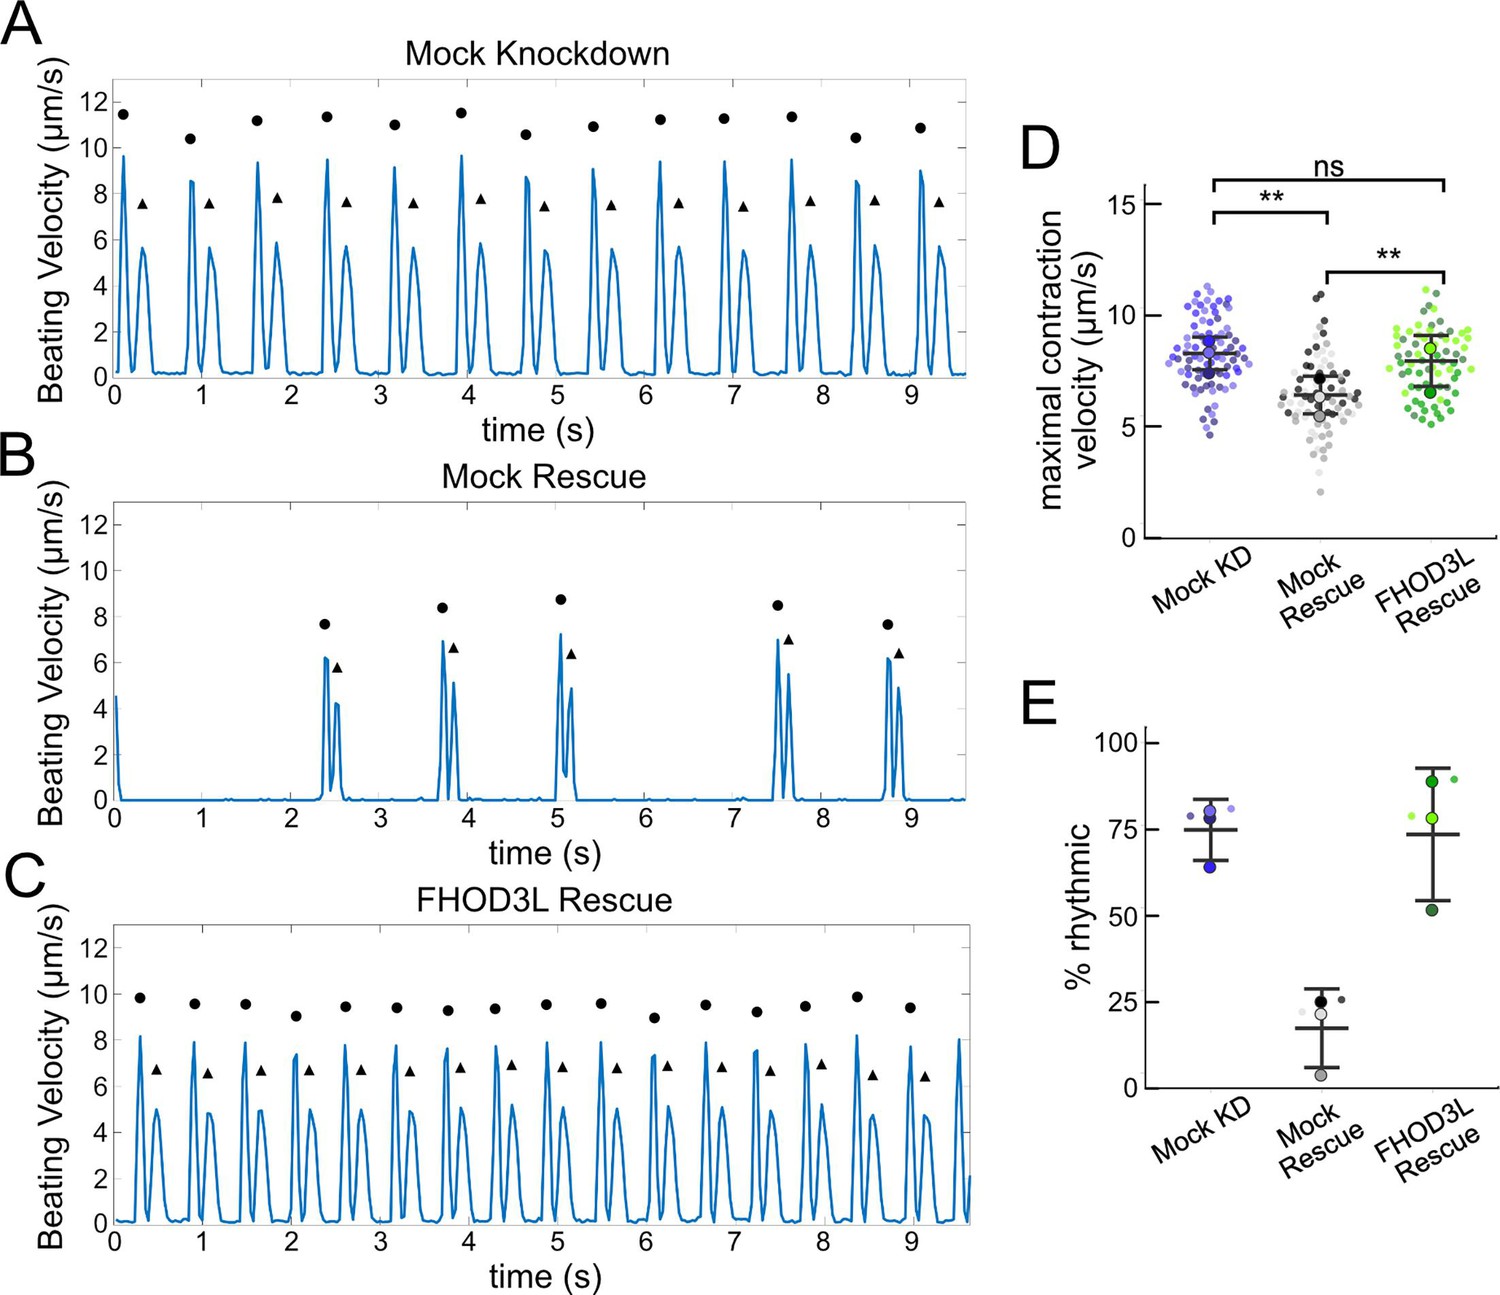
FHOD3L rescues contractility in neonatal rat ventricular myocytes.
(A–C) Motion analysis by digital image correlation. Mock knockdown, mock rescue, and FHOD3L rescue beating patterns are shown. The first (•) and the second (▲) peak of each duplex represent the contraction and the relaxation, respectively. (D) Maximal contraction velocities quantified for mock knockdown, mock rescue, and FHOD3L wild-type rescue (n=82 regions of interest [ROIs], mock KD, n=81 ROIs, mock rescue, n=72, ROIs, FHOD3L rescue; 3 biological replicates, each; mean ± SD, p-values by Student’s two-sample, unpaired t-test). (E) Quantification of the percentage of analyzed ROIs from the videos that contained rhythmic contractions for mock knockdown, mock rescue, and FHOD3L wild-type rescue (n=3, each; mean ± SD). **p<0.001.
Figure 5—figure supplement 1
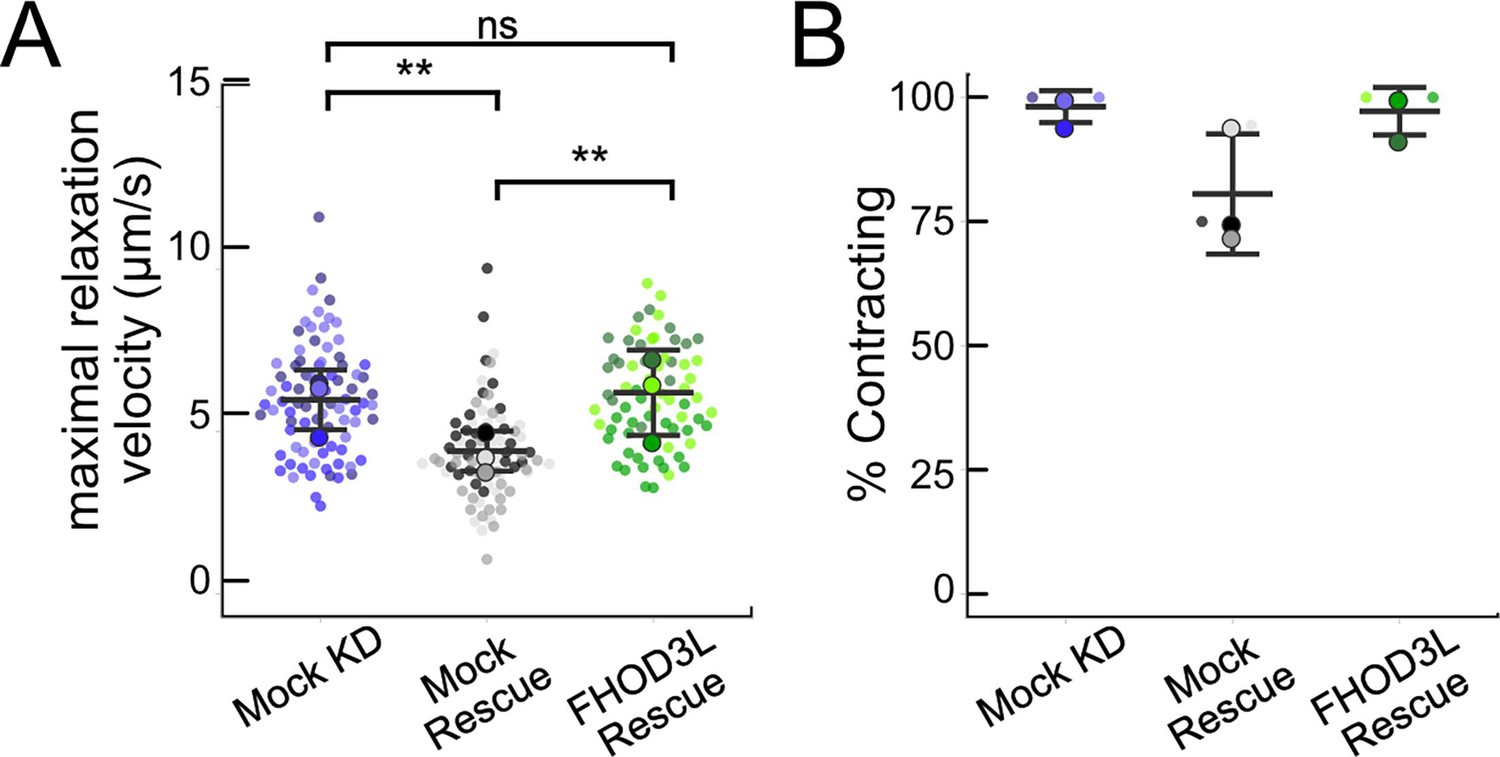
Relaxation velocity and fraction contracting.
(A) Maximal relaxation velocities quantified for mock knockdown, mock rescue, and FHOD3L rescue (n=82 regions of interest [ROIs], mock KD; n=81 ROIs, mock rescue; n=72, ROIs, FHOD3L rescue; 3 biological replicates, each; mean ± SD, p-values by Student’s two-sample, unpaired t-test). (B) Estimate of the percentage of neonatal rat ventricular myocytes (NRVMs) contracting in each video for mock knockdown, mock rescue, and FHOD3L rescue (n=3, each; mean ± SD). *p<0.05, **p<0.001, ***p<0.0001.
Figure 5—figure supplement 2
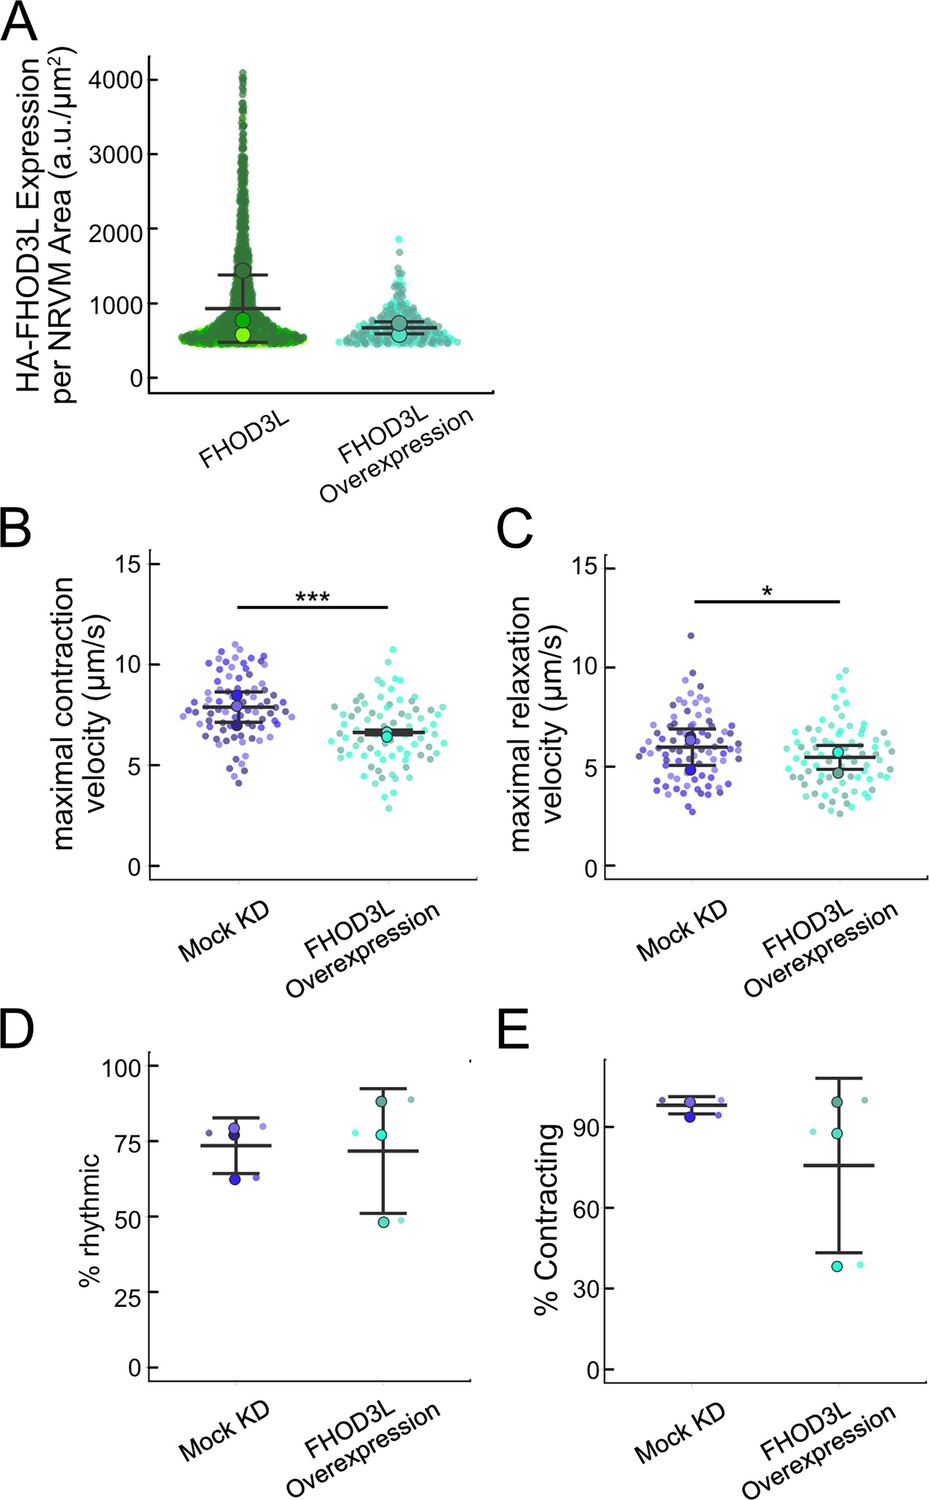
Overexpression of FHOD3L.
(A) Comparison of 3xHA-FHOD3L fluorescence intensity per neonatal rat ventricular myocyte (NRVM) area from rescue experiments and overexpression experiments. Data are normalized and background-corrected as in Figure 4—figure supplement 1D. (B) Maximal contraction velocities quantified for mock knockdown and FHOD3L overexpression NRVMs (n=82 regions of interest [ROIs], mock KD; n=79 ROIs, FHOD3L overexpression; 3 biological replicates, each; mean ± SD, p-value by Student’s two-sample, unpaired t-test). (C) Maximal relaxation velocities quantified for mock knockdown and FHOD3L overexpression NRVMs (n=82 ROIs, mock KD, n=79 ROIs, FHOD3L overexpression; 3 biological replicates, each; mean ± SD, p-value by Student’s two-sample, unpaired t-test). (D) Quantification of rhythmic contractions as in Figure 5E for mock knockdown and overexpression NRVMs (n=3, each; mean ± SD). (E) Estimate of the percentage of NRVMs contracting in each video for mock knockdown and overexpression NRVMs (n=3, each; mean ± SD). *p<0.05, **p<0.001, ***p<0.0001.
Figure 5—video 1
Exogenous FHOD3L expression rescues rhythmic contractions in neonatal rat ventricular myocytes (NRVMs).
This video shows digital image correlation (DIC) analysis of NRVMs from control and rescue conditions as in Figure 5.
Figure 6 with 4 supplements
Loss of nucleation, but not elongation, is tolerated for sarcomere formation and function.
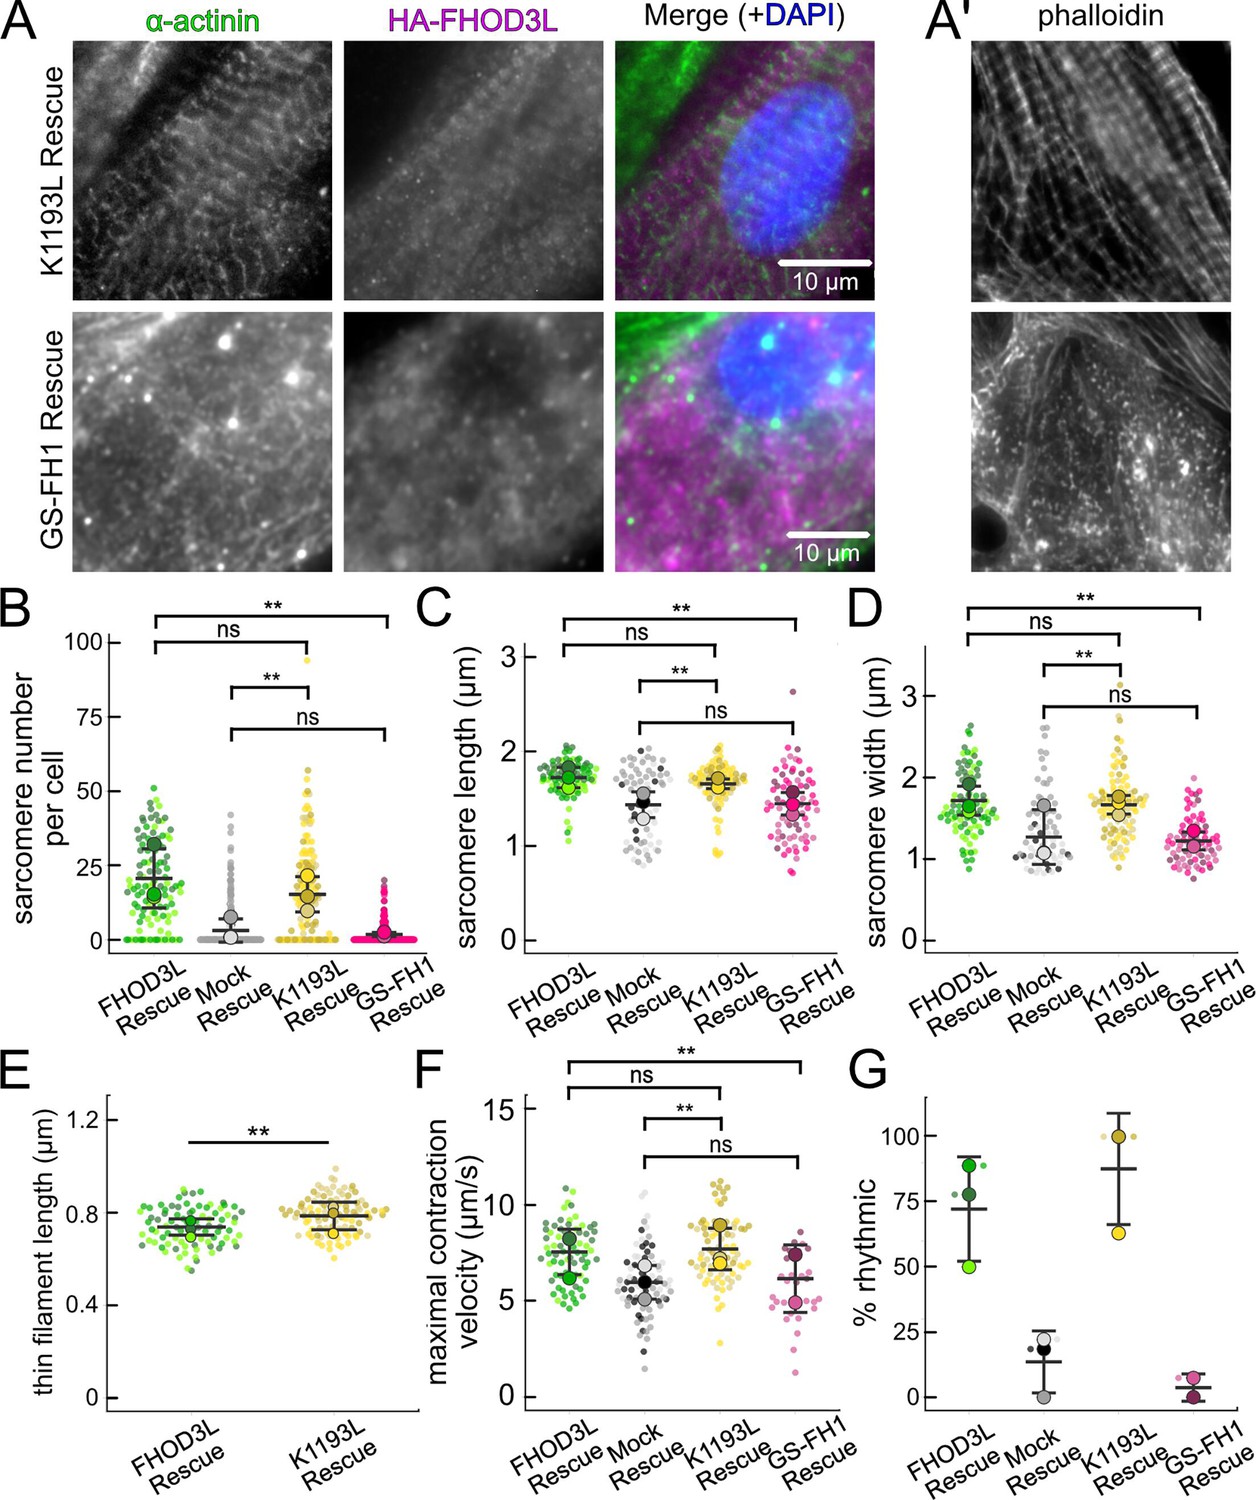
(A) Images of neonatal rat ventricular myocytes (NRVMs) rescued with K1193L or GS-FH1. Sarcomere integrity indicated by immunofluorescent staining of α-actinin (green). Localization of exogenous HA-FHOD3L is shown in magenta. DAPI (blue) is included in the merged images. Wheat germ agglutinin (WGA) is not shown for clarity. (B) Quantification of sarcomere number per NRVM in the FHOD3L, K1193L, and GS-FH1 rescues (n=148 cells, K1193L; n=259 cells GS-FH1; 3 biological replicates; mean ± SD, p-values by Mann-Whitney U test). (C) Average sarcomere lengths per NRVM in the FHOD3L, K1193L, and GS-FH1 rescues (n=95 cells, K1193L; n=73 cells, GS-FH1; 3 biological replicates; mean ± SD, p-value for FHOD3L comparison to GS-FH1 by Student’s two-sample, unpaired t-test, all other p-values by Mann-Whitney U test). (D) Average sarcomere widths (Z-line lengths) per NRVM in the FHOD3L, K1193L, and GS-FH1 rescues (n=95 cells, K1193L; n=73 cells, GS-FH1; 3 biological replicates; mean ± SD, p-values by Mann-Whitney U test). (E) Quantification of thin filament lengths for FHOD3L and K1193L-rescued NRVMs (n=99 cells, K1193L; 3 biological replicates, each; mean ± SD, p-value by Mann-Whitney U test). (F) Quantification of contracting NRVMs, as in Figure 5D, for FHOD3L, K1193L, and GS-FH1-rescued NRVMs (n=3, each; mean ± SD). (G) Quantification of rhythmic contractions, as in Figure 5E, for FHOD3L, K1193L, and GS-FH1-rescued NRVMs (n=3, FHOD3L and K1193L; n=2, GS-FH1; mean ± SD). **p<0.001.
Figure 6—figure supplement 1
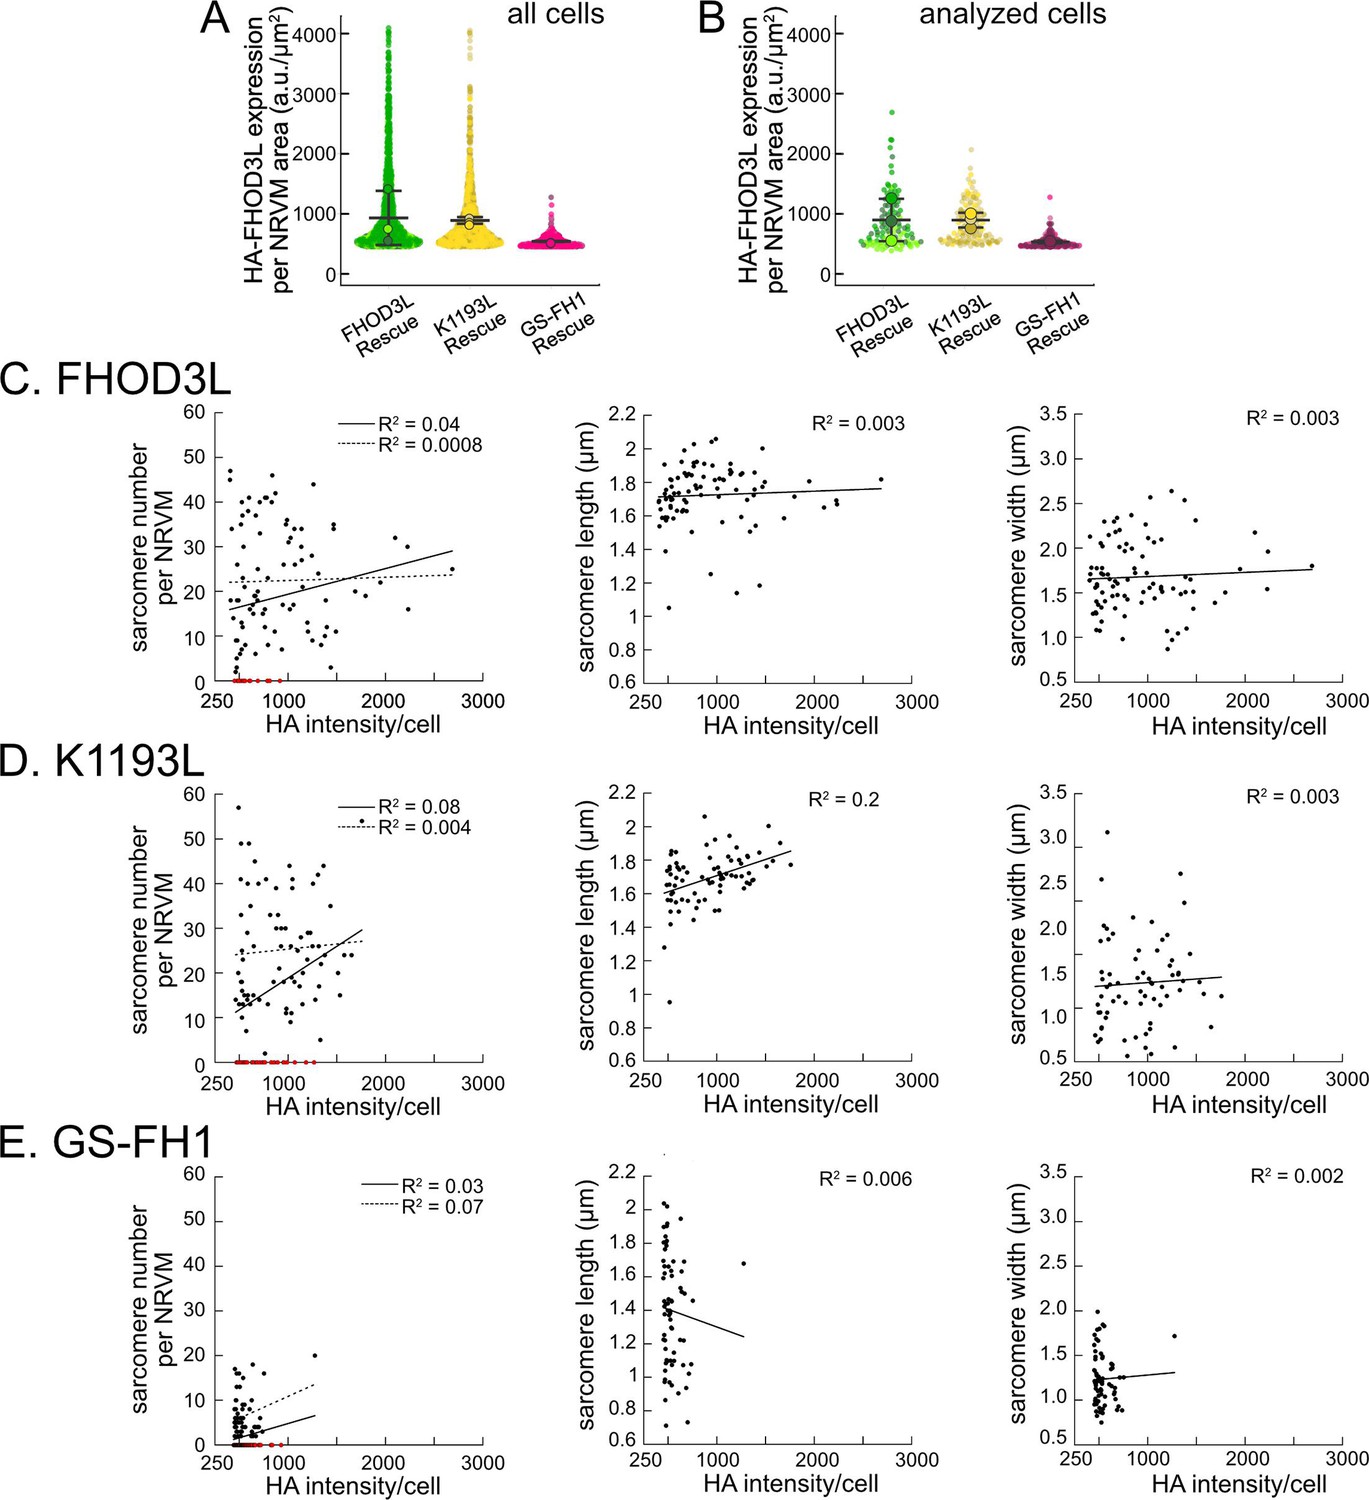
FHOD3L expression level does not predict sarcomere metrics.
(A) Normalized and background-corrected 3xHA-FHOD3L fluorescence intensity per neonatal rat ventricular myocyte (NRVM) area from the FHOD3L, K1193L, and GS-FH1 rescues (n=897 cells, K1193L, n=536 cells, GS-FH1; 3 biological replicates, each; mean ± SD). (B) Fluorescence distributions of the cells randomly selected for further analysis. (C–E) Analysis of correlation between HA intensity per cell and sarcomere number, length, and width for indicated rescue constructs.
Figure 6—figure supplement 2
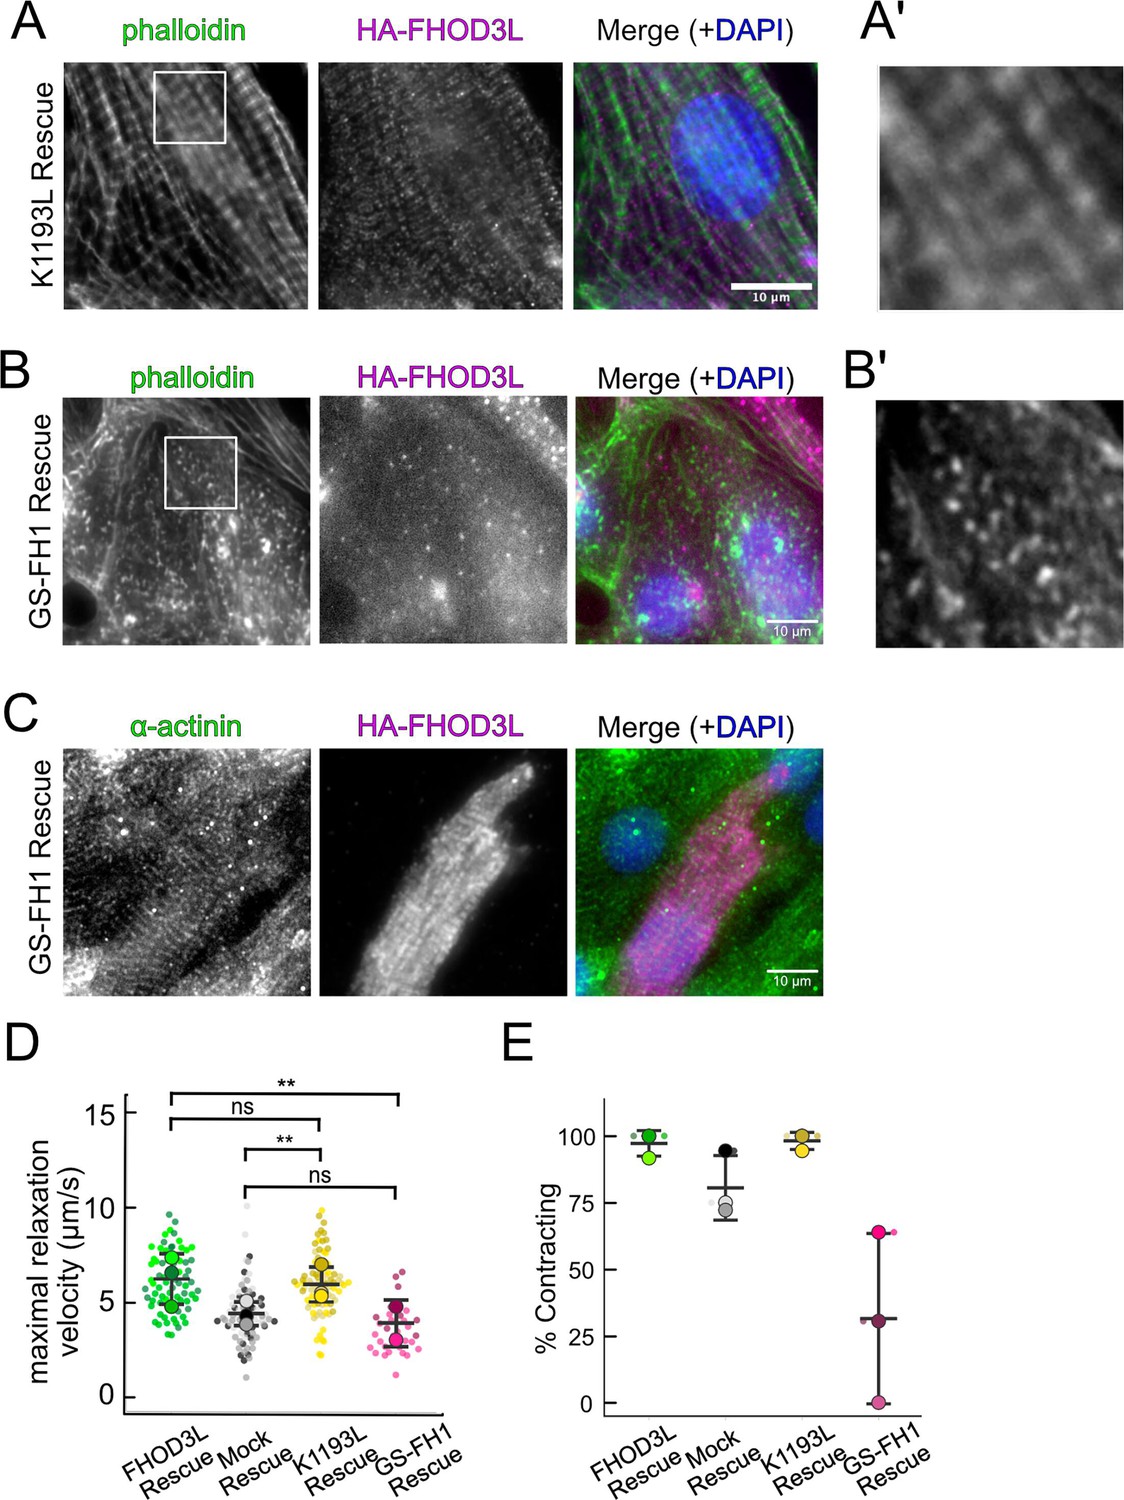
Potential pre-myofibrils in FHOD3L GS-FH1 rescue cells.
(A) Epifluorescent micrographs showing K1193L-rescued neonatal rat ventricular myocytes (NRVMs) stained with phalloidin (green) to visualize thin filaments and anti-HA (magenta) to show expression of exogenous FHOD3L. (A’) 3× zoom of indicated region in phalloidin image. (B) Phalloidin staining (green) reveals that cardiomyocytes expressing GS-FH1 have actin puncta that may be aligned. Stress fibers from a fibroblast are visible in the upper right-hand corner of the image. HA-FHOD3L (magenta) shows diffuse GS-FH1 protein. (B’) 3× zoom of indicated region in phalloidin image. (C) Striated HA-FHOD3L demonstrates that the GS-FH1 mutant can localize correctly if sarcomeres are present. Sarcomere integrity indicated by immunofluorescent staining of α-actinin (green). Localization of exogenous HA-FHOD3L is shown in magenta. DAPI (blue) is included in the merged images. Wheat germ agglutinin (WGA) is not shown for clarity. (D) Maximal relaxation velocities for FHOD3L, K1193L, and GS-FH1-rescued NRVMs (n=81 regions of interest [ROIs], K1193L; n=31 ROIs, GS-FH1; 3 biological replicates, wild-type [WT] and K1193L; 2 for GS-FH1; mean ± SD, p-values from Mann-Whitney U test). (E) Estimate of the percentage of NRVMs contracting in each video for FHOD3L, K1193L, and GS-FH1-rescued NRVMs (n=81 ROIs, K1193L; n=31 ROIs, GS-FH1; 3 biological replicates, WT and K1193L; 2 for GS-FH1; mean ± SD; p-values determined with Mann-Whitney U-test). **p<0.001.
Figure 6—figure supplement 3
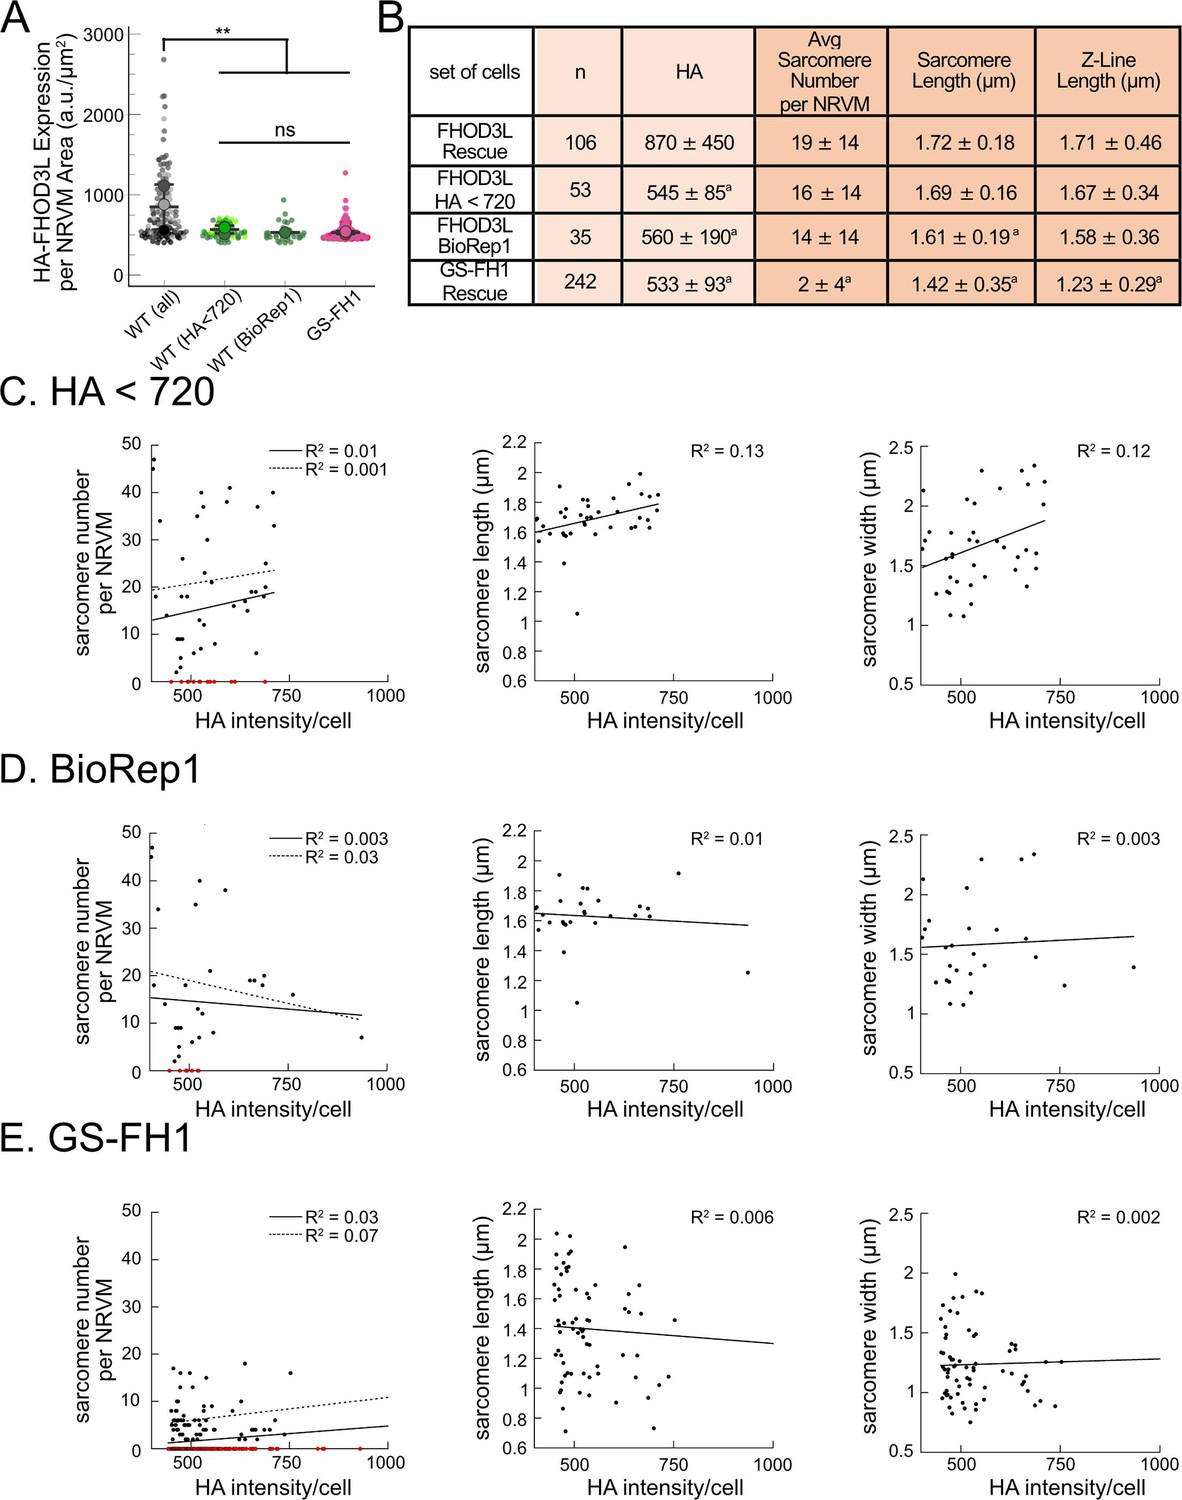
Expression levels of GS-FH1 do not predict phenotype.
(A) HA intensity distributions from full complement of FHOD3L (wild-type [WT]) rescue experiments compared to those with HA intensity <720 a.u./μm2, those from the first biological replicate only, and with the GS-FH1 rescue dataset. (B) Comparison of sarcomere metrics for the four indicated distributions. aStatistically different from FHOD3L rescue. (C-E) Analysis of correlation between HA intensity per cell and sarcomere number, length, and width for the three indicated low-intensity populations.
Figure 6—video 1
Expression of FHOD3L function separating mutants in neonatal rat ventricular myocytes (NRVMs).
This video shows digital image correlation (DIC) analysis of NRVMs from rescue conditions as in Figure 6.
Tables
Table 1
Summary of biochemical measurements for FHOD3L-CT and mutants.
All data shown are means ± standard deviation, each from at least three independent experiments. n.d.=no data. Light gray columns are data acquired with bulk pyrene-actin-based assays without profilin added. Blue columns provide data from total internal reflection fluorescence (TIRF) analysis of individual filaments (profilin was present). The purple column reports data from the co-sedimentation assay.
| Pyrene-actin-based assays | TIRF-based assays | Co-sedimentation | ||||
|---|---|---|---|---|---|---|
| Nucleation strength (a.u./s) | Barbed-end binding affinity (nM) | Elongation rate (subunits/s) | Run length (µm) | Capping duration (s) | Bundling (% actin pelleted at 60 nM) | |
| FHOD3L-CT | 0.32 ± 0.04 | 0.028 ± 0.005 | 39 ± 13 | 1.10 ± 0.49 | 11.8 ± 6.8 | 81.7 ± 2.9 |
| FHOD3S-CT | 0.42 ± 0.04* | 0.750 ± 0.090* | 33 ± 12 | 0.90 ± 0.33* | 12.0 ± 7.8 | 56 ± 17 |
| FHOD3L-CT I1163A | –0.081 ± 0.002* | 4.9 ± 1.4* | n.d. | n.d. | n.d. | n.d. |
| FHOD3L-CT K1309A | 0.04 ± 0.02* | n.d. | n.d. | n.d. | n.d. | n.d. |
| FHOD3L-CT K1193L | 0.10 ± 0.02* | 0.470 ± 0.090* | 38 ± 12 | 1.11 ± 0.42 | 12.7 ± 5.6 | 30.8 ± 0.7 |
| FHOD3L-CT GS-FH1 | Nucleates similarly via TIRF nucleation assay | 0.218 ± 0.016* | n.d. | n.d. | n.d. | 61.7 ± 0.7 |
-
*
Statistically different from FHOD3L-CT. Analysis by ANOVA and Tukey post hoc tests, p<0.05. More details are in the figure legends.
Table 2
Summary of FHOD3L and mutant rescue experiments in neonatal rat ventricular myocytes (NRVMs).
All data shown are means ± standard deviation, each from three independent experiments (except for GS-FH1 rescue: maximal contraction and relaxation velocity measurements and average % rhythmic contractions from two independent experiments due to one biological replicate not contracting). n.d.=no data. In the lightest columns, ‘–’ indicates treatment with negative control small interfering RNA (siRNA) or empty virus, ‘+’ indicates treatment with FHOD3 siRNA or corresponding FHOD3L adenovirus. Data in the orange columns were acquired from fixed and stained cells. Data in the red columns were acquired from live cells. Statistical analyses are described in the figure legends. ‘In the lightest columns’ should be ‘In the yellow columns’. Data in the ‘medium-colored columns’ should be ‘Data in the orange columns’. ‘Data in the darkest columns’ should be ‘Data in the red columns’.
| Treatment | Fixed samples | Live samples | ||||||||
|---|---|---|---|---|---|---|---|---|---|---|
| FHOD3 KD? | FHOD3 AdV? | Avg sarcomere number per NRVM | Sarcomere length (µm) | Z-line length (µm) | Thin filament length (nm) | Maximal contraction velocity (µm/s) | Maximal relaxation velocity (µm/s) | Avg % rhythmic contractions | Avg % contracting NRCs in FOV | |
| Mock knockdown | – | – | 12 ± 13 | 1.71 ± 0.22 | 1.69 ± 0.43 | 925 ± 94 | 7.9 ± 1.6 | 6.0 ± 1.7 | 74 ± 9 | 98.2 ± 3.2 |
| Mock rescue | + | – | 3 ± 7* | 1.46 ± 0.37* | 1.38 ± 0.46* | n.d. | 6.0 ± 1.7* | 4.4 ± 1.5* | 14 ± 12 | 89 ± 11 |
| FHOD3L rescue | + | + | 19 ±14*, † | 1.72 ± 0.18† | 1.71 ± 0.46† | 739 ±81*, † | 7.5 ± 1.5† | 6.1 ± 1.5† | 72 ± 20 | 97.2 ± 4.8 |
| K1193L rescue | + | + | 17 ± 17 | 1.69 ± 0.16 | 1.73 ± 0.41 | 792 ± 79 ‡ | 7.7 ± 1.6 | 5.9 ± 1.6 | 88 ± 21 | 98.2 ± 3.2 |
| GS-FH1 rescue | + | + | 2 ± 4 ‡ | 1.42 ± 0.35 ‡ | 1.23 ± 0.29‡ | n.d. | 5.6 ± 1.7‡ | 3.6 ± 1.2 ‡ | 3.7 ± 5.2 | 32 ± 32 |
| FHOD3L overexpression | – | + | n.d. | n.d. | n.d. | n.d. | 6.6 ± 1.6‡ | 5.5 ± 1.6 ‡ | 72 ± 21 | 76 ± 32 |
-
*
Statistically different from mock KD (mock rescue and Fhod3L rescue).
-
†
Statistically different from mock rescue (FHOD3L and GS-FH1).
-
‡
Statistically different from FHOD3L rescue (all mutant rescues and overexpression).
Key resources table
| Reagent type (species) or resource | Designation | Source or reference | Identifiers | Additional information |
|---|---|---|---|---|
| Strain, strain background (Escherichia coli) | BL21(DE3) | Novagen/Sigma-Aldrich | 69,450-M RRID:Ecoli_0001 | |
| Cell line (Homo sapiens) | HEK293T | Dr. Kohnosuke Mitani, UCLA | CRL-3216 | |
| Transfected construct and biological sample (human) | pAdenoX-CMV-3xHA-FHOD3L-CMV-DsRed (plasmid and adenovirus) | Takara Bio; this paper | Cat. No. 632262 | Adenoviral construct to transfect and purify the adenovirus to express FHOD3L wild-type in NRVMs. |
| Biological sample (human) | pAV-CMV-{3xHA-FHOD3L GS-FH1}:SV40 pA-CMV-mCherry (adenovirus) | VectorBuilder | Cat#AVS(VB230718-1114xtg) | Adenovirus to transfect and express FHOD3L GS-FH1 in NRVMs. |
| Biological sample (human) | pAV-CMV-{3xHA-FHOD3L K1193L}:SV40 pA-CMV-mCherry (adenovirus) | VectorBuilder | Cat#AVS(VB230528-1145fkg) | Adenovirus to transfect and express FHOD3L K1193L in NRVMs. |
| Sequence-based reagent | siRNA against rat FHOD3 | QIAGEN | Rn_LOC100360334_2 Flexitube siRNA | |
| Sequence-based reagent | AllStars Negative Control siRNA | QIAGEN | Cat. No. 1027281 | |
| Sequence-based reagent | GAPDH_F | This paper | qPCR primers | CCGCATCTTCTTGTGCAGTG |
| Sequence-based reagent | GAPDH_R | This paper | qPCR primers | CGATACGGCCAAATCCGTTC |
| Sequence-based reagent | FHOD3_F | This paper | qPCR primers | CAGCCAATCACGGAG |
| Sequence-based reagent | FHOD3_R | This paper | qPCR primers | TGCTGTCCTTGCCCTGA |
| Biological sample (Rattus norvegicus) | Primary neonatal rat ventricular myocytes | UCLA Cardiovascular Research Theme Core | Freshly isolated from male and female Sprague-Dawley rats | |
| Antibody | anti-α-actinin (Mouse monoclonal) | Sigma | Cat. No. A7811, RRID:AB_476766 | IF (1:250) |
| Antibody | anti-HA (Rabbit monoclonal) | Cell Signaling Technology | Cat. No. 3724S, RRID:AB_1549585 | IF (1:500) WB (1:1000) |
| Antibody | anti-GAPDH (Mouse monoclonal) | Santa Cruz Biotechnology | Cat. No. sc-365062, RRID:AB_10847862 | WB (1:1000) |
| Antibody | anti-FHOD3 (Rabbit polyclonal) | Abcam | Cat. No. ab224463 | WB (1:1000) |
| Antibody | goat anti-rabbit IgG 800CW | LiCor Biosciences | Cat. No. 926–32211, RRID:AB_621843 | WB (1:10,000) |
| Antibody | goat anti-mouse IgG 680RD | LiCor Biosciences | Cat. No. 926–68070, RRID:AB_10956588 | WB (1:10,000) |
| Antibody | Alexa Fluor 488 goat anti-mouse | Thermo Fisher | Cat. No. A-11001, RRID:AB_2534069 | IF (1:500) |
| Antibody | Alexa Fluor 647 goat anti-rabbit | Thermo Fisher | Cat. No. A-21244, RRID:AB_2535812 | IF (1:500) |
| Recombinant DNA reagent | pGEX-6P-2-FHOD3LCT (plasmid) | This paper | Original template, EGFP-FHOD3L, gifted by Thomas Iskratsch (Iskratsch et al., 2010) | |
| Chemical compound, drug | Vectashield Plus Antifade mounting media | Vector Laboratories | Cat. No. H-1900–10 | |
| Chemical compound, drug | Prolong Glass Antifade mountant | Thermo Fisher | Cat. No. P36980 | |
| Chemical compound, drug | Alexa Fluor 488 Phalloidin | Thermo Fisher | Cat. No. A12379 | |
| Chemical compound, drug | Wheat Germ Agglutinin (WGA) TMR | Thermo Fisher | Cat. No. W849 | |
| Chemical compound, drug | Paraformaldehyde | Fisher Scientific | Cat. No. AC416780010 | |
| Software, algorithm | Fiji | NIH; Schindelin et al., 2012 | ||
| Software, algorithm | MotionGUI | MATLAB; denoviral infection, driving expression of rescue constructs, Huebsch et al., 2015 | ||
| Software, algorithm | CellPose | Stringer et al., 2021 | ||
| Other | DAPI stain | Fisher Scientific | Cat. No. EN62248 | (1 μg/ml) |
Additional files
Download links
A two-part list of links to download the article, or parts of the article, in various formats.
Downloads (link to download the article as PDF)
Open citations (links to open the citations from this article in various online reference manager services)
Cite this article (links to download the citations from this article in formats compatible with various reference manager tools)
Human formin FHOD3-mediated actin elongation is required for sarcomere integrity in cardiomyocytes
eLife 13:RP104048.
https://doi.org/10.7554/eLife.104048.3


