Upstream open reading frames buffer translational variability during Drosophila evolution and development
- State Key Laboratory of Gene Function and Modulation Research, Center for Bioinformatics, School of Life Sciences, Peking University, China
- Eye Institute of Shandong First Medical University, State Key Laboratory Cultivation Base, Shandong Provincial Key Laboratory of Ophthalmology, China
- College of Ecology, Lanzhou University, China
- Beijing Advanced Center of RNA Biology (BEACON), Peking University, China
- Southwest United Graduate School, China
Figures
Figure 1 with 13 supplements
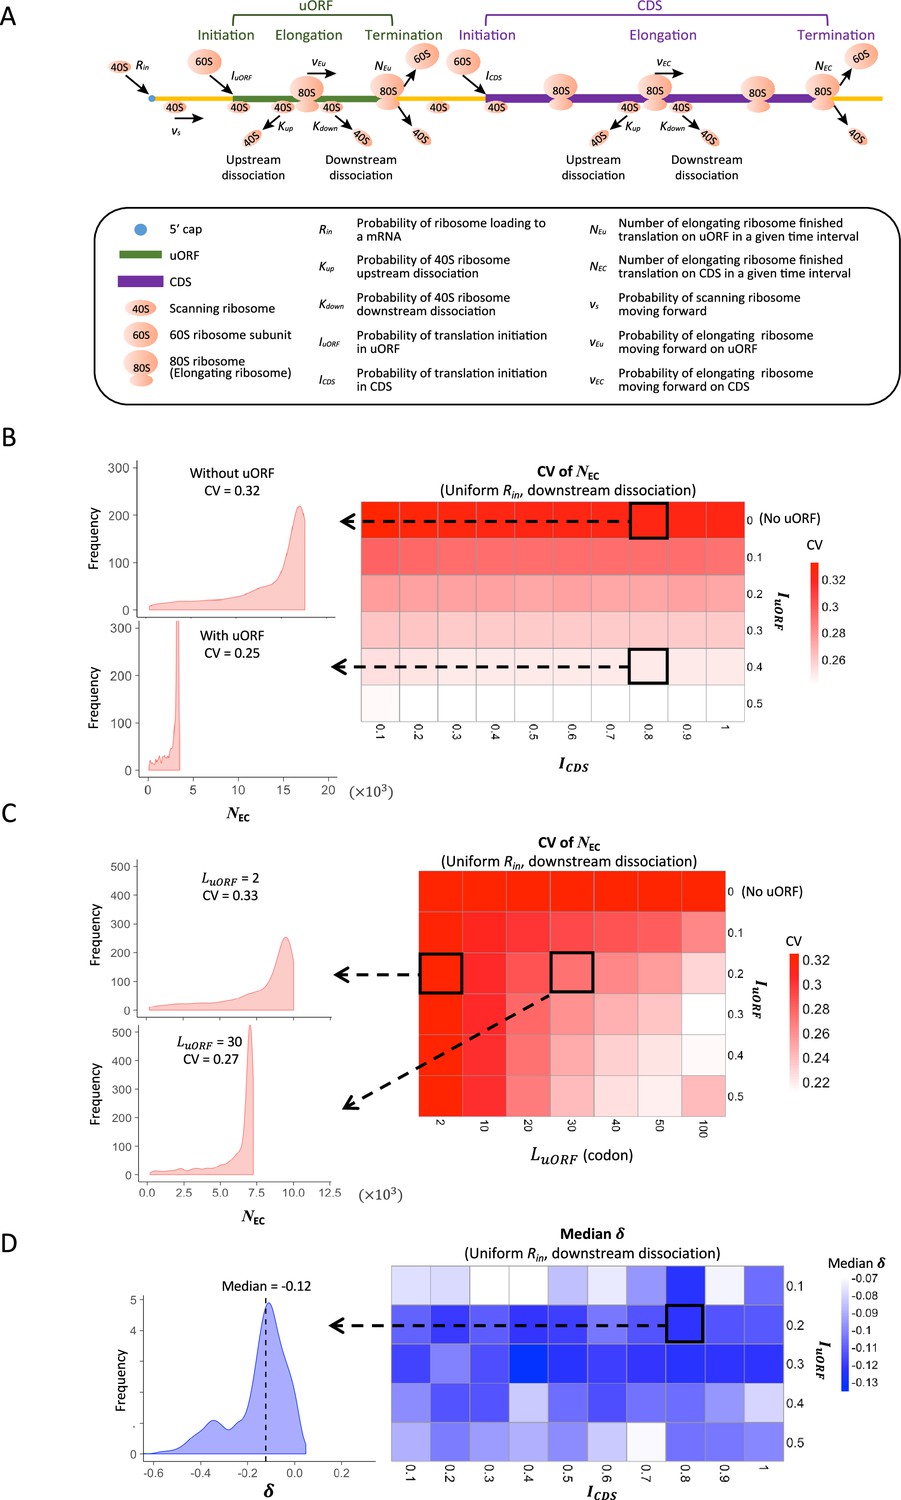
Modeling simulation of uORF-mediated translation buffering.
(A) Model schema of the modified ICIER model (on the top). The parameters are listed in the box below the schema. (B) Heatmap showing the CVs of CDS translation rate (NEC) under different ICDS (x-axis) and IuORF (y-axis) combinations with a uniform distribution of Rin input and the downstream dissociation model. The left panels elicited by the dotted lines from specific squares of the right heatmap were two examples showing the distribution of NEC under ICDS = 0.8 and IuORF = 0 (top panel, without uORF) and ICDS = 0.8 and IuORF = 0.4 (bottom panel, with uORF). (C) Heatmap showing CVs of CDS translation rate (NEC) under different (x-axis) and IuORF (y-axis) combinations with a uniform distribution of Rin input and the downstream dissociation model. The left panels elicited by the dotted lines from specific squares of the right heatmap were two examples showing the distribution of NEC under LuORF = 2 and IuORF = 0.2 (top panel) and LuORF = 30 and IuORF = 0.2 (bottom panel). (D) Heatmap showing median under different ICDS (x-axis) and IuORF (y-axis) combinations with a uniform distribution of Rin input and the downstream dissociation model. The left panel elicited by the dotted line from a specific square of the right heatmap was an example showing the distribution of under ICDS = 0.8 and IuORF = 0.2. The vertical dashed line indicated the median value of .
-
Figure 1—source data 1
Raw numerical data underlying the figures.
- https://cdn.elifesciences.org/articles/104074/elife-104074-fig1-data1-v1.xlsx
Figure 1—figure supplement 1
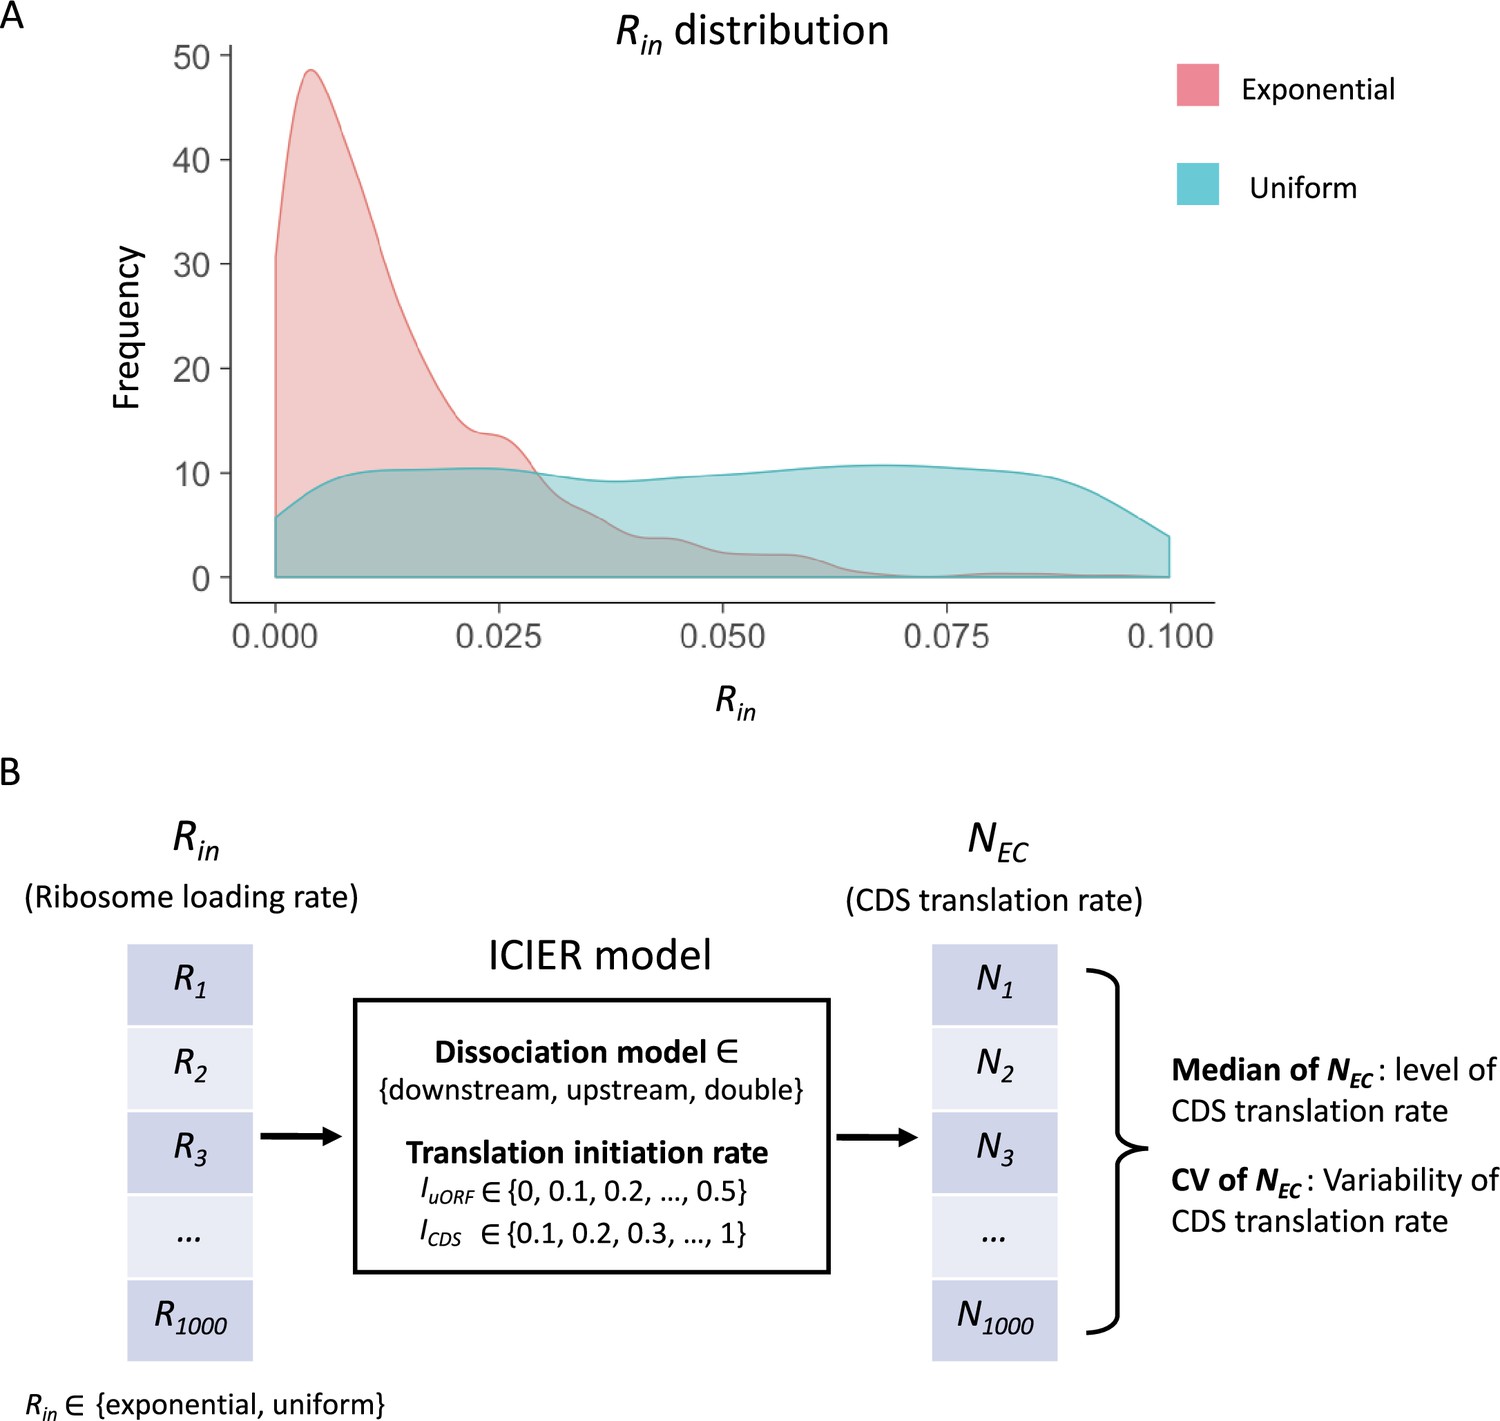
The input distribution and model simulation flow.
(A) Two distributions of the Rin input were used in our simulation: an exponential distribution and a uniform distribution. A total of 1000 Rin values (ranging from 0 to 0.1) were randomly generated following either distribution. (B) Under a fixed combination of parameters (Rin distribution, dissociation model, IuORF and ICDS), the model simulation produces 1000 NEC values from 1000 Rin input. The median of these 1000 NEC represented the median of translation rate of CDS under the 1000 varying Rin inputs and the other fixed parameters. The coefficient of variation (CV) of these 1000 NEC reflected the variability of translation rate of CDS under the 1000 varying Rin inputs and the other fixed parameters.
-
Figure 1—figure supplement 1—source data 1
Raw numerical data underlying the figures.
- https://cdn.elifesciences.org/articles/104074/elife-104074-fig1-figsupp1-data1-v1.xlsx
Figure 1—figure supplement 2
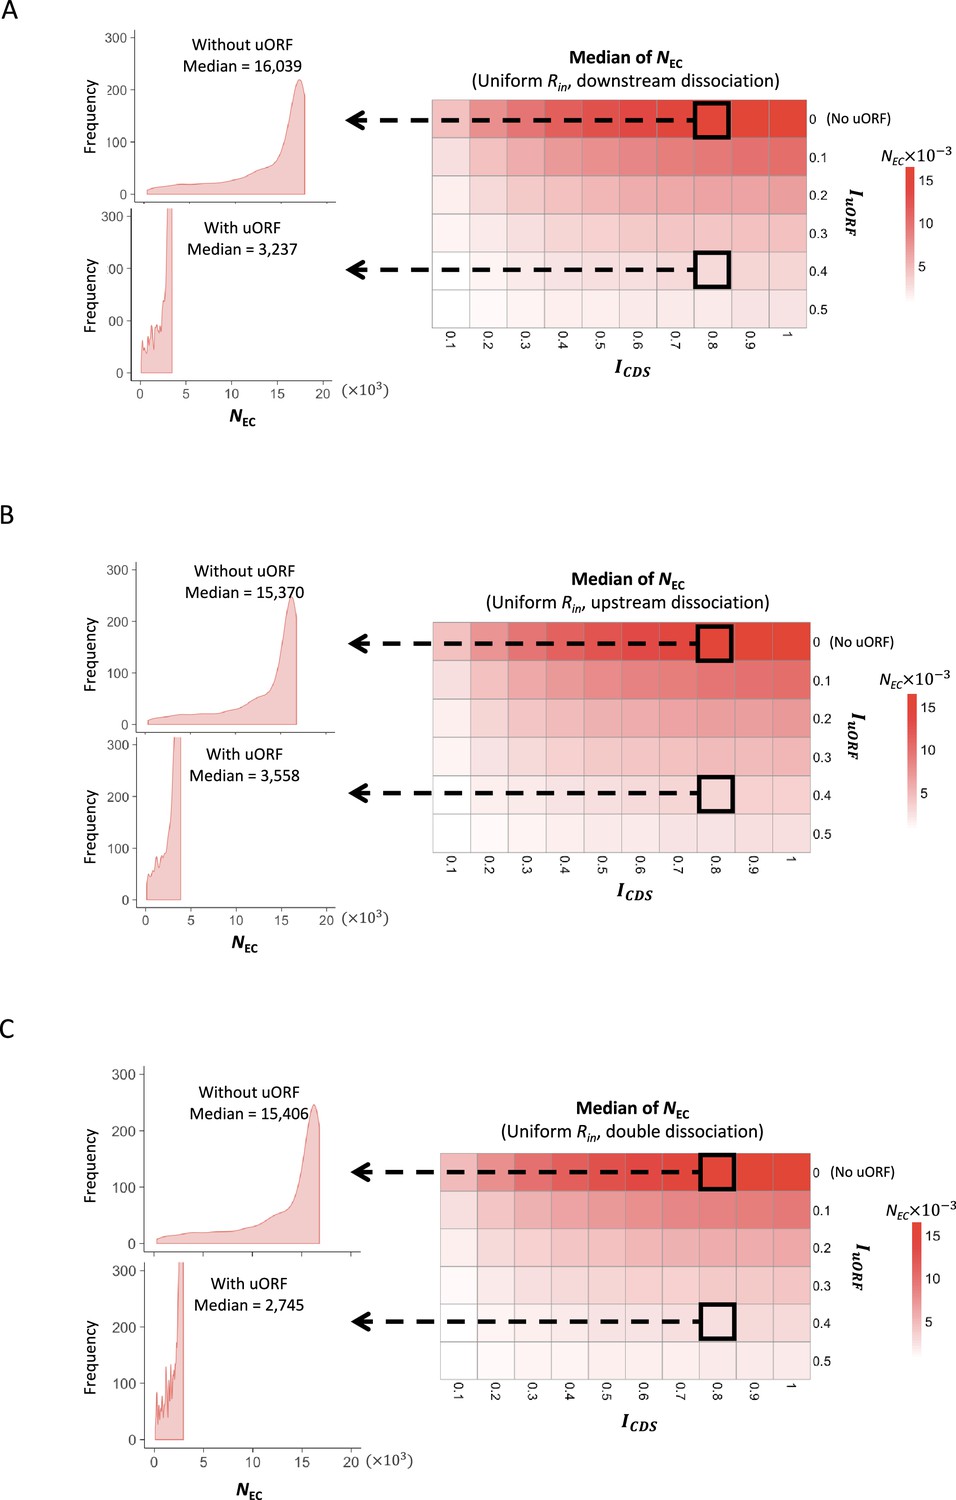
The median of CDS translation rate under uniform distribution of Rin.
Heatmaps showing the median CDS translation rate (NEC) under different ICDS (x-axis) and IuORF (y-axis) combinations with a uniform distribution of Rin input and the downstream dissociation model (A), a uniform distribution of Rin input and the upstream dissociation model (B), a uniform distribution of Rin input and the double dissociation model (C). For each heatmap, the left panels elicited by the dotted lines from specific squares of the right heatmap were two examples showing the distribution of NEC under ICDS = 0.8 and IuORF = 0 (top panel, without uORF) and ICDS = 0.8 and IuORF = 0.4 (bottom panel, with uORF).
-
Figure 1—figure supplement 2—source data 1
Raw numerical data underlying the figures.
- https://cdn.elifesciences.org/articles/104074/elife-104074-fig1-figsupp2-data1-v1.xlsx
Figure 1—figure supplement 3
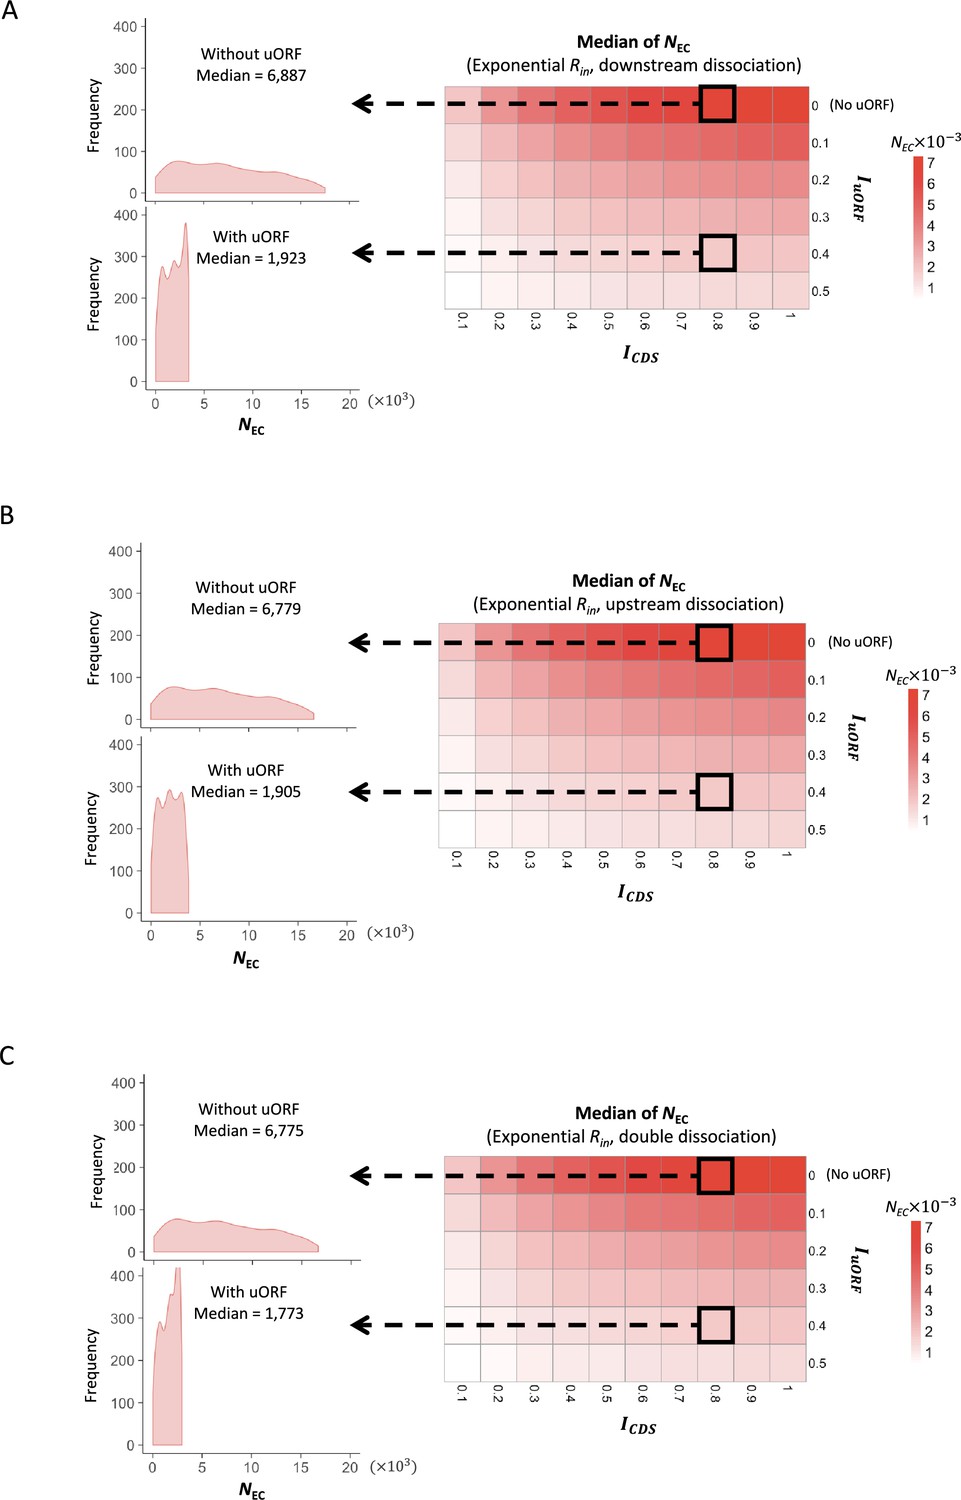
The median of CDS translation rates under exponential distribution of Rin.
Heatmaps showing the median CDS translation rate (NEC) under different ICDS (x-axis) and IuORF (y-axis) combinations with an exponential distribution of Rin input and the downstream dissociation model (A), an exponential distribution of Rin input and the upstream dissociation model (B), an exponential distribution of Rin input and the double dissociation model (C). For each heatmap, the left panels elicited by the dotted lines from specific squares of the right heatmap were two examples showing the distribution of NEC under ICDS = 0.8 and IuORF = 0 (top panel, without uORF) and ICDS = 0.8 and IuORF = 0.4 (bottom panel, with uORF).
-
Figure 1—figure supplement 3—source data 1
Raw numerical data underlying the figures.
- https://cdn.elifesciences.org/articles/104074/elife-104074-fig1-figsupp3-data1-v1.xlsx
Figure 1—figure supplement 4
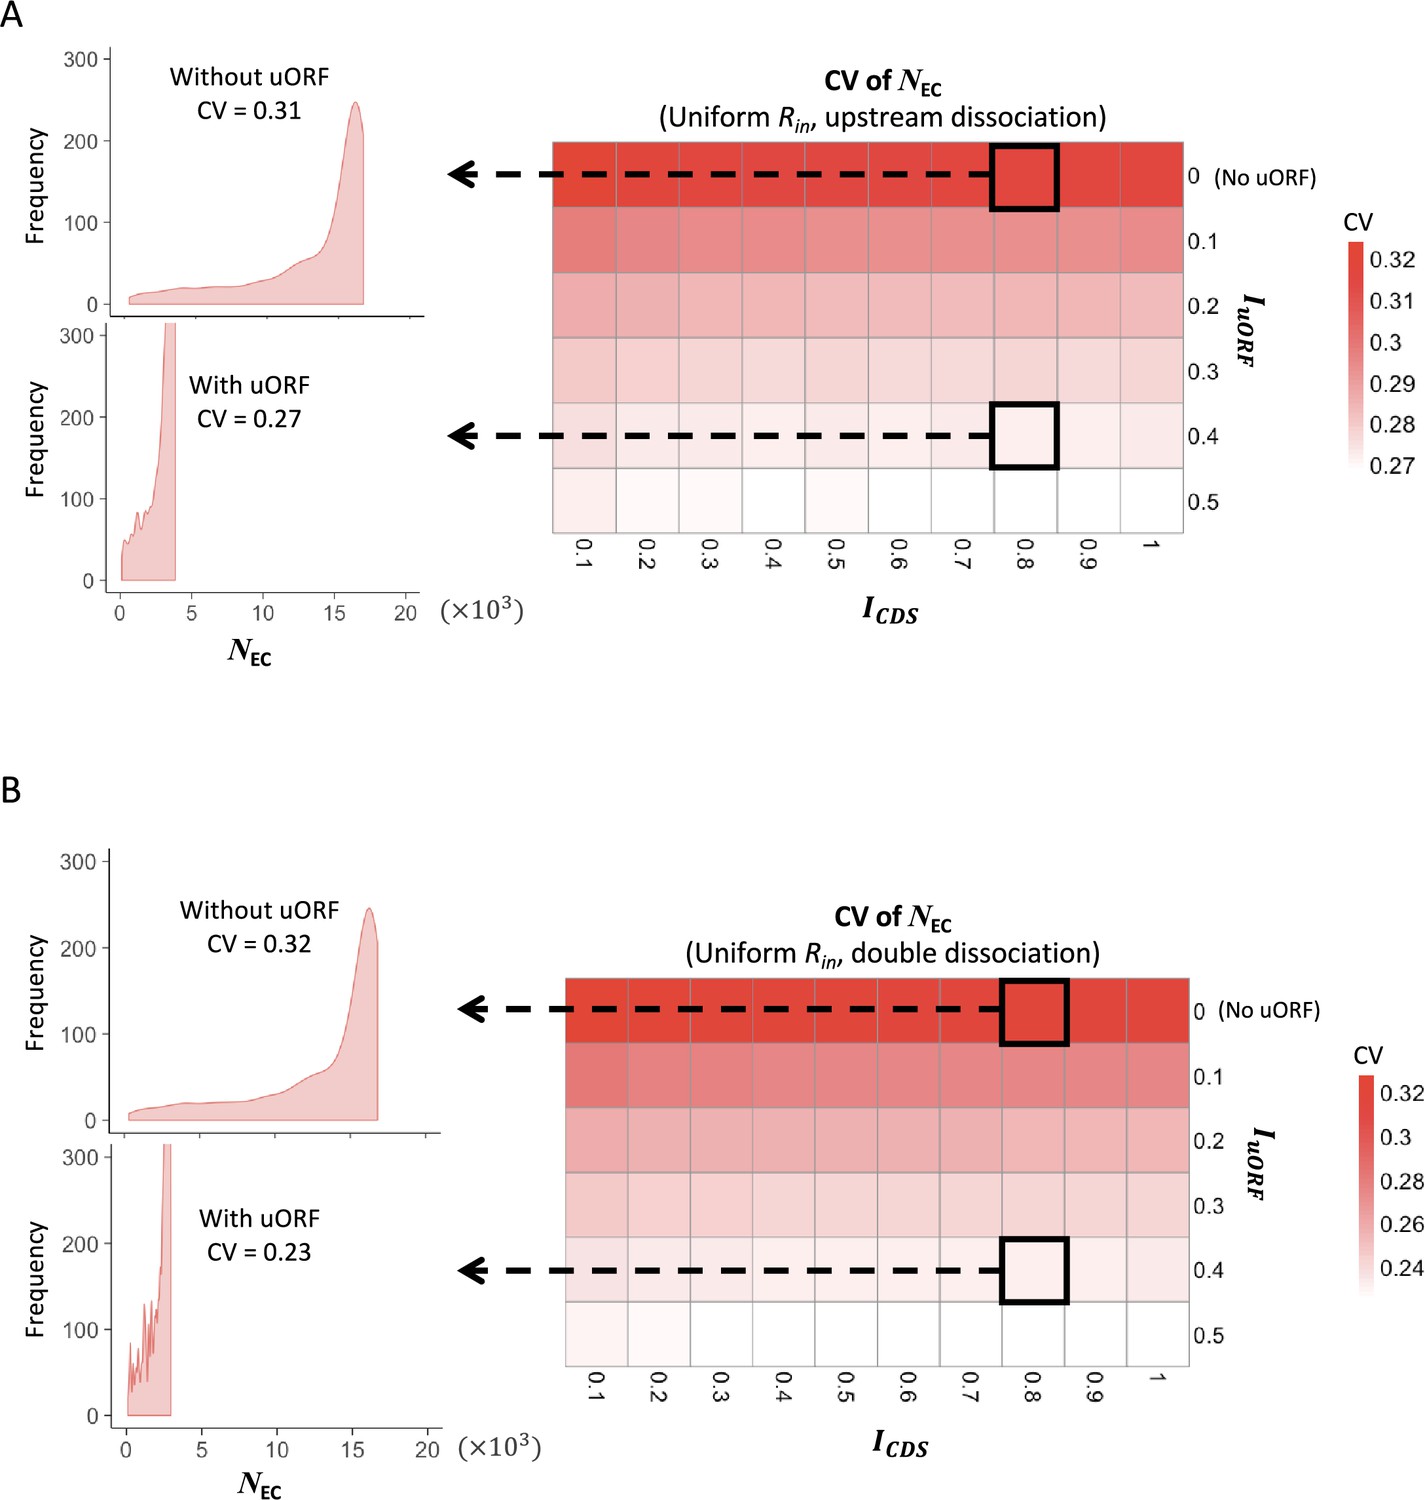
The CVs of CDS translation rates under uniform distribution of Rin.
Heatmaps showing the CVs of CDS translation rate (NEC) under different ICDS (x-axis) and IuORF (y-axis) combinations with a uniform distribution of Rin input and the upstream dissociation model (A), a uniform distribution of Rin input and the double dissociation model (B). For each heatmap, the left panels elicited by the dotted lines from specific squares of the right heatmap were two examples showing the distribution of NEC under ICDS = 0.8 and IuORF = 0 (top panel, without uORF) and ICDS = 0.8 and IuORF = 0.4 (bottom panel, with uORF).
-
Figure 1—figure supplement 4—source data 1
Raw numerical data underlying the figures.
- https://cdn.elifesciences.org/articles/104074/elife-104074-fig1-figsupp4-data1-v1.xlsx
Figure 1—figure supplement 5
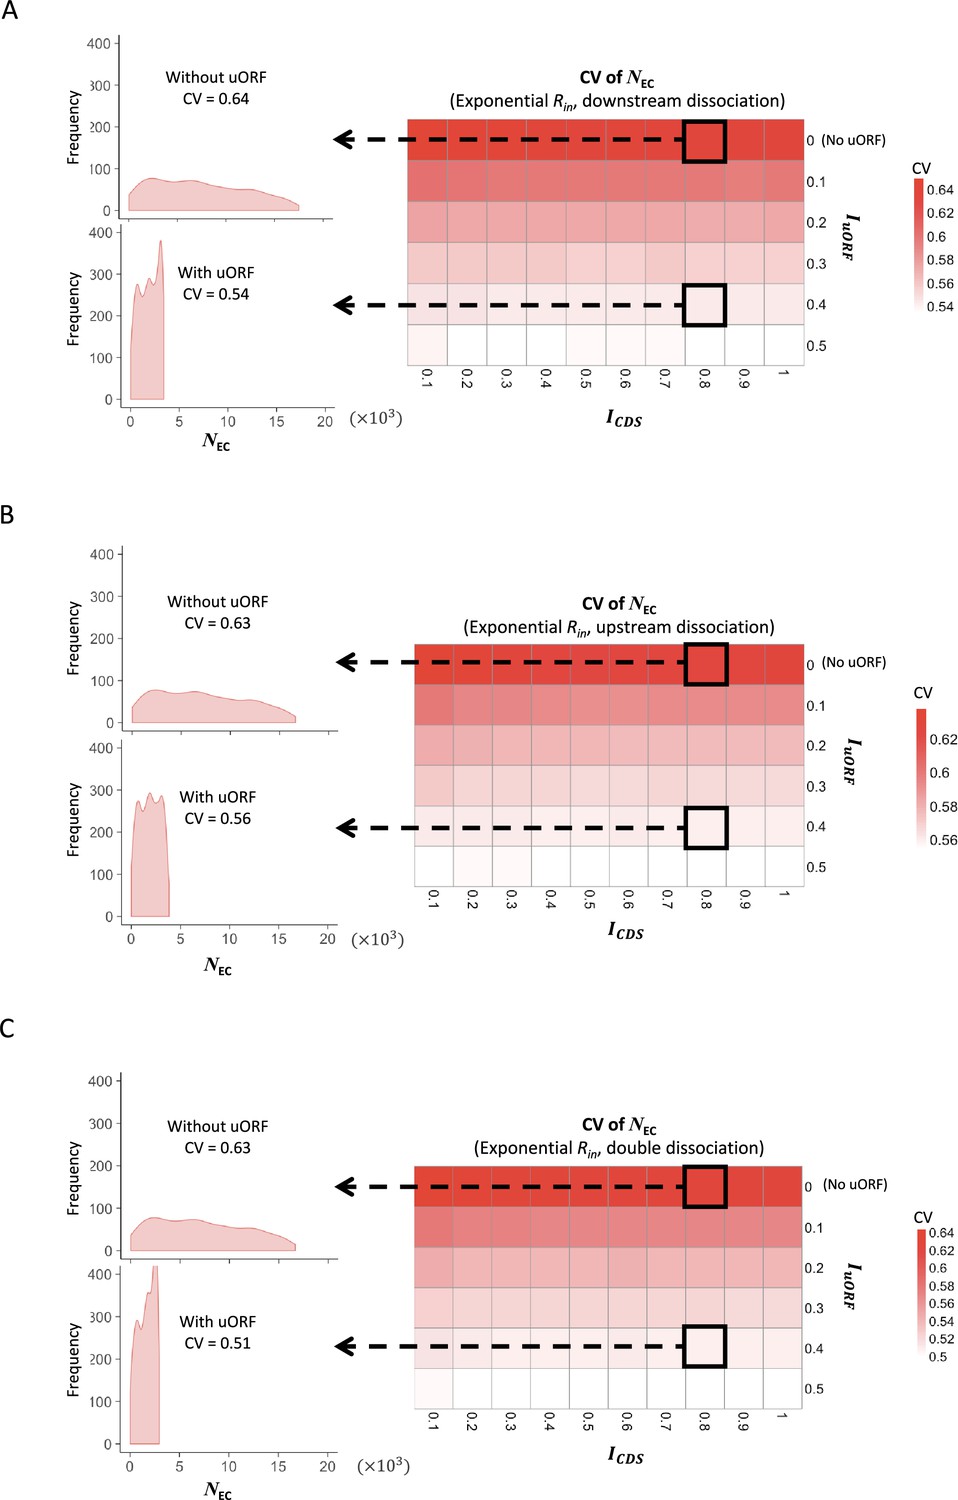
The CVs of CDS translation rate under exponential distribution of Rin .
Heatmaps showing the CVs of CDS translation rate (NEC) under different ICDS (x-axis) and IuORF (y-axis) combinations with an exponential distribution of Rin input and the downstream dissociation model (A), an exponential distribution of Rin input and the upstream dissociation model (B), an exponential distribution of Rin input and the double dissociation model (C). For each heatmap, the left panels elicited by the dotted lines from specific squares of the right heatmap were two examples showing the distribution of NEC under ICDS = 0.8 and IuORF = 0 (top panel, without uORF) and ICDS = 0.8 and IuORF = 0.4 (bottom panel, with uORF).
-
Figure 1—figure supplement 5—source data 1
Raw numerical data underlying the figures.
- https://cdn.elifesciences.org/articles/104074/elife-104074-fig1-figsupp5-data1-v1.xlsx
Figure 1—figure supplement 6
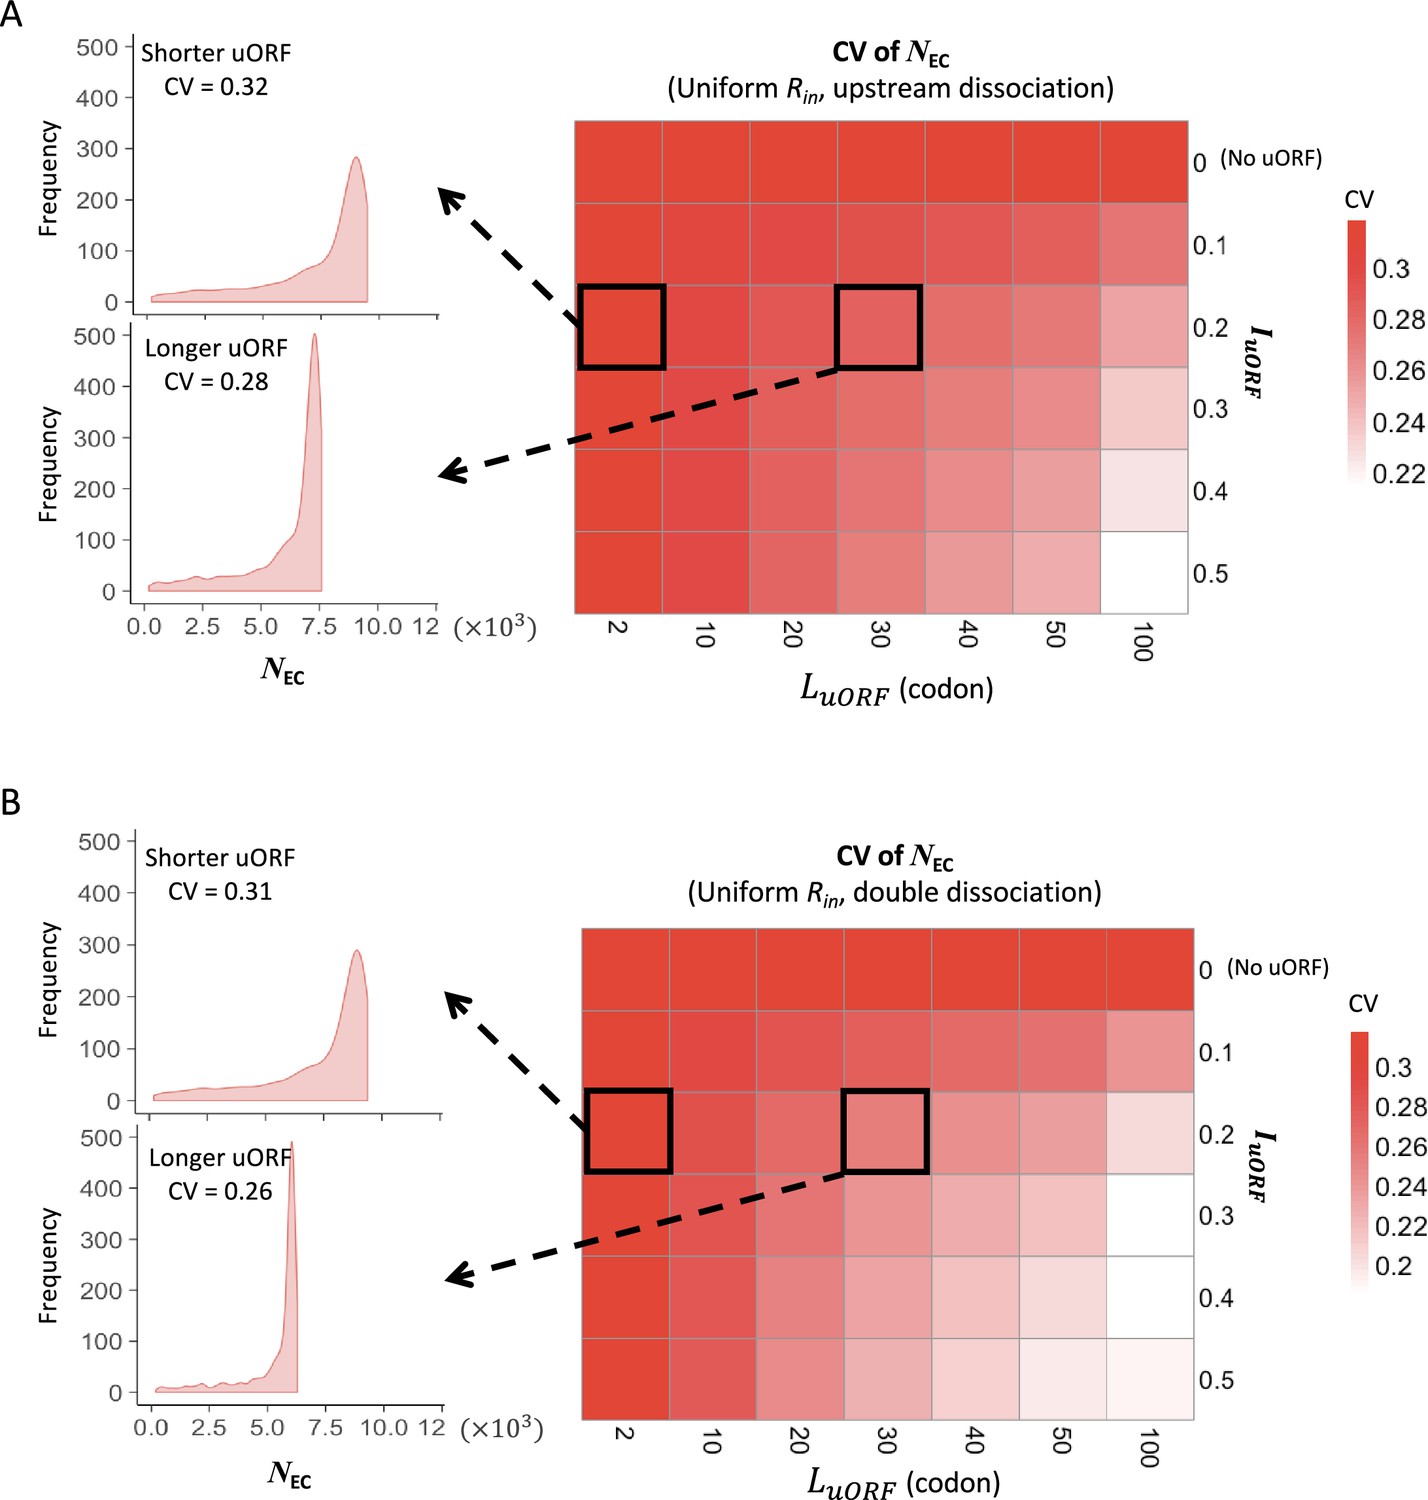
The CVs of CDS translation rates across different uORF length under uniform distribution of Rin.
Heatmaps showing the CVs of CDS translation rate (NEC) under different LuORF (x-axis) and IuORF (y-axis) combinations with a uniform distribution of Rin input and the upstream dissociation model (A), a uniform distribution of Rin input and the double dissociation model (B). For each heatmap, the left panels elicited by the dotted lines from specific squares of the right heatmap were two examples showing the distribution of NEC under LuORF = 2 and IuORF = 0.2 (top panel, shorter uORF) and LuORF = 30 and IuORF = 0.2 (bottom panel, longer uORF).
-
Figure 1—figure supplement 6—source data 1
Raw numerical data underlying the figures.
- https://cdn.elifesciences.org/articles/104074/elife-104074-fig1-figsupp6-data1-v1.xlsx
Figure 1—figure supplement 7
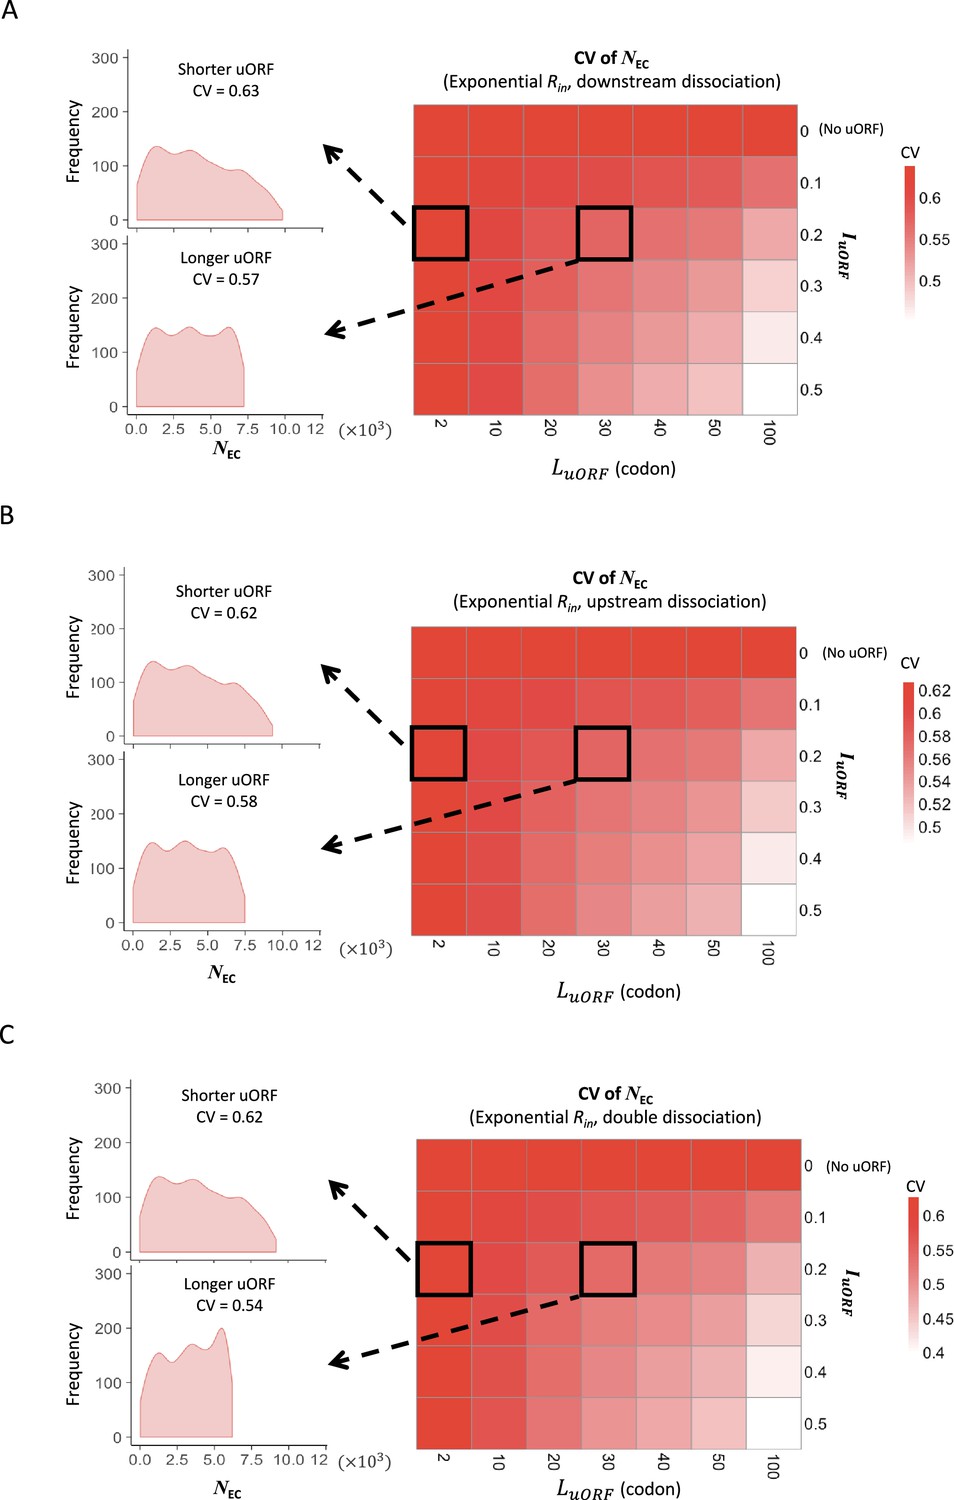
The CVs of CDS translation rates across different uORF length under uniform distribution of exponential distribution of Rin.
Heatmaps showing the CVs of CDS translation rate (NEC) under different LuORF (x-axis) and IuORF (y-axis) combinations with an exponential distribution of Rin input and the downstream dissociation model (A), an exponential distribution of Rin input and the upstream dissociation model (B), an exponential distribution of Rin input and the double dissociation model (C). For each heatmap, the left panels elicited by the dotted lines from specific squares of the right heatmap were two examples showing the distribution of NEC under LuORF = 2 and IuORF = 0.2 (top panel, shorter uORF) and LuORF = 30 and IuORF = 0.2 (bottom panel, longer uORF).
-
Figure 1—figure supplement 7—source data 1
Raw numerical data underlying the figures.
- https://cdn.elifesciences.org/articles/104074/elife-104074-fig1-figsupp7-data1-v1.xlsx
Figure 1—figure supplement 8
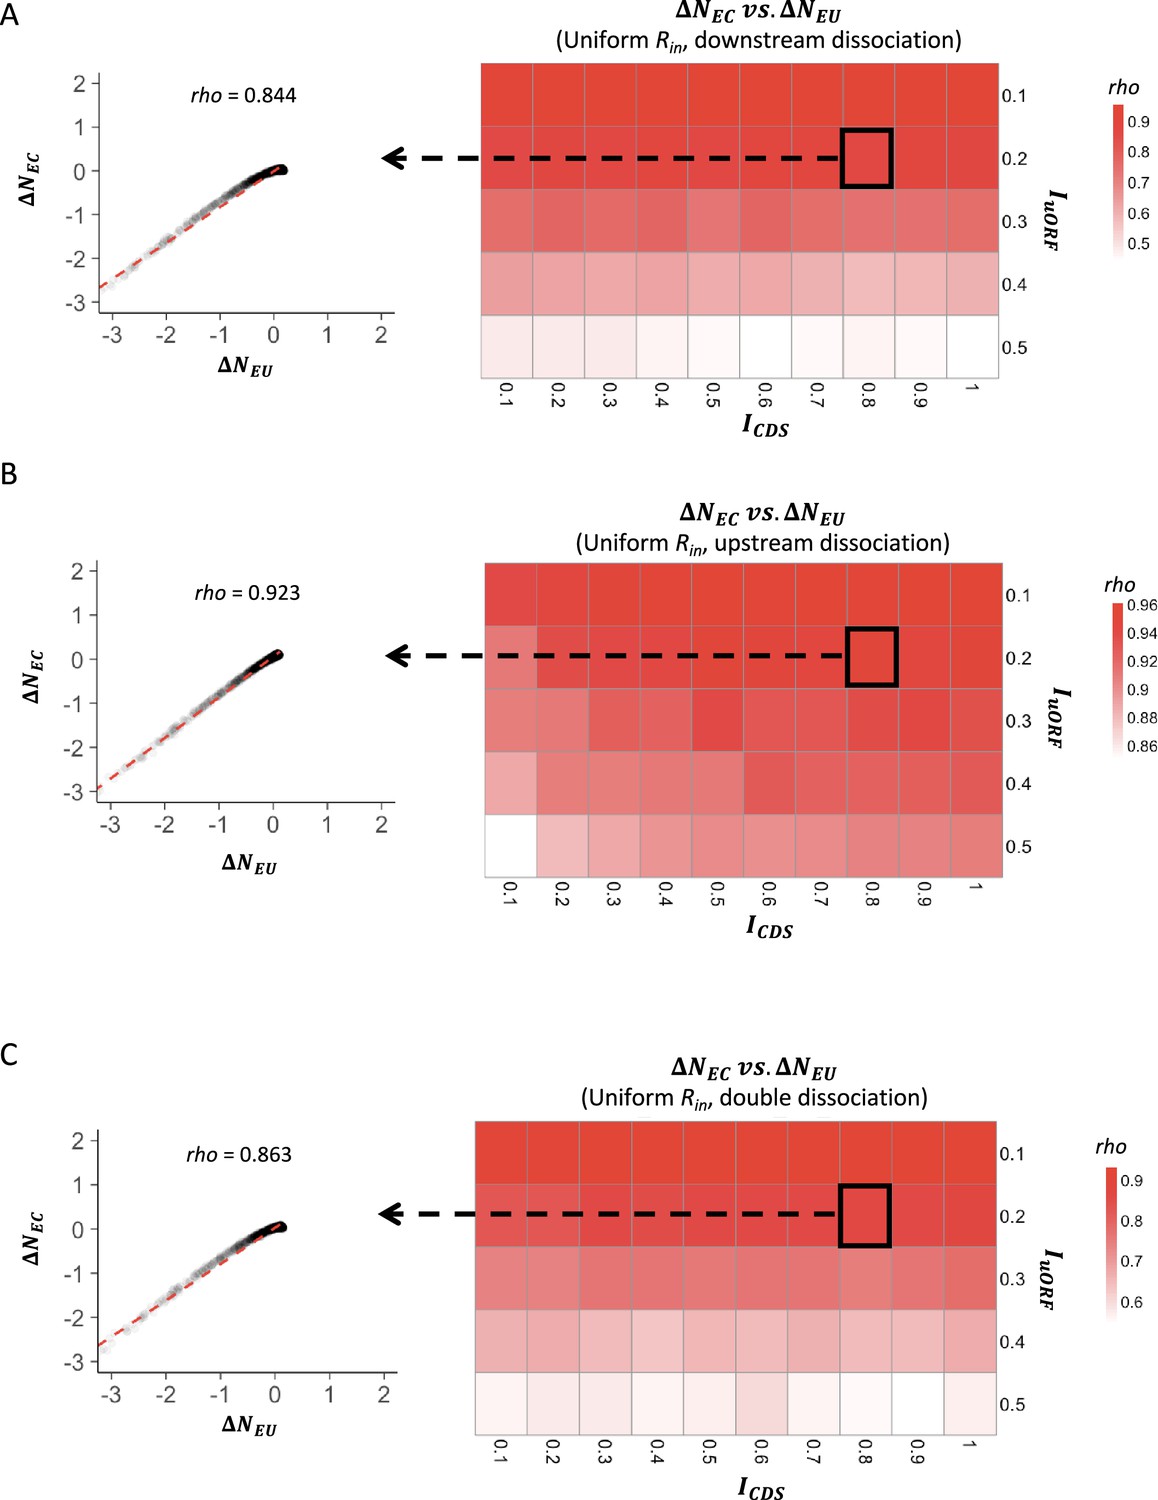
The correlations between changes of uORF translation rate and downstream CDS translation rate under uniform distribution of Rin.
Heatmaps showing the Spearman’s correlations between changes of uORF translation rate () and downstream CDS translation rate () under different ICDS (x-axis) and IuORF (y-axis) combinations with a uniform distribution of Rin input and the downstream dissociation model (A), a uniform distribution of Rin input and the upstream dissociation model (B), a uniform distribution of Rin input and the double dissociation model (C). For each heatmap, the left panel elicited by the dotted line from the specific square of the right heatmap was an example showing the Spearman’s correlations between changes of uORF translation rate () and downstream CDS translation rate () under ICDS = 0.8 & IuORF = 0.2. All p-values <0.001.
-
Figure 1—figure supplement 8—source data 1
Raw numerical data underlying the figures.
- https://cdn.elifesciences.org/articles/104074/elife-104074-fig1-figsupp8-data1-v1.xlsx
Figure 1—figure supplement 9
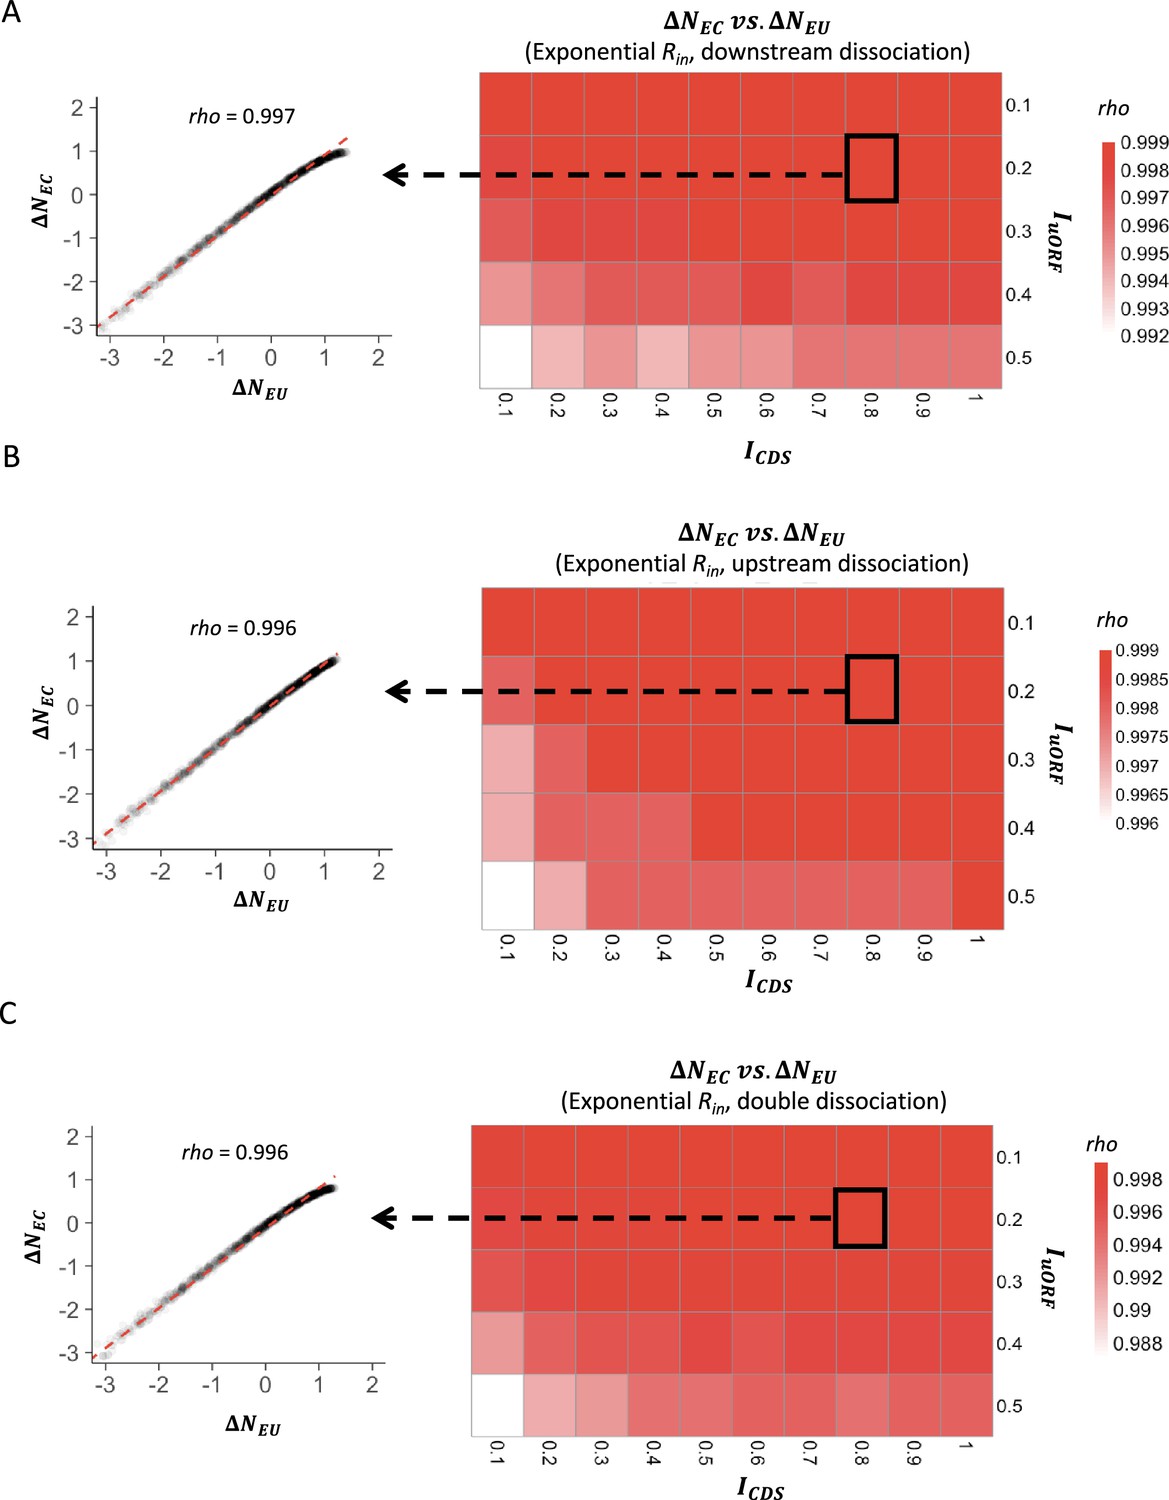
The correlations between changes of uORF translation rate and downstream CDS translation rate under exponential distribution of Rin.
Heatmaps showing the Spearman’s correlations between changes of uORF translation rate () and downstream CDS translation rate () under different ICDS (x-axis) and IuORF (y-axis) combinations with an exponential distribution of Rin input and the downstream dissociation model (A), an exponential distribution of Rin input and the upstream dissociation model (B), an exponential distribution of Rin input and the double dissociation model (C). For each heatmap, the left panel elicited by the dotted line from the specific square of the right heatmap was an example showing the Spearman’s correlations between changes of uORF translation rate () and downstream CDS translation rate () under ICDS = 0.8 and IuORF = 0.2. All p-values <0.001.
-
Figure 1—figure supplement 9—source data 1
Raw numerical data underlying the figures.
- https://cdn.elifesciences.org/articles/104074/elife-104074-fig1-figsupp9-data1-v1.xlsx
Figure 1—figure supplement 10
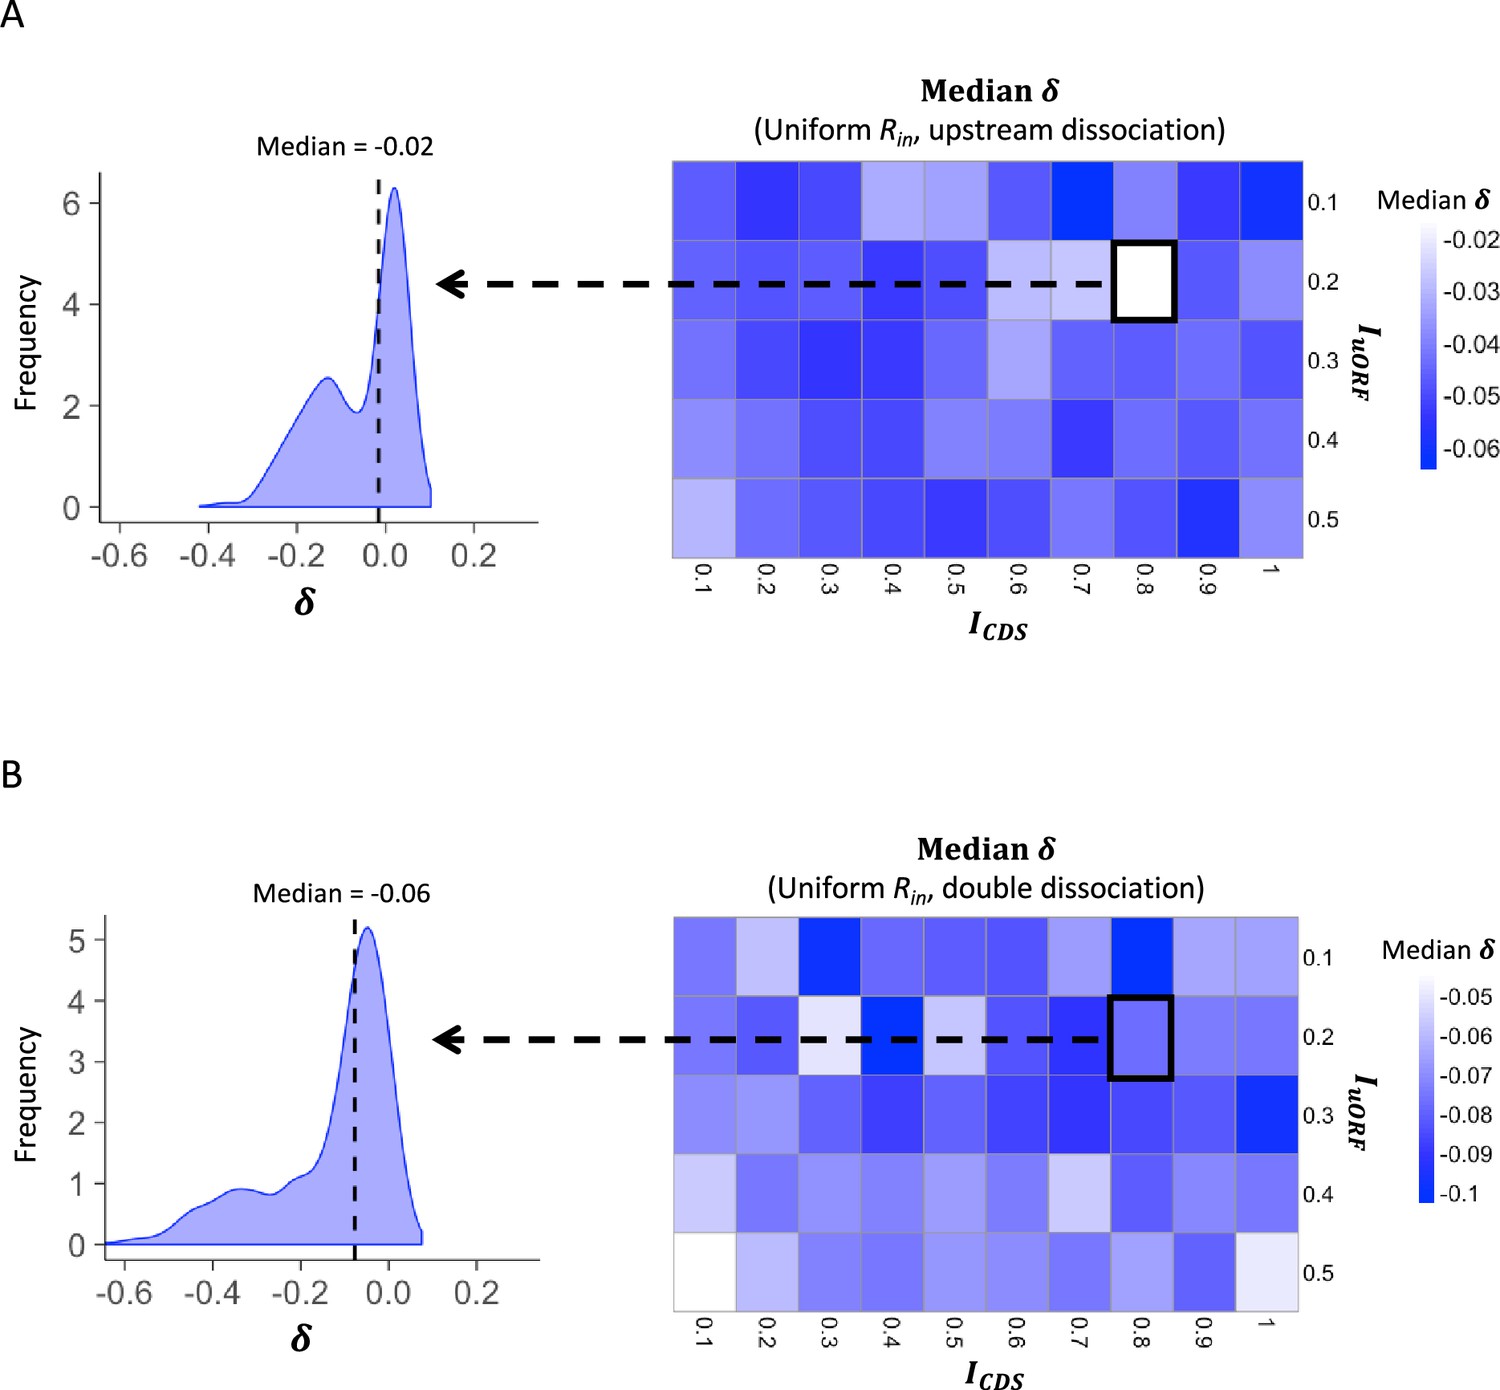
The median δ under uniform distribution of Rin.
Heatmaps showing the median under different ICDS (x-axis) and IuORF (y-axis) combinations with a uniform distribution of Rin input and the upstream dissociation model (A), a uniform distribution of Rin input, and the double dissociation model (B). For each heatmap, the left panel elicited by the dotted line from the specific square of the right heatmap was an example showing the distribution of under ICDS = 0.8 and IuORF = 0.2. The vertical dashed line indicated the median value of .
-
Figure 1—figure supplement 10—source data 1
Raw numerical data underlying the figures.
- https://cdn.elifesciences.org/articles/104074/elife-104074-fig1-figsupp10-data1-v1.xlsx
Figure 1—figure supplement 11
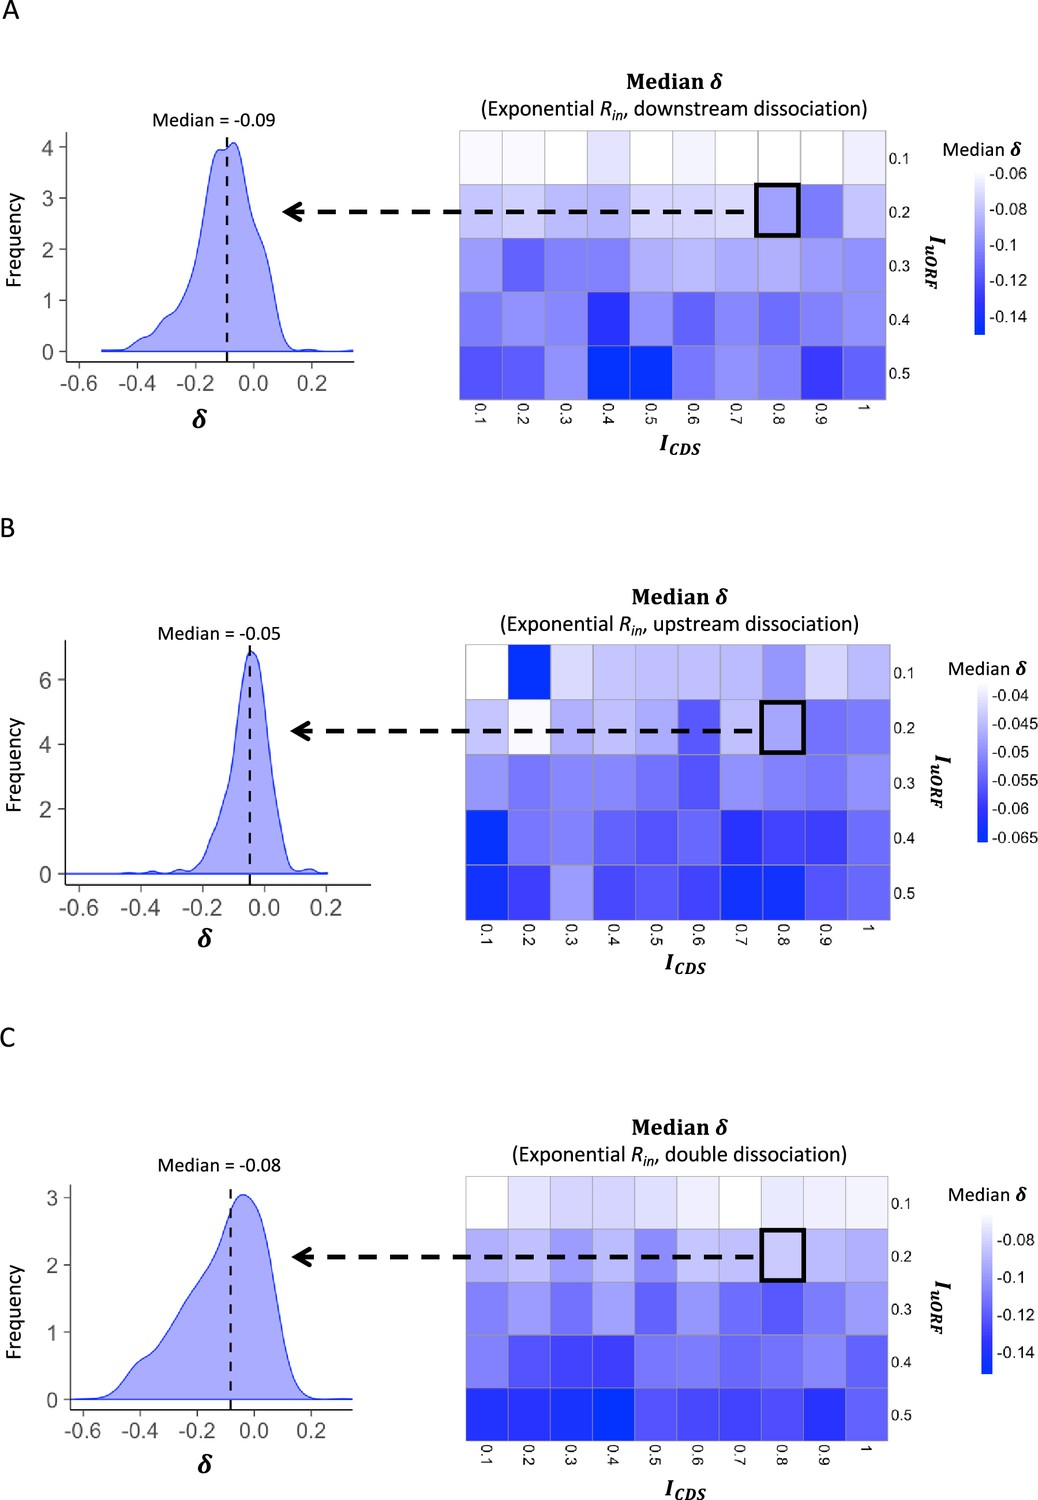
The median δ under exponential distribution of Rin.
Heatmaps showing the median under different ICDS (x-axis) and IuORF (y-axis) combinations with an exponential distribution of Rin input and the downstream dissociation model (A), an exponential distribution of Rin input and the upstream dissociation model (B), an exponential distribution of Rin input and the double dissociation model (C). For each heatmap, the left panel elicited by the dotted line from the specific square of the right heatmap was an example showing the distribution of under ICDS = 0.8 and IuORF = 0.2. The vertical dashed line indicated the median value of .
-
Figure 1—figure supplement 11—source data 1
Raw numerical data underlying the figures.
- https://cdn.elifesciences.org/articles/104074/elife-104074-fig1-figsupp11-data1-v1.xlsx
Figure 1—figure supplement 12
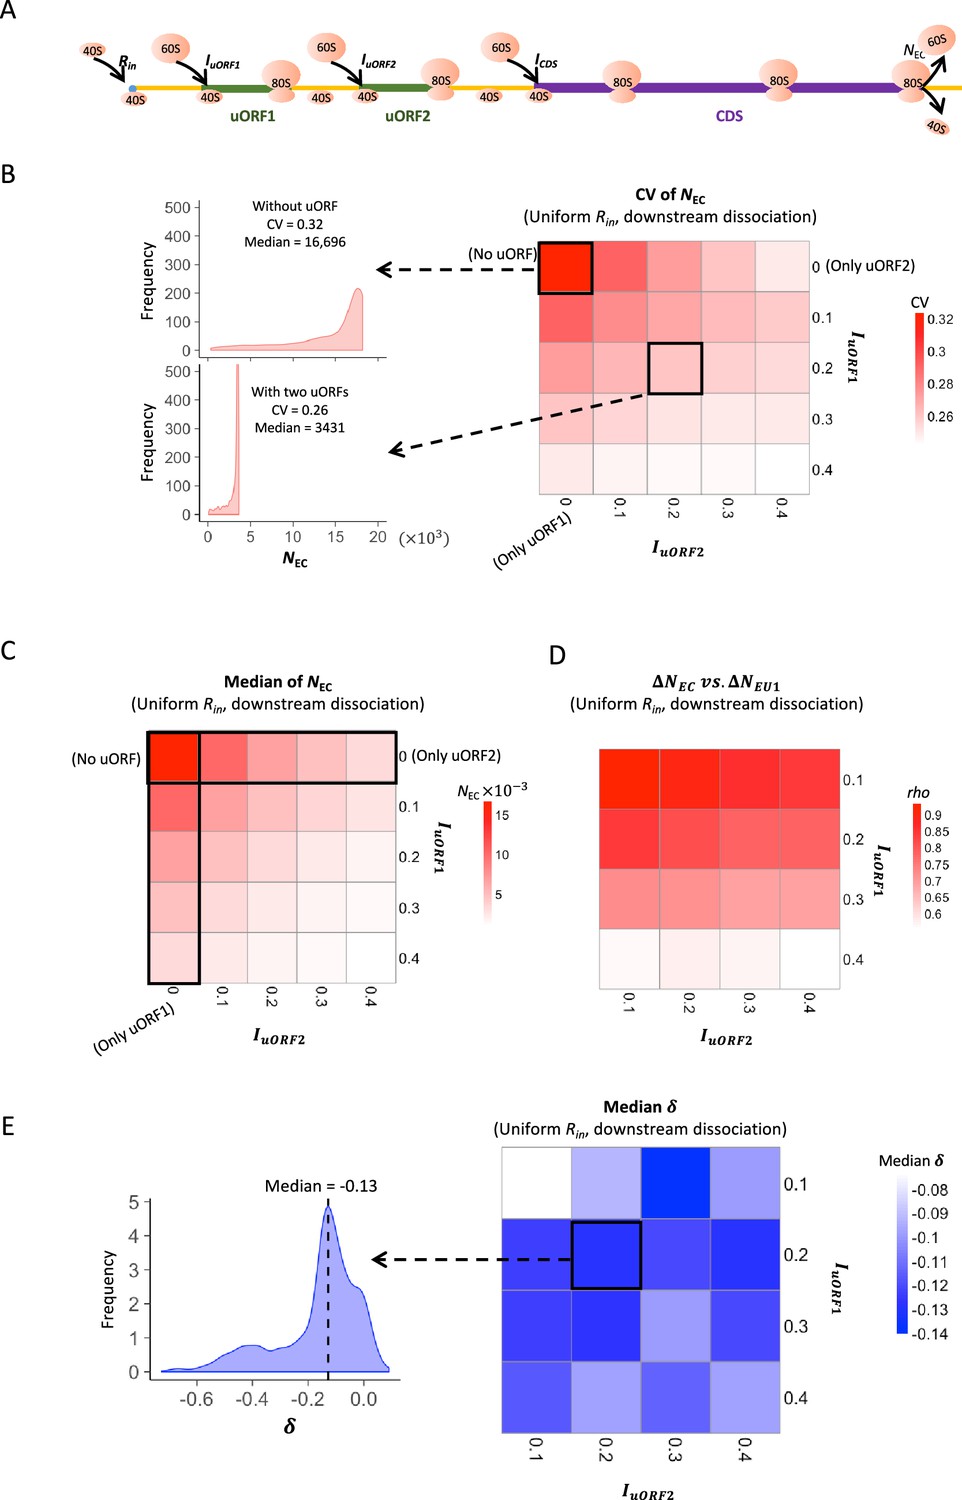
Two-uORF model simulation measurements.
(A) The two-uORF model schema. The factors and parameters were the same as those illustrated in Figure 1A except where specifically indicated. (B) Heatmap showing the CVs of CDS translation rate (NEC) under different IuORF2 (x-axis) and IuORF1 (y-axis) combinations with a uniform distribution of Rin input and the downstream dissociation model. The left panels elicited by the dotted lines from specific squares of the right heatmap were two examples showing the distribution of NEC under IuORF1=0 & IuORF2=0 (top panel, without uORF) and IuORF1=0.2 & IuORF2=0.2 (bottom panel, with two uORFs). (C) Heatmap showing the median CDS translation rate (NEC) under different IuORF2 (x-axis) and IuORF1 (y-axis) combinations with a uniform distribution of Rin input and the downstream dissociation model. (D) Spearman’s correlations between changes of uORF1 translation rate () and downstream CDS translation rate () under different IuORF2 (x-axis) and IuORF1 (y-axis) combinations with a uniform distribution of Rin input and the downstream dissociation model. (E) Heatmap showing the median under different IuORF2 (x-axis) and IuORF1 (y-axis) combinations with a uniform distribution of Rin input and the downstream dissociation model. The left panel elicited by the dotted line from the specific square of the right heatmap was an example showing the distribution of under IuORF1=0.2 and IuORF2=0.2. The vertical dashed line indicated the median value of .
-
Figure 1—figure supplement 12—source data 1
Raw numerical data underlying the figures.
- https://cdn.elifesciences.org/articles/104074/elife-104074-fig1-figsupp12-data1-v1.xlsx
Figure 1—figure supplement 13
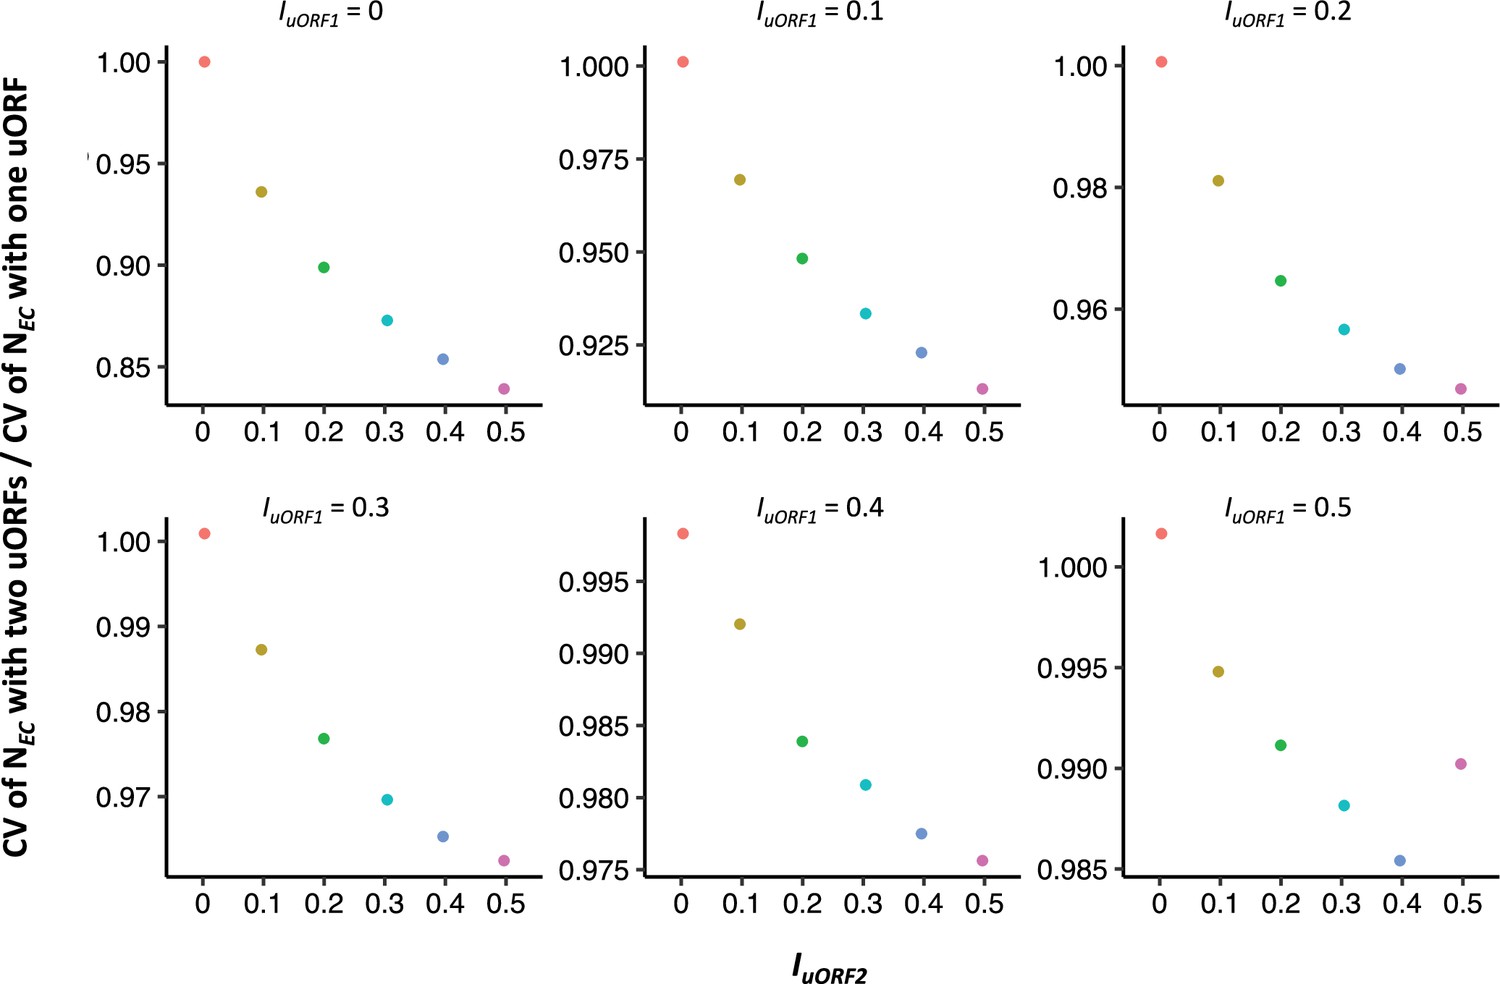
Comparison of the buffering effects between single uORF and two uORFs.
In each panel, the of single-uORF model equals to of two-uORF model, with both values ranging from 0 to 0.5. The x-axis in each panel denotes the values of different in the two-uORF model, ranging from 0 to 0.5. The y-axis in each panel represents the ratio of the CV of with two uORFs to that with a single uORF.
-
Figure 1—figure supplement 13—source data 1
Raw numerical data underlying the figures.
- https://cdn.elifesciences.org/articles/104074/elife-104074-fig1-figsupp13-data1-v1.xlsx
Figure 2 with 2 supplements
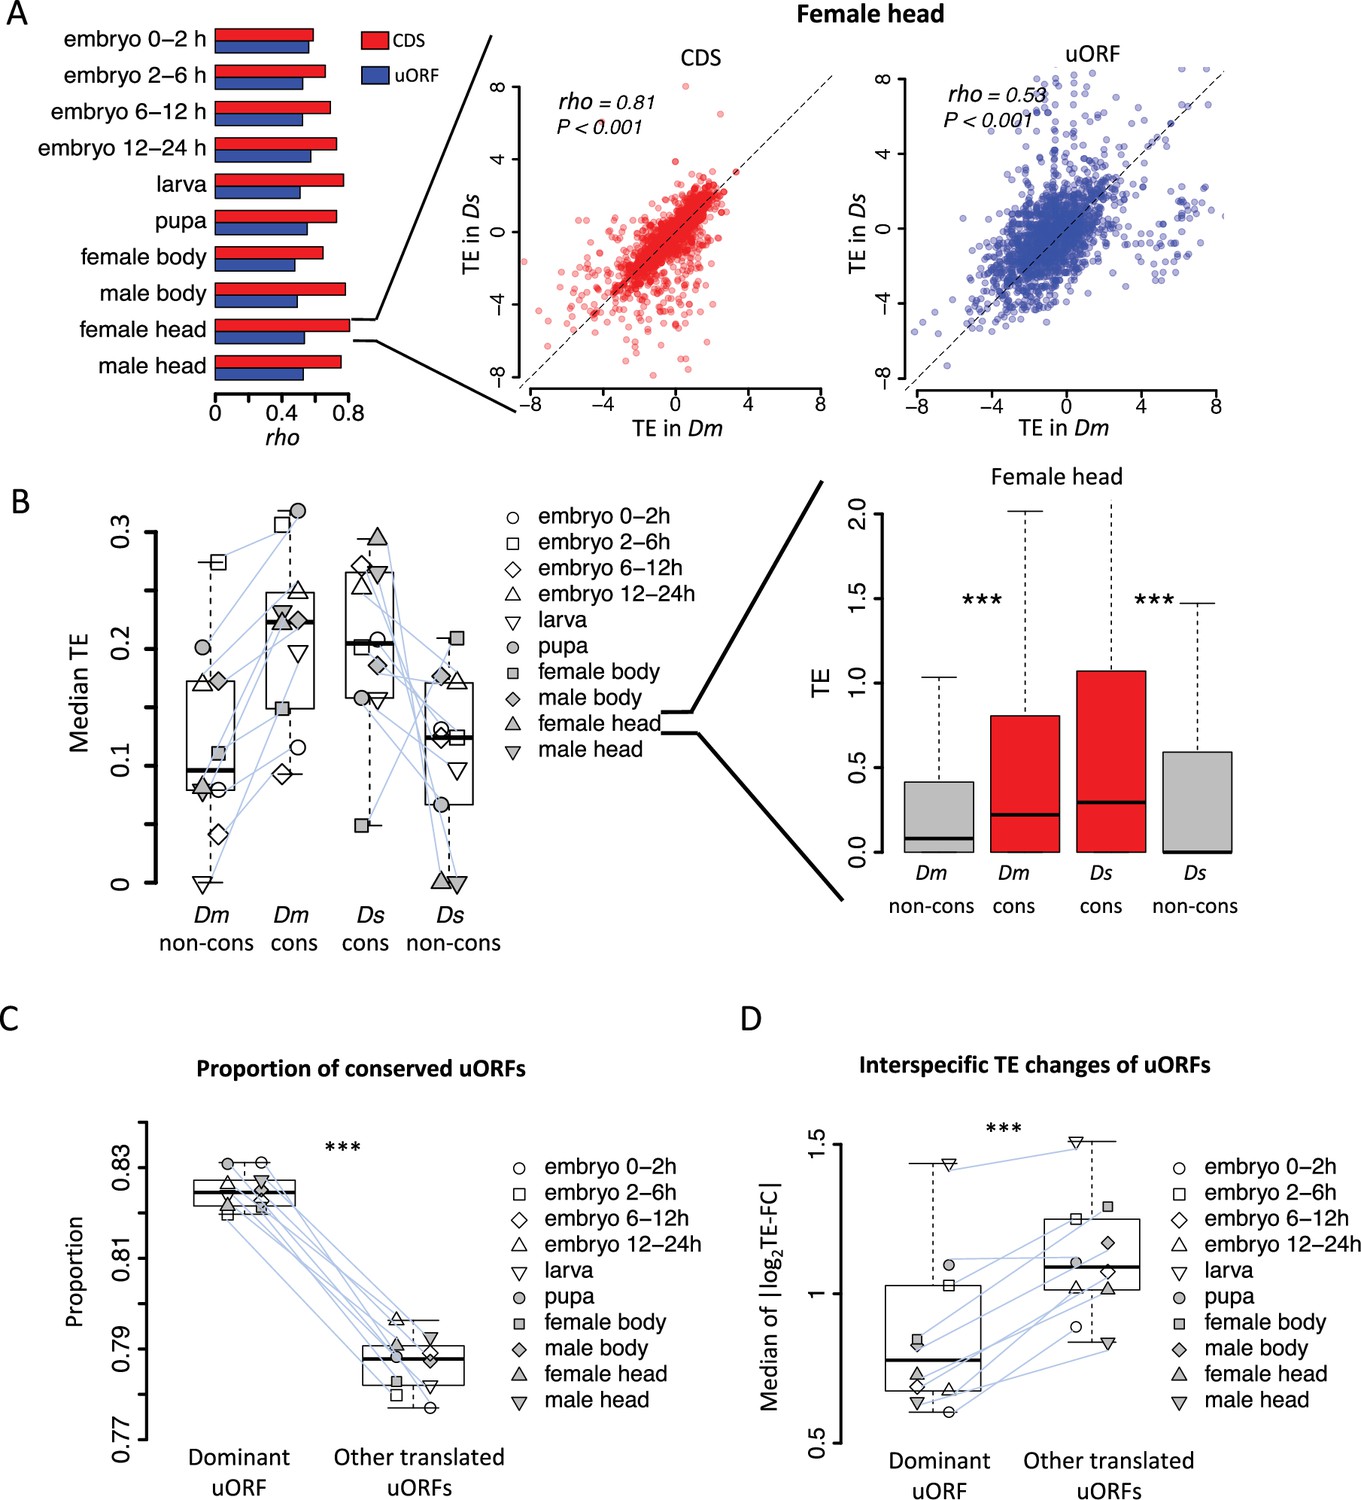
Conservation and translation of uORFs between D. melanogaster and D. simulans.
(A) Spearman’s correlation coefficients (rho, represented by the bars) of TEs between Dm (D. melanogaster) and Ds (D. simulans) for CDS (red) and uORFs (blue). All P-values for Spearman’s correlation are less than 0.001. The p value for the comparison between rho values of CDSs TE and uORFs TE is 0.002 (Wilcoxon signed-rank test). Data for the female head sample is shown as an example in the right panel. The x- and y-axes represent the TEs in Dm and Ds. (B) The median of TE of conserved and species-specific uORFs in each sample. Each dot represents the median TE of a sample for a specific uORF class. Data from the female head sample is shown as an example in the right panel. p values were obtained from Wilcoxon rank-sum tests. ***, p<0.001. (C) Fraction of conserved uORFs among dominant uORFs and other translated uORFs in each sample. The paired samples in Dm and Ds were linked together. The p value was obtained by the paired Wilcoxon signed-rank test. ***, p<0.001. (D) Absolute values of the interspecific TE fold changes (log2TE-FC) of dominant uORFs and the other translated uORFs in each sample. The paired samples in Dm and Ds were linked together. The median value of each sample is shown. The p value was obtained via the paired Wilcoxon signed-rank test. ***, p<0.001. Data from the female head sample were used as an example in the right panel.
-
Figure 2—source data 1
Raw numerical data underlying the figures.
- https://cdn.elifesciences.org/articles/104074/elife-104074-fig2-data1-v1.xlsx
Figure 2—figure supplement 1

The dominant uORF showed the highest TE than other uORFs with the same gene.
uORFs were ranked by decreasing TEs within each gene. The uORF with the highest TE within each gene was defined as the dominant uORF (#1). ‘#2’ represents the second highest uORF TE and the same goes for ‘#3’ and ‘>3’. Each dot represents the median TE of a sample.
-
Figure 2—figure supplement 1—source data 1
Raw numerical data underlying the figures.
- https://cdn.elifesciences.org/articles/104074/elife-104074-fig2-figsupp1-data1-v1.xlsx
Figure 2—figure supplement 2
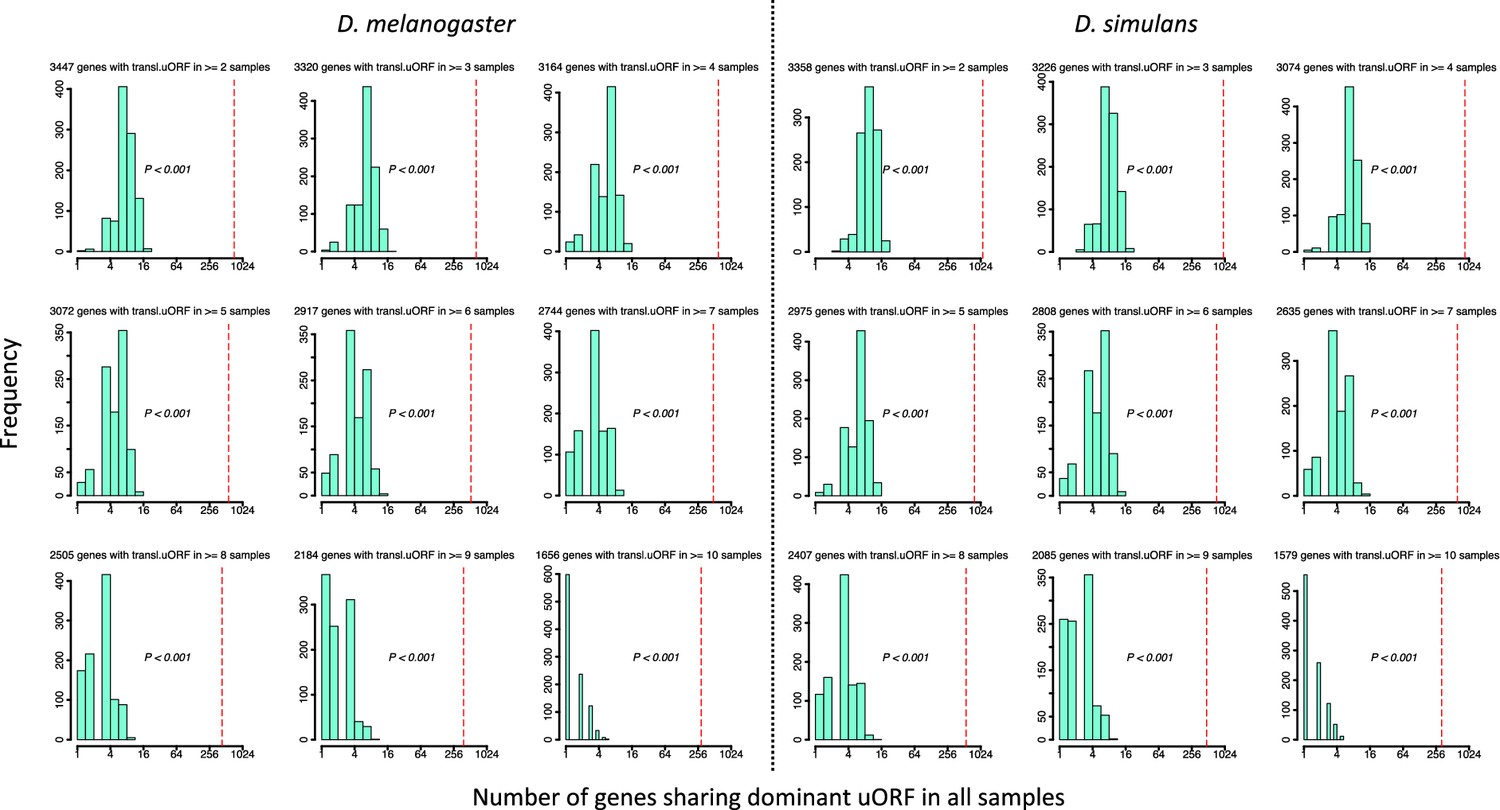
Observed and expected numbers of genes sharing dominant uORFs in all samples.
Among the genes of D. melanogaster (where only the longest transcripts were considered), 7259 (52.2%) genes had no uORF (‘no-uORF’ genes), 2687 (19.3%) genes had one uORF (‘one-uORF’ genes), and 3961 (28.5%) genes had multiple (≥2) uORFs (‘multiple-uORF’ genes). The numbers in the header of each panel represent genes with translated uORFs (TE >0.1) in ≥N samples (2≤N ≤ 10). The TEs of all uORFs were shuffled 1000 times. p values were obtained from randomization tests.
-
Figure 2—figure supplement 2—source data 1
Raw numerical data underlying the figures.
- https://cdn.elifesciences.org/articles/104074/elife-104074-fig2-figsupp2-data1-v1.xlsx
Figure 3 with 6 supplements
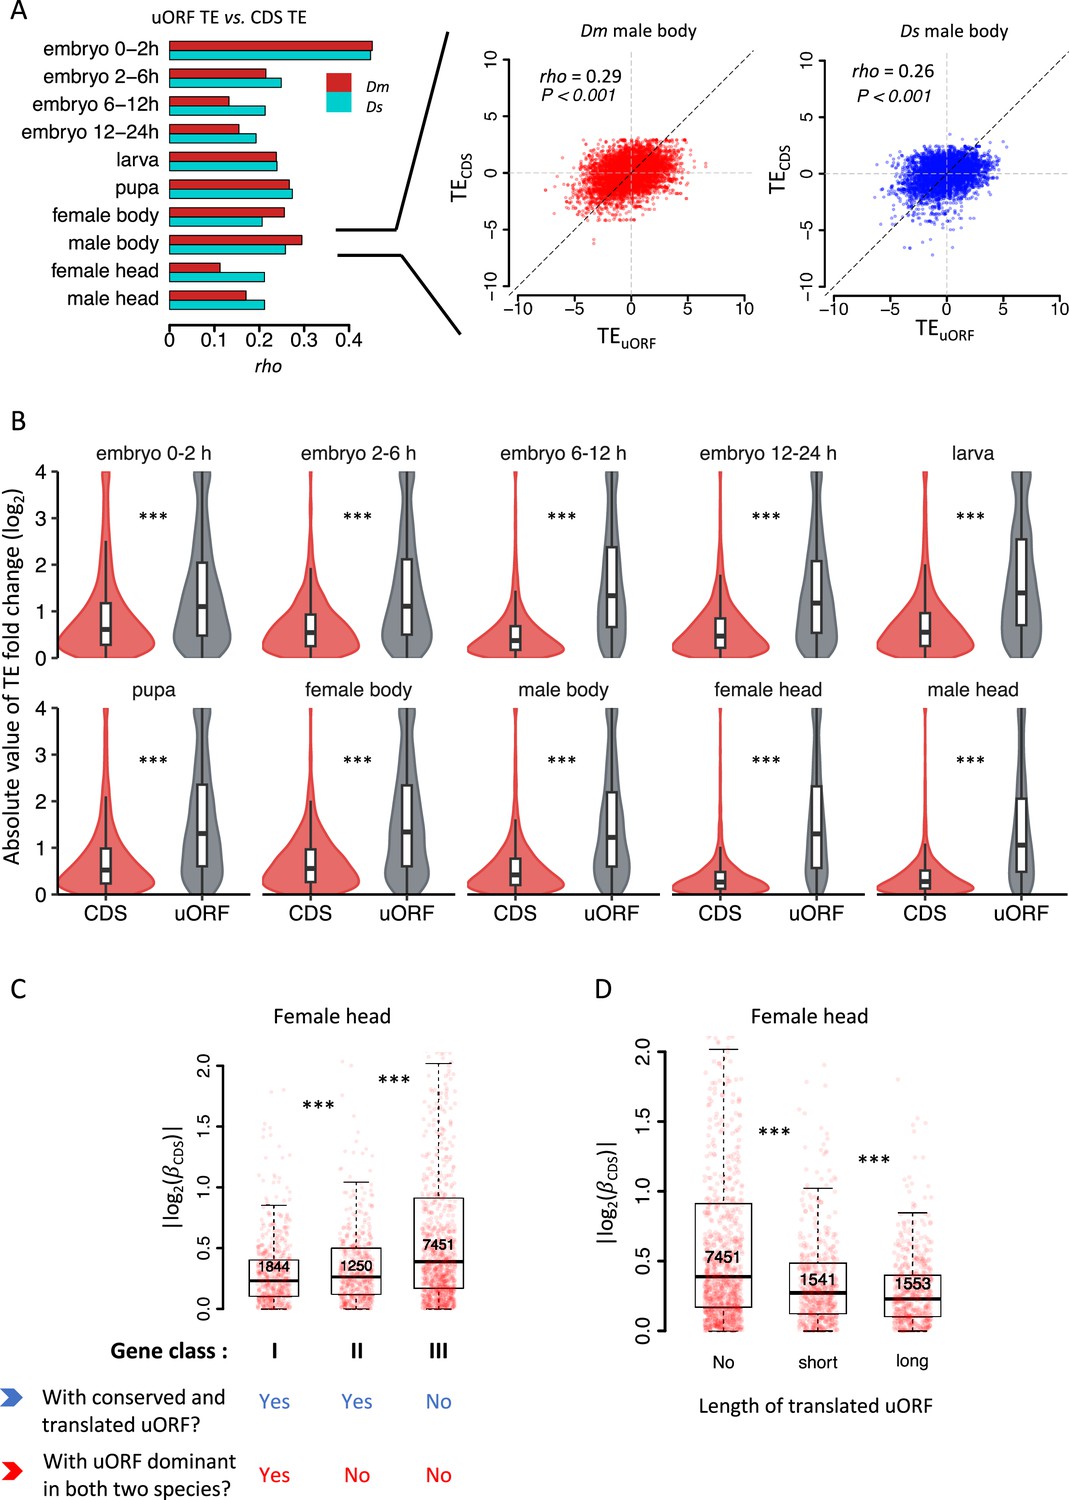
uORFs reduce CDS translational divergence between D. melanogaster and D. simulans.
(A) The correlation of uORF TEs and the corresponding CDS TEs in 10 samples of Dm (D. melanogaster) and Ds (D. simulans). The bars represent Spearman’s correlation coefficient (rho). In all samples, we obtained both p-values <0.001. Data for the female head sample of Dm and Ds are shown as examples in the right panel. (B) The absolute values of interspecific TE changes for CDS and uORF in each sample between two species. For visualization purposes, all values greater than 4 were assigned a value of 4. ***, p<0.001, Wilcoxon rank-sum test. (C) Genes expressed in female heads (mRNA RPKM >0.1 in both species) were classified into three classes according to whether a gene had a conserved and dominantly translated uORF or not. Boxplots showing interspecific CDS TE variability || of different gene classes. p values were calculated using Wilcoxon rank-sum tests between the neighboring groups. ***, p<0.001. (D) Genes expressed in female heads were classified into three classes according to the length of translated uORFs. Boxplots showing interspecific CDS TE variability || of different gene classes. p values were calculated using Wilcoxon rank-sum tests between the neighboring groups. ***, p<0.001.
-
Figure 3—source data 1
Raw numerical data and statistical analysis underlying the figures.
- https://cdn.elifesciences.org/articles/104074/elife-104074-fig3-data1-v1.xlsx
Figure 3—figure supplement 1
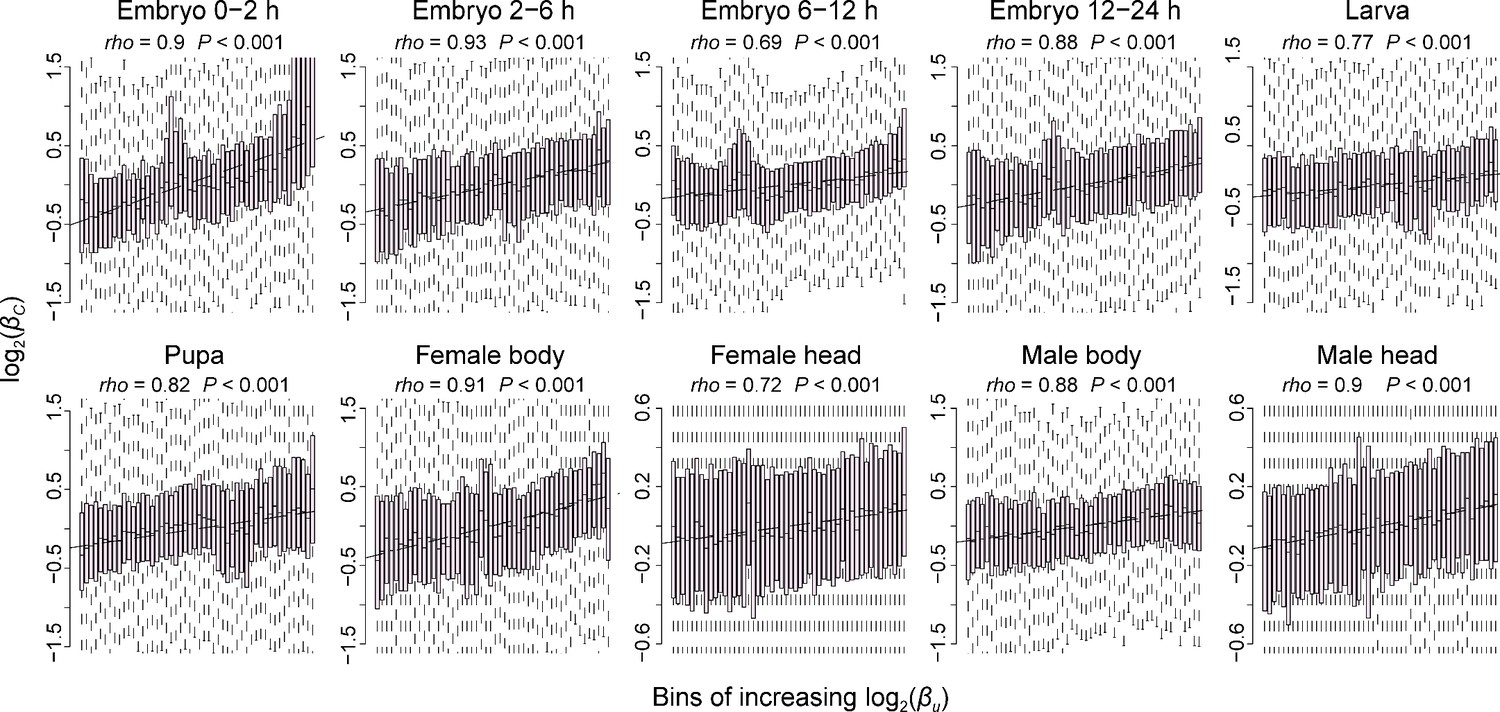
The positive correlation of interspecific TE changes between uORFs and CDSs.
Correlations between interspecific uORF TE changes () and CDS TE changes () in 10 samples. The x-axis was divided into 50 equal bins with increasing . Spearman’s correlation coefficients (rho) are shown at the top left. ***, p<0.001 in the correlation test.
-
Figure 3—figure supplement 1—source data 1
Raw numerical data underlying the figures.
- https://cdn.elifesciences.org/articles/104074/elife-104074-fig3-figsupp1-data1-v1.xlsx
Figure 3—figure supplement 2
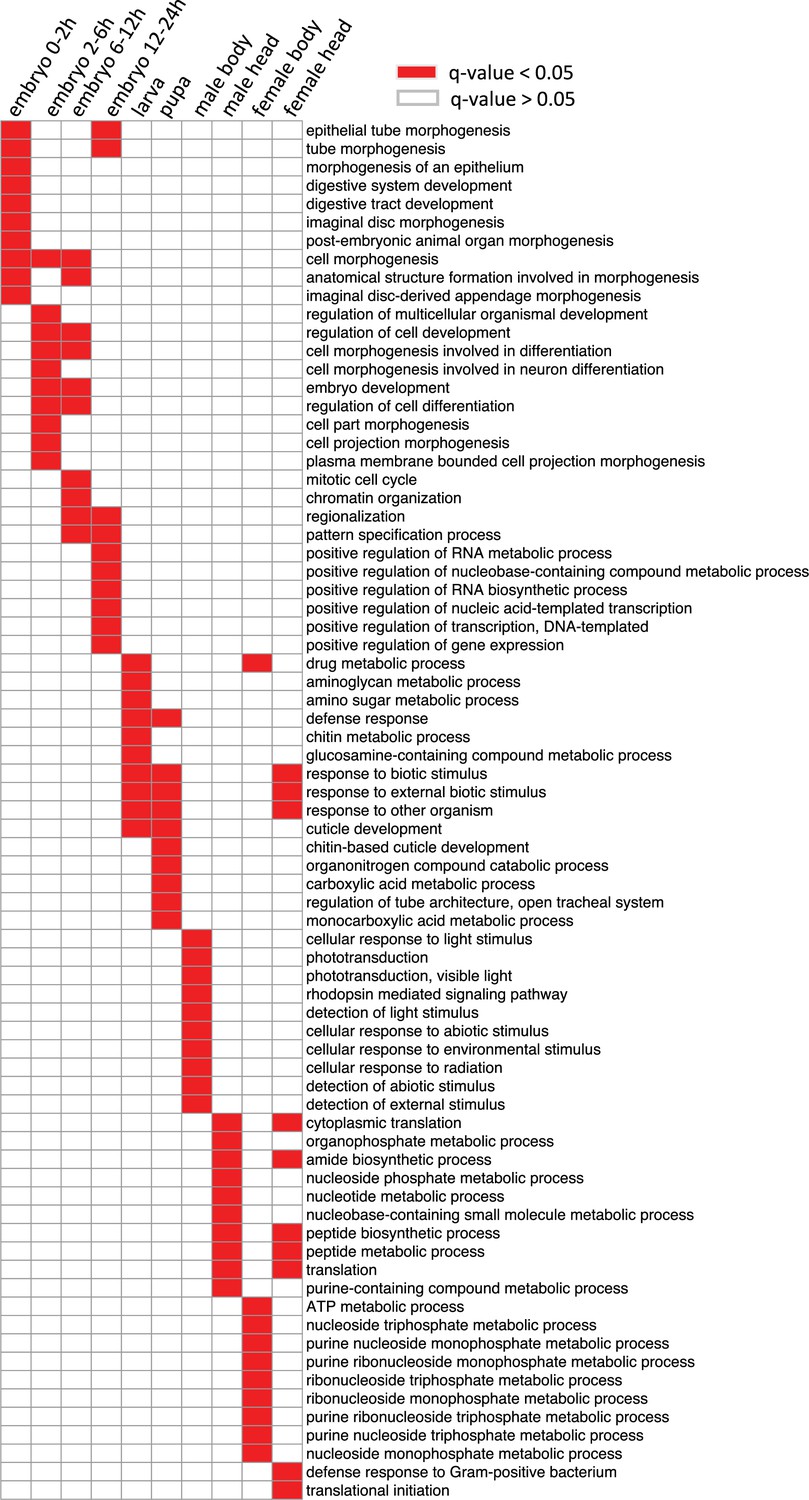
Gene ontology analysis of the genes with in each stage and tissue.
The biological process (BP) terms with q-values <0.05 in each sample type are indicated with red, and others are indicated with white.
Figure 3—figure supplement 3
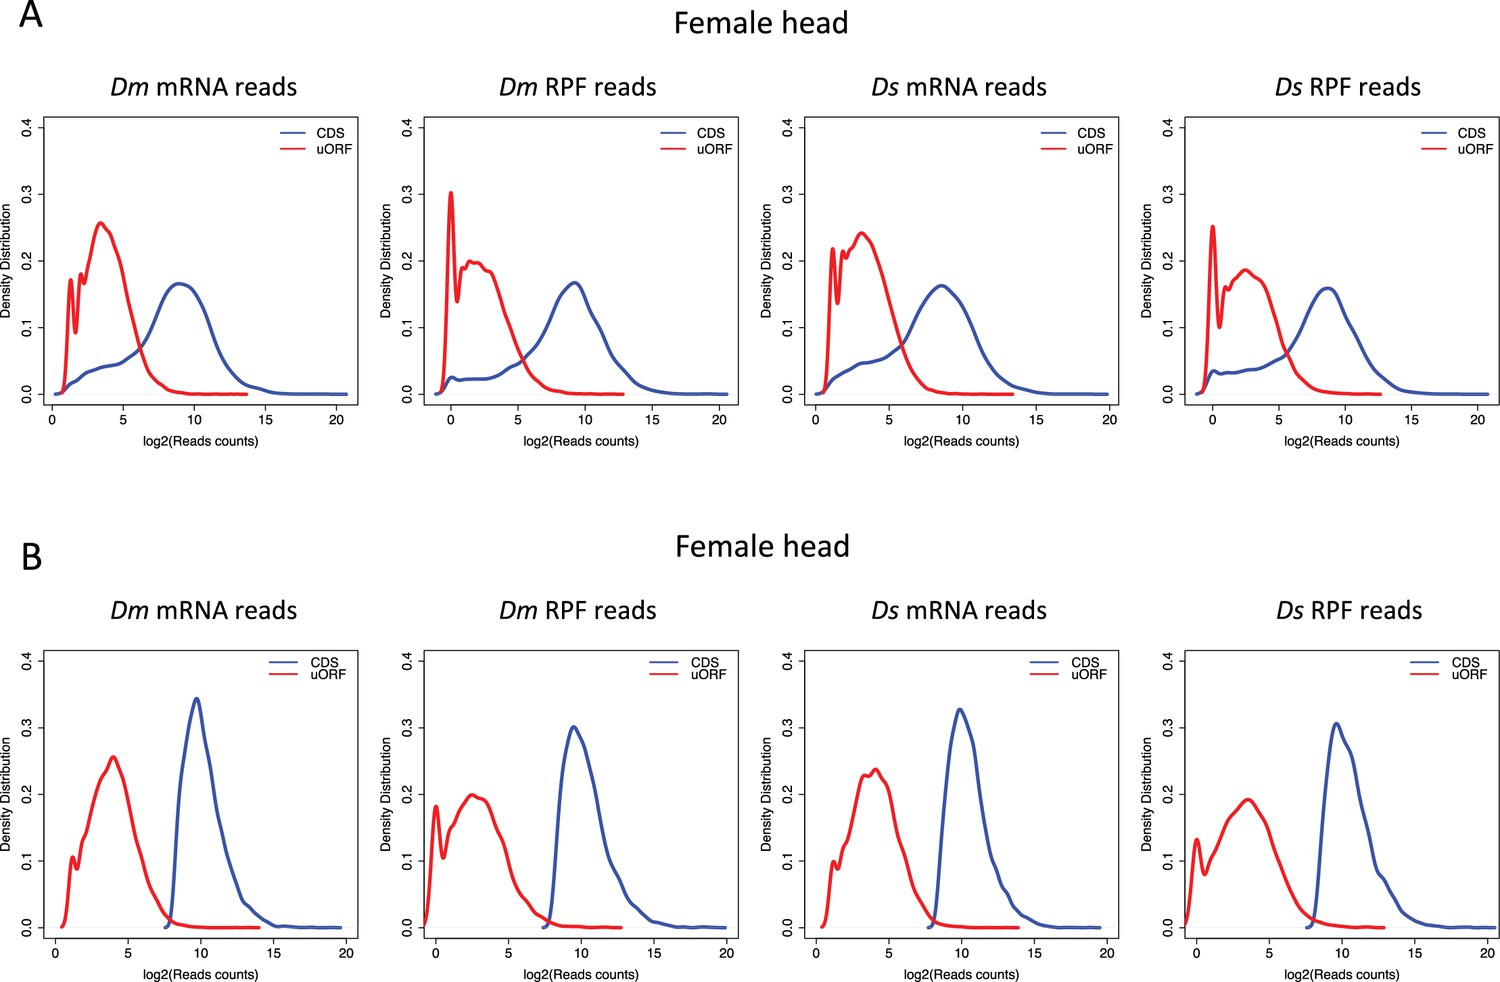
Reads count distribution of uORFs and CDSs.
Distribution of mRNA read counts and RPF counts mapped to uORFs and CDSs for all expressed uORFs (A) or only highly expressed genes (B) in female head sample. The distribution patterns were similar across other samples, and the data are not shown here. Dm, D. melanogaster; Ds, D. simulans. The read counts were log2 transformed.
-
Figure 3—figure supplement 3—source data 1
Raw numerical data underlying the figures.
- https://cdn.elifesciences.org/articles/104074/elife-104074-fig3-figsupp3-data1-v1.xlsx
Figure 3—figure supplement 4
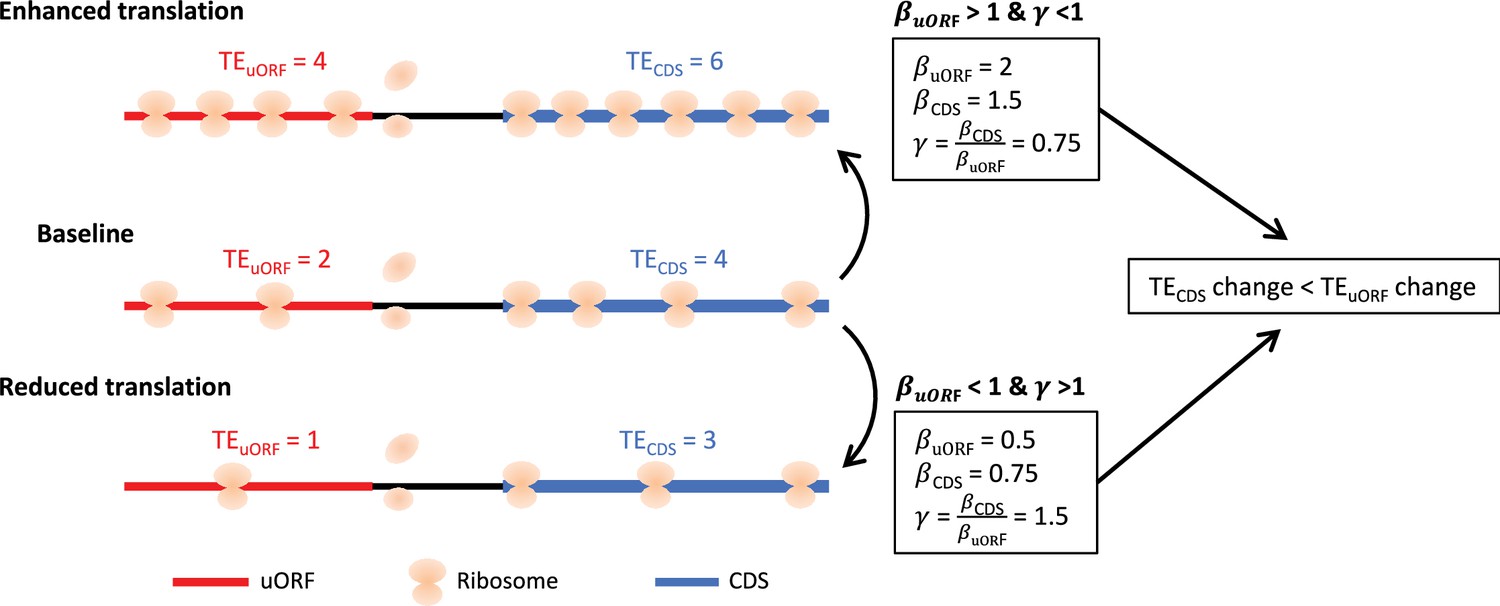
The scheme illustrating the calculation of , and .
When the cellular environment causes mRNA translation to be enhanced from baseline level, the TEuORF changed from 2 to 4 (), while the TEuORF changed with a smaller degree due to uORF’s buffering, from 4 to 6 (). This resulted in <1. Conversely, when the cellular environment causes mRNA translation to be reduced from the baseline level, the TEuORF changed from 2 to 1 (), while the TEuORF changed with a smaller degree due to uORF’s buffering, from 4 to 3 (). This resulted in >1. Overall, both >1 and <1, and <1 and >1, indicated the existence of uORFs’ buffering.
Figure 3—figure supplement 5
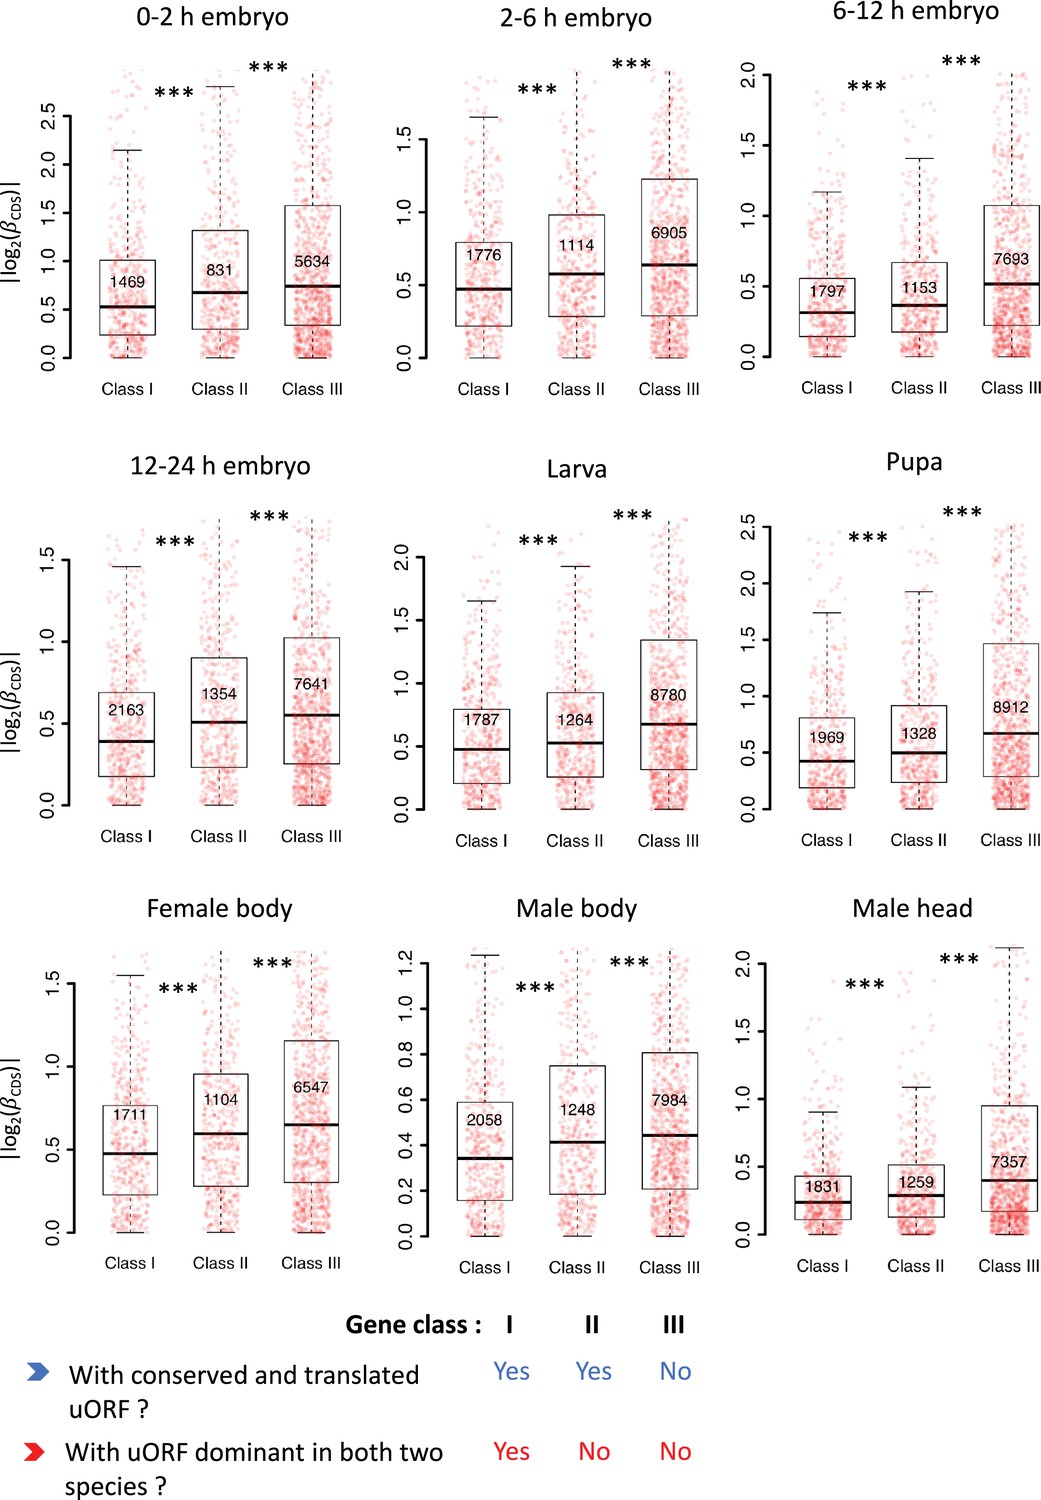
Conserved and dominantly translated uORFs showed the stronger buffering effect.
Genes expressed in different stages/tissues (mRNA RPKM >0.1 in both species) were classified into three classes according to whether a gene had a conserved and dominantly translated uORF or not. Boxplots showing interspecific CDS TE variability || of different gene classes. p values were calculated using Wilcoxon rank-sum tests between the neighboring groups. ***, p<0.001.
-
Figure 3—figure supplement 5—source data 1
Raw numerical data underlying the figures.
- https://cdn.elifesciences.org/articles/104074/elife-104074-fig3-figsupp5-data1-v1.xlsx
Figure 3—figure supplement 6
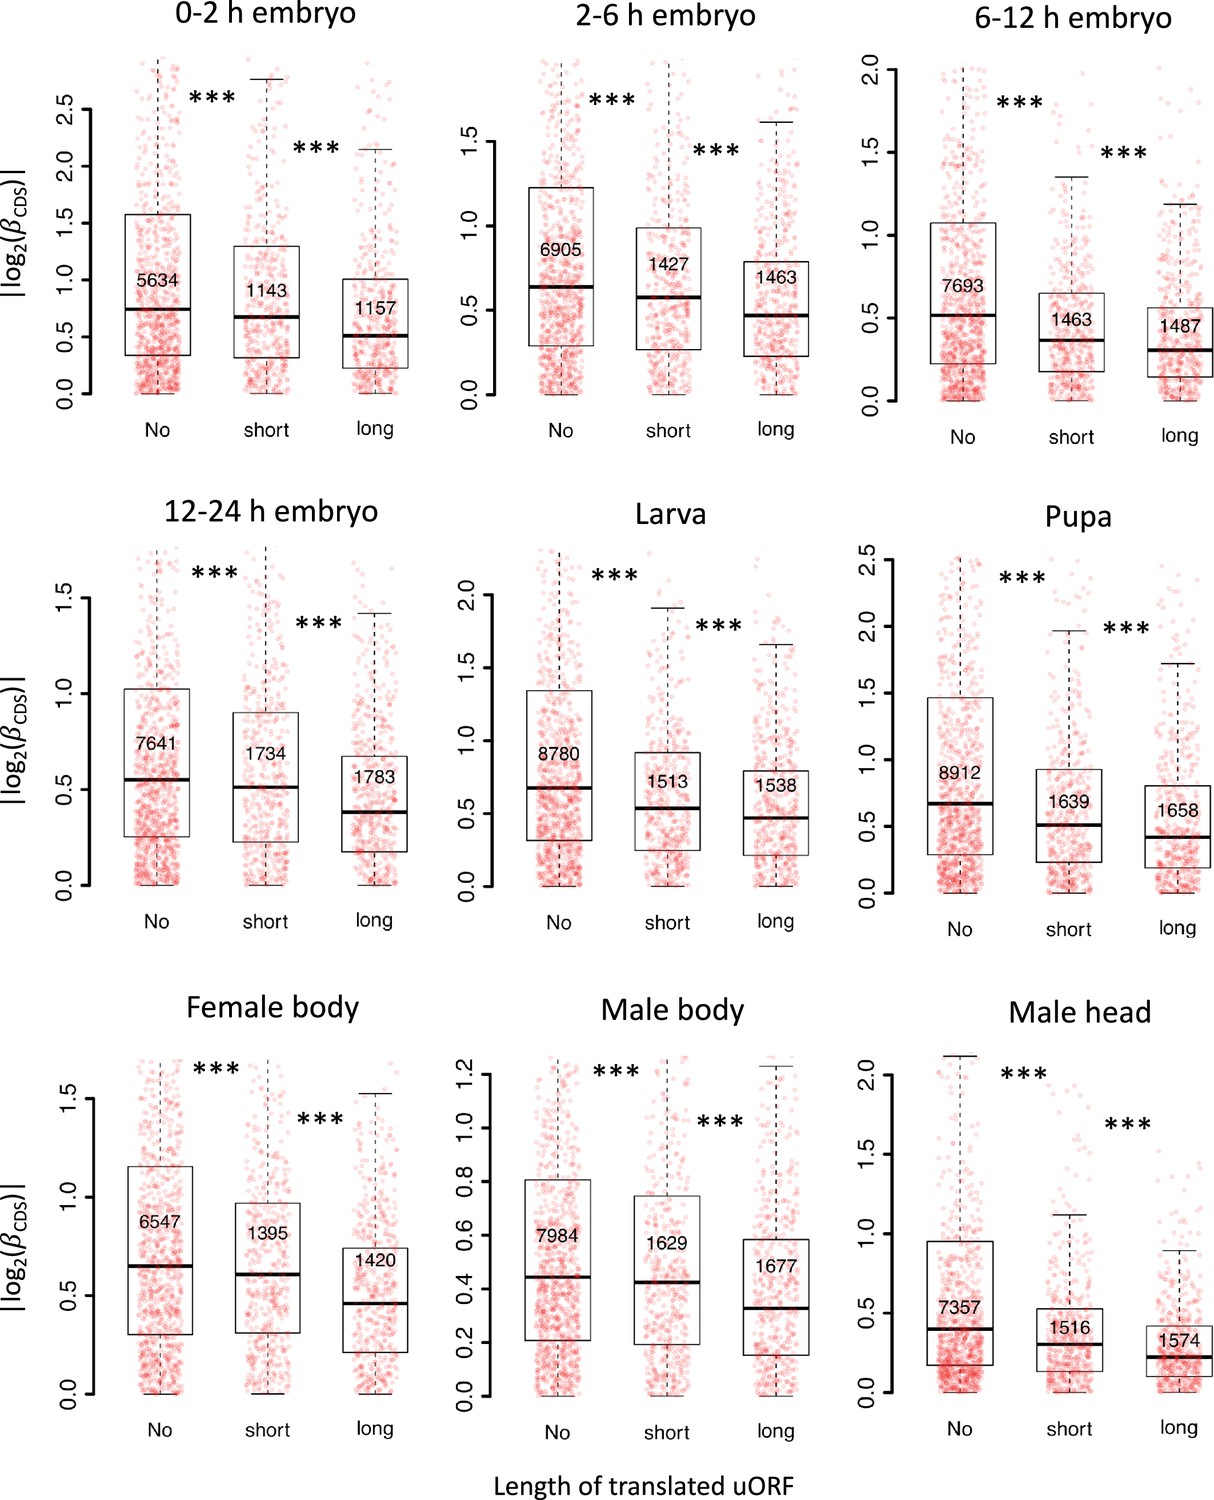
Longer uORFs showed the stronger buffering effect.
Genes expressed in different stages/tissues (mRNA RPKM >0.1 in both species) were classified into three classes according to the length of translated uORFs. Boxplots showing interspecific CDS TE variability || of different gene classes. p values were calculated using Wilcoxon rank-sum tests between the neighboring groups. ***, p<0.001.
Figure 4 with 2 supplements
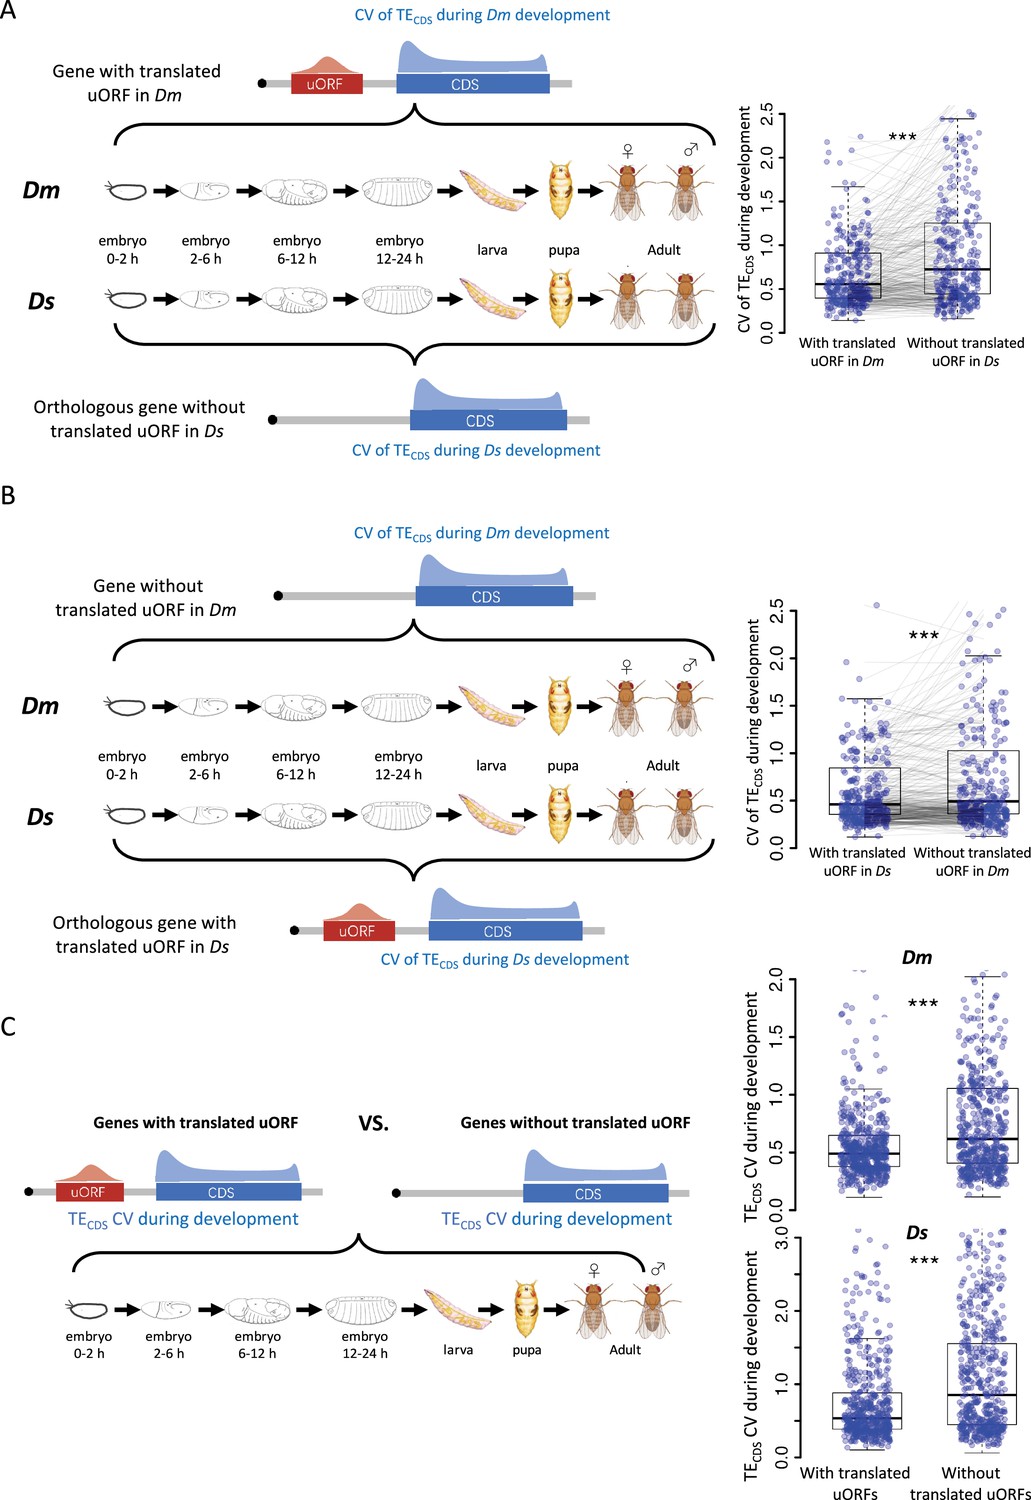
uORFs could reduce CDS translational fluctuation during Drosophila development.
(A) The CV of TECDS across 10 Dm (D. melanogaster) samples and 10 Ds (D. simulans) samples. The selected gene with uORFs translated (TE >0.1) in at least one Dm sample but its homologous gene without translated uORF in Ds samples. Each pair of dots linked by a gray line represents a pair of homologous genes in Dm and Ds. ***, p<0.001, Wilcoxon signed-rank test. (B) The CV of TECDS across 10 Dm samples and 10 Ds samples. The selected gene with uORFs translated (TE >0.1) in at least one Ds sample but its homologous gene without translated uORF in Dm samples. Each pair of dots linked by a gray line represents a pair of homologous genes in Dm and Ds. ***, p<0.001, Wilcoxon signed-rank test. (C) Within each Drosophila species, the CV of TECDS of genes with translated uORFs compared to genes without the translated uORFs. The p values are obtained by the Wilcoxon rank-sum test. ***, p<0.001.
-
Figure 4—source data 1
Raw numerical data underlying the figures.
- https://cdn.elifesciences.org/articles/104074/elife-104074-fig4-data1-v1.xlsx
Figure 4—figure supplement 1
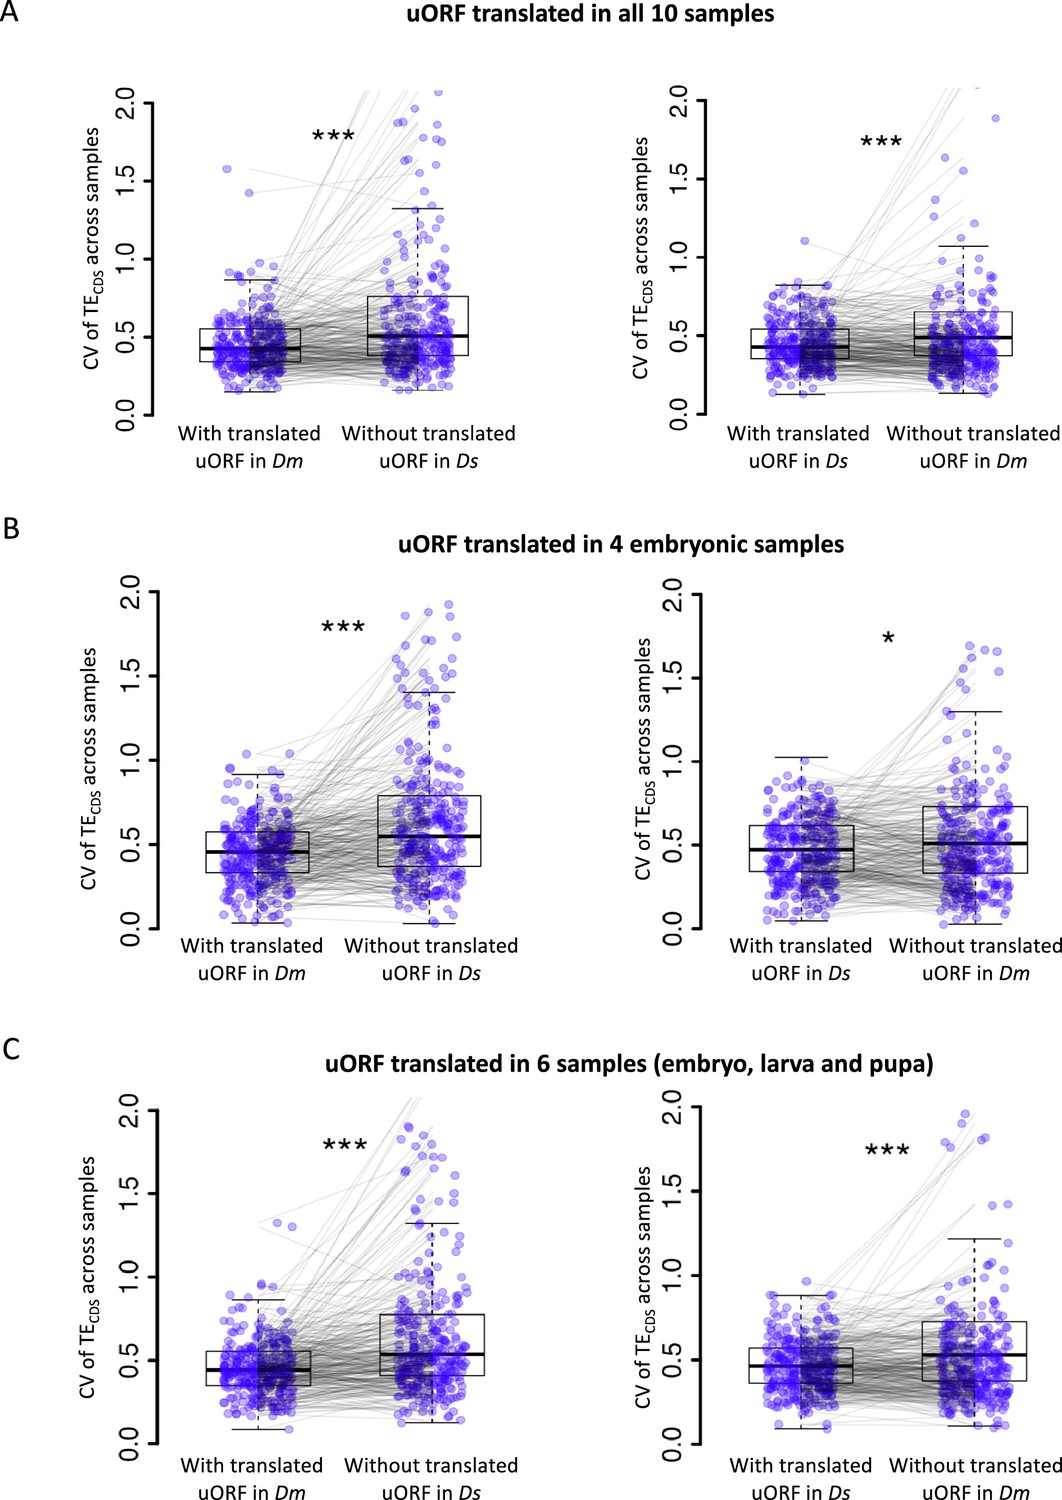
uORFs reduce CDS translational fluctuation during Drosophila development under different cutoffs on defining ‘translated uORFs’.
The CV of TECDS across Dm (D. melanogaster) samples and Ds (D. simulans) samples was shown as boxplots. The selected genes harbor the translated uORFs in one of Drosophila species but its homologous gene without translated uORFs in another Drosophila species. Each pair of dots linked by a gray line represents a pair of homologous genes in Dm and Ds. (A) Translated uORF was defined as uORF translated (TE >0.1) in all 10 samples. (B) Translated uORF was defined as uORF translated (TE >0.1) in four embryonic stages. The CV of TECDS across these four stages was calculated. (C) Translated uORF was defined as uORF translated (TE >0.1) in the six developmental stages including four embryonic stages, larva, and pupa. The CV of TECDS across these six stages was calculated. Wilcoxon signed-rank sum test. *, p<0.05; ***, p<0.001.
-
Figure 4—figure supplement 1—source data 1
Raw numerical data underlying the figures.
- https://cdn.elifesciences.org/articles/104074/elife-104074-fig4-figsupp1-data1-v1.xlsx
Figure 4—figure supplement 2
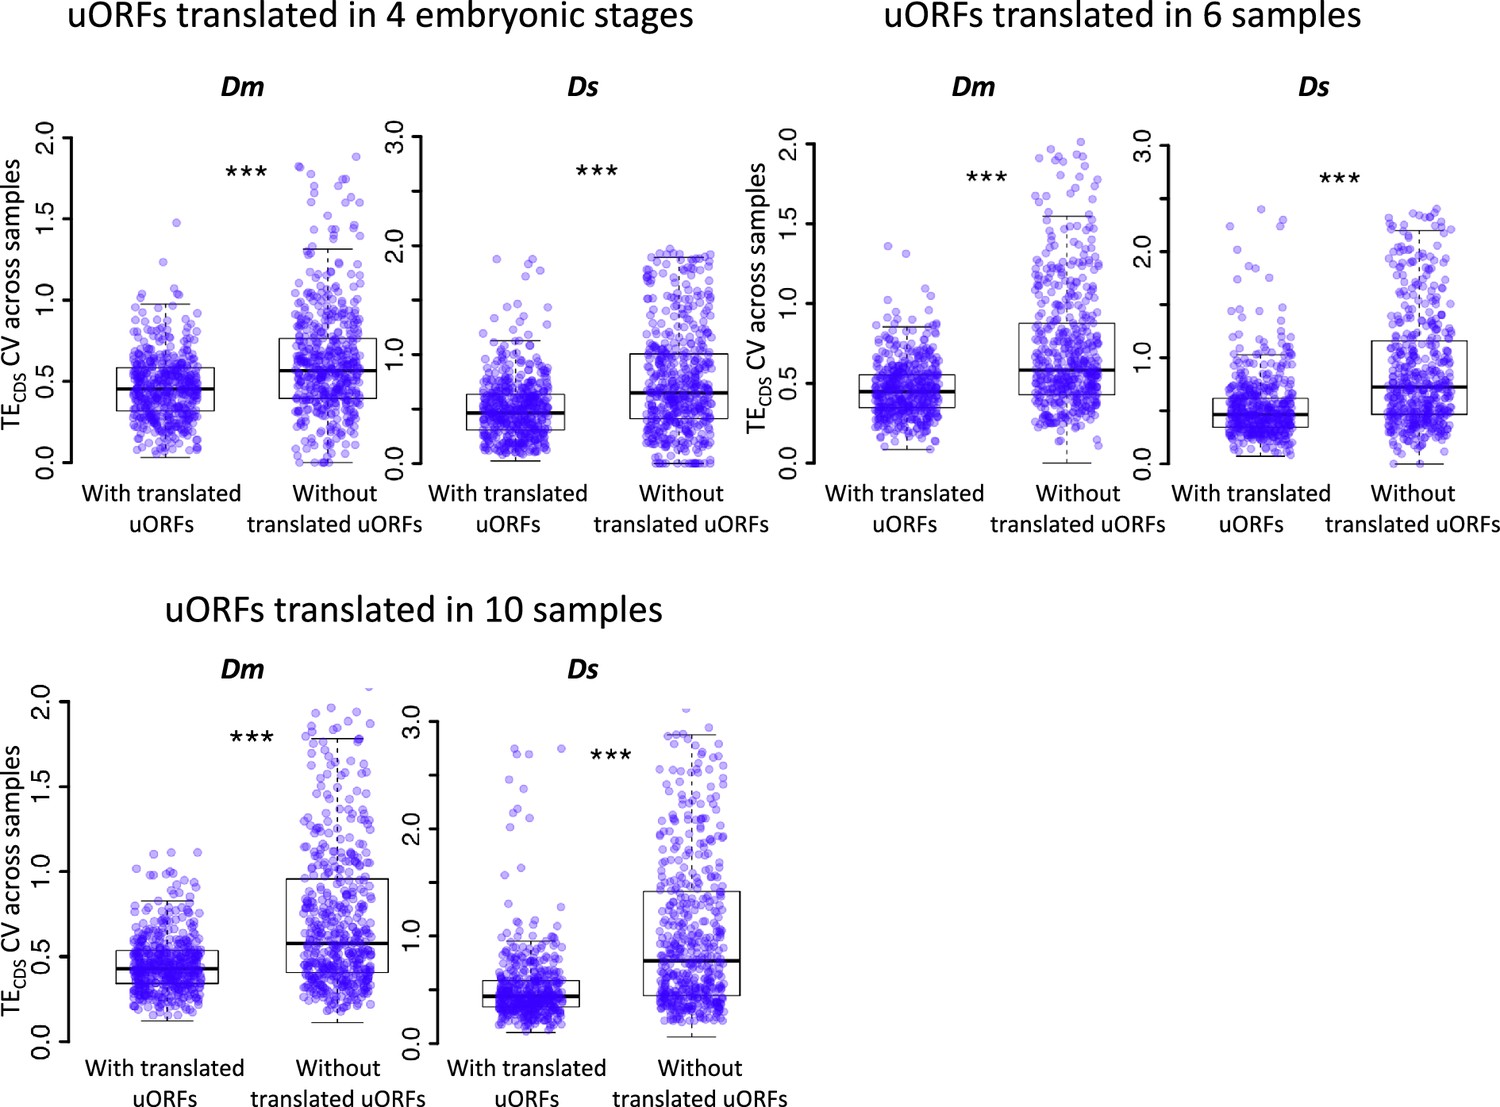
uORFs could reduce CDS translational variation during Drosophila development under different cutoffs on defining ‘translated uORFs’.
Within each species, the CV of TECDS across different samples was measured for genes with translated uORFs and genes without translated uORFs, respectively. Each dot in the boxplot represents one gene. Translated uORF was defined as uORF translated (TE >0.1) in at least four embryonic stages, six developmental stages (left) or translated or in all 10 samples. Wilcoxon rank-sum tests. ***, p<0.001. Dm, D. melanogaster; Ds, D. simulans.
-
Figure 4—figure supplement 2—source data 1
Raw numerical data underlying the figures.
- https://cdn.elifesciences.org/articles/104074/elife-104074-fig4-figsupp2-data1-v1.xlsx
Figure 5 with 1 supplement
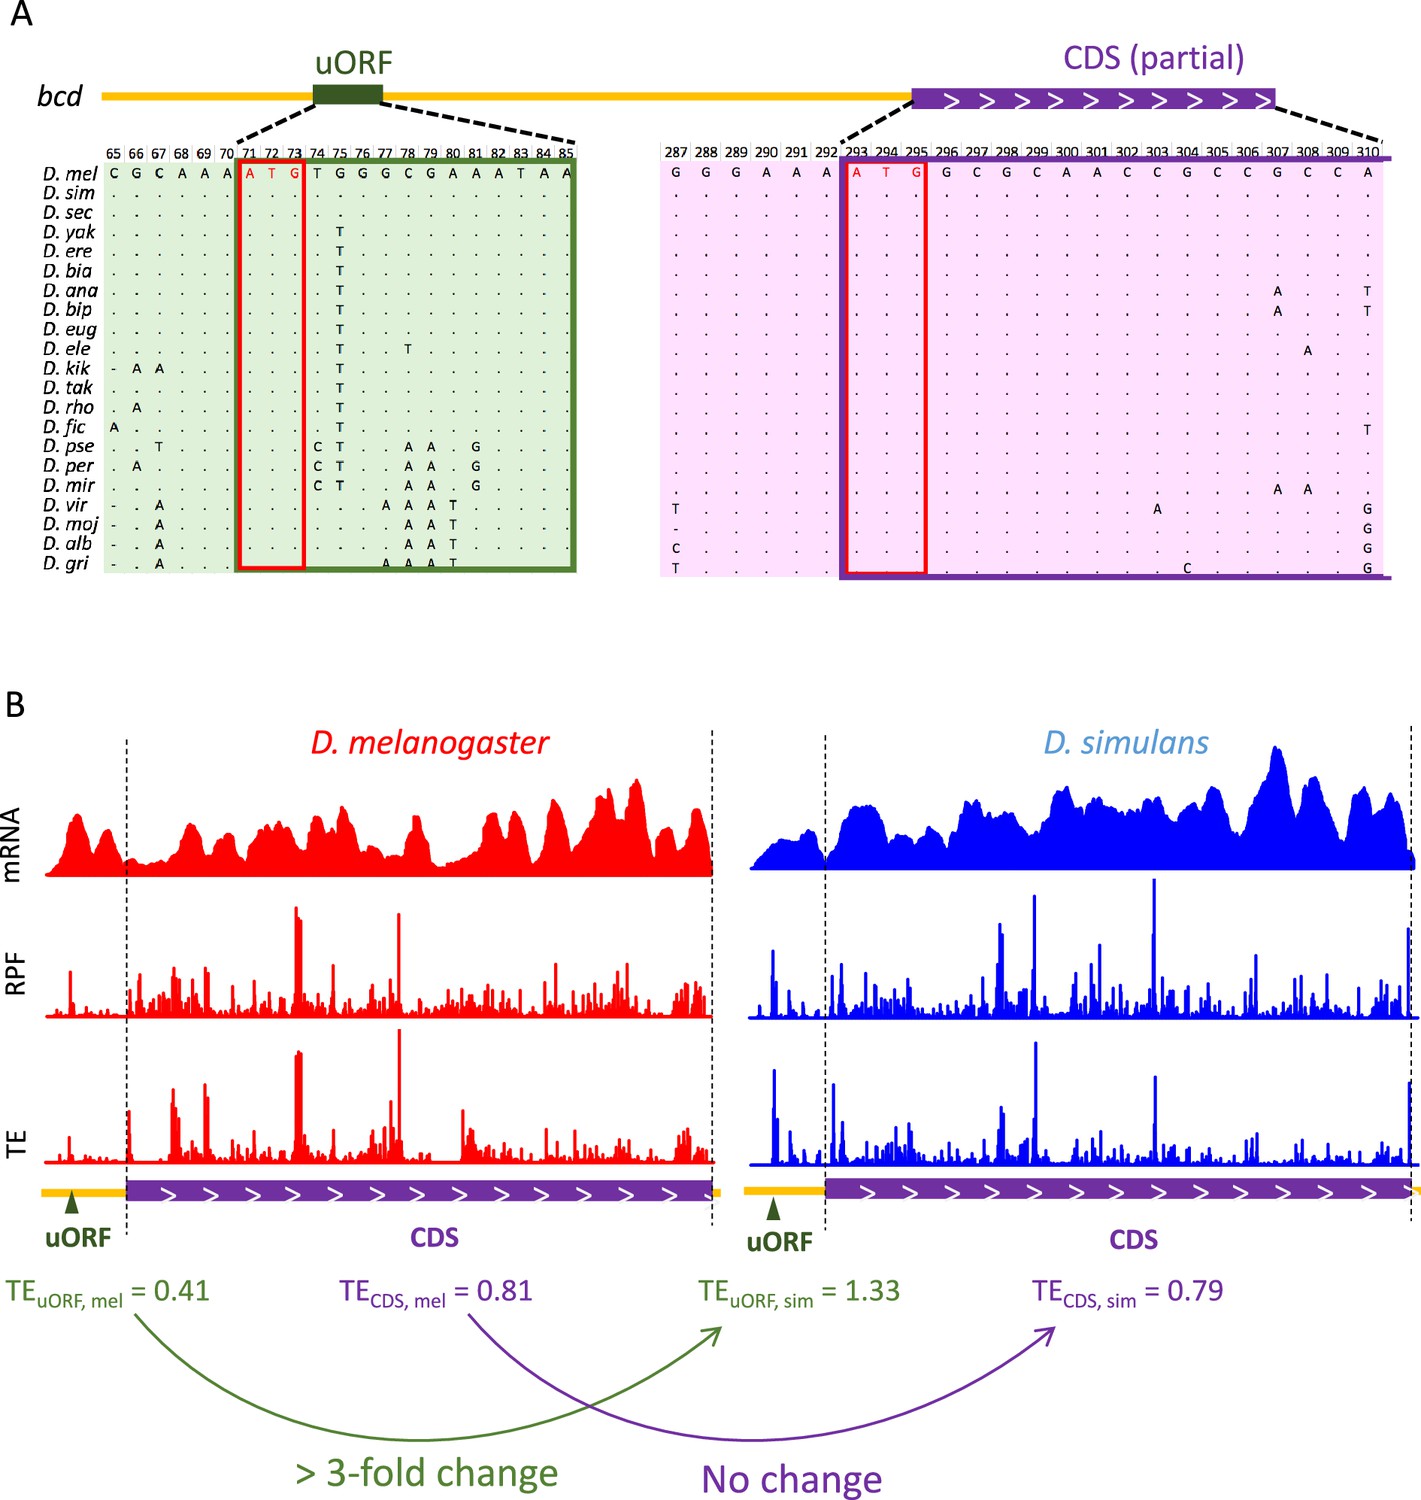
The strong buffering effect of the bcd uORF on CDS translation between the two Drosophila species.
(A) Multiple sequence alignment of the bcd uORF and partial CDS in D. melanogaster and 20 other Drosophila species. The uORF and CDS are boxed in green and purple, respectively. The start codons of the uORF and CDS are boxed in red. (B) The coverage of mRNA-Seq (top), Ribo-Seq (middle), and TEs (bottom) of the bcd uORF and CDS in 0–2 hr embryos of D. melanogaster (red) and D. simulans (blue). The uORF and CDS are denoted at the lower panel with dark green triangles and purple boxes, respectively. The two dashed lines mark the CDS region. The uORF TE, CDS TE and their interspecific changes were labeled at the bottom.
-
Figure 5—source data 1
Raw numerical data underlying the figures.
- https://cdn.elifesciences.org/articles/104074/elife-104074-fig5-data1-v1.xlsx
Figure 5—figure supplement 1
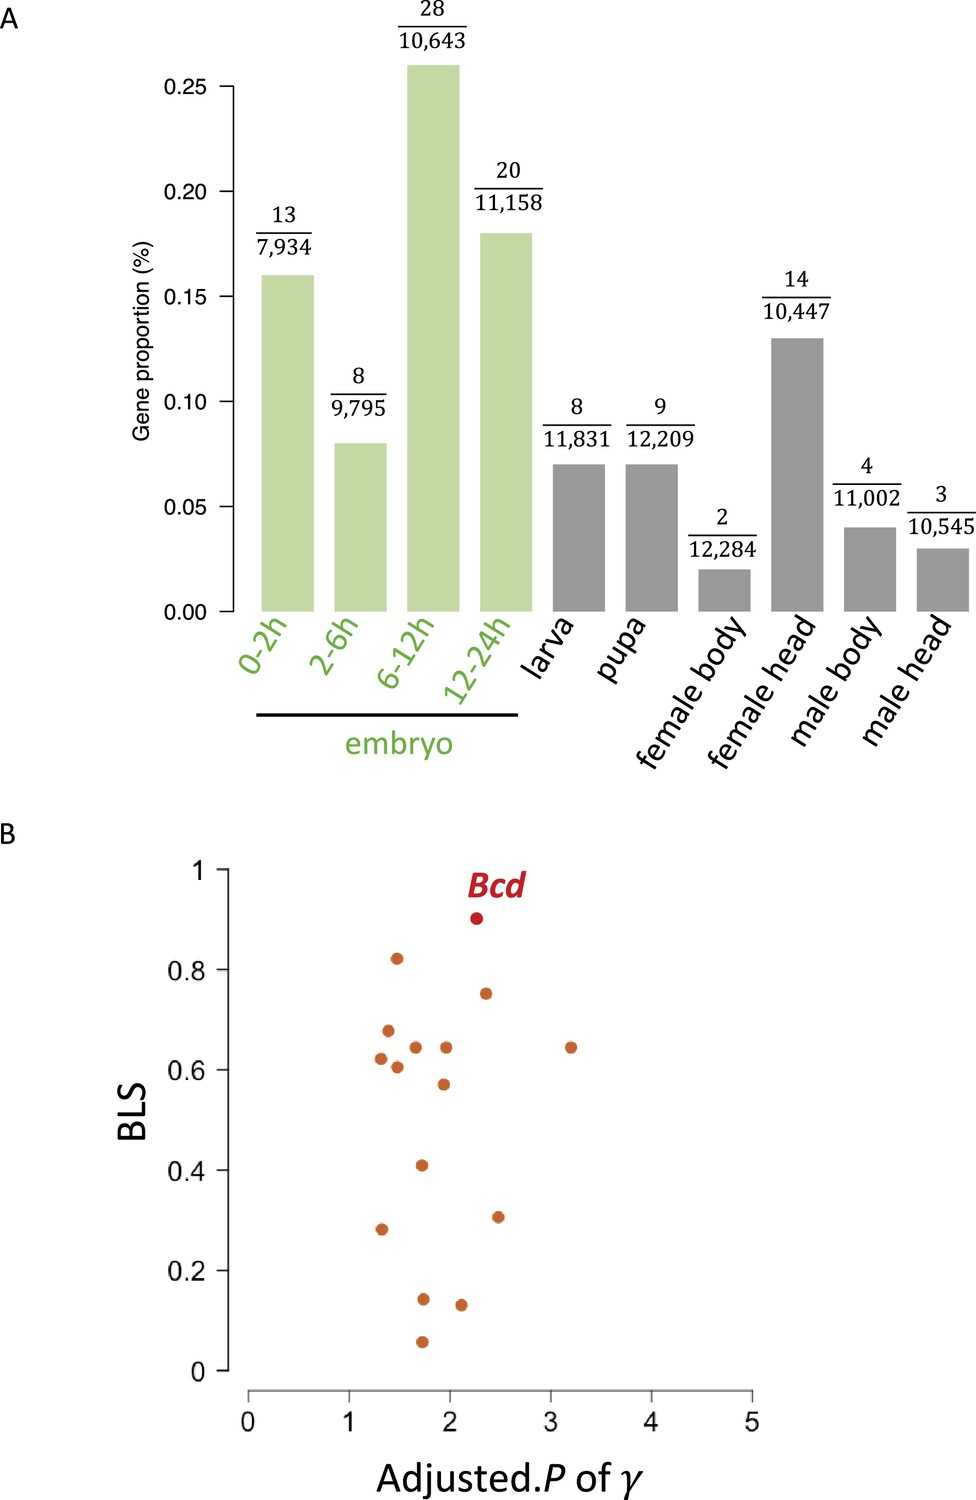
Screening of genes containing uORFs exhibiting strong translational buffering effects.
(A) The proportion (%) of genes with buffering uORFs in all expressed genes across developmental stages/tissues. (B) The distribution of adjusted. P of (x-axis, -log10 transformed) and BLS (y-axis) of dominant uORFs in embryonic stages. The bcd was highlighted by red color.
-
Figure 5—figure supplement 1—source data 1
Raw numerical data underlying the figures.
- https://cdn.elifesciences.org/articles/104074/elife-104074-fig5-figsupp1-data1-v1.xlsx
Figure 6 with 4 supplements
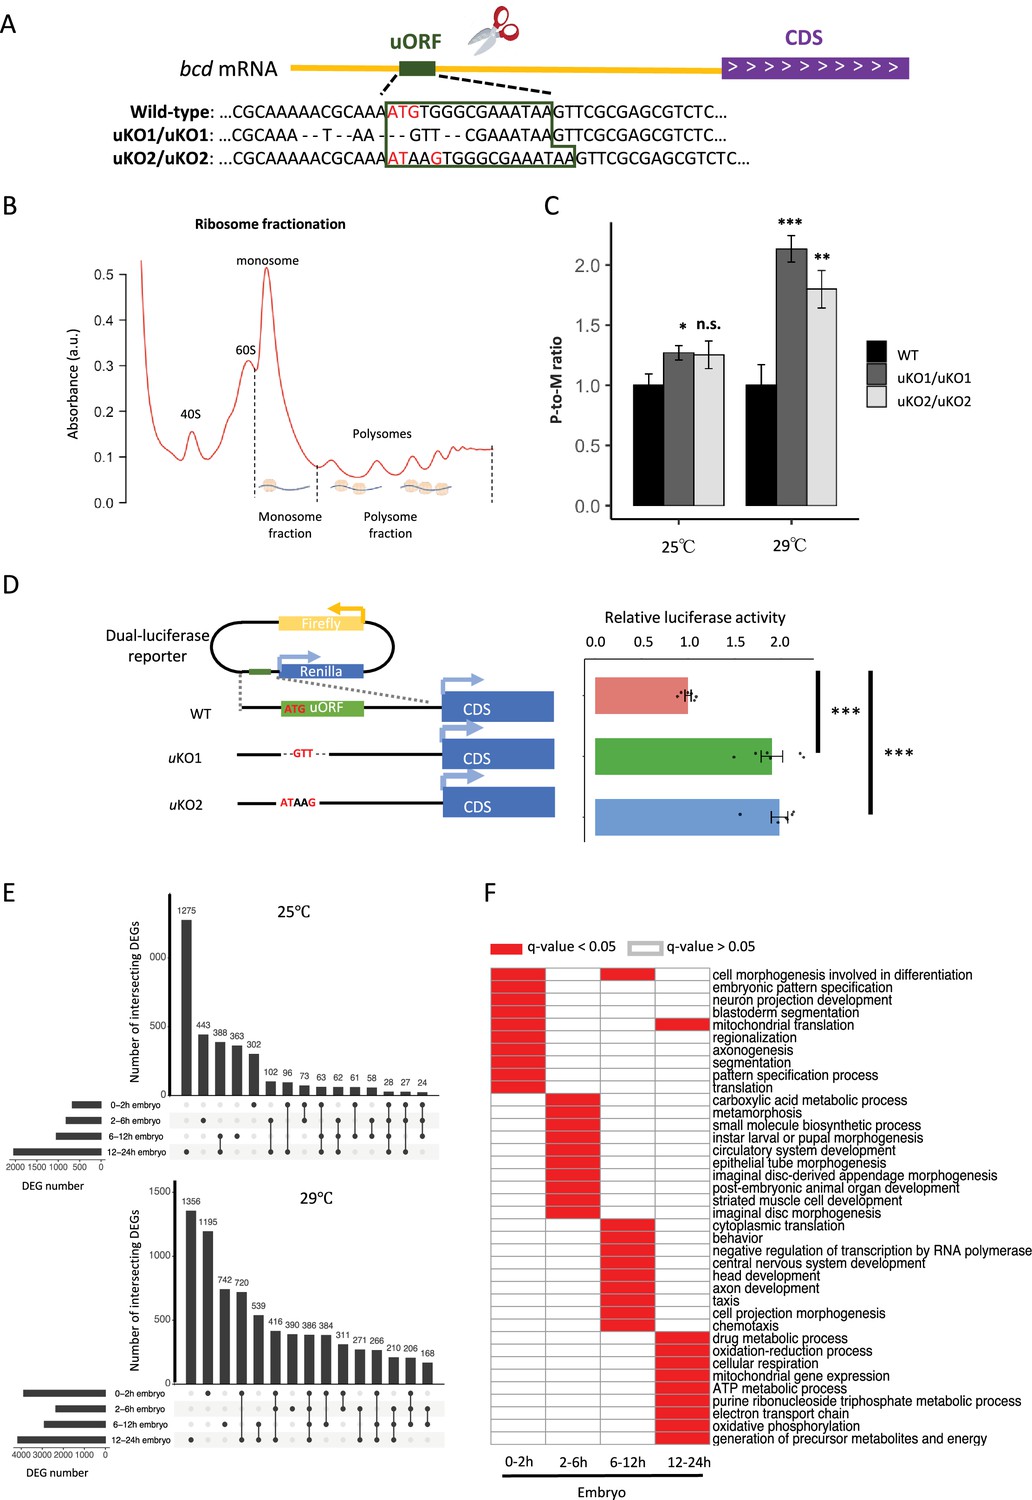
Knocking out the bcd uORF increases CDS translation and perturbs the transcriptome during D. melanogaster embryogenesis.
(A) Genotypes of WT and two uORF knock-out strains (uKO1 and uKO2) generated by CRISPR-Cas9 technology. The uORF is boxed in dark green, and the red ATG represents the start codon of the uORF in the D. melanogaster genome. (B) Two ribosome fractions (monosome and polysome) of 0–2 hr embryos were separated in a sucrose density gradient. Relative RNA abundance in the monosome and polysome fractions was quantified by real-time quantitative PCR. (C) P-to-M ratio of bcd mRNA (bcd mRNA abundance in polysome fraction/bcd mRNA abundance in monosome fraction) at 25 °C (left) and 29 °C (right). The P-to-M ratios of mutants were normalized to WT controls at 25 °C and at 29 °C, respectively. Error bars represent the S.E. of six biological replicates. Asterisks indicate statistical significance (*, p<0.05; **, p<0.01; ***, p<0.001; n.s., p>0.05). (D) Dual-luciferase assay for bcd WT uORF and mutated uORF. The reporter structures of the WT and uORF mutants are illustrated on the left. The uORF mutant sequence was the same as that in the fly mutant created with CRISPR-Cas9 technology. The relative activity of Renilla luciferase was normalized to that of firefly luciferase. Error bars represent the S.E. of six biological replicates. Asterisks indicate statistical significance (***, p <0.001). (E) The number of DEGs in each stage and their intersection with each other at 25 °C (top) and 29 °C (bottom). (F) Gene ontology analysis of DEGs at 29 °C in each stage. The biological process (BP) terms with q-values <0.05 in each stage are indicated in red, and others are indicated in white.
-
Figure 6—source data 1
Raw numerical data underlying the figures.
- https://cdn.elifesciences.org/articles/104074/elife-104074-fig6-data1-v1.xlsx
Figure 6—figure supplement 1
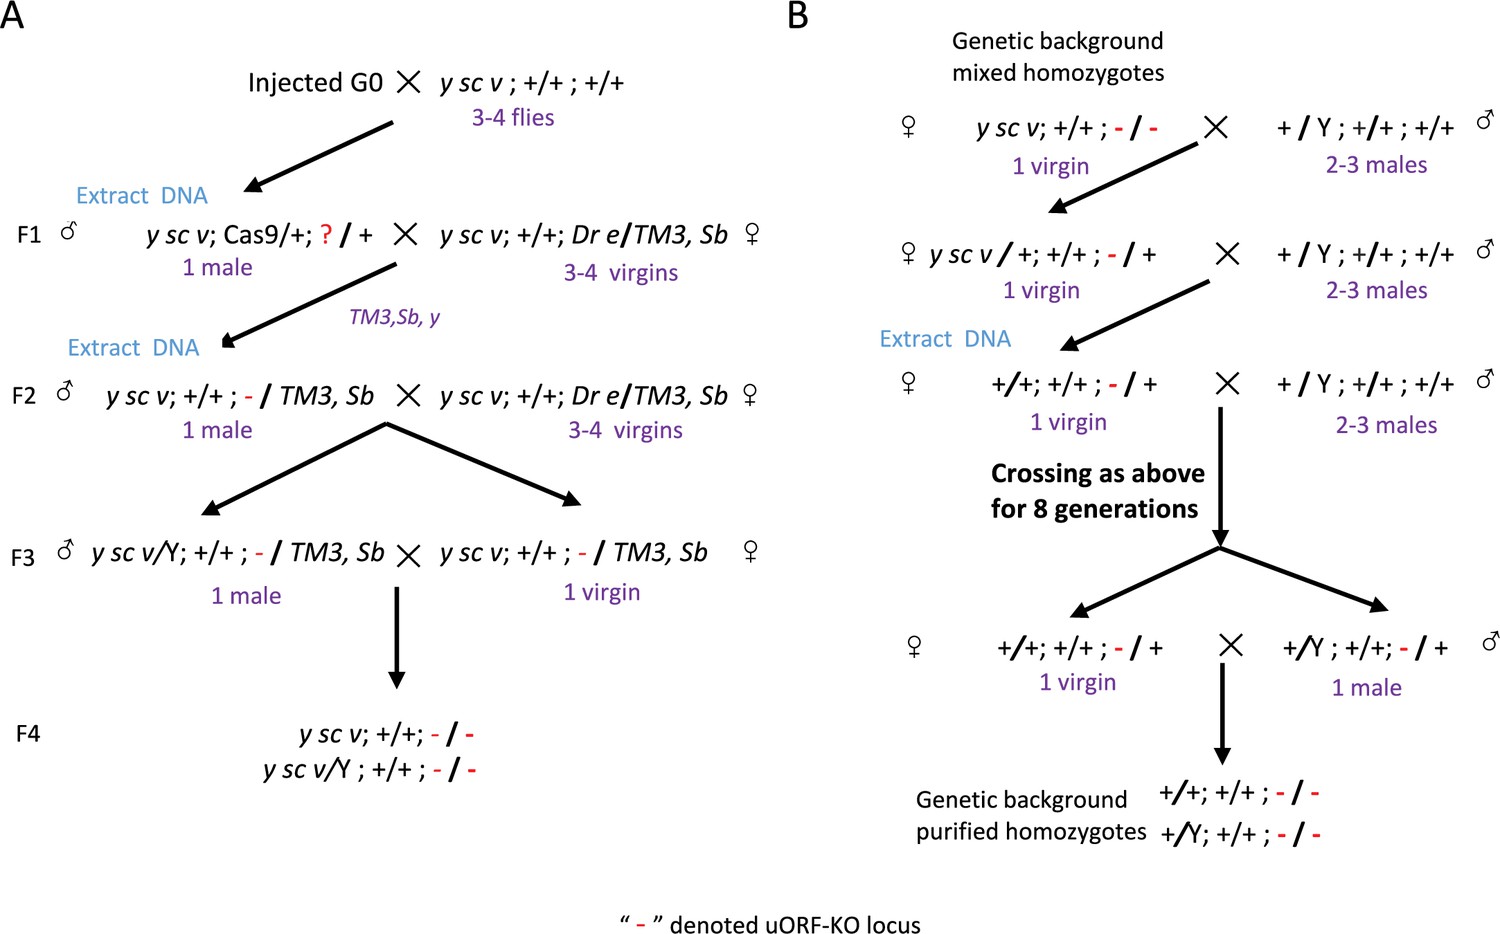
Overview of homozygous uORF-KO mutant screening.
(A) Procedures for the primary screening of CRISPR/Cas9-induced mutants. Red ‘-’ denotes the bcd-uORF-KO allele. (B) Purification of the genetic background of homozygous mutants by back-crossing with WT lines for nine generations.
Figure 6—figure supplement 2
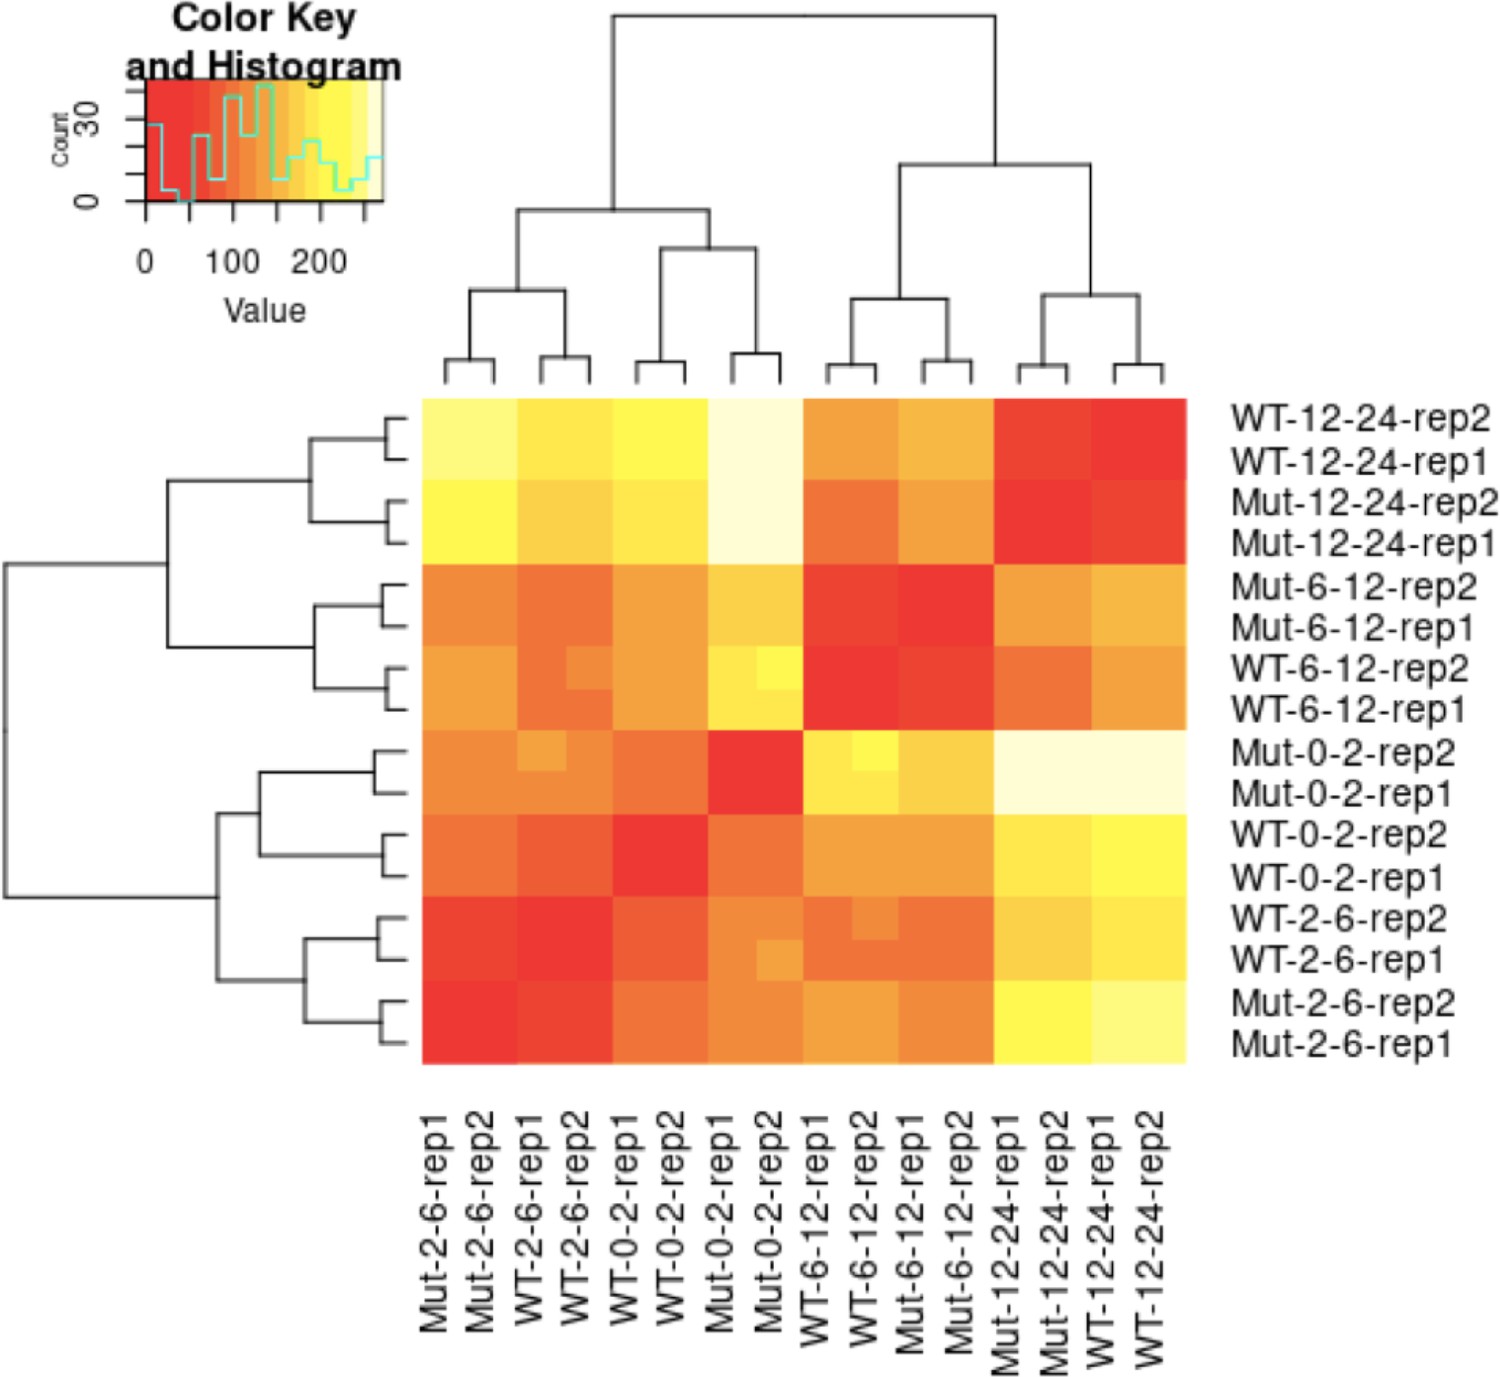
Heatmap of sample-to-sample distances of RNA-Seq libraries.
Mut, mutant; WT, wild-type; rep1/rep2, biological replicate 1/biological replicate 2.
-
Figure 6—figure supplement 2—source data 1
Raw numerical data underlying the figures.
- https://cdn.elifesciences.org/articles/104074/elife-104074-fig6-figsupp2-data1-v1.xlsx
Figure 6—figure supplement 3

The ratio of Bcd target genes among DEGs in bcd-uORF-KO embryos.
The enrichment of Bcd targets in each embryo stage at 29 ºC. Enrichment was calculated as the ratio of the Bcd target proportion in DEGs to the Bcd target proportion in non-DEGs. tests were performed to compare the difference in Bcd target distribution in DEGs and non-DEGs. The number of DEGs and the number of Bcd targets in DEGs for each stage are provided above the bar. Asterisks indicate statistical significance ( tests; *, p<0.05; **, p<0.01; ***, p<0.001; n.s., p>0.05).
-
Figure 6—figure supplement 3—source data 1
Raw numerical data underlying the figures.
- https://cdn.elifesciences.org/articles/104074/elife-104074-fig6-figsupp3-data1-v1.xlsx
Figure 6—figure supplement 4
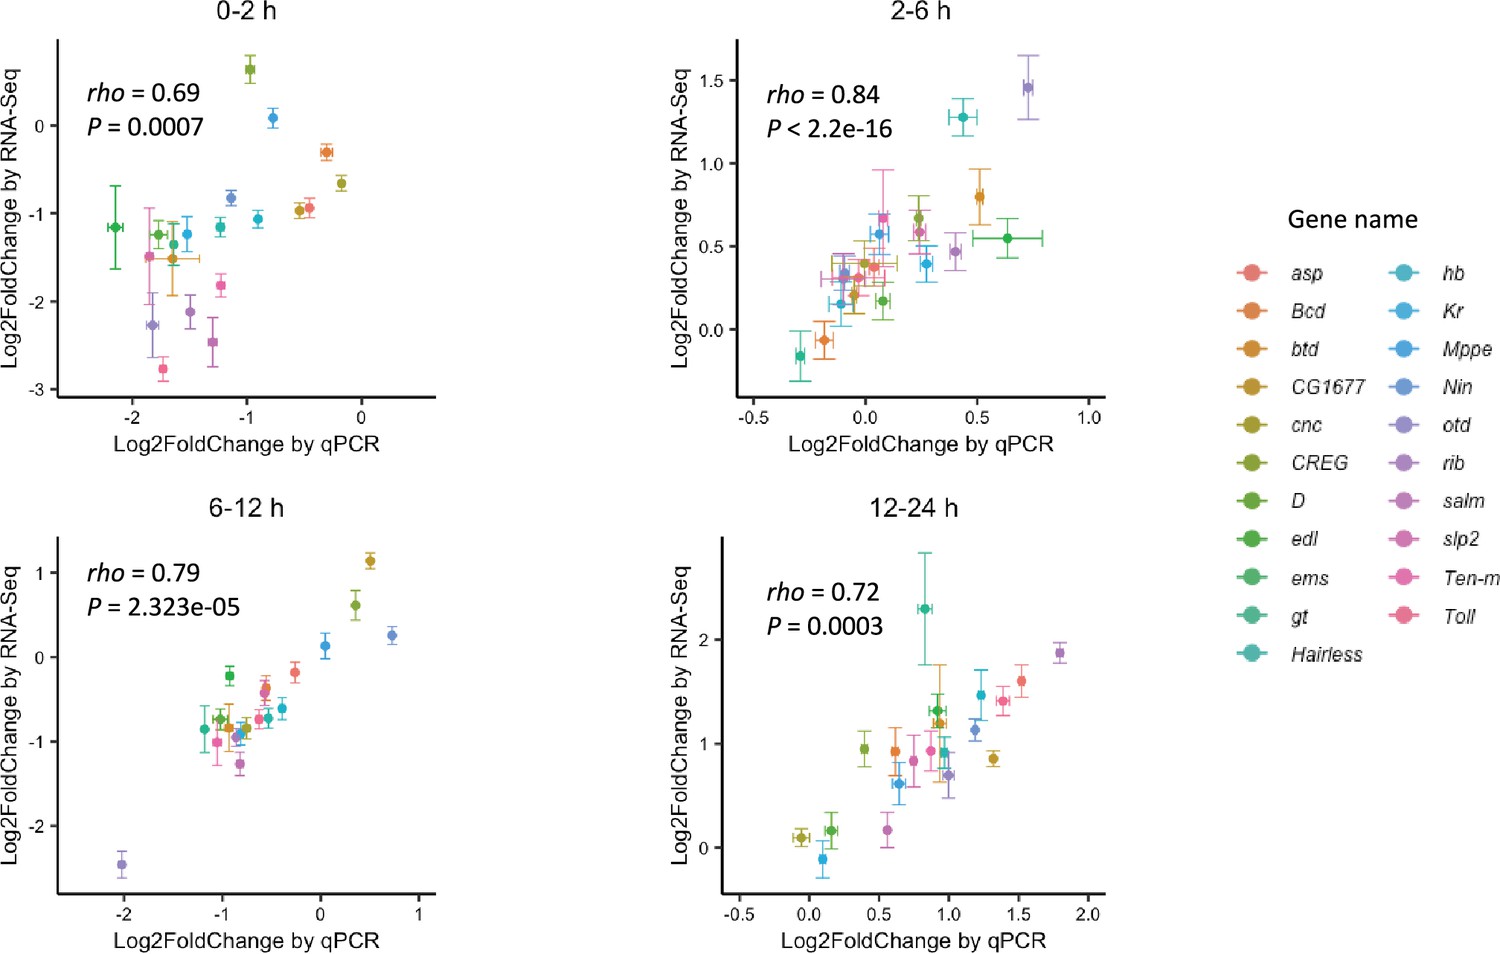
The correlation of expression changes (log2FoldChange) between RNA-Seq (y-axis) and RT-qPCR (x-axis) of 20 bcd targets in four embryo stages in uKO2/uKO2 mutant compared to WT.
-
Figure 6—figure supplement 4—source data 1
Raw numerical data underlying the figures.
- https://cdn.elifesciences.org/articles/104074/elife-104074-fig6-figsupp4-data1-v1.xlsx
Figure 7
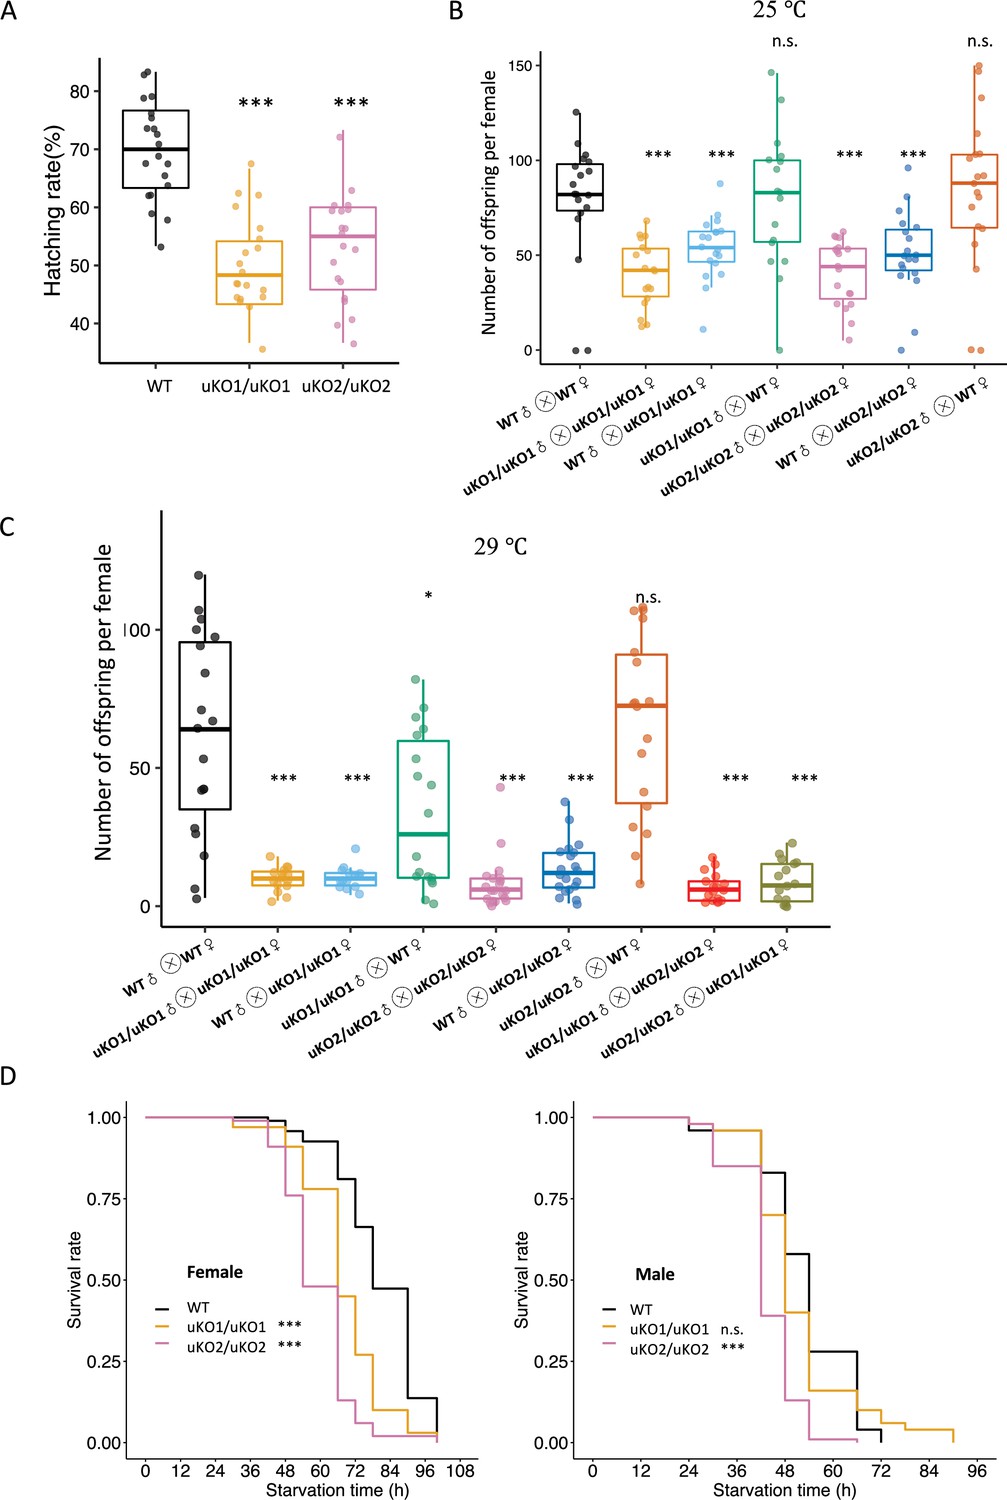
Knockout of the bcd uORF reduces offspring number and starvation resistance.
(A) Comparison of the hatching rates (%) of mutant and WT offspring (n=20, Wilcoxon rank-sum test; ***, p<0.001). (B) The offspring number per maternal parent in different crosses over 10 days at 25 °C. Asterisks indicate significant differences between various crosses and crosses of WT females with WT males (n=20, Wilcoxon rank-sum test; *, p<0.05; **, p<0.01; ***, p<0.001; n.s., p>0.05). The different crosses were denoted as the x-axis labels. (C) The offspring number per maternal parent in different crosses over 10 days at 29 °C. (D) Survival curves of WT and mutant adult flies of females (left) and males (right) under starvation conditions. The black line represents the WT, the red line represents the uKO1/uKO1 mutant, and the blue line represents the uKO2/uKO2 mutant. Asterisks indicate significant differences compared to the WT. (n=200, log-rank test; ***, p<0.001; n.s., p>0.05).
-
Figure 7—source data 1
Raw numerical data underlying the figures.
- https://cdn.elifesciences.org/articles/104074/elife-104074-fig7-data1-v1.xlsx
Figure 8 with 5 supplements
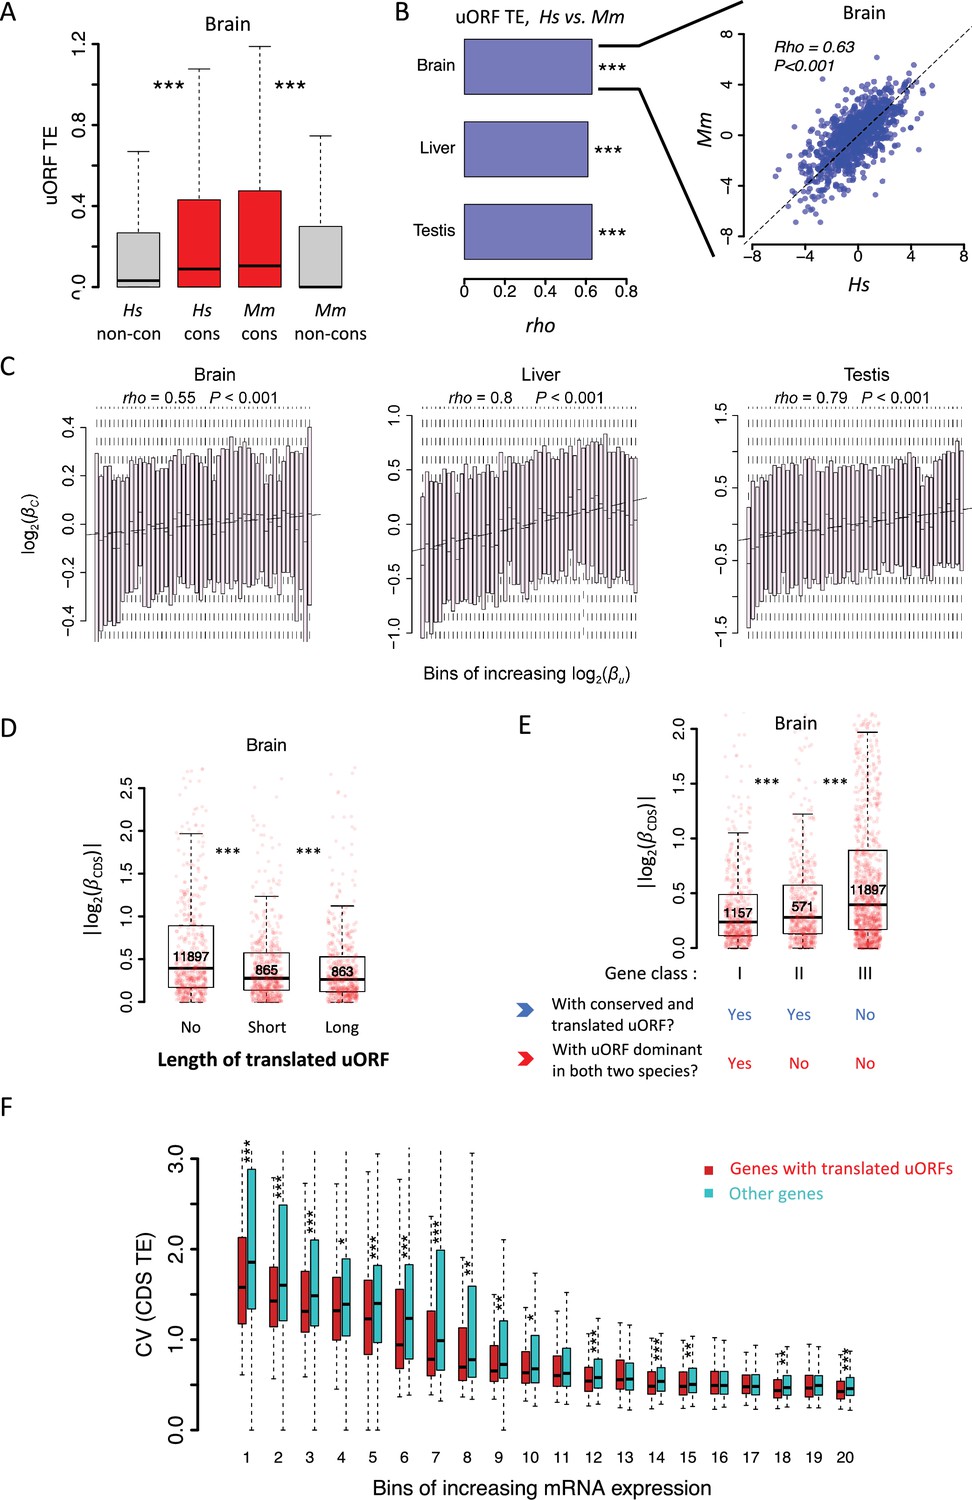
uORFs function as translational buffers in primates.
(A) Boxplots showing the TEs of conserved and species-specific uORFs between Hs (H. sapiens) and Mm (M. mulatta). Data for the brain is shown as an example. Wilcoxon rank-sum tests. ***, p<0.001. (B) Spearman’s correlation coefficient (rho) of uORFs’ TE between humans and macaques. The rho values in the brain, liver, and testis were shown as bar plots. ***, p<0.001. Data for the brain is shown as an example in the right panel. (C) Correlation between interspecific uORF TE changes () and corresponding CDS TE changes () in three tissues. The x-axis was divided into 50 equal bins with increasing . (D) Genes expressed in brains were classified into three classes according to the total length of translated uORFs. Boxplots showing interspecific CDS TE variability |()| of different gene classes. p values were calculated using Wilcoxon rank-sum tests between the neighboring groups. ***, p<0.001. (E) Genes expressed in brains (mRNA RPKM >0.1 in both species) were classified into three classes according to whether a gene had a conserved and dominantly translated uORF (TE >0.1) in both species or not. Boxplots showing interspecific CDS TE variability |()| of different gene classes. p values were calculated using Wilcoxon-rank sum tests between the neighboring groups. ***, p<0.001. (F) Boxplot showing the coefficients of variation (CVs) of CDS TE among the 69 lymphoblastoid cell lines (LCLs). Expressed genes (mean mRNA RPKM >0.1) were divided into 20 bins with increased mRNA expression levels. In each bin, the genes were divided into two fractions according to whether the gene had a translated uORF or not. Wilcoxon rank-sum tests. *, p<0.05; **, p<0.01; ***, p<0.001.
-
Figure 8—source data 1
Raw numerical data underlying the figures.
- https://cdn.elifesciences.org/articles/104074/elife-104074-fig8-data1-v1.xlsx
Figure 8—figure supplement 1
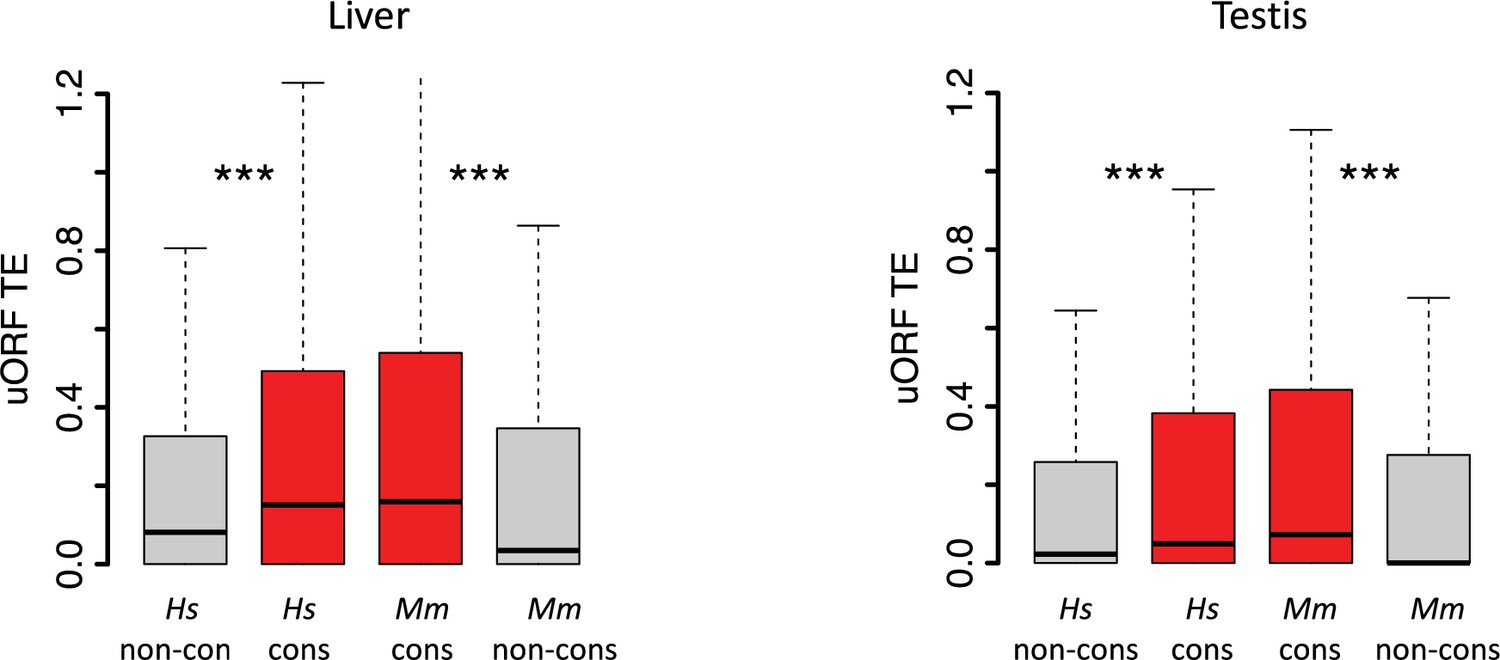
Boxplots showing the TEs of conserved and species-specific uORFs in the liver and testis of H.
sapiens and M. mulatta. Wilcoxon rank-sum tests. ***, p<0.001.
-
Figure 8—figure supplement 1—source data 1
Raw numerical data underlying the figures.
- https://cdn.elifesciences.org/articles/104074/elife-104074-fig8-figsupp1-data1-v1.xlsx
Figure 8—figure supplement 2
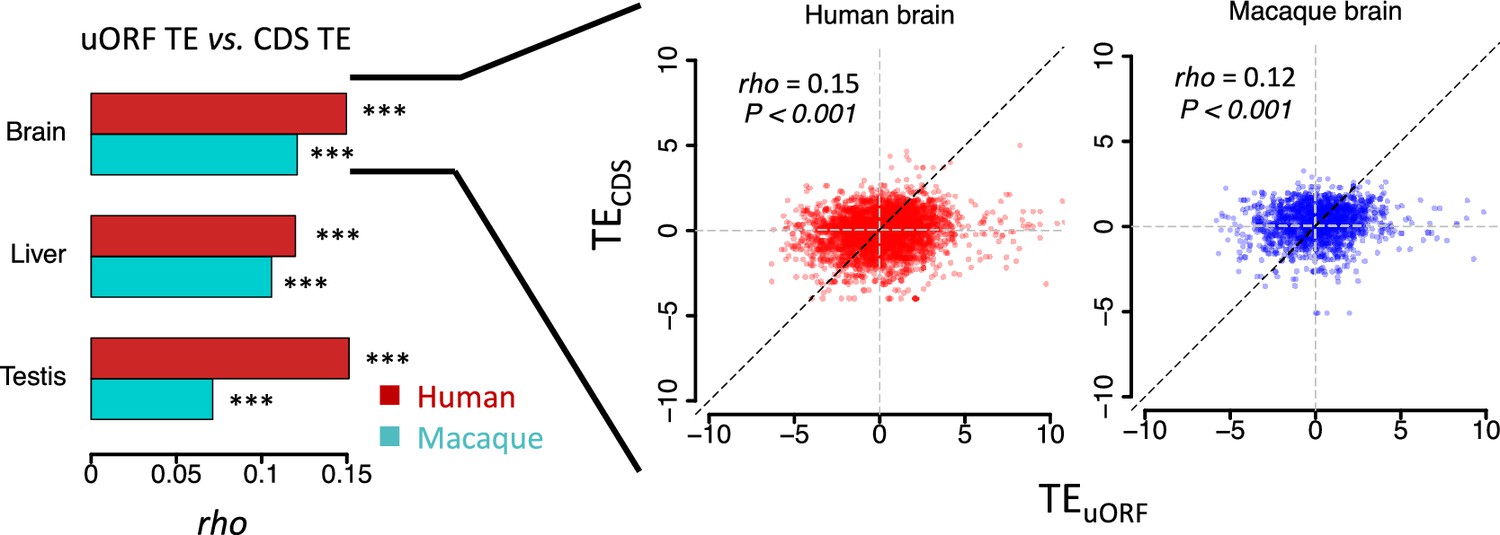
Correlations of uORF TE and corresponding CDS TE in 3 tissues of H.
sapiens and M. mulatta. The bars represent Spearman’s correlation coefficient (rho). In all samples, we obtained p-values <0.001. Data from brains are shown as examples in the right panel.
-
Figure 8—figure supplement 2—source data 1
Raw numerical data underlying the figures.
- https://cdn.elifesciences.org/articles/104074/elife-104074-fig8-figsupp2-data1-v1.xlsx
Figure 8—figure supplement 3
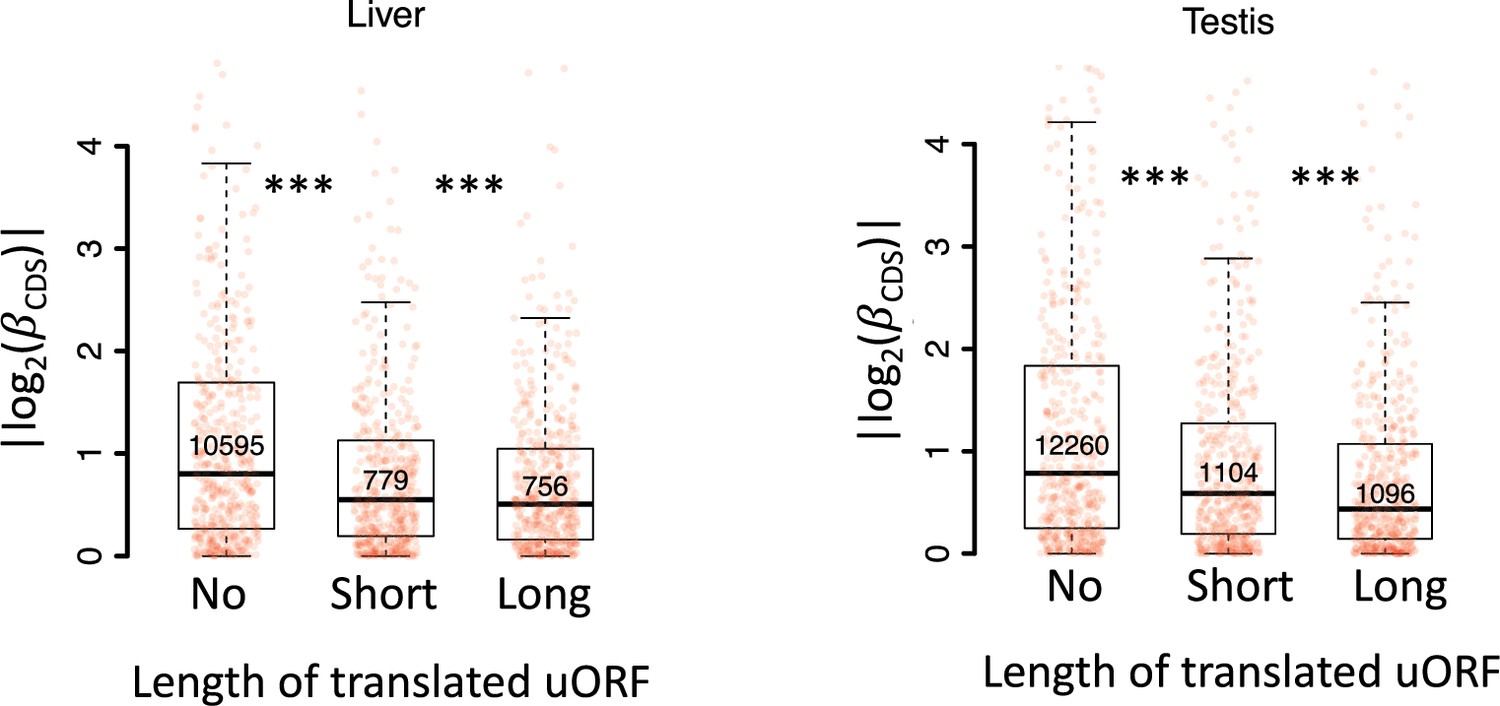
Boxplots showing interspecific CDS TE variability |()| for three gene groups according to the length of their translated uORFs (No, short, long) in the liver (left) and testis (testis).
Wilcoxon rank-sum tests. ***, p<0.001.
-
Figure 8—figure supplement 3—source data 1
Raw numerical data underlying the figures.
- https://cdn.elifesciences.org/articles/104074/elife-104074-fig8-figsupp3-data1-v1.xlsx
Figure 8—figure supplement 4
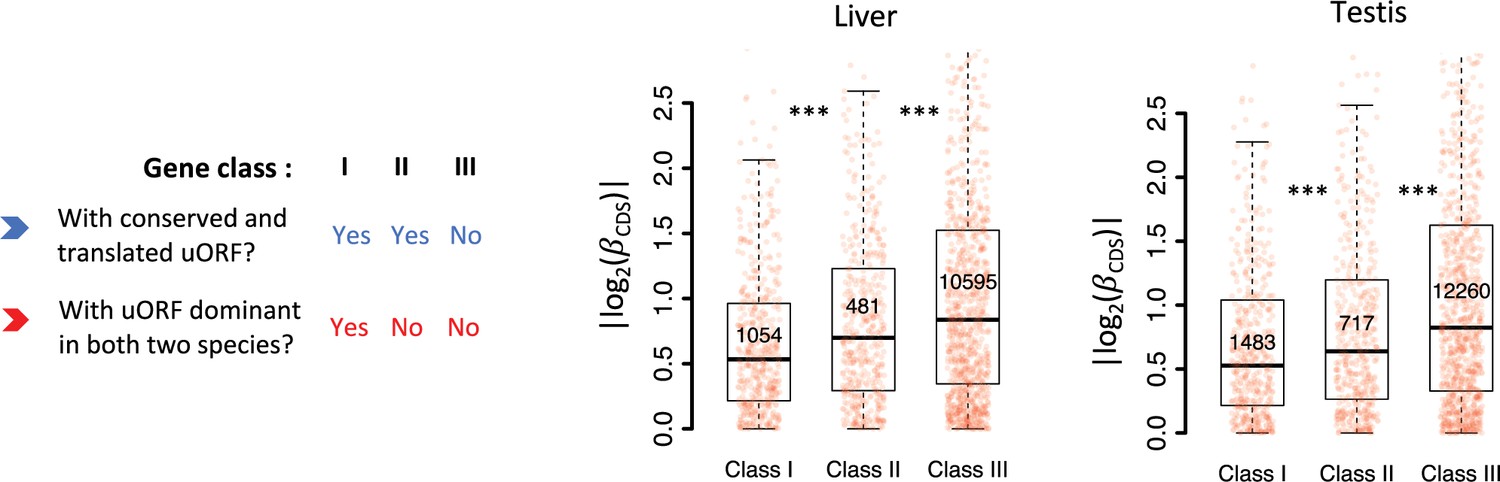
Boxplots showing interspecific CDS TE variability |()| for different gene classes in the liver and testis.
Genes expressed in liver or testis (mRNA RPKM >0.1 in both species) were classified into three classes according to whether a gene had a conserved and dominant translated uORF (TE >0.1) in both species or not. Wilcoxon rank-sum tests. ***, p<0.001.
-
Figure 8—figure supplement 4—source data 1
Raw numerical data underlying the figures.
- https://cdn.elifesciences.org/articles/104074/elife-104074-fig8-figsupp4-data1-v1.xlsx
Figure 8—figure supplement 5
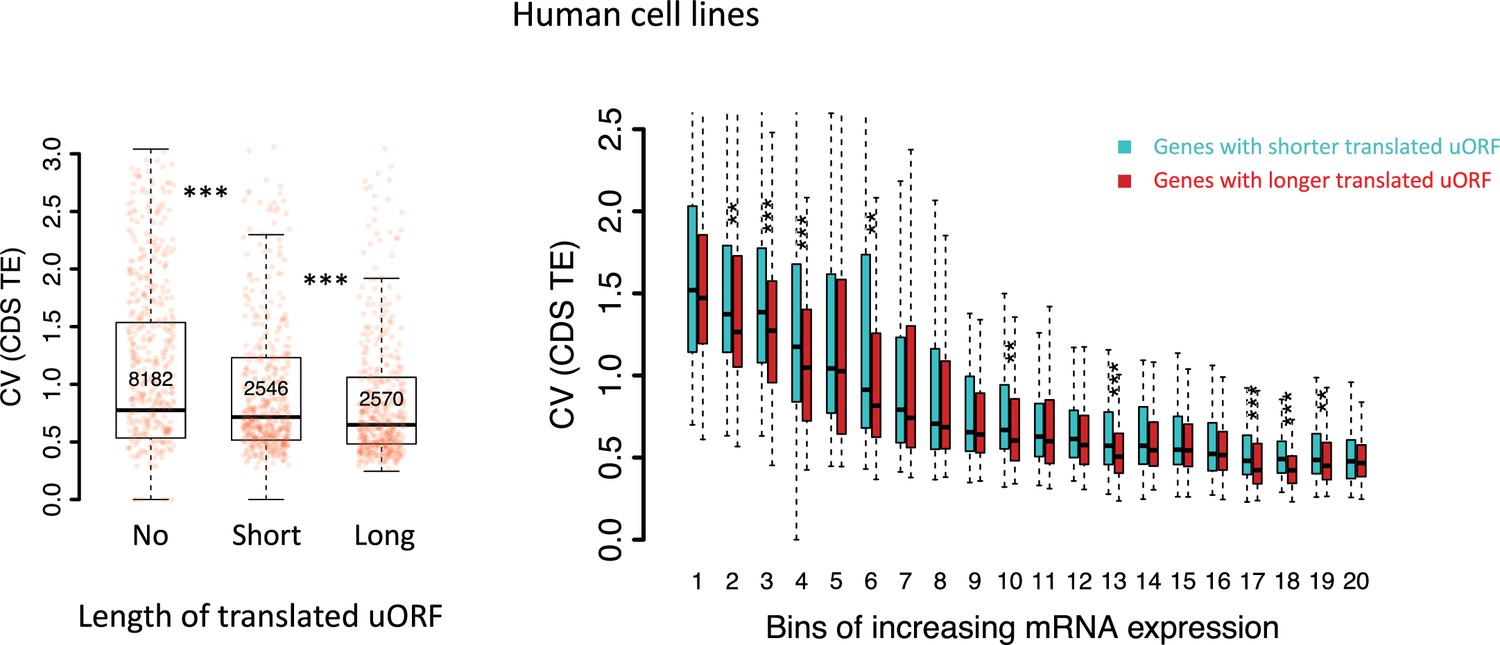
Left panel: Boxplot showing the coefficients of variation (CVs) of CDS TEs among 69 human lymphoblastoid cell lines (LCLs) for three gene groups.
Genes were classified into three groups according to the total length of translated uORFs. Right panel: boxplot showing the coefficients of variation (CVs) of CDS TEs among the human cell lines. Genes with translated uORFs were divided into 20 bins with increasing mRNA expression levels. In each bin, genes were divided into two fractions according to the total length of translated uORFs.
-
Figure 8—figure supplement 5—source data 1
Raw numerical data underlying the figures.
- https://cdn.elifesciences.org/articles/104074/elife-104074-fig8-figsupp5-data1-v1.xlsx
Figure 9
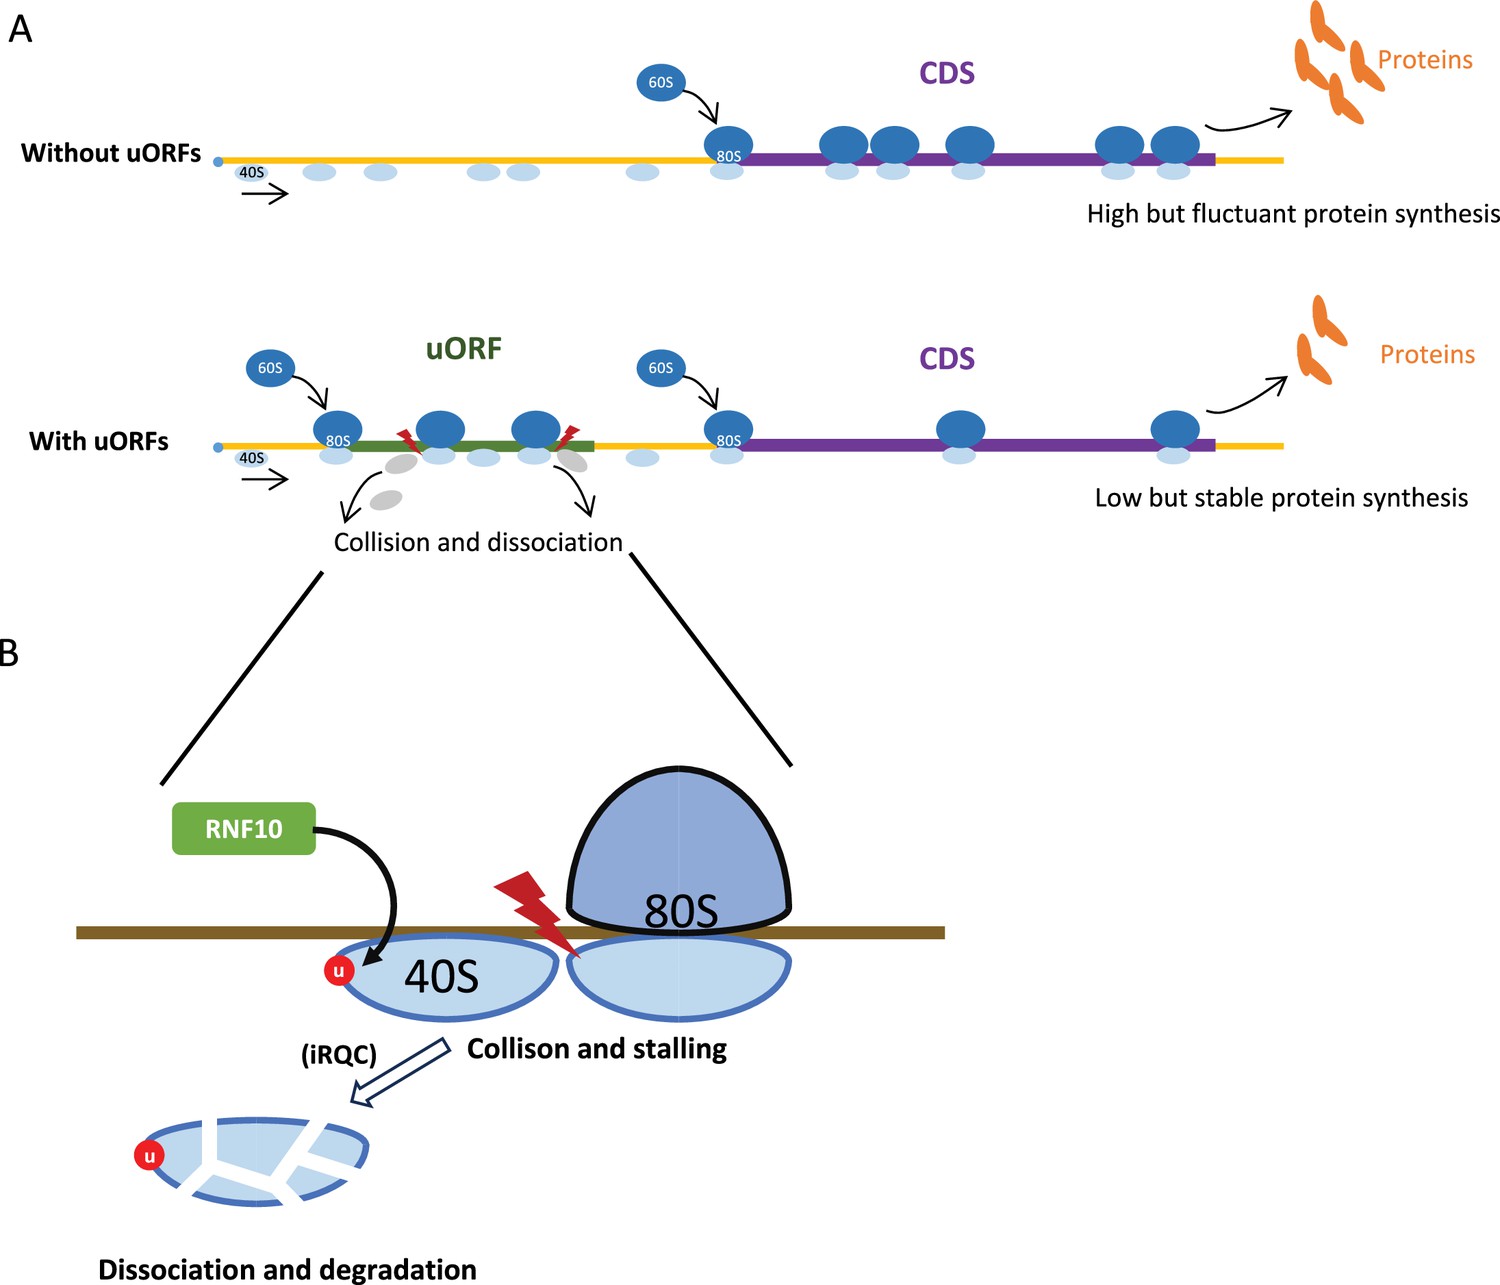
Model illustrating the uORF-mediated translational buffering.
(A) uORFs can reduce and stabilize the downstream CDS translation through ‘ribosomes collision and dissociation’ mechanism in an mRNA containing uORFs. In contrast, the CDS translation is higher and more fluctuant in an mRNA without uORFs. (B) The collided and stalled 40S subunit dissociates from mRNA, is ubiquitinated by the E3 ubiquitin ligase RNF10, and degraded by the initiation ribosome quality control (iRQC) pathway.
Tables
Table 1
Numbers of genes showing different magnitudes of TE changes between uORFs and CDS at the interspecific level.
| Sample types | # of expressed uORFs * | βu ≠ 1(%) † | # of expressed CDSs * | βc ≠ 1(%) † | uORF-CDS pairs with βu>1 | uORF-CDS pairs with βu<1 | ||||
|---|---|---|---|---|---|---|---|---|---|---|
| Total | γ>1 | γ<1 | Total | γ>1 | γ<1 | |||||
| 0–2 hr embryo | 7704 | 1193 (15.49) | 7934 | 4189 (52.80) | 770 | 0 | 366 | 423 | 69 | 0 |
| 2–6 hr embryo | 7822 | 567 (7.25) | 9795 | 3063 (31.27) | 249 | 0 | 63 | 318 | 135 | 0 |
| 6–12 hr embryo | 10,400 | 1040 (10.00) | 10,643 | 2,924 (27.47) | 973 | 0 | 641 | 67 | 22 | 1 |
| 12–24 hr embryo | 11,365 | 535 (4.71) | 11,158 | 3537 (31.70) | 454 | 0 | 234 | 81 | 8 | 2 |
| Larva | 10,008 | 464 (4.64) | 11,831 | 3554 (30.04) | 110 | 0 | 26 | 354 | 177 | 0 |
| Pupa | 12,309 | 635 (5.16) | 12,209 | 4087 (33.48) | 136 | 1 | 15 | 499 | 210 | 0 |
| Male body | 10,894 | 197 (1.81) | 12,284 | 2432 (19.80) | 122 | 0 | 29 | 75 | 4 | 0 |
| Male head | 10,904 | 144 (1.32) | 10,447 | 1151 (11.02) | 119 | 0 | 31 | 25 | 5 | 0 |
| Female body | 9809 | 340 (3.47) | 11,002 | 3605 (32.77) | 279 | 0 | 17 | 61 | 3 | 0 |
| Female head | 10,935 | 332 (3.04) | 10,545 | 1270 (12.04) | 324 | 0 | 152 | 8 | 3 | 0 |
-
*
Only uORFs and CDSs with an mRNA RPKM >0.1 in both D. melanogaster and D. simulans were considered in each sample pair in the analysis.
-
†
is the fold change of in D. simulans relative to D. melanogaster for each sample. is the fold change of TECDS in D. simulans relative to D. melanogaster for each sample. . For each CDS–uORF pair, either and , or and means that the magnitude of TE change is lower for a CDS than for a uORF. The statistical significance of , , and were determined according to an FDR < 0.05
-
Table 1—source data 1
Raw data and statistical analysis for uORF TE changes.
- https://cdn.elifesciences.org/articles/104074/elife-104074-table1-data1-v1.xlsx
-
Table 1—source data 2
Raw data and statistical analysis for CDS TE changes.
- https://cdn.elifesciences.org/articles/104074/elife-104074-table1-data2-v1.xlsx
Key resources table
| Reagent type (species) or resource | Designation | Source or reference | Identifiers | Additional information |
|---|---|---|---|---|
| Gene (D. melanogaster) | bicoid | FlyBase | FBgn0000166 | N/A |
| Strain, strain background (D. simulans) | Sim4 (D. simulans) | This study | N/A | Used to generate all D. simulans libraries |
| Genetic reagent (D. melanogaster) | y,v; attp40{nos-Cas9} | Tsinghua Fly Center | TH00788 | Host line injected with sgRNA plasmid |
| Genetic reagent (D. melanogaster) | w1118 | Bloomington Drosophila Stock Center | BDSC: 3605 | Used for outcrossing and wild-type control |
| Genetic reagent (D. melanogaster) | uKO1/uKO1 | This study | N/A | Bcd-uORF-knockout mutant |
| Genetic reagent (D. melanogaster) | uKO2/uKO2 | This study | N/A | Bcd-uORF-knockout mutant |
| Cell line (D. melanogaster) | S2 cells | Thermo Fisher Scientific | R69007 | Mycoplasma-free, regularly tested using PCR-based assay |
| Biological sample (D. simulans) | Embryos, larva, pupa, bodies, heads | This study | N/A | Used for mRNA-seq and Ribo-seq |
| Biological sample (D. melanogaster) | Embryos, larva, pupa, bodies, heads | Zhang et al., 2018a | N/A | Used for mRNA-seq and Ribo-seq |
| Recombinant DNA reagent | pU6B | Tsinghua Fly Center | N/A | sgRNA-expression vector |
| Recombinant DNA reagent | psiCHECK-2 | Promega | C8021 | Used for dual-luciferase reporter assay |
| Commercial assay or kit | PrimeScript II 1st Strand cDNA Synthesis Kit | Takara | Cat# 6210 A | Used for cDNA synthesis |
| Commercial assay or kit | PowerUp SYBR Green Master Mix | Thermo Fisher Scientific | N/A | Used for RT-qPCR |
| Commercial assay or kit | Dual-Luciferase Reporter Assay System | Promega | E1980 | For measuring Renilla and firefly luciferase activity |
| Chemical compound, drug | SuperaseIn RNase inhibitor | Ambion | Cat# AM2694 | RNase inhibitor |
| Chemical compound, drug | Proteinase inhibitor cocktail | Roche | N/A | Proteinase inhibitor |
| Chemical compound, drug | Lipofectamine 3000 | Thermo Fisher Scientific | L3000001 | transfection of plasmids into S2 cells |
| Software, algorithm | R | R Foundation for Statistical Computing | https://www.r-project.org | Version 4.2.3; packages used include ggplot2, DESeq2, etc. |
| Software, algorithm | Python | Python Software Foundation | https://www.python.org | Version 3.10 |
| Software, algorithm | Cutadapt 3.0 | https://cutadapt.readthedocs.io | N/A | Used for adaptor trimming |
| Software, algorithm | Bowtie2 v2.2.3 | https://bowtie-bio.sourceforge.net/bowtie2/index.shtml | N/A | Used for read mapping to contaminant/reference genomes |
| Software, algorithm | STAR | https://github.com/alexdobin/STAR | RRID:SCR_004463 | Used for aligning mRNA-Seq and Ribo-Seq reads to reference genomes |
| Software, algorithm | psite (Plastid) | https://plastid.readthedocs.io | N/A | Used to assign P-sites of ribosome-protected fragments (RPFs) |
| Sequence-based reagent | Bcd-uORF-sgRNA-F | This paper | sgRNA for Bcd uORF knock-out | ATCGCAAAAACGCAAAATGT |
| Sequence-based reagent | Bcd-uORF-sgRNA-R | This paper | sgRNA for Bcd uORF knock-out | ACATTTTGCGTTTTTGCGAT |
| Sequence-based reagent | Bcd-qPCR-F | This paper | RT‒qPCR primers used for Bcd | GATGTATCTGGGTGGCTGCT |
| Sequence-based reagent | Bcd-qPCR-F | This paper | RT‒qPCR primers used for Bcd | CCGAAATGTGGGACGATAAC |
| Sequence-based reagent | Bcd-genotyping-F | This paper | Primers used for Bcd mutant genotyping | GCTTTGCCGTACTGTTCGAT |
| Sequence-based reagent | Bcd-genotyping-R | This paper | Primers used for Bcd mutant genotyping | AACTGAAGCTGCGGATGTTG |
| Sequence-based reagent | Rp49-qPCR-F | This paper | RT‒qPCR primers used for rp49 | CACTTCATCCGCCACCAGTC |
| Sequence-based reagent | Rp49-qPCR-R | This paper | RT‒qPCR primers used for rp49 | CGCTTGTTCGATCCGTAACC |
Author response table 1
Proportion of uORFs and CDSs with significant TE changes before and after selecting HEGs.
| Original | Highly expressed genes | |||||||
|---|---|---|---|---|---|---|---|---|
| Sample types | # of expressed uORFs | beta_("III ")!=1 (%) | # of expressed CDSs | b_(sigma)!=1 (%) | # of expressed uORFs | beta_("III ")!=1 (%) | # of expresse d CDSs | b_(c)!=1 (%) |
| 0-2 h embryo | 7,704 | 1,193 (15.49) | 7,934 | 4,189 (52.80) | 3,531 | 703 (19.90) | 2760 | 1,393 (50.47) |
| 2-6h embryo | 7,822 | 567 (7.25) | 9,795 | 3,063 (31.27) | 4,666 | 456 (9.77) | 3910 | 1,926 (49.26) |
| 6-12h embryo | 10,400 | 1,040 (10.00) | 10,643 | 2,924 (27.47) | 5,718 | 866 (15.15) | 4271 | 1,544 (36.15) |
| 12-24h embryo | 11,365 | 535 (4.71) | 11,158 | 3,537 (31.70) | 5,454 | 423 (7.76) | 4304 | 1,852 (43.03) |
| Larva | 10,008 | 464 (4.64) | 11,831 | 3,554 (30.04) | 5,247 | 377 (7.18) | 4546 | 2,149 (47.27) |
| Pupa | 12,309 | 635 (5.16) | 12,209 | 4,087 (33.48) | 6,028 | 480 (7.96) | 4487 | 2,196 (48.94) |
| Male body | 10,894 | 197 (1.81) | 12,284 | 2,432 (19.80) | 4,422 | 135 (3.05) | 4461 | 1,390 (31.16) |
| Male head | 10,904 | 144 (1.32) | 10,447 | 1,151 (11.02) | 5,644 | 123 (2.18) | 3981 | 605 (15.20) |
| Female body | 9,809 | 340 (3.47) | 11,002 | 3,605 (32.77) | 4,231 | 255 (6.03) | 4064 | 2,047 (50.37) |
| Female head | 10,935 | 332 (3.04) | 10,545 | 1,270 (12.04) | 5,510 | 269 (4.88) | 4019 | 618 (15.38) |
Additional files
-
Supplementary file 1
Parameters used in our simulation.
- https://cdn.elifesciences.org/articles/104074/elife-104074-supp1-v1.docx
-
Supplementary file 2
Mapping statistics of Ribo-Seq and matched mRNA-Seq libraries.
- https://cdn.elifesciences.org/articles/104074/elife-104074-supp2-v1.docx
-
Supplementary file 3
Genes with uORFs showing strong evidence of translational buffering.
- https://cdn.elifesciences.org/articles/104074/elife-104074-supp3-v1.csv
-
Supplementary file 4
Mapping statistics of mRNA-Seq libraries for bcd uKO2/uKO2 mutant and WT flies.
- https://cdn.elifesciences.org/articles/104074/elife-104074-supp4-v1.docx
-
Supplementary file 5
Numbers of genes showing different magnitudes of TE changes between uORFs and CDS at the interspecific level, H. sapiens and M. mulatta.
- https://cdn.elifesciences.org/articles/104074/elife-104074-supp5-v1.docx
-
MDAR checklist
- https://cdn.elifesciences.org/articles/104074/elife-104074-mdarchecklist1-v1.docx
Download links
A two-part list of links to download the article, or parts of the article, in various formats.
Downloads (link to download the article as PDF)
Open citations (links to open the citations from this article in various online reference manager services)
Cite this article (links to download the citations from this article in formats compatible with various reference manager tools)
Upstream open reading frames buffer translational variability during Drosophila evolution and development
eLife 14:RP104074.
https://doi.org/10.7554/eLife.104074.3


