A single cysteine residue in vimentin regulates long non-coding RNA XIST to suppress epithelial–mesenchymal transition and stemness in breast cancer
- Centre for Oral Immunobiology and Regenerative Medicine, Institute of Dentistry, Barts and The London School of Medicine and Dentistry, Queen Mary University of London, United Kingdom
- Department of Oral Biology and Diagnostic Sciences, The Dental College of Georgia, Augusta University, United States
- Georgia Cancer Center, Augusta University, United States
- Centre for Genomics and Child Health, Blizard Institute, Barts and The London School of Medicine and Dentistry, Queen Mary University of London, United Kingdom
Figures
Figure 1 with 2 supplements
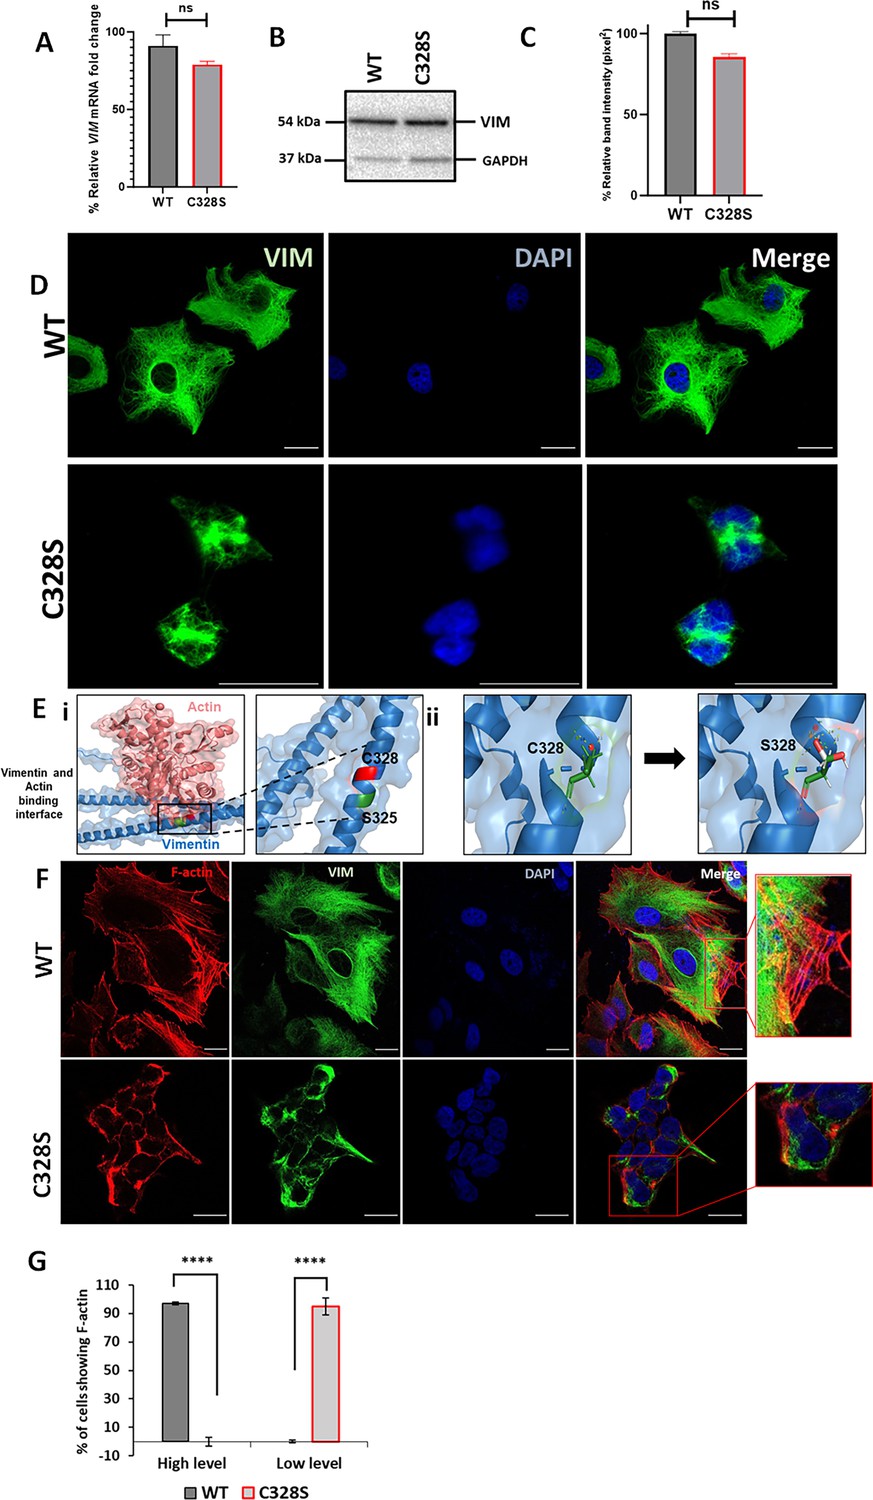
C328S mutant vimentin affects interaction with actin in silico and F-actin formation in cells.
(A) Relative fold change of VIM mRNA in WT-VIM and C328S-VIM-expressing MCF-7 cells normalised to POLR2A and YAP1. (B) Expression of WT-VIM and C328S-VIM in MCF-7 cells by western blotting (original blots in Figure 1—source data 1 and Figure 1—source data 2). (C) Quantification of vimentin using ImageJ. (D) Immunostaining of MCF-7 cells expressing WT-VIM and C328S-VIM. Cells were immunostained with mouse anti-vimentin V9, AF-488-labelled goat anti-mouse showing green fluorescence. Nuclei were stained with DAPI in blue, and the overlapping images are shown as Merge. Leica DM4000B Epi-fluorescence microscope was used for imaging (scale bar = 20 µm; the scale bar in MCF-7C328S cells is much longer as these cells were reduced in size). (E) In silico modelling of actin binding at the interface where C328 and S325 residues are located. The solid rectangular area in panel (i) is zoomed in the accompanying panel. The red colour indicates the C328 residue site, whereas the green colour indicates the S325 residue site. (ii) In silico modelling of C328 and S328 residue sites and rotamer conformations further zoomed in from the panel (i). The green colour indicates hydrogen bonds, the white colour indicates covalent bonds, and the red colour indicates oxygen atom. (F) Immunostaining of MCF-7 cells expressing WT- and C328S-VIM. Cells were immunostained with AF568 Phalloidin (red colour) and anti-vimentin (green colour) antibody. Nuclei were in blue, and the overlapping images are shown as Merge. Images were taken using the Zeiss 880 laser scanning confocal microscope with Fast Airyscan and Multiphoton (inverted) system (scale bar = 20 µm). (G) Percentage of cells expressing F-actin in WT and C328 cells (see Figure 1—figure supplement 2 for clarification of high and low expression). Student’s t-test was used to calculate p values using Microsoft Excel and are given by asterisks (****p<0.0001). Statistical analyses: n = 3, error bars = ± SEM, ns = not significant, number of cells counted = 200.
-
Figure 1—source data 1
Full-size western blot indicating the relevant bands cropped for Figure 1B.
- https://cdn.elifesciences.org/articles/104191/elife-104191-fig1-data1-v1.zip
-
Figure 1—source data 2
Original file for western blot analysis displayed in Figure 1B.
- https://cdn.elifesciences.org/articles/104191/elife-104191-fig1-data2-v1.zip
Figure 1—figure supplement 1
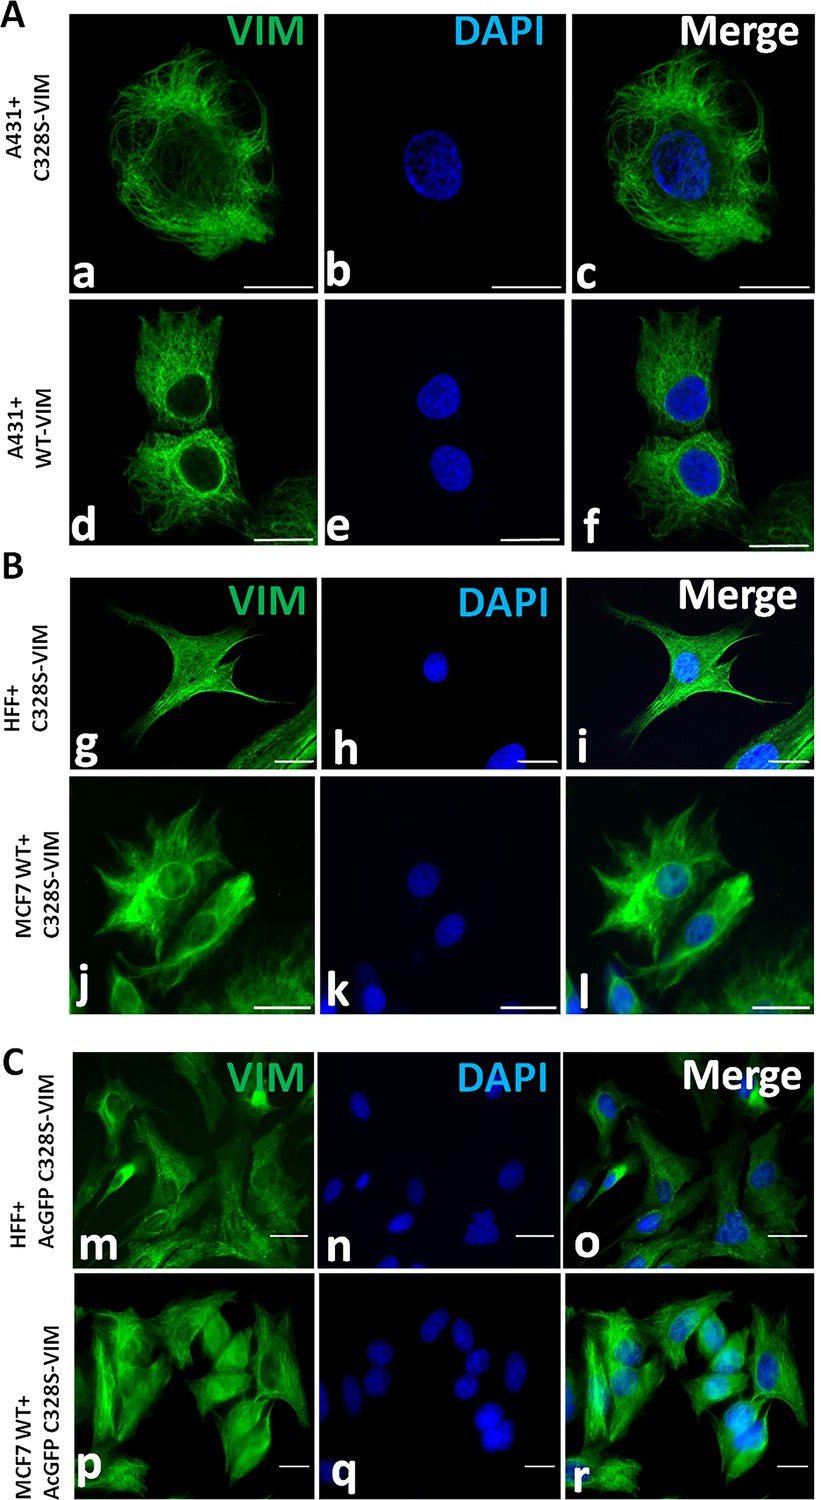
Immunostaining of vimentin filaments.
(A) Filament formation by C328S-VIM (a–c) and WT-VIM (d–f) in A431. Cells were immunostained with V9 followed by AF-488-labelled anti-mouse secondary antibody. Note that vimentin filament distribution is different from MCF-7C328S-VIM as the filaments are fully extended in the area between nucleus and peripheral cell boundaries. (B) Integration of C328S-VIM into the endogenous vimentin network of HFF-1 (g–i) and MCF-7 WT (j–l). (C) Integration of AcGFP-C328S-VIM mutant in HFF-1 (m–o) and MCF-7WT cells (p–r). AcGFP-C328S-VIM constructs integrated into the pre-existing filament network. Scale bar = 20 µm.
Figure 1—figure supplement 2
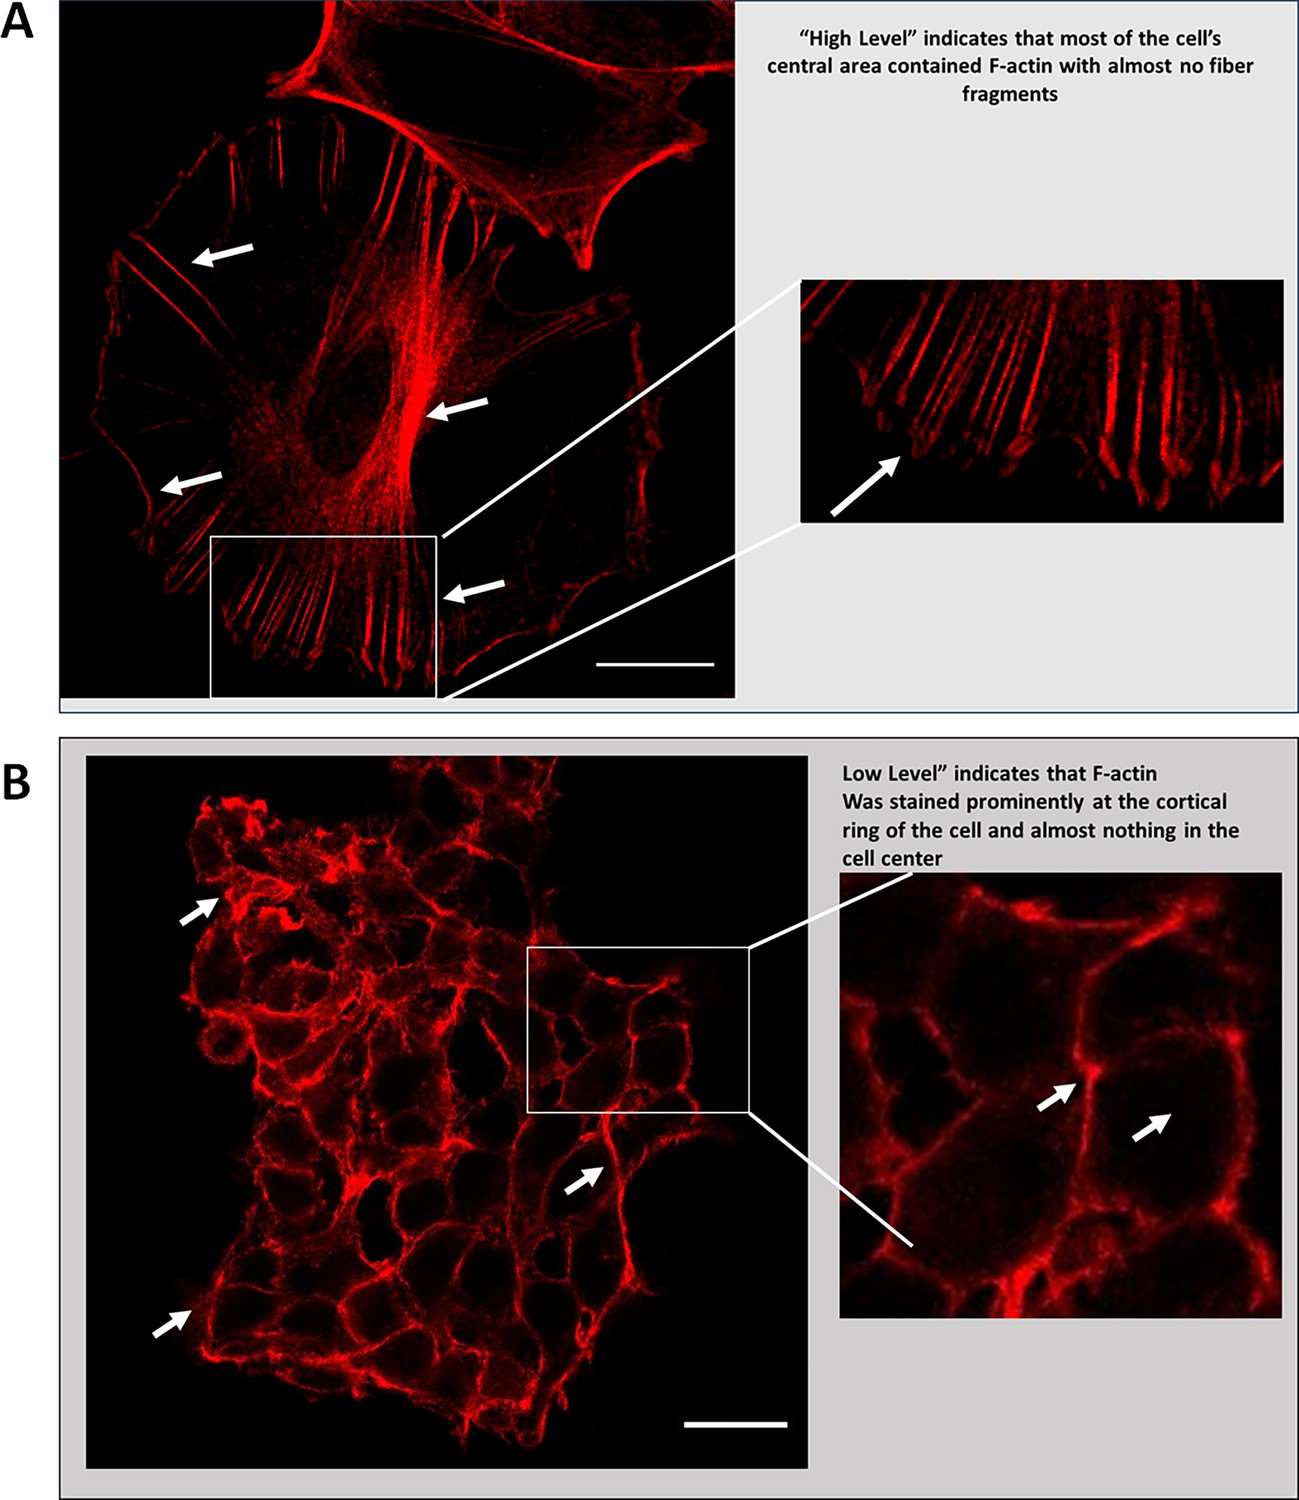
Actin filaments in cells containing wildtype and C328S vimentin.
(A) Representative high-resolution image showing high-level actin stress fibres in the WT-VIM cells. (B) Representative image showing low-level actin staining with aggregates/fragments confined to cortical margins and no staining in cell centres (scale bar = 20 µm).
Figure 2
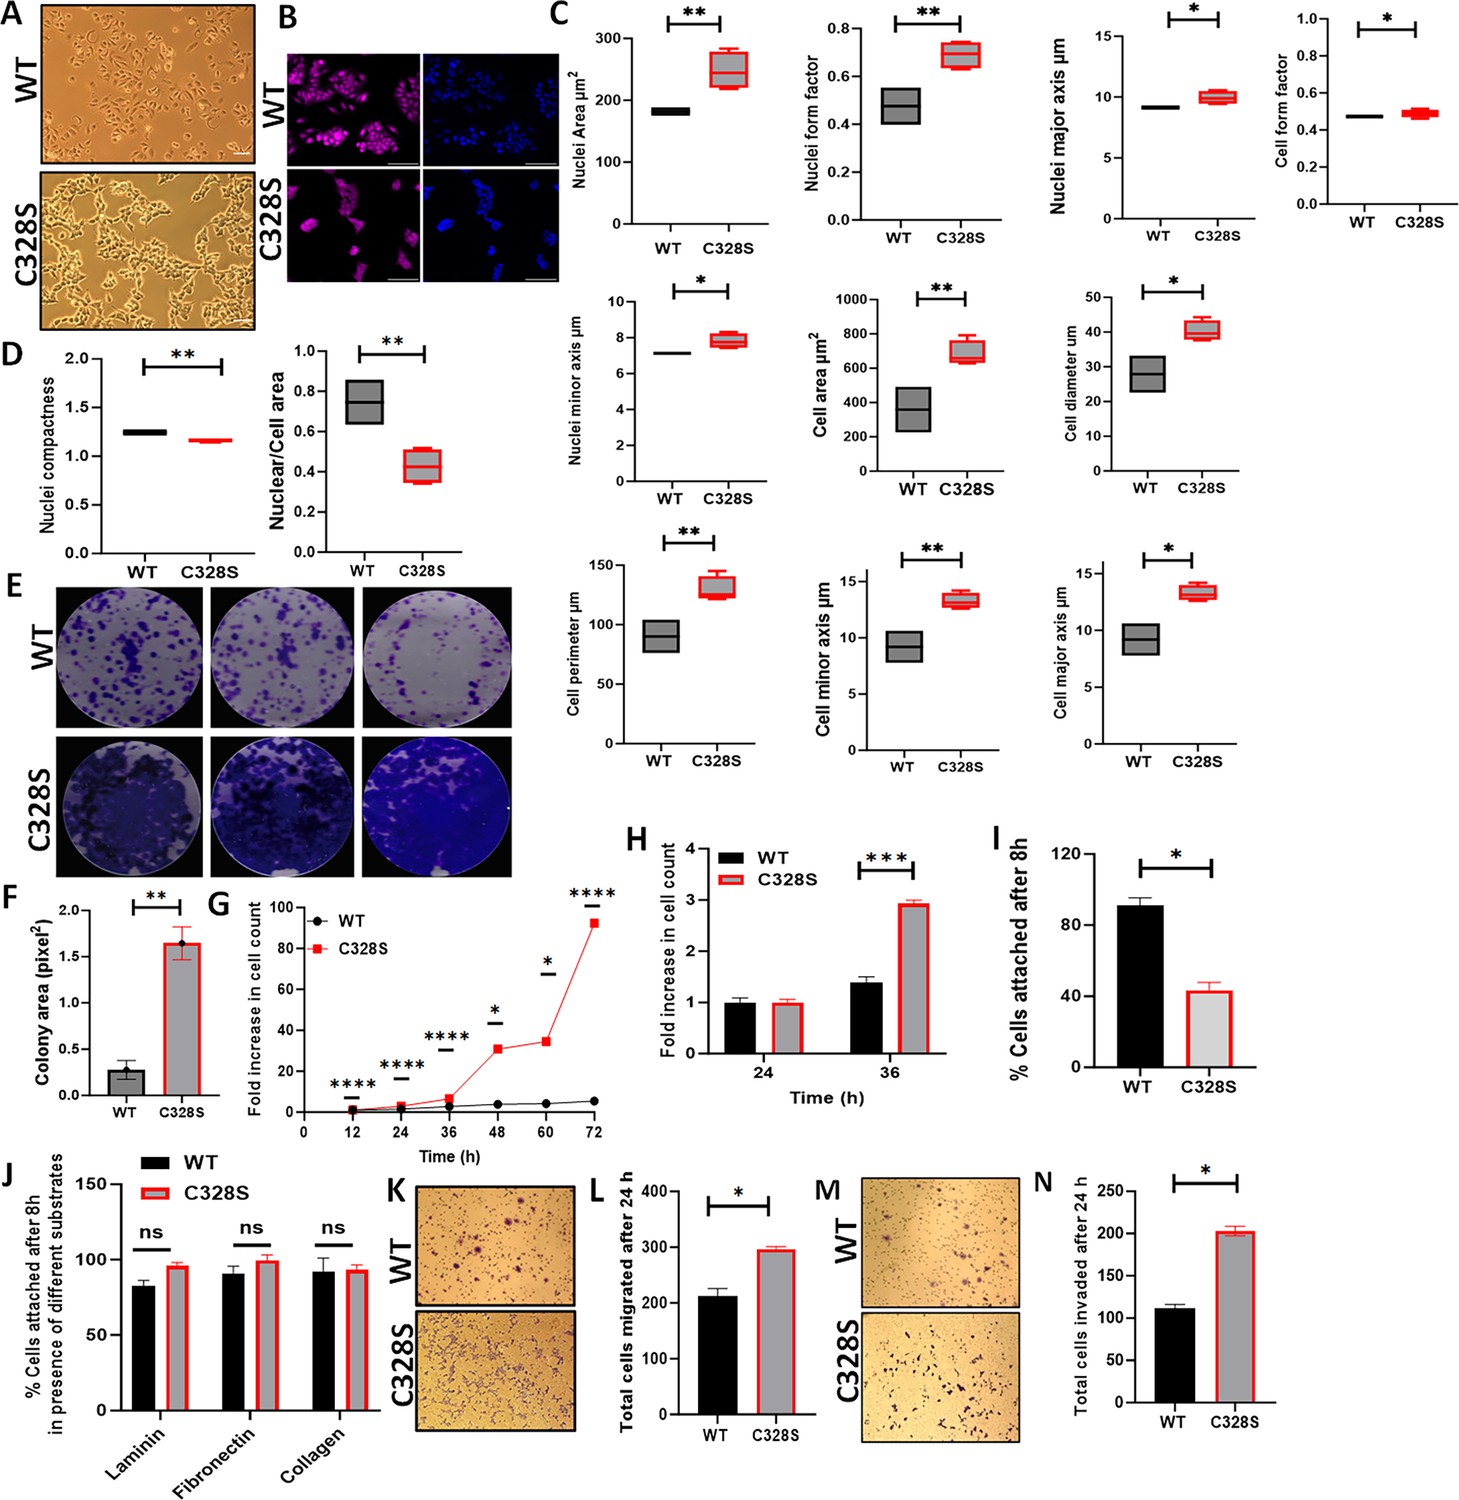
Effect of C328S-VIM on cell morphology, proliferation, adhesion, and invasion.
(A) Morphology of MCF-7-expressing WT-VIM and C328S-VIM in brightfield (scale bar = 100 µm). (B) Morphology of WT and C328S cells stained with CellMask deep red dye. Images were captured by INCA 2200 and analysed using INCarta software (scale bar = 50 µm). (C) Differences in nuclear area, nuclei form factor, nuclear major axis, nuclear minor axis, cell area, cell diameter, cell perimeter, cell minor axis, cell major axis, and cell form factor between the two cell lines. (D) Significant reduction in nuclear compactness and nuclei/cell area between the two cell lines. Proliferation rate was compared between WT and C328S cells by (E, F) colony, (G) MTT, and (H) CyQUANT assays. (I) CyQUANT cell adhesion assay was performed to compare the cell adhesion between WT and C328S cells without substrate, and (J) with the addition of laminin, fibronectin, and collagen, separately. (K) Chemotactic migration of the WT and C328S cells through 8.0 µm culture inserts. The cells were fixed and stained with 0.1% (w/v) crystal violet before imaging. (L) The cells on the outer surface of the inserts were counted and compared between WT and C328S. (M) Chemotactic invasion in WT and C328S cells through 8.0 µm culture inserts coated with Matrigel. The cells were fixed and stained with 0.1% (w/v) crystal violet. (N) Total number of cells invaded on the outer surface of the inserts was counted. Statistical analyses: n = 3, error bars = ± SEM, Student’s t-test was used to calculate p values using Microsoft Excel and are given by asterisks (*p<0.05, **p<0.01, ***p<0.001, and ****p<0.0001).
Figure 3 with 5 supplements
Transcriptomic insight into tumorigenic potential induced by C328S-VIM both in vitro and in vivo.
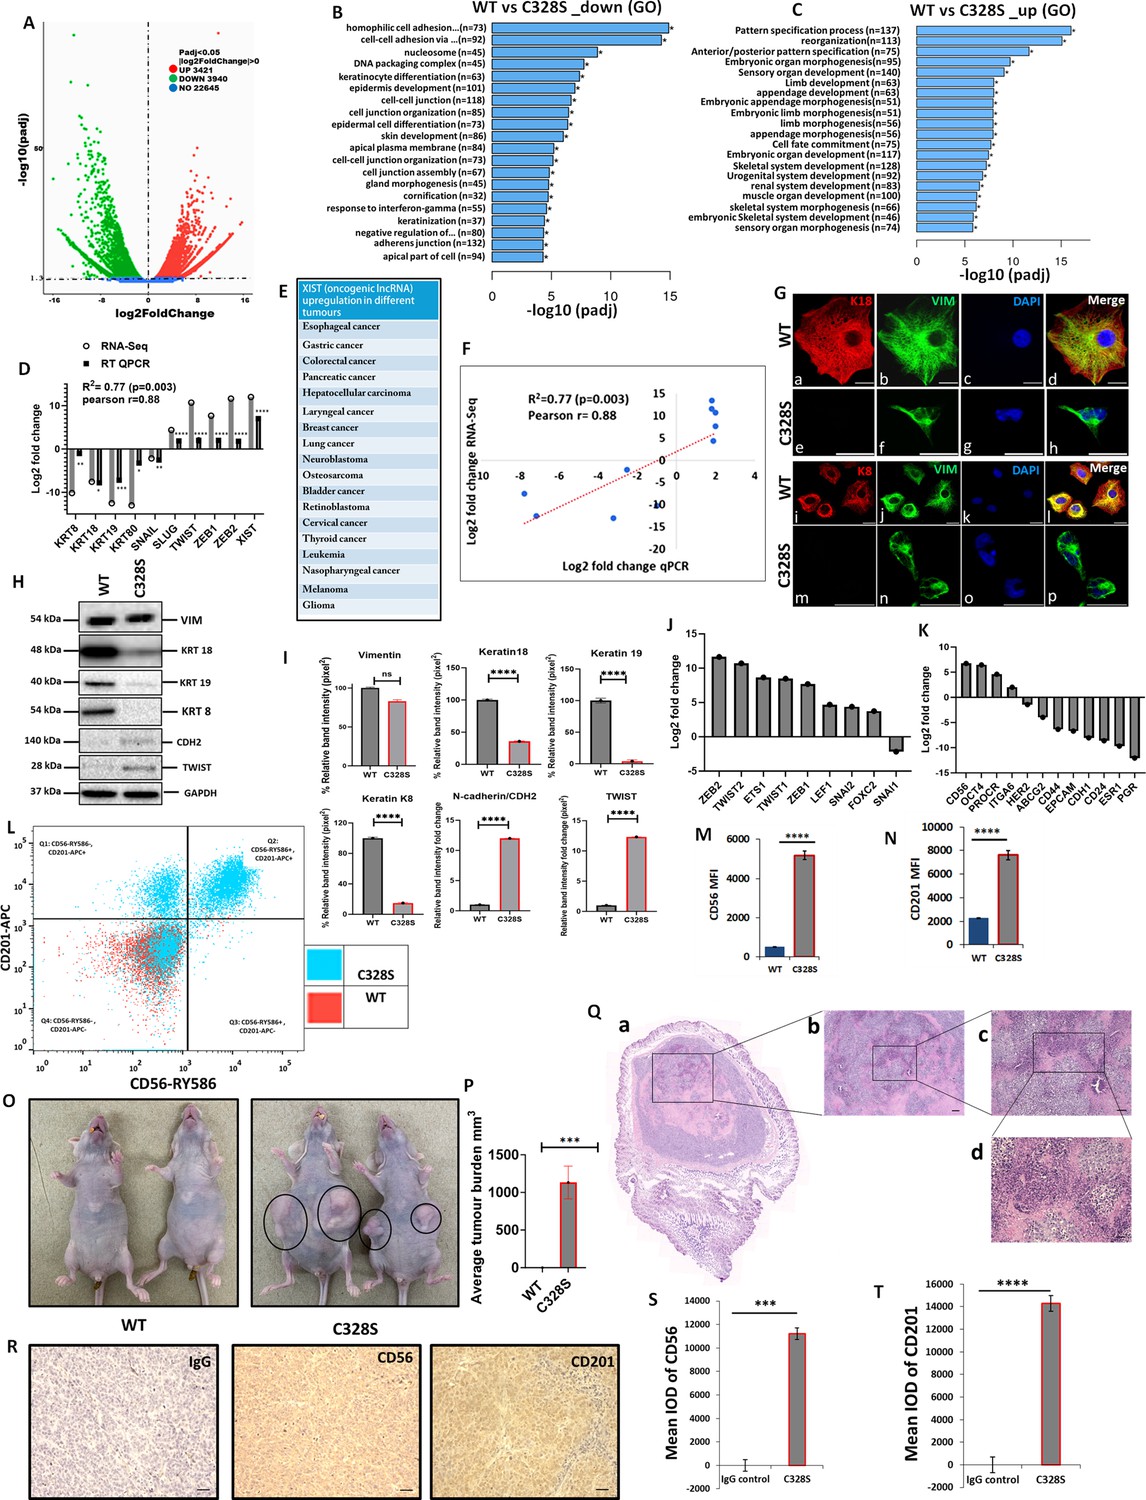
(A) Volcano plot showing differentially expressed genes (DEGs) between WT and C328S cells. Gene Ontology (GO) showing overview of cellular functions, (B) downregulated, and (C) upregulated by DEGs. (D) RNA-Seq analysis showing log2-fold expression and validation by RT-qPCR for DEGs of interest. (E) XIST, the most upregulated gene, has been implicated in a large number of solid tumours (Madhi and Kim, 2019). (F) Linear regression analysis of log2-fold changes from RT-qPCR and RNA-Seq of DEGs. (G) Immunostaining of WT and C328S cells with V9, rabbit anti-K8, and rabbit anti-K18 using AF-488 (green) goat anti-mouse and AF-594 (red) goat anti-rabbit were used. Nuclei are in blue, overlapping images are shown as Merge. Leica DM4000B Epi-fluorescence microscope was used for imaging (scale bar = 20 µm). (H) VIM, K18, K19, K8, CDH2/N-cadherin, and TWIST1 expression by western blotting in WT and C328S cells. Relevant bands were cropped from the original blots shown in Figure 3—source data 1 and Figure 3—source data 2. (I) Quantification of the protein expression in panel (H) using ImageJ. (J) Relative log2-fold changes in the expression of EMT transcription factors, and (K) breast cancer stem cell markers in WT and C328S cells by RNA-Seq analysis. (L) Flow cytometry overlay dot plot of CD56-RY586 vs CD201-APC after gating on single and live cells for immunophenotype. (M) Comparison of mean fluorescence intensity (MFI) of CD56 in WT and C328S cells. (N) Comparison of MFI of CD201 in WT and C328S cells. (O) Transplantation of WT and C328 cells in nude mice without oestrogen. (P) Average tumour burden after 2 weeks in nude mice injected with WT and C328S cells. (Q) H&E-stained tumour sections scale bar = 50 µm. (R) Representative image from immunohistochemical staining of CD56 and CD201 in tumour sections compared with IgG control, scale bar = 50 µm. (S) Quantification of CD56 and (T): CD201 staining in tumour sections and control using ImageJ. Statistical analyses: n = 3, Error bars = ± SEM, Student’s t-test to calculate p values using Microsoft Excel and are given as asterisks (*p<0.05, **p<0.01, ***p<0.001, and ****p<0.0001).
-
Figure 3—source data 1
Full-size western blots indicating the relevant bands cropped for Figure 3H.
- https://cdn.elifesciences.org/articles/104191/elife-104191-fig3-data1-v1.zip
-
Figure 3—source data 2
Original files for western blots analysis displayed in Figure 3H.
- https://cdn.elifesciences.org/articles/104191/elife-104191-fig3-data2-v1.zip
Figure 3—figure supplement 1
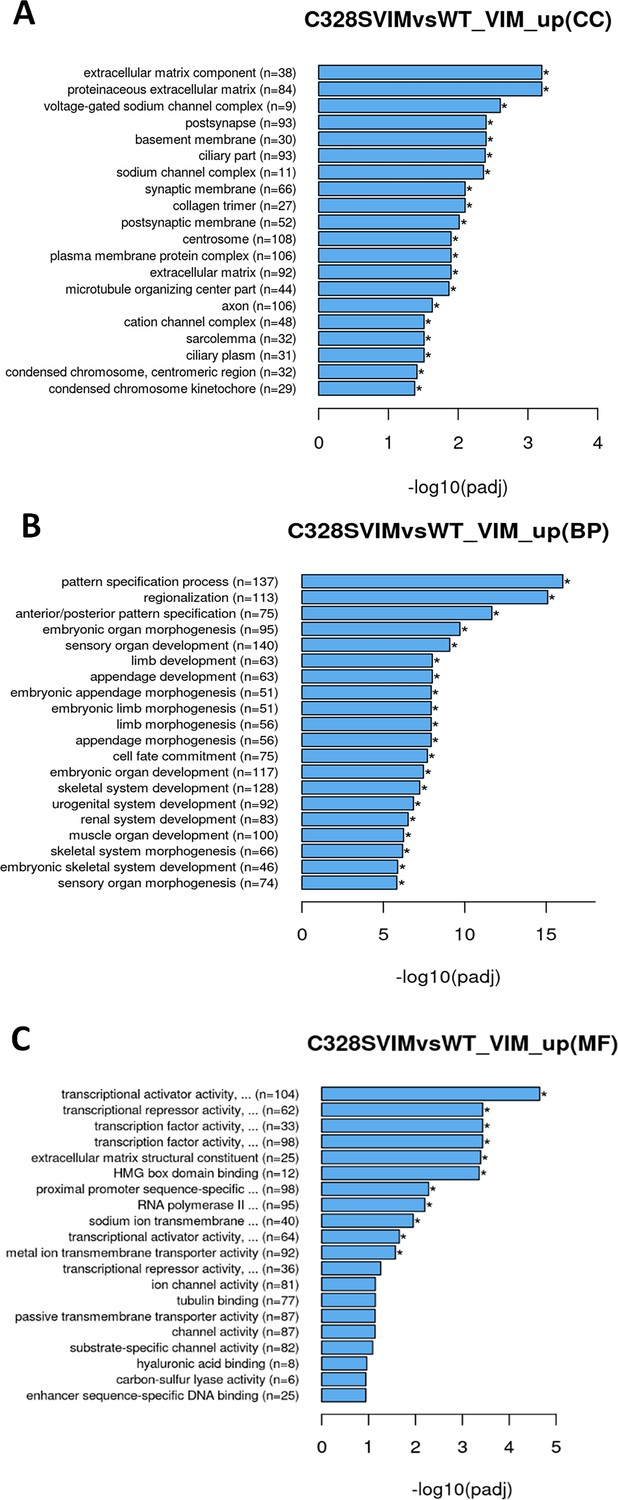
Gene Ontology (GO) pathway enrichment analyses of differentially expressed genes (DEGs) (upregulated) in WT vs C328S cells by RNA-Seq.
DEGs were grouped into three major functional types: cellular component (CC), biological process (BP), and molecular function (MF). (A) GO analysis of CC category showing functions that were upregulated by DEGs in WT vs C328S cells, which include extracellular matrix component, proteinaceous extracellular component, voltage-gated sodium channel complex, post synapse, and basement membrane. (B) GO enrichment analysis of BP category showing biological processes that were upregulated by DEGs, which include pattern specification process, regionalisation, ant/post pattern specification. (C) GO analysis of the MF category showing functions that were upregulated by DEGs, which include transcriptional activator activity, transcriptional repressor activity, extracellular matrix structural constituent, HMG box domain binding, proximal promoter sequence-specific DNA binding, and RNA polymerase II transcription regulatory region sequence-specific DNA binding.
-
Figure 3—figure supplement 1—source data 1
Spreadsheet showing all upregulated cellular functions by GO pathway enrichment analysis.
- https://cdn.elifesciences.org/articles/104191/elife-104191-fig3-figsupp1-data1-v1.xlsx
-
Figure 3—figure supplement 1—source data 2
Spreadsheet showing significantly upregulated cellular functions by GO pathway enrichment analysis.
- https://cdn.elifesciences.org/articles/104191/elife-104191-fig3-figsupp1-data2-v1.xlsx
Figure 3—figure supplement 2
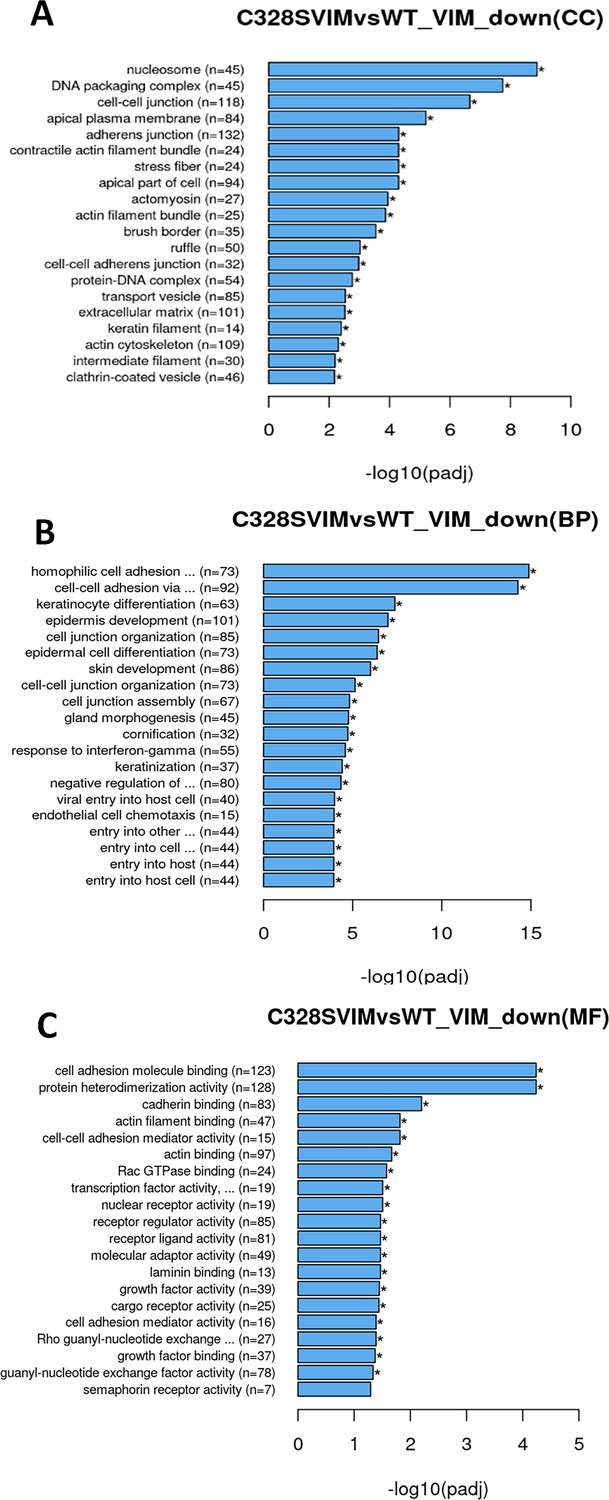
Gene Ontology (GO) pathway enrichment analyses of differentially expressed genes (DEGs) (downregulated) in WT vs C328S cells by RNA-Seq.
DEGs were grouped into three major functional types: cellular component (CC), biological process (BP), and molecular function (MF). (A) GO analysis of CC category showing functions that were downregulated by DEGs in WT vs C328S cells, which include nucleosome, DNA packaging complex, cell–cell junction, apical plasma membrane, adherens junction, contractile actin filament bundle, and stress fibre. (B) GO enrichment analysis of BP category showing biological processes that were downregulated by DEGs, which include homophilic cell adhesion via plasma membrane adhesion molecules, cell–cell adhesion via plasma–membrane adhesion molecules, keratinocyte differentiation, epidermis development, cell junction organisation, and cell junction assembly. (C) GO analysis of the MF category showing functions that were downregulated by DEGs, which include cell adhesion molecule binding, protein heterodimerisation activity, cadherin binding, cell–cell adhesion mediator activity, actin filament binding, Rac GTPase binding, and transcription factor activity.
-
Figure 3—figure supplement 2—source data 1
Spreadsheet showing GO pathway enrichment analysis (all downregulated cellular functions by DEGs).
- https://cdn.elifesciences.org/articles/104191/elife-104191-fig3-figsupp2-data1-v1.xlsx
-
Figure 3—figure supplement 2—source data 2
Spreadsheet showing GO pathway enrichment analysis (significantly downregulated cellular functions by DEGs).
- https://cdn.elifesciences.org/articles/104191/elife-104191-fig3-figsupp2-data2-v1.xlsx
Figure 3—figure supplement 3
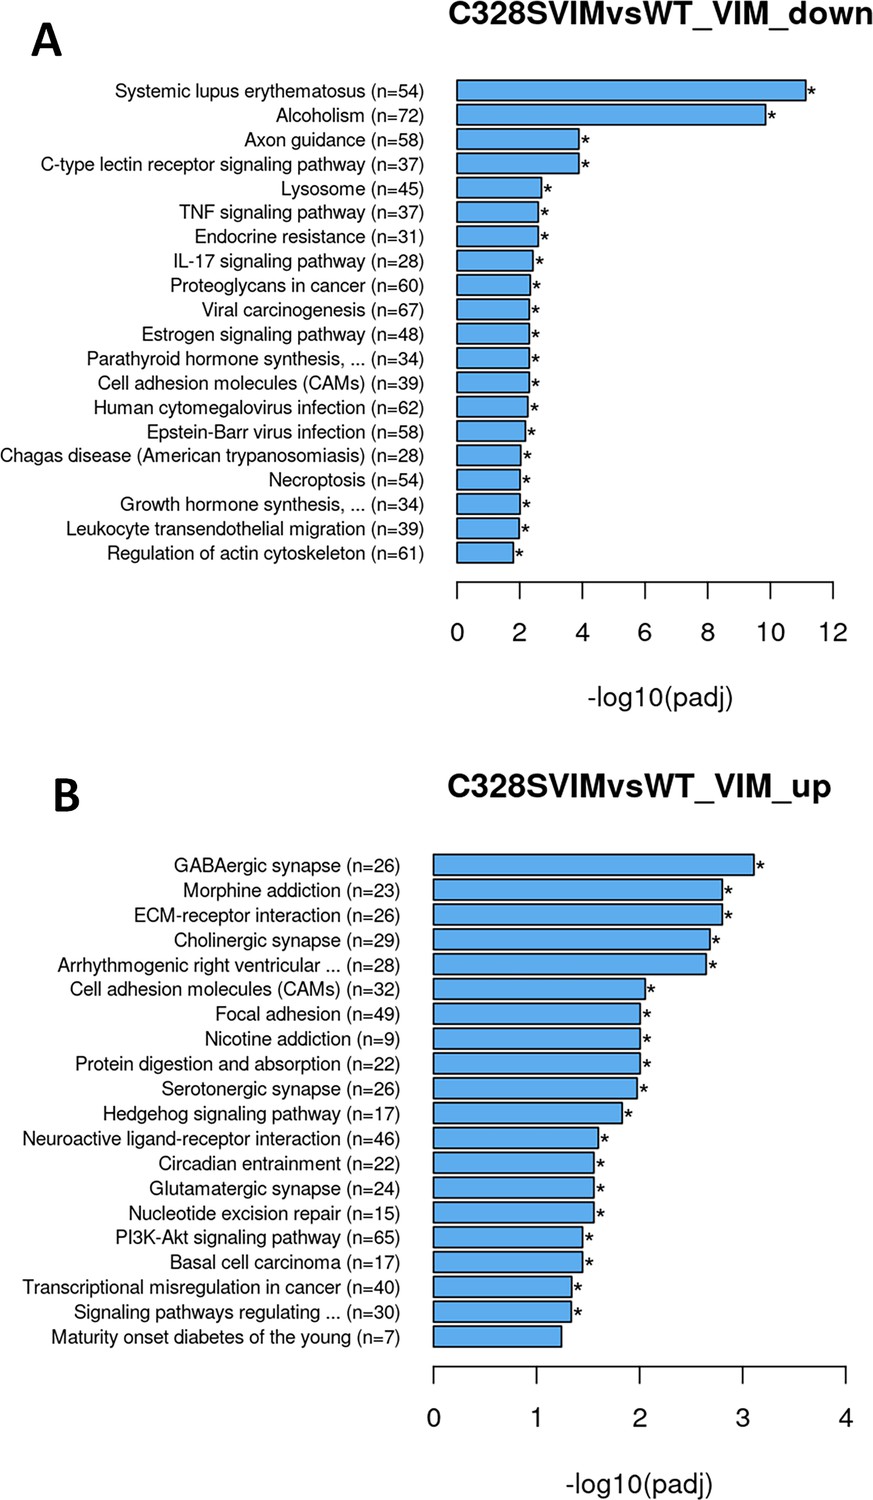
KEGG pathway analysis.
(A) Bar graph showing downregulated cellular functions by KEGG analysis in WT vs C328S involved in systemic lupus erythematosus, alcoholism, axon guidance, lysosomes, TNF signalling, IL17 signalling, cell adhesion molecules CAMs, and regulation of actin skeleton. (B) Bar graph showing upregulated cellular functions by KEGG analysis in WT vs C328S involved in GABAergic synapse, morphine addiction, ECM receptor interaction, cell adhesion molecules, focal adhesion, and Pl3K-Akt signalling pathway.
-
Figure 3—figure supplement 3—source data 1
Spreadsheet showing downregulated cellular functions by KEGG analysis.
- https://cdn.elifesciences.org/articles/104191/elife-104191-fig3-figsupp3-data1-v1.xlsx
-
Figure 3—figure supplement 3—source data 2
Spreadsheet showing upregulated cellular functions by KEGG analysis.
- https://cdn.elifesciences.org/articles/104191/elife-104191-fig3-figsupp3-data2-v1.xlsx
-
Figure 3—figure supplement 3—source data 3
Spreadsheet showing all altered cellular functions by KEGG analysis.
- https://cdn.elifesciences.org/articles/104191/elife-104191-fig3-figsupp3-data3-v1.xlsx
Figure 3—figure supplement 4
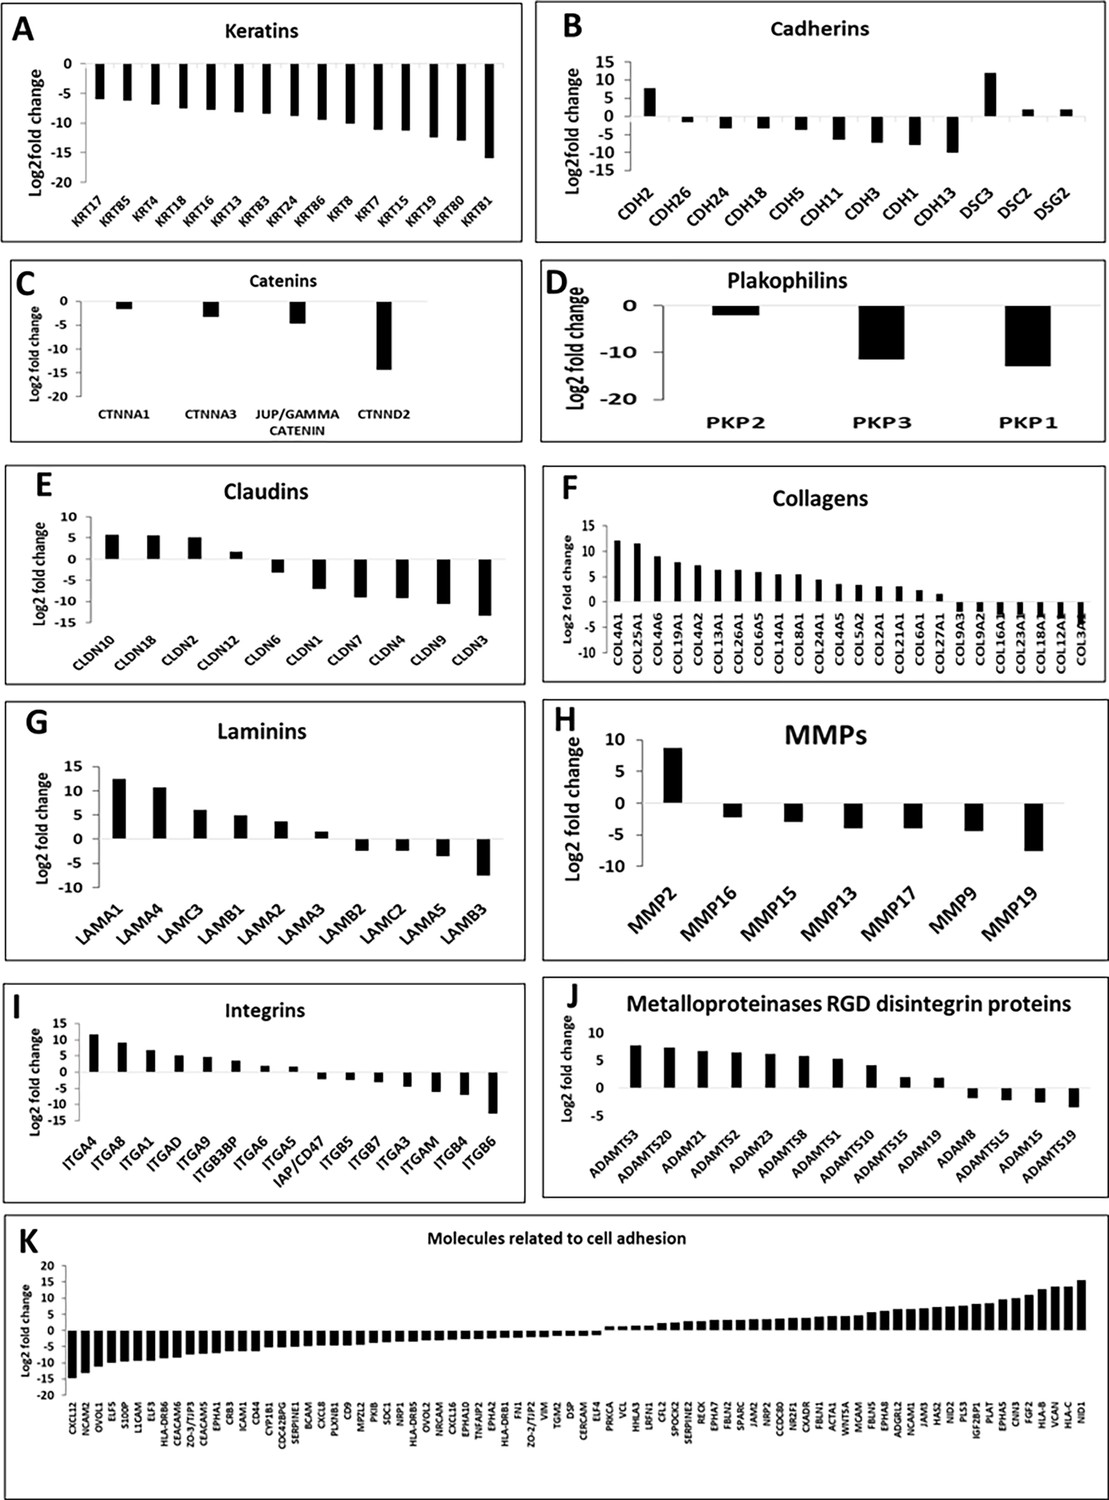
Differentially expressed genes (DEGs) deduced from the RNA-Seq data.
Relative log2-fold changes of DEGs in WT vs C328S cells related to cytokeratins (A), cadherins (B), catenins (C), plakophilins (D), claudins (E), collagens (F), laminins (G), MMPs (H), integrins (I), metalloproteinases RGD disintegrin proteins (J), and several genes related to cell adhesion (K) by RNA-Seq analysis.
-
Figure 3—figure supplement 4—source data 1
Spreadsheet containing upregulated genes.
- https://cdn.elifesciences.org/articles/104191/elife-104191-fig3-figsupp4-data1-v1.xlsx
-
Figure 3—figure supplement 4—source data 2
Spreadsheet containing downregulated genes.
- https://cdn.elifesciences.org/articles/104191/elife-104191-fig3-figsupp4-data2-v1.xlsx
Figure 3—figure supplement 5
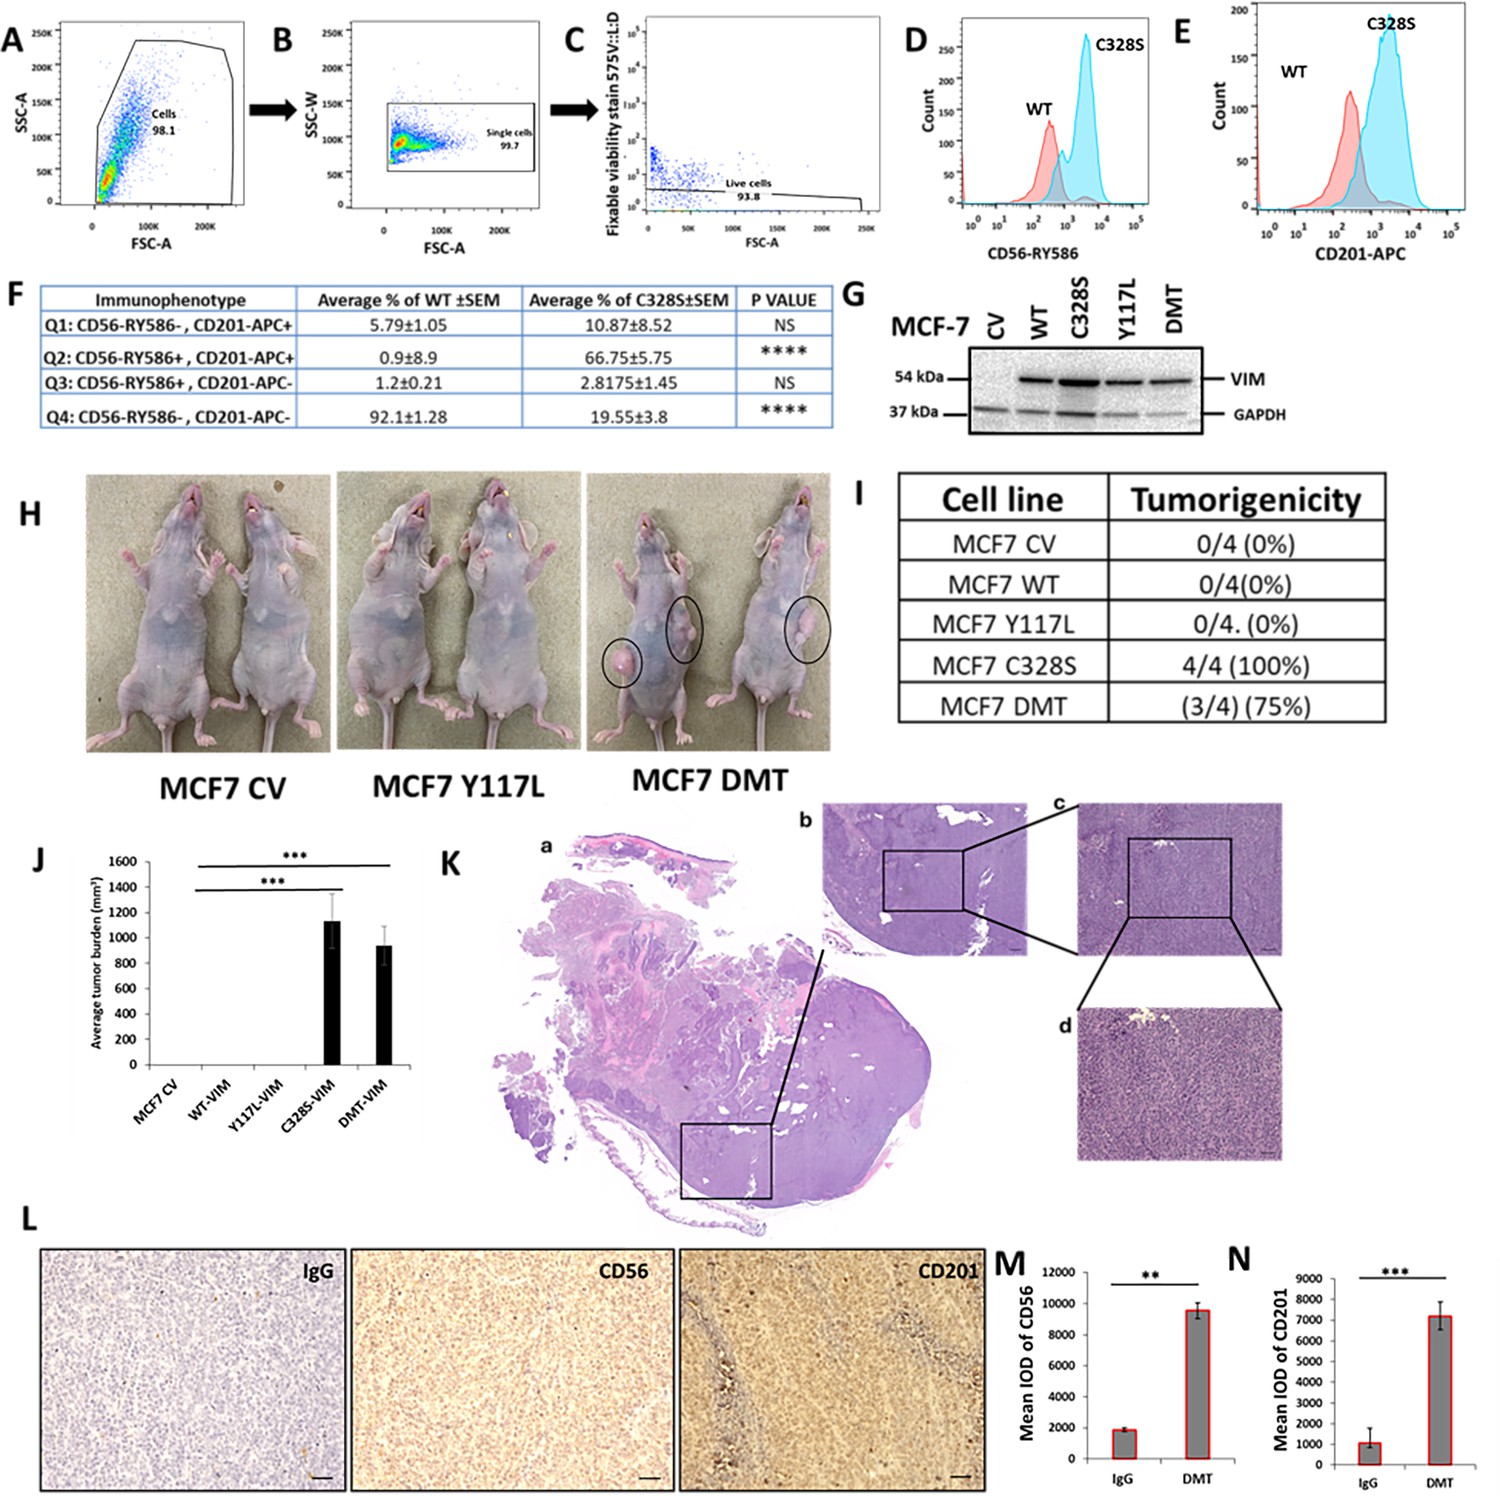
Representative gating strategies for flow cytometry analysis of breast cancer stem cell markers CD56/NCAM1 and CD201/PROCR in WT and C328S cells.
Cells were stained for surface antigens with RY586–conjugated antibody specific for CD56/NCAM1, APC-conjugated antibody specific for CD201/PROCR, and Fixable Viability Stain FVS575V for live/dead cells. Gates were applied for cells (SSC-A: FSC-A) (A), single cells (SSC-W: FSC-A) (B), and live cells (FVS575V::L/d:FSC-A) (C) as shown. (D) Representative histogram showing the mean fluorescence intensity (MFI) of CD56-RY586 in WT and C328S cells by flow cytometry. WT cells are represented by red colour and C328S by blue. (E) Representative histogram showing the MFI of CD201-APC in WT and C328S cells by flow cytometry. WT cells are represented by red colour and C328S by blue. (F) Immunophenosubtypes in WT and C328S cells in tabulated form. Note that 92.1% WT cells are double-negative CD56-RY586-, CD201-APC- (Q4) (p<0.0001) compared to C328S (19.6%). Similarly 67% of C328S cells are double-positive (Q2) CD56-RY586+, CD201-APC+ (p<0.0001) compared to WT (0.9%). Statistical analyses: n = 3, Error bars = ± SEM, ****p<0.0001. (G) MCF-7 cells were transduced with control vector (CV), wildtype vimentin (WT-VIM), mutant vimentin C328S-VIM, Y117L-VIM, and double mutant DMT (C328S-VIM+Y117L-VIM) constructs, and the stable expression was confirmed by western blot in these cell lines. (H) Transplantation of MCF-7CV, MCF-7WT-VIM, MCF-7Y117L-VIM, MCF-7C328S-VIM, and MCF-7DMT-VIM in nude mice without oestrogen supplementation. (I) Table showing tumorigenicity potential of CV, WT-VIM, Y117L-VIM, C328S-VIM, and DMT-VIM-expressing MCF-7 cells without oestrogen supplementation. (J) Average tumour burden after 2 weeks in nude mice injected with CV, WT-VIM, Y117L-VIM, C328S-VIM, and DMT-VIM-expressing MCF-7 cells. (K) H&E stained tumour sections from mouse injected with DMT-expressing MCF-7 cells, scale bar = 50 µm. (L) Representative image from immunohistochemical staining of CD56 and CD201 in tumour sections from mice injected with DMT-expressing MCF-7 cells compared to IgG control, scale bar = 50 µm. (M) Quantification of CD56 and (N) CD201 IHC staining in tumour sections from mice injected with DMT-expressing MCF-7 cells compared to IgG control using ImageJ. IOD = optical intensity of positive cells × area of positive cells.
-
Figure 3—figure supplement 5—source data 1
Western blots indicating the relevant bands cropped for Figure 3—figure supplement 5G.
- https://cdn.elifesciences.org/articles/104191/elife-104191-fig3-figsupp5-data1-v1.zip
-
Figure 3—figure supplement 5—source data 2
Original files for western blots analysis displayed in Figure 3—figure supplement 5G.
- https://cdn.elifesciences.org/articles/104191/elife-104191-fig3-figsupp5-data2-v1.zip
Figure 4 with 4 supplements
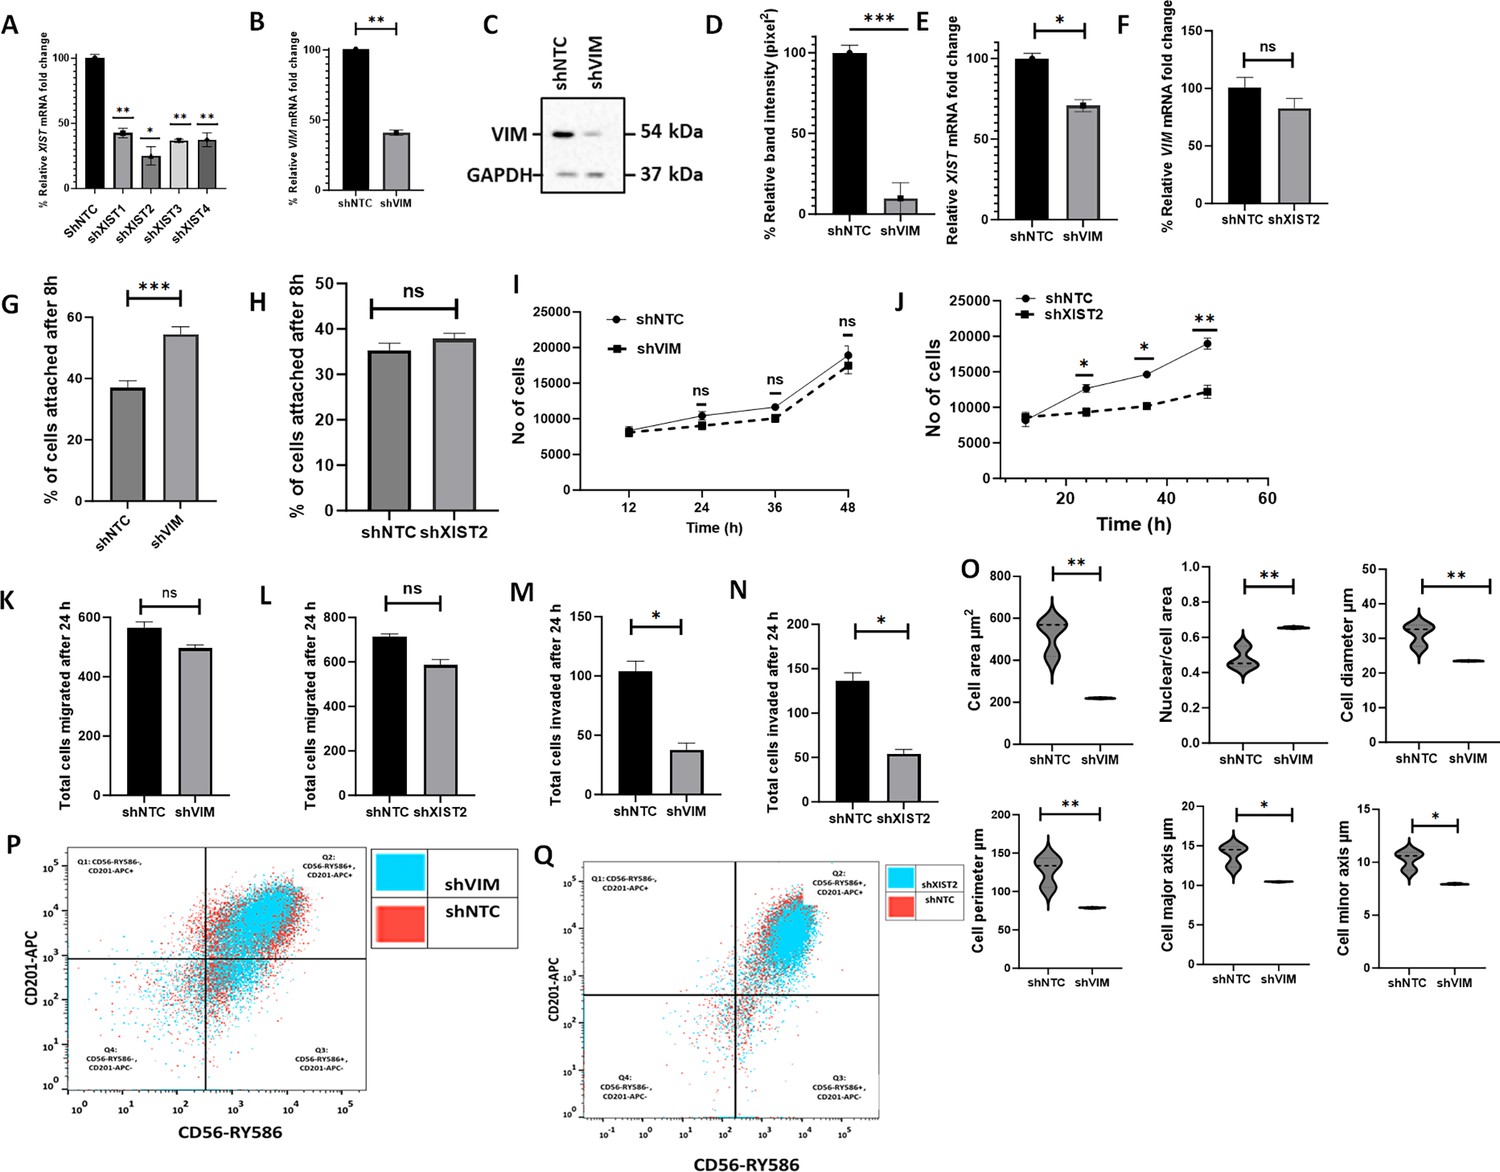
shRNA-mediated downregulation of XIST in C328S-VIM reverts cell phenotype.
(A) Downregulation of XIST in C328S cells by four different shRNAs (sh1-sh4) for XIST or NTC by RT-qPCR. shXIST2 was the most potent (p<0.05) compared with NTC. (B) VIM expression in MCF-7C328S_shVIM and MCF-7C328S_shNTC as determined by RT-qPCR. (C) Vimentin expression in MCF-7C328S_shVIM and MCF-7C328S_shNTC by western blotting (original blots in Figure 4—source data 1 and Figure 4—source data 2). (D) Quantification of the protein expression in panel (C) using ImageJ. (E) XIST RNA in MCF-7 cells expressing C328S_shVIM and C328S_shNTC by RT-qPCR. (F) Relative VIM mRNA fold change (%) in MCF-7 cells expressing C328S_shXIST2 and C328S_shNTC by RT-qPCR. Comparison of cell adhesion (G) between MCF-7C328S_shVIM and MCF-7C328S_shNTC, and (H) between MCF-7C328S_shXIST2 and MCF-7C328S_shNTC cells without substrate by CyQUANT assay. Comparison of cell proliferation, (I) between MCF-7C328S_shVIM and MCF-7C328S_shNTC, and (J) between MCF-7C328S_shXIST2 and MCF-7C328S_shNTC by MTT assay. Comparison of chemotactic migration (K) between MCF-7C328S_shVIM and MCF-7C328S_shNTC, and (L) between MCF-7C328S_shXIST2 and MCF-7C328S_shNTC cells through 8.0 µm culture inserts. Comparison of chemotactic invasion (M) between MCF-7C328S_shVIM and MCF-7C328S_shNTC, and (N) between MCF-7C328S_shXIST2 and MCF-7C328S_shNTC cells through 8.0 µm Matrigel coated inserts. (O) Comparison of cell area, ratio of nuclei/cell area, cell diameter, cell perimeter, cell major axis, cell minor axis, between MCF-7C328S_shVIM and MCF-7C328S_shNTC. (P) Flow cytometry overlay dot plot of CD56-RY586 vs CD201-APC after gating on single and live cells for immunophenotyping of MCF-7C328S_shVIM and MCF-7C328S_shNTC cells. (Q) Flow cytometry overlay dot plot of CD56-RY586 vs CD201-APC after gating on single and live cells for immunophenotyping of MCF-7C328S_shXIST2 and MCF-7C328S_shNTC cells. Statistical analyses: n = 3, error bars = ± SEM, Student’s t-test was used to calculate p values using Microsoft Excel when two groups were compared, one-way ANOVA with Bonferroni test was applied using GraphPad Prism 10 when comparing more than two groups (*p<0.05, **p<0.01, and ***p<0.001).
-
Figure 4—source data 1
Full-size western blots indicating the relevant bands cropped for Figure 4C.
- https://cdn.elifesciences.org/articles/104191/elife-104191-fig4-data1-v1.zip
-
Figure 4—source data 2
Original files for western blots analysis displayed in Figure 4C.
- https://cdn.elifesciences.org/articles/104191/elife-104191-fig4-data2-v1.zip
Figure 4—figure supplement 1
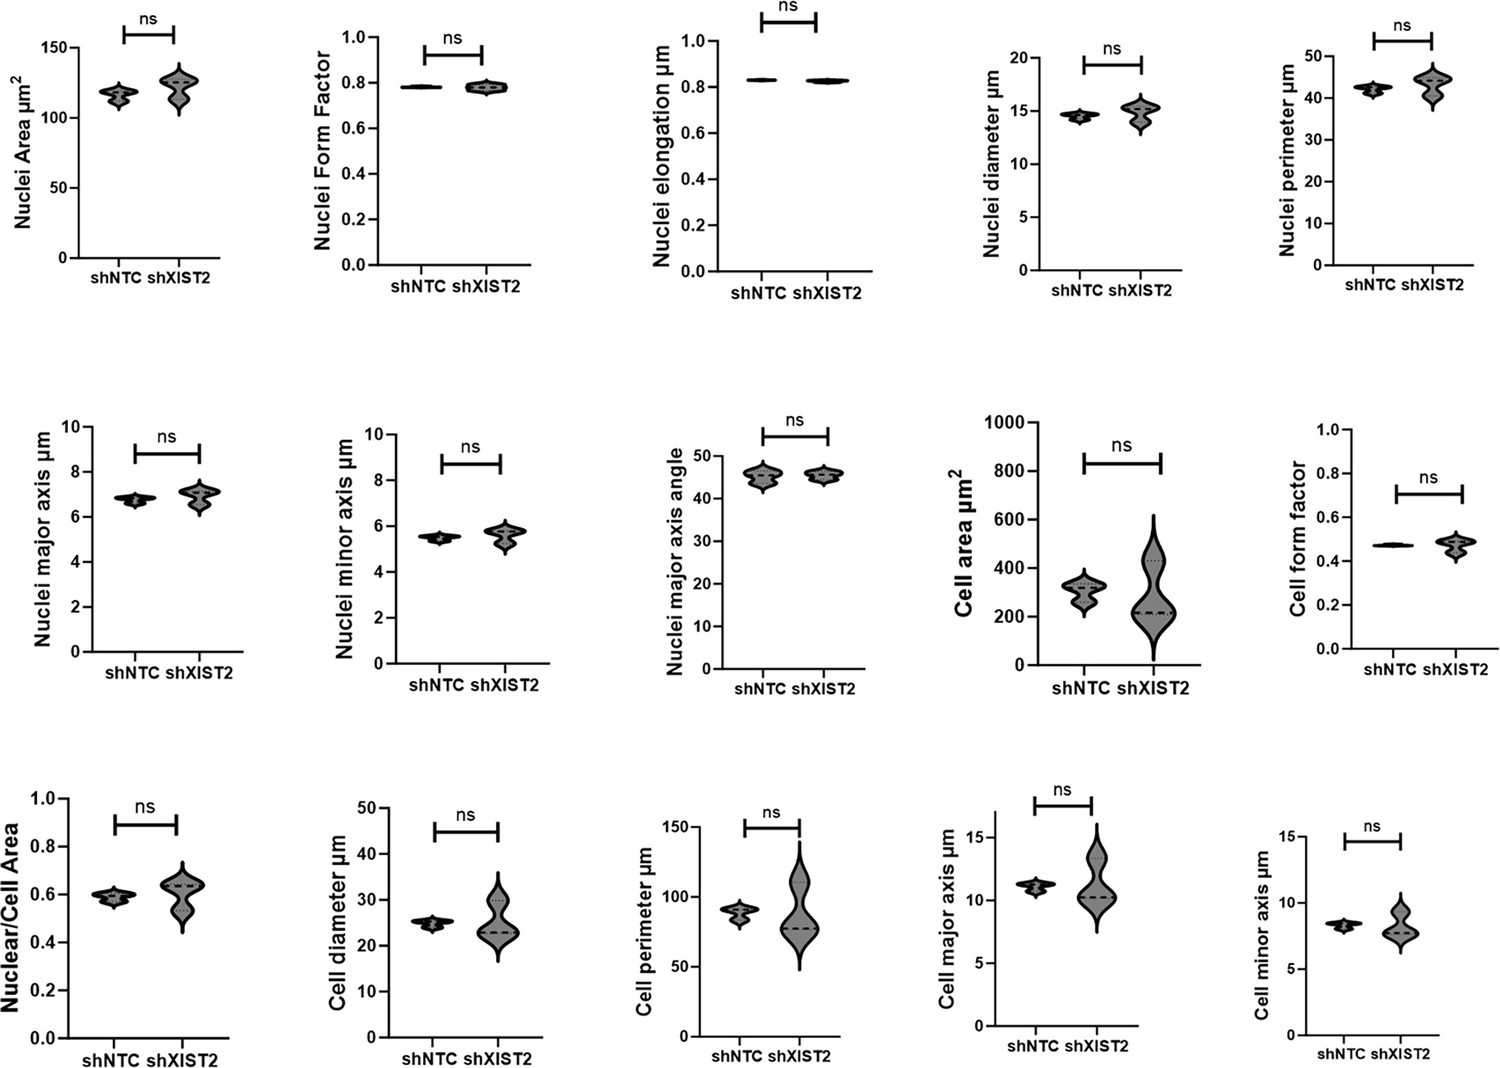
Morphology of C328SVIM_shXIST2 and C328SVIM_shNTC cells.
Morphological analysis carried out by using INCarta USA 2200 software showing insignificant differences in nuclei area, nuclei form factor, nuclei elongation, nuclei diameter, nuclei perimeter, nuclei major axis, nuclei minor axis, nuclei major axis angle degree, cell area, cell form factor, nuclei/cell area, cell diameter, cell perimeter, cell major axis, and cell minor axis between the two cell lines. Statistical analyses: n = 3, error bars = ± SEM, Student’s t-test was used to calculate p values using Microsoft Excel (ns = not significant).
Figure 4—figure supplement 2
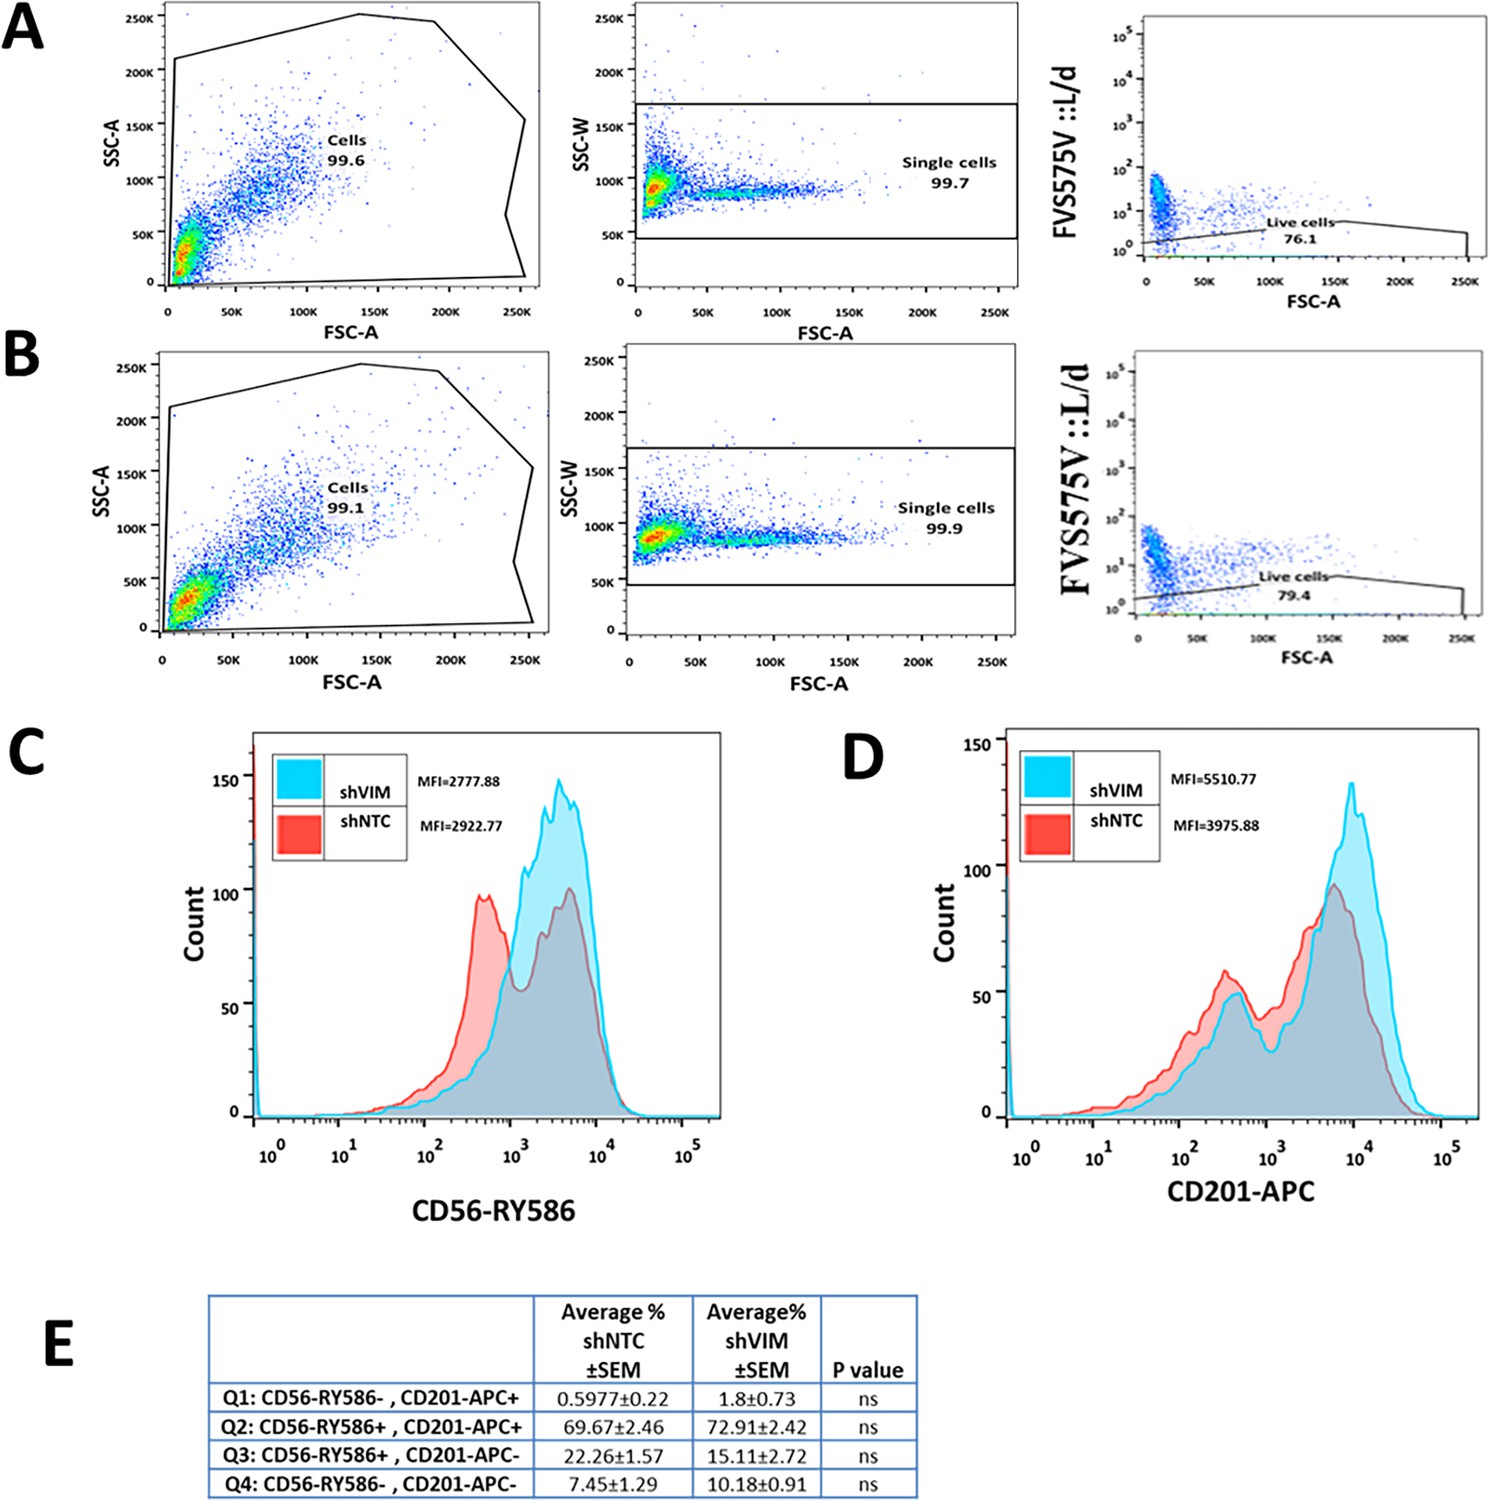
Flow cytometry analyses of C328S_shVIM and shNTC cells.
(A) Representative gating strategies for flow cytometry analysis of breast cancer stem cell markers CD56/NCAM1 and CD201/PROCR in C328SVIM_shNTC. Cells were stained for surface antigens with RY586-conjugated antibody specific for CD56/NCAM1, APC-conjugated antibody specific for CD201/PROCR and Fixable Viability Stain FVS575V for alive/dead cells. Gates were applied for cells (SSC-A:FSC-A), single cells (SSC-W:FSC-A), and live cells (FVS575V::L/d:FSC-A) as shown. (B) Representative gating strategies for flow cytometry analysis of breast cancer stem cell markers CD56/NCAM1 and CD201/PROCR in C328SVIM_shVIM. Cells were stained for surface antigens with RY586-conjugated antibody specific for CD56/NCAM1, APC-conjugated antibody specific for CD201/PROCR and Viability Stain FVS575V for live/dead cells. Gates were applied for cells (SSC-A:FSC-A), single cells (SSC-W:FSC-A), and live cells (FVS575V::L/d:FSC-A) as shown. (C) Representative histogram showing the MFI of CD56-RY586 in C328S_shVIM and shNTC cells by flow cytometry. shNTC cells are represented by red colour and shVIM by blue. (D) Representative histogram showing the MFI of CD201-APC in C328S_shVIM and shNTC cells by flow cytometry. shNTC cells are represented by red colour and shVIM by blue. (E) Flow cytometry overlay dot plot of CD56-RY586 vs CD201-APC (presented in Figure 4) after gating on single and live cells for immunophenotype in tabulated form. Statistical analyses: n = 3, error bars = ± SEM, ns = not significant.
Figure 4—figure supplement 3
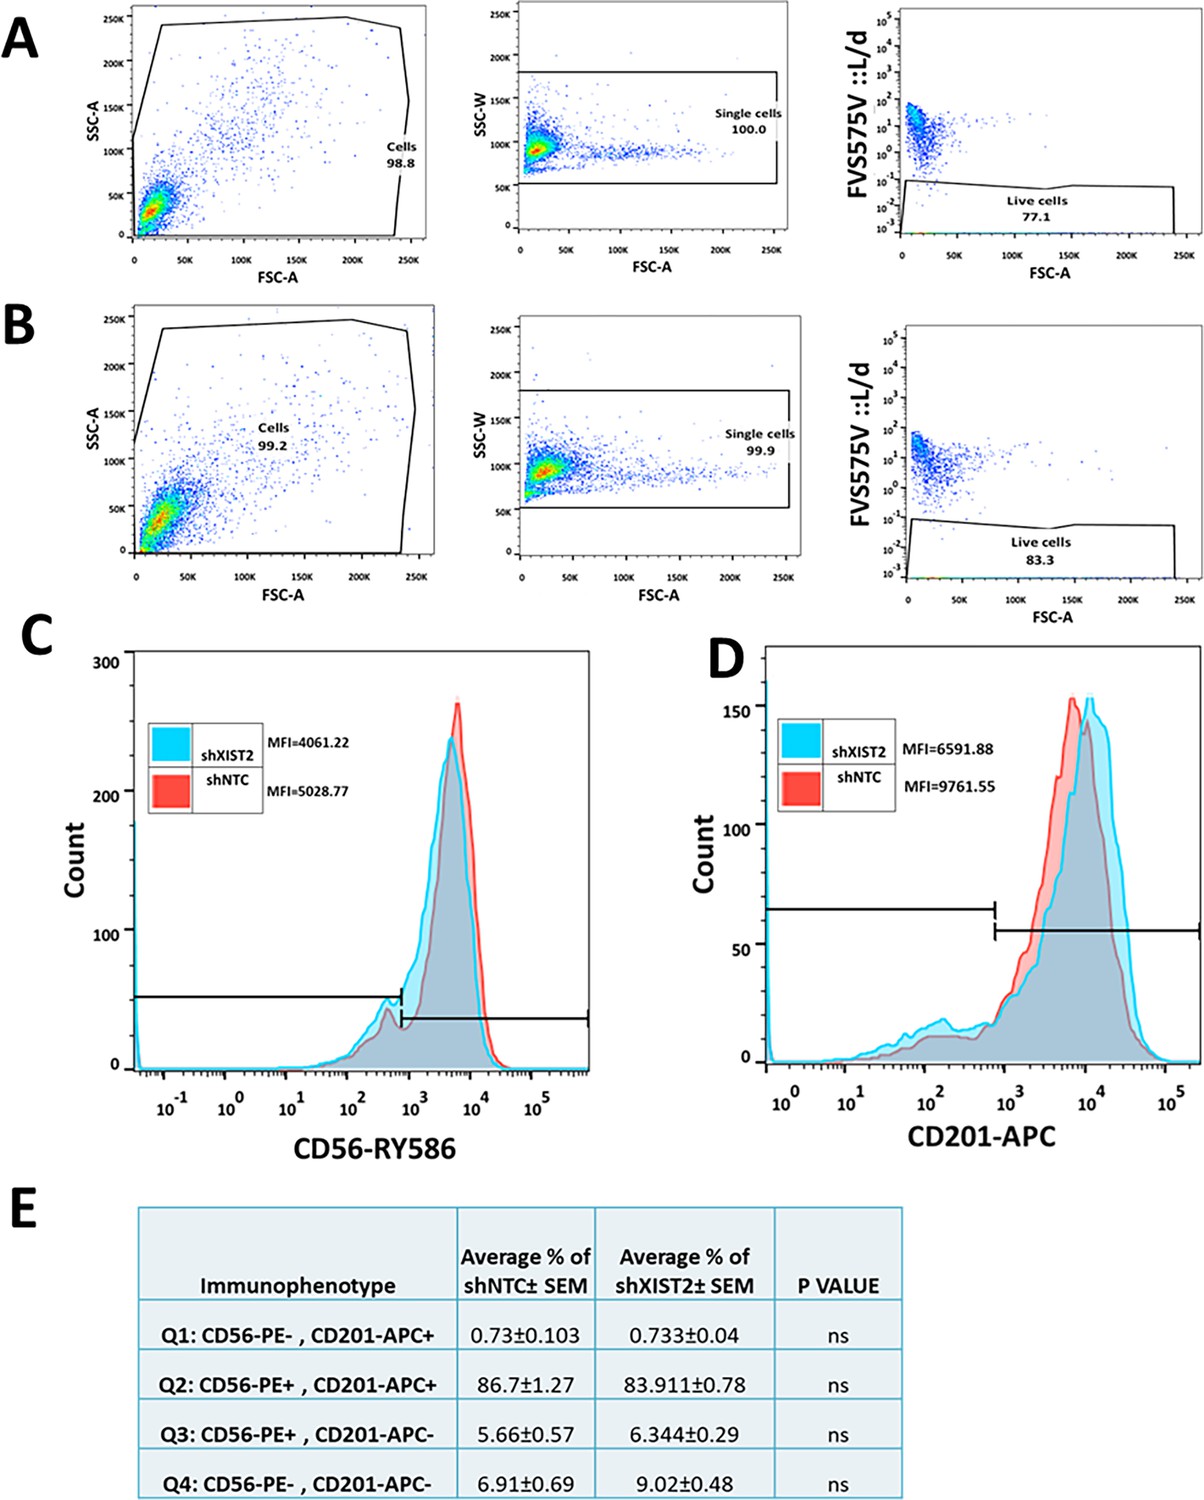
Flow cytometry analyses of C328S_shXIST2 and shNTC cells.
(A) Representative gating strategies for flow cytometry analysis of breast cancer stem cell markers CD56/NCAM1 and CD201/PROCR in C328SVIM_shNTC. Cells were stained for surface antigens with RY586-conjugated antibody specific for CD56/NCAM1, APC-conjugated antibody specific for CD201/PROCR and FVS575V for live/dead cells. Gates were applied for cells (SSC-A:FSC-A), single cells (SSC-W:FSC-A), and live cells (FVS575V::L/d:FSC-A) as shown. (B) Representative gating strategies for flow cytometry analysis of breast cancer stem cell markers CD56/NCAM1 and CD201/PROCR in C328SVIM_shXIST2. Cells were stained for surface antigens with RY586-conjugated antibody specific for CD56/NCAM1, APC-conjugated antibody specific for CD201/PROCR and FVS575V for live/dead cells. Gates were applied for cells (SSC-A:FSC-A), single cells (SSC-W:FSC-A), and live cells (FVS575V::L/d:FSC-A) as shown. (C) Representative histogram showing the MFI of CD56-RY586 in C328S_shXIST2 and shNTC cells by flow cytometry. shNTC cells are represented by red colour and shXIST2 by blue. (D) Representative histogram showing the MFI of CD201-APC in C328S_shXIST2 and shNTC cells by flow cytometry. shNTC cells are represented by red colour and shXIST2 by blue. (E) Flow cytometry overlay dot plot of CD56-RY586 vs CD201-APC (presented in Figure 4) after gating on single and live cells for immunophenotype in tabulated form. Statistical analyses: n = 3, error bars = ± SEM, ns = not significant.
Figure 4—figure supplement 4
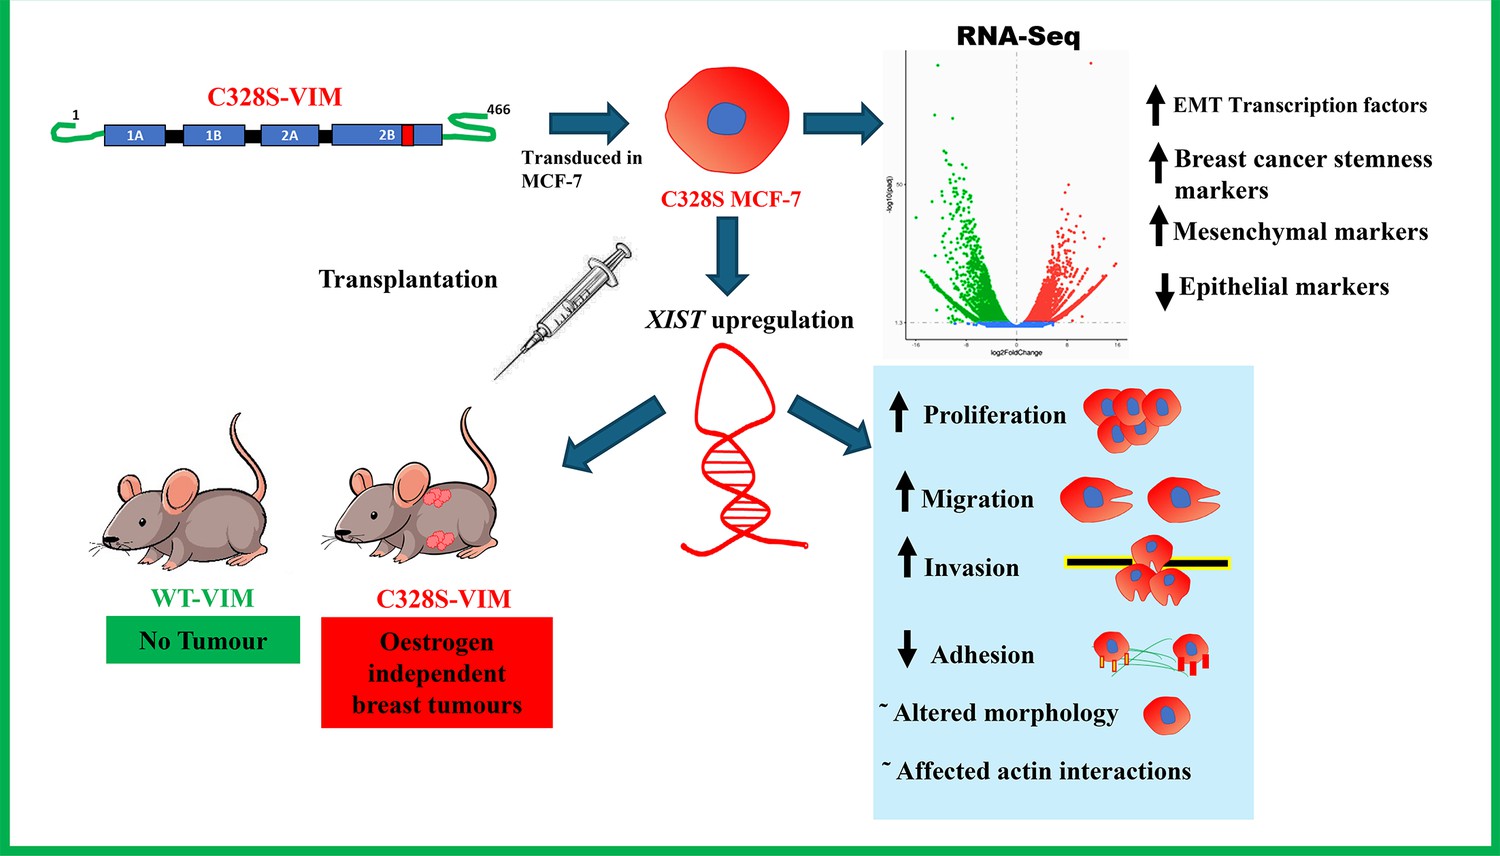
Significant impact of the C328S mutant vimentin on MCF-7 cells, leading to profound changes in their behaviour.
The mutant vimentin induces EMT-like traits, including increased proliferation, migration, and invasion while decreasing adhesion compared to the wild-type cells. Transcriptomic analysis confirms the upregulation of mesenchymal, EMT and breast cancer stemness markers alongside a decline in epithelial markers, pushing MCF-7 cells towards a triple-negative breast cancer phenotype (loss of ESR1, PGR, and HER2). Additionally, the expression of long non-coding RNA, XIST, is notably increased in mutant vimentin-expressing cells. In vivo experiments further reveal that C328S-VIM induces tumour growth in nude mice by promoting cancer stemness independently of oestrogen signalling.
Tables
Table 1
Summary of cell lines used in this study.
| Name of cell line | Insert | Drug selection | Retrovirus vector | Parent cell line |
|---|---|---|---|---|
| MCF-7CV | None; vector | Hygromycin | pLPChygro | MCF-7 |
| MCF-7WT | WT-VIM | Hygromycin | pLPChygro-VIM | MCF-7 |
| MCF-7C328S | C328S-VIM | Hygromycin | pLPChygro-C328S-VIM | MCF-7 |
| MCF-7Y117L | Y117L-VIM | Hygromycin | pLPChygro-Y117L-VIM | MCF-7 |
| MCF-7DMT (double mutant) | Y117L,C328S-VIM | Hygromycin | pLPChygro-DMT-VIM | MCF-7 |
| MCF-7C328S_shNTC | Non-target control oligos | Puromycin | pSiren-Retro-Q vector | MCF-7C328S |
| MCF-7C328S_shVIM | Vimentin specific short hairpin oligos | Puromycin | pSuper.retro.puro | MCF-7 C328S |
| MCF-7C328S_shNTC | Non-targeting control oligos | Puromycin | pSuper.retro.puro | MCF-7 C328S |
| MCF-7C328S_shXIST-1 | XIST specific short hairpin 1 | Puromycin | pSuper.retro.puro | MCF-7 C328S |
| MCF-7C328S_shXIST-2 | XIST specific short hairpin 2 | Puromycin | pSuper.retro.puro | MCF-7 C328S |
| MCF-7C328S_shXIST-3 | XIST specific short hairpin 3 | Puromycin | pSuper.retro.puro | MCF-7 C328S |
| MCF-7C328S_shXIST-4 | XIST specific short hairpin 4 | Puromycin | pSuper.retro.puro | MCF-7 C328S |
| MCF-7WT+AcGFP-C328S-VIM | C328S-VIM | Puromycin | pLPCpuro-AcGFP-GS10 | MCF-7WT |
| MCF-7WT+C328S-VIM | C328S-VIM | Puromycin | pLPCpuro | MCF-7WT |
| HFF-AcGFP-C328S-VIM | C328S-VIM | Puromycin | pLPCpuro-AcGFP-GS10 | HFF-1 |
| HFF-C328S-VIM | C328S-VIM | Puromycin | pLPCpuro | HFF-1 |
| A431-C328S-VIM | C328S-VIM | Puromycin | pLPCpuro | A431 |
Additional files
-
Supplementary file 1
List of upregulated genes (cut off padj =0.00009).
- https://cdn.elifesciences.org/articles/104191/elife-104191-supp1-v1.docx
-
Supplementary file 2
List of downregulated genes (cut off padj =0.00009).
- https://cdn.elifesciences.org/articles/104191/elife-104191-supp2-v1.docx
-
Supplementary file 3
List of upregulated lnRNAs (cut off padj =0.00009).
- https://cdn.elifesciences.org/articles/104191/elife-104191-supp3-v1.docx
-
Supplementary file 4
List of downregulated lnRNAs (cut off padj =0.00009).
- https://cdn.elifesciences.org/articles/104191/elife-104191-supp4-v1.docx
-
Supplementary file 5
List of primers used for qPCR.
- https://cdn.elifesciences.org/articles/104191/elife-104191-supp5-v1.docx
-
Supplementary file 6
List of primary and secondary antibodies used in this research work.
- https://cdn.elifesciences.org/articles/104191/elife-104191-supp6-v1.docx
-
Supplementary file 7
List of primers used for making XIST shRNA constructs and site-directed mutagenesis at C328 and Y117.
- https://cdn.elifesciences.org/articles/104191/elife-104191-supp7-v1.docx
-
MDAR checklist
- https://cdn.elifesciences.org/articles/104191/elife-104191-mdarchecklist1-v1.docx
Download links
A two-part list of links to download the article, or parts of the article, in various formats.
Downloads (link to download the article as PDF)
Open citations (links to open the citations from this article in various online reference manager services)
Cite this article (links to download the citations from this article in formats compatible with various reference manager tools)
A single cysteine residue in vimentin regulates long non-coding RNA XIST to suppress epithelial–mesenchymal transition and stemness in breast cancer
eLife 14:RP104191.
https://doi.org/10.7554/eLife.104191.3


