Decoding protein phosphorylation during oocyte meiotic divisions using phosphoproteomics
- Systems Biology Department, Harvard Medical School, United States
- Sorbonne Université, CNRS, Laboratoire de Biologie du Développement - Institut de Biologie Paris Seine, France
Figures
Figure 1
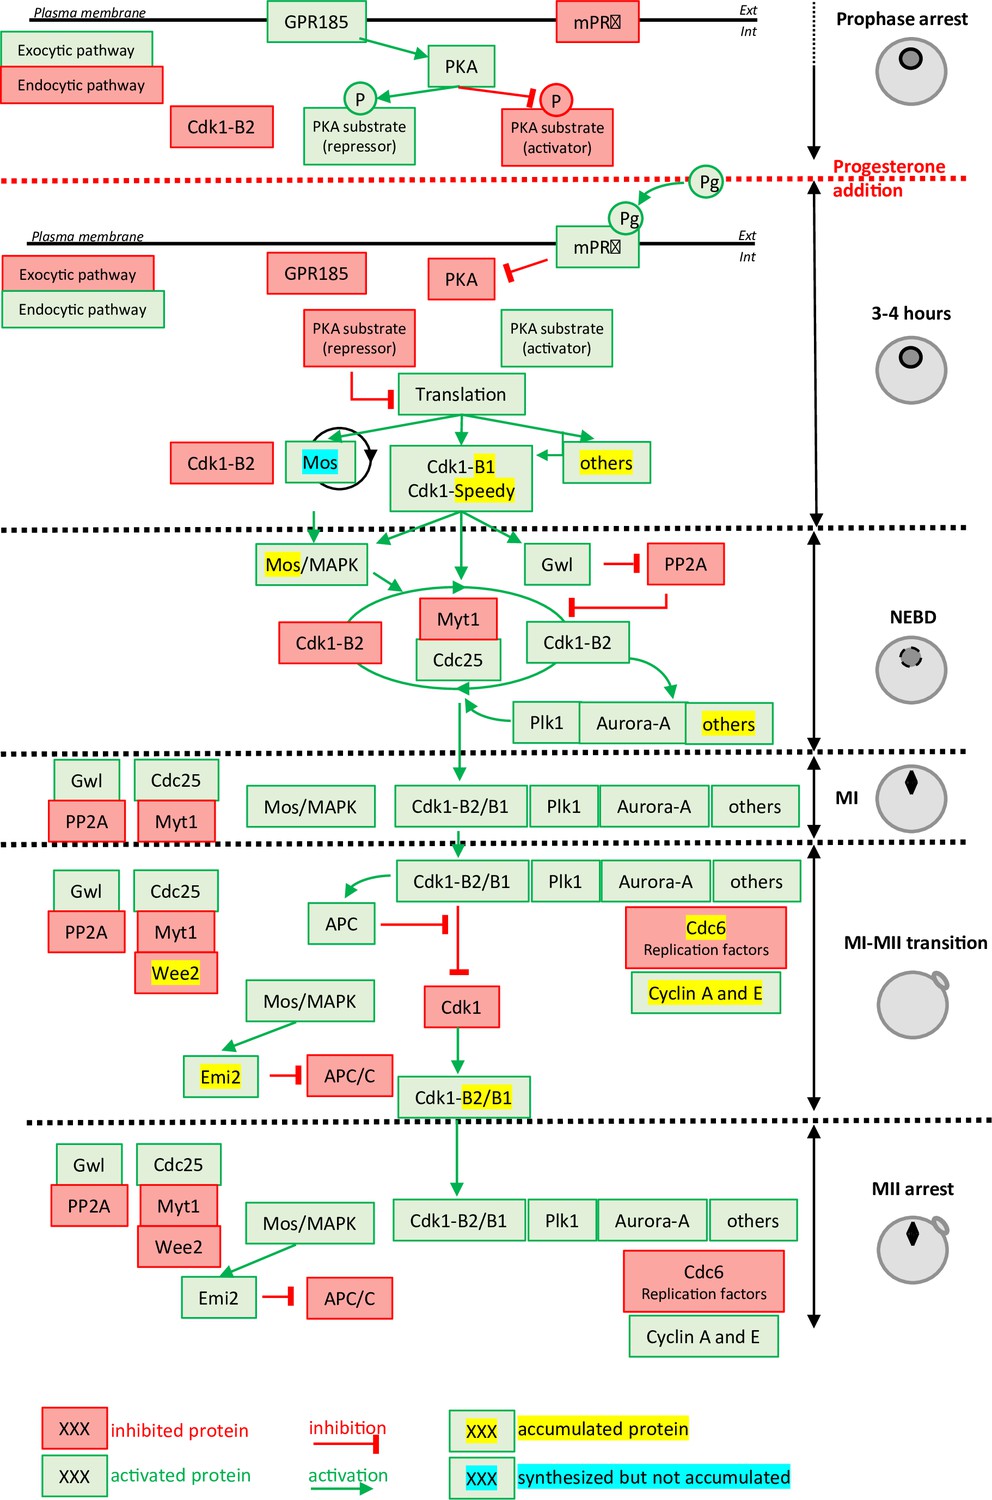
Molecular events coordinating Xenopus laevis oocyte meiotic divisions.
From top to bottom: The prophase arrest is maintained by high PKA activity due to the constitutively expressed GPR185 receptor. The exocytic pathway is active while the endocytic pathway is downregulated. Cdk1-Cyclin B2 complexes are present under an inactive state due to Cdk1 phosphorylation. Progesterone activates the mPRβ receptor, GPR185 is inactivated, the exocytosis and endocytosis pathways are inverted. PKA is inactivated and promotes translation and/or accumulation of new proteins, among them Mos (that does not accumulate due to its instability) and Cyclin B1 (due to its stabilization). New Cyclin B1 proteins associate with Cdk1 and form a starter amount of Cdk1 activity. This Cdk1 starter stabilizes Mos and promotes Cdk1-Cyclin B2 activation through the regulation of Myt1, Cdc25, Gwl, and PP2A. The autoamplification loop is launched, whereby more Cdk1 is activated, more it activates kinases as Mos-MAPK, Aurora-A, and Plk1, all of them contributing with Cdk1 to regulate Myt1 and Cdc25, hence accelerating Cdk1 activation. Phosphorylated substrates trigger nuclear envelope breakdown (NEBD) and the metaphase I (MI) spindle assembly as well as protein translation. Anaphase-promoting complex (APC) is activated under the control of Cdk1 and leads to Cyclin B degradation. The Cdk1 activity decreases and allows anaphase I and expulsion of the first polar body. Under the Mos/MAPK control, Emi2/Erp1 inactivates APC, halting Cyclin B degradation. The re-accumulation of Cyclin B increases Cdk1 activity that triggers the formation of the metaphase II (MII) spindle, avoiding the assembly of a nucleus and DNA replication. APC remains inhibited by Emi2/Erp1, what ensures the oocyte arrest in MII. Color code: red: inactivated proteins; green: activated proteins; red arrow: inhibition; green arrow: activation; yellow highlight: accumulated protein; blue highlight: protein synthesized but not accumulated.
Figure 2 with 4 supplements

Changes in the protein levels during meiotic divisions.
(A) The relative changes in the concentration of proteins whose accumulation/degradation has been reported to correlate with the critical stages of Xenopus meiotic divisions have been plotted. (B) Changes of protein stoichiometry during meiotic maturation. The log2 fold changes between the concentration of each protein in prophase (PRO)-arrested oocytes and metaphase II (MII)-arrested oocytes were plotted against the average concentration during meiotic divisions. The red line marks the 1.5-fold change used as a threshold to identify accumulating proteins. The blue line marks the 0.75-fold change used as a threshold to distinguish proteins that are degraded during meiosis. Proteins, whose changes in homeostasis during meiotic divisions are documented in the literature, are marked with the following color code: red, for proteins accumulating; black, for proteins which are expressed at a stable level; and blue, for proteins that are degraded. (C–D) Gene ontology analysis of the biological processes enriched among the proteins found to accumulate (in red, panel C) or degrade (in blue, panel D) during meiosis. The statistical significance of the enrichment is expressed as false discovery rate (FDR). A representative subset of the proteins belonging to each group is displayed.
Figure 2—figure supplement 1
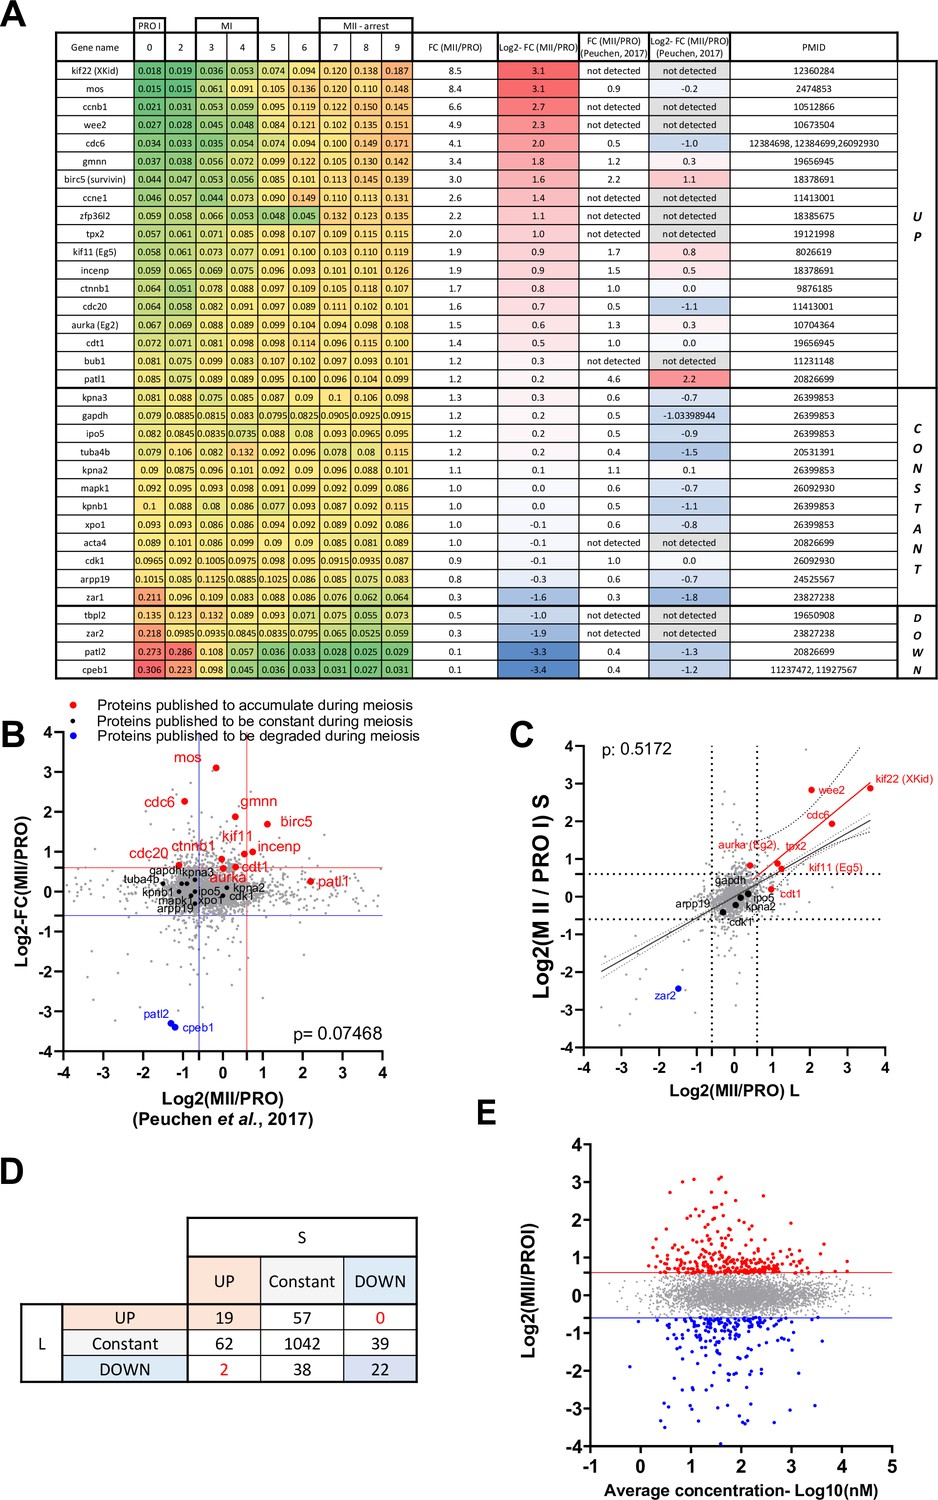
Validation of the proteomic dataset.
(A) Table summarizing proteins whose changes in protein level have been documented using Western blot. The PMID of the original publication displaying the Western blot is reported. The changes in abundance detected in our dataset are color-coded with a scale from green to red. Log2 fold changes between prophase and metaphase II from our dataset are color-coded with a scale from red to blue and compared to another previously published dataset (Peuchen et al., 2017). (B) Proteome-wide comparison of our dataset with (Peuchen et al., 2017). Proteins whose abundance was previously published are color-coded in red for the ones that accumulate, black for the constant, and blue for the ones that are degraded. (C) Changes in protein abundance between prophase and metaphase II were calculated for each protein where we could distinguish the .S and .L isoforms and plotted. The Pearson correlation between the isoforms was calculated with Prism. (D) Table summarizing the comparison between .S and .L isoforms presented in panel C. (E) Correlation plot between the changes in protein abundance occurring during the prophase to metaphase II transition and the average concentration of the proteins during meiotic divisions.
Figure 2—figure supplement 2
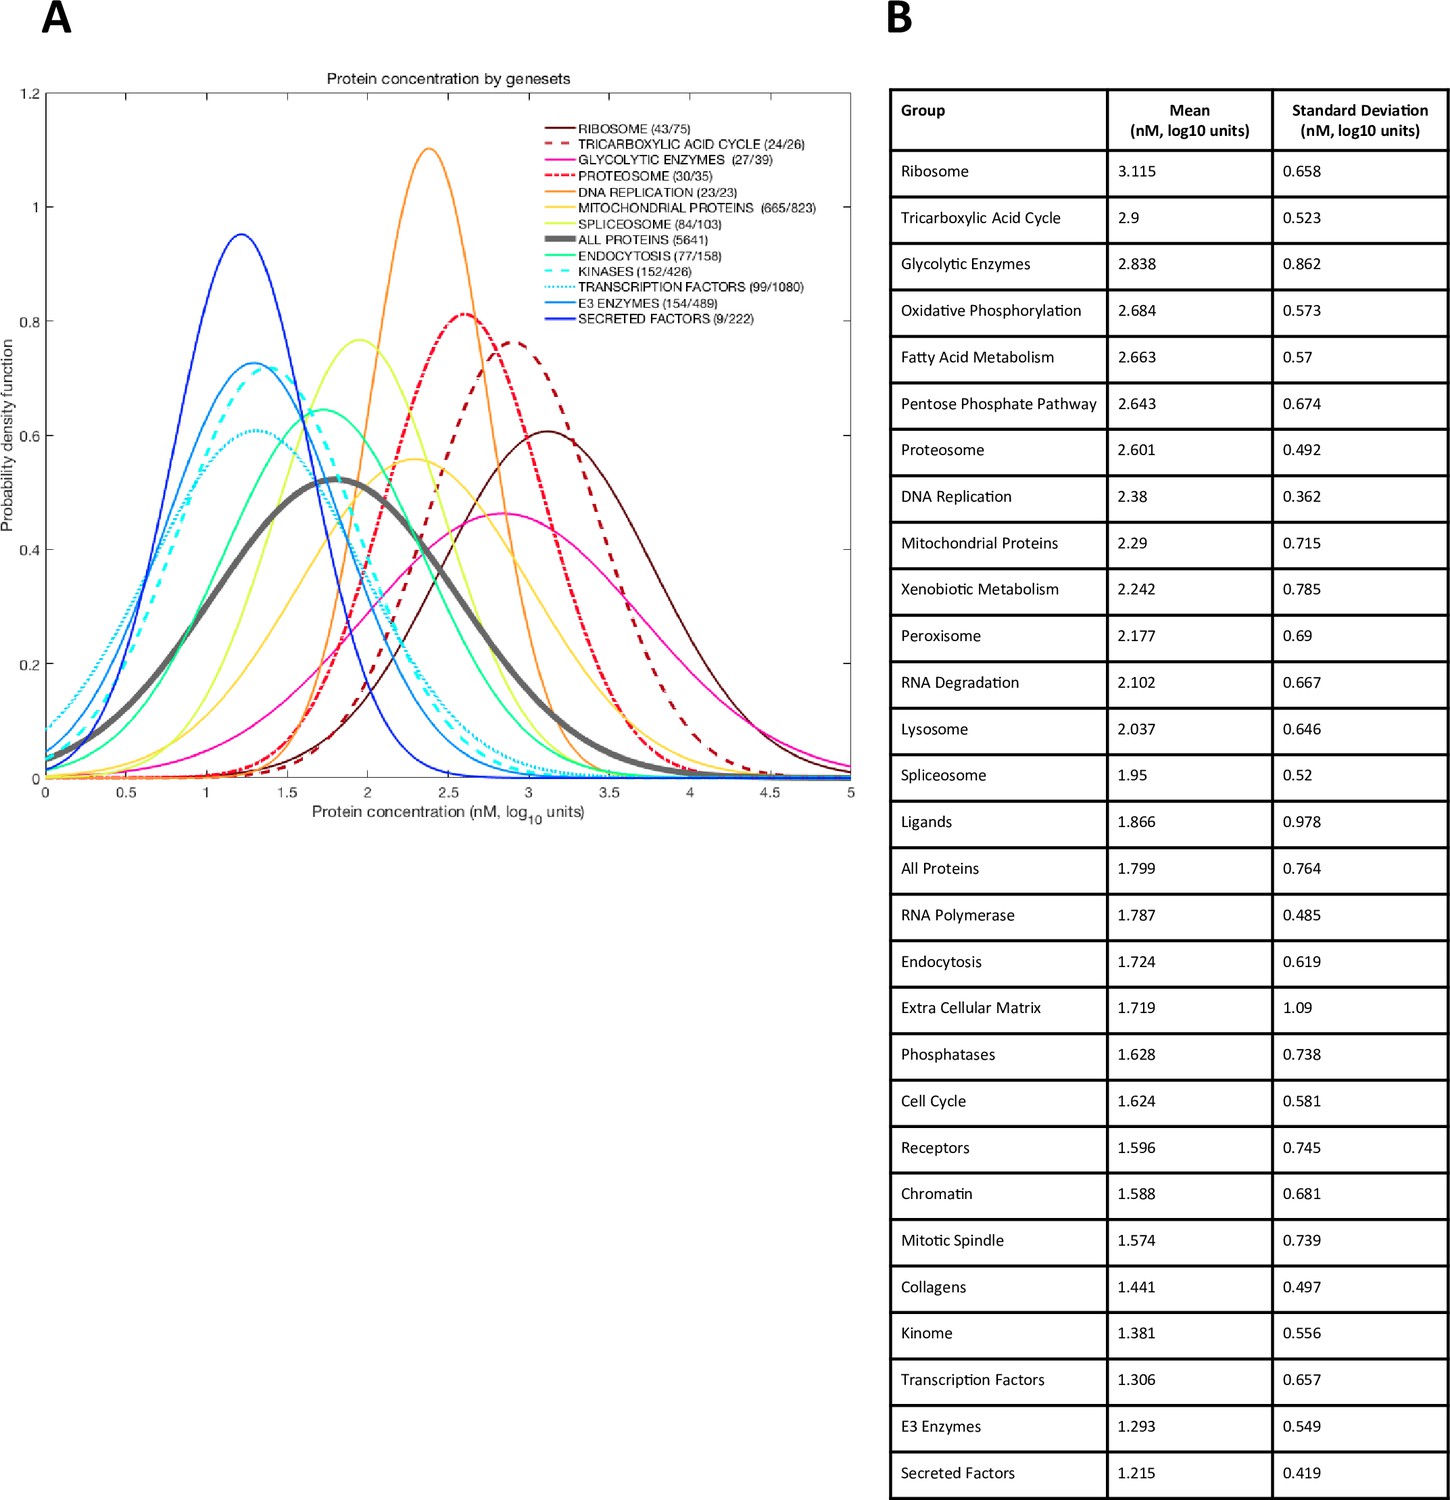
Distribution of absolute protein abundance in the oocyte by functional set.
(A) Each set is approximated by a Gaussian using respective mean and standard deviation. The number of detected proteins and total proteins in each category is marked in the legend. (B) Parameters of Gaussian distributions (mean and standard deviation) for different groups.
Figure 2—figure supplement 3
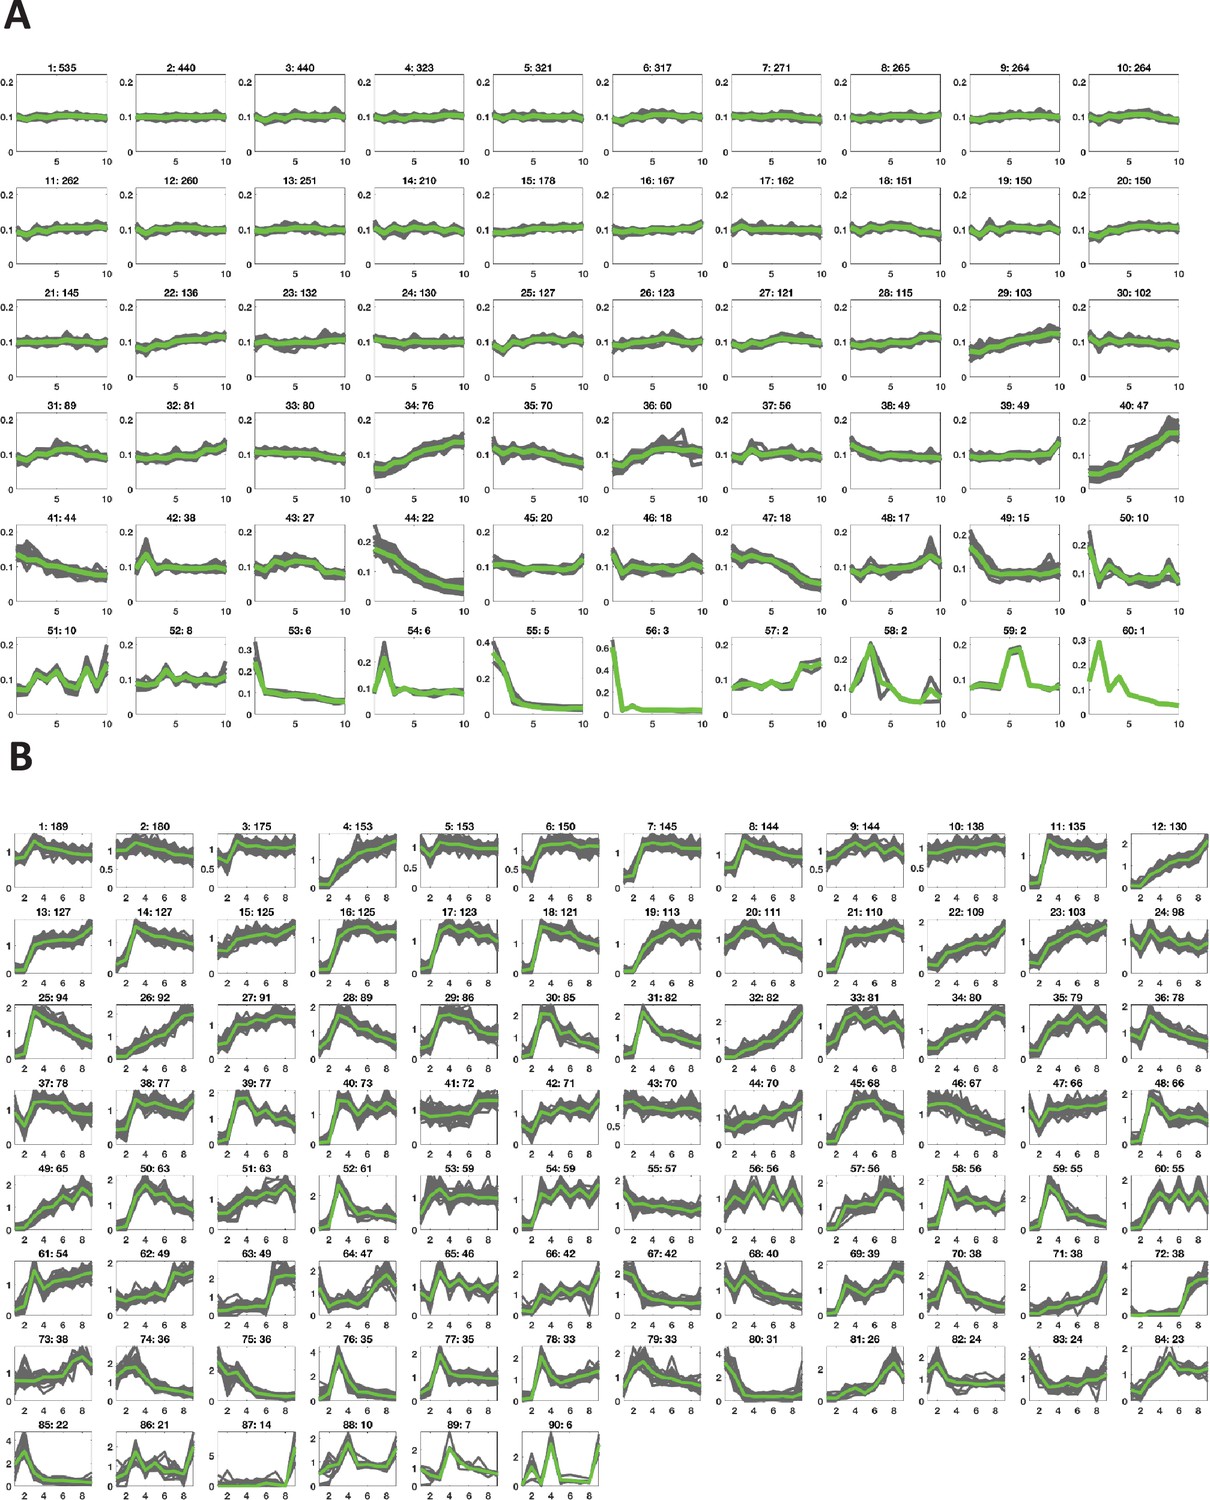
Clusters of dynamics of oocyte protein expression and phosphorylation in response to progesterone.
Key clusters of the protein expression (A) and phospho-site dynamics (B) after progesterone stimulation of an oocyte as obtained by K-means clustering based on cosine similarity distance. The clusters are arranged in the order of cardinality, starting with the most populated ones. Each subplot is labeled by the cluster ID and the number of proteins in that cluster.
Figure 2—figure supplement 4
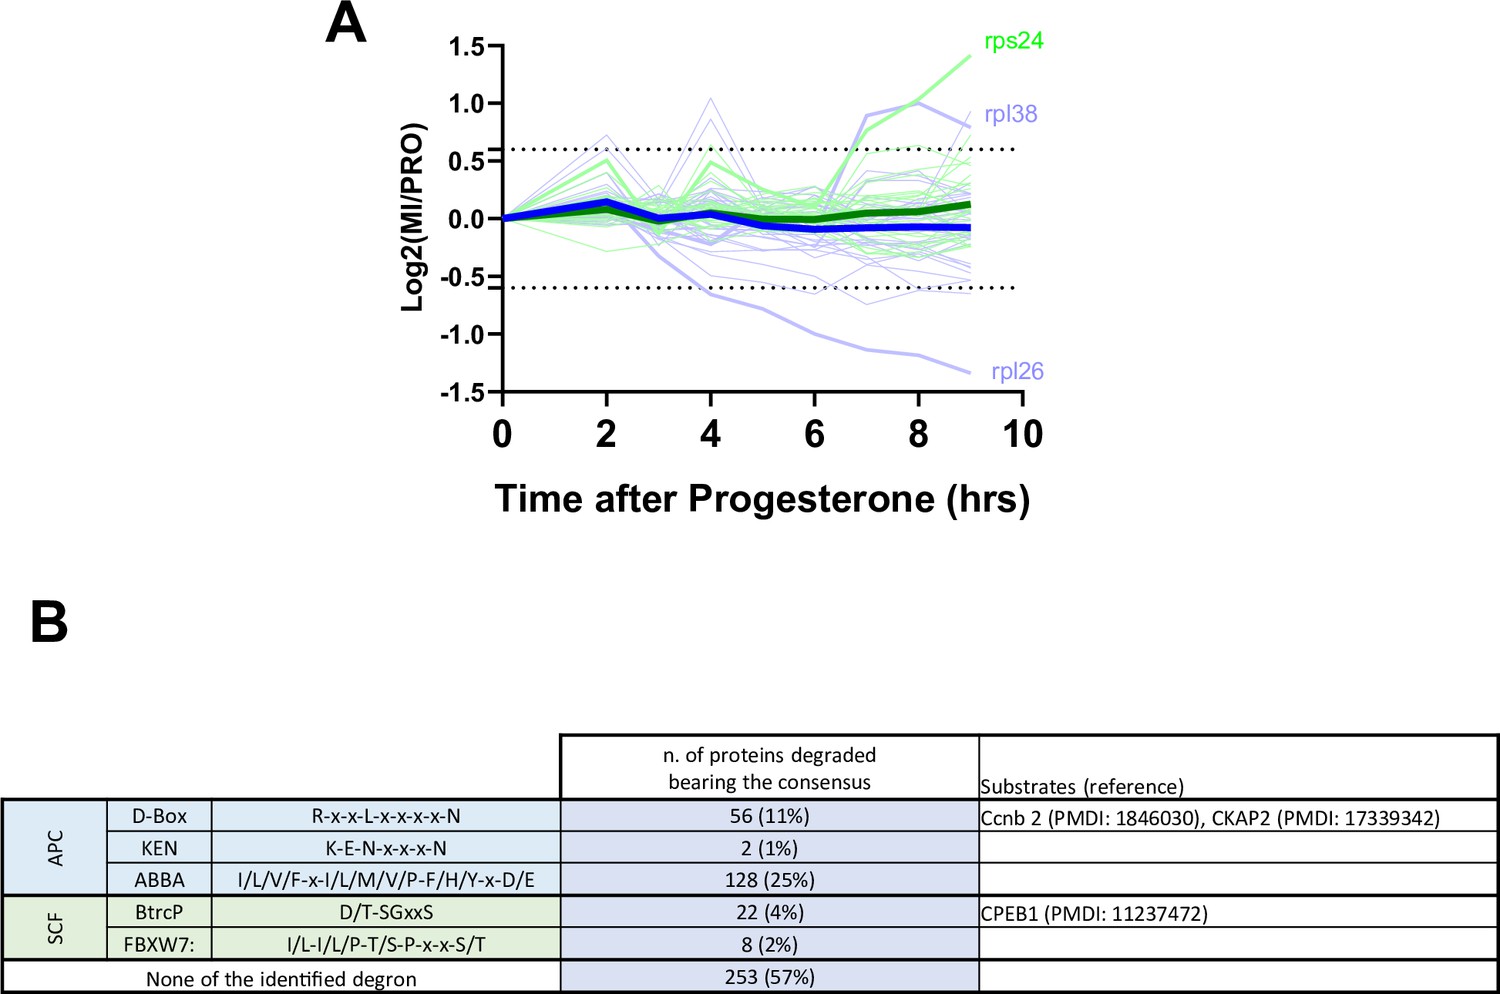
Protein degradation during meiotic maturation: ribosomal proteins, E3 ligases targets.
(A) Changes in protein abundance of ribosomal proteins between prophase (PRO) and metaphase II (MII) are plotted. Dashed lines represent the threshold used for defining the differentially expressed proteins. (B) Table summarizing the different degron consensus motifs identified and the number of proteins in our dataset bearing these motifs. Examples of proteins bearing different degrons are listed along with supporting literature.
Figure 3 with 1 supplement

Changes in protein phosphorylation during meiotic divisions.
(A) Relative phosphopeptide signals were normalized for the changes in the total level of the proteins. The changes in the phosphopeptides were measured between the three biological stages of meiotic divisions (PRO = 0hr, NEBD/MI = average of 3 and 4hr, and MII-arrest=average of 7–9hr). Class I (n=136–2%, in blue) includes proteins bearing a phosphosite whose occupancy decreases during meiosis resumption (Log2FC(MI/PRO)<-1). Class II (n=2167–39%, in green) contains proteins that are highly phosphorylated from MI (Log2FC(MI/PRO)>1) to MII (–1<Log2FC(MII/MI)<1). Class III (n=267–5%, in red) consists of proteins whose phosphorylation is specific to MI (Log2FC(MI/PRO)>1, Log2FC(MII/MI)<-1). Class IV (n=507–9%, yellow) is composed of proteins whose phosphorylation increases from MI (Log2FC(MI/PRO)>1) to MII, peaking in MII (Log2FC(MII/MI)>1). Class V (n=301–5%, orange) comprises proteins whose phosphorylation does not vary in MI (–1<Log2FC(MI/PRO)<1) but are phosphorylated only in MII (Log2FC(MII/MI)>1). The average signal of each Class was plotted with a thick and dark line. (B) Table summarizing the proteins bearing phosphosites belonging to Class I.
Figure 3—figure supplement 1
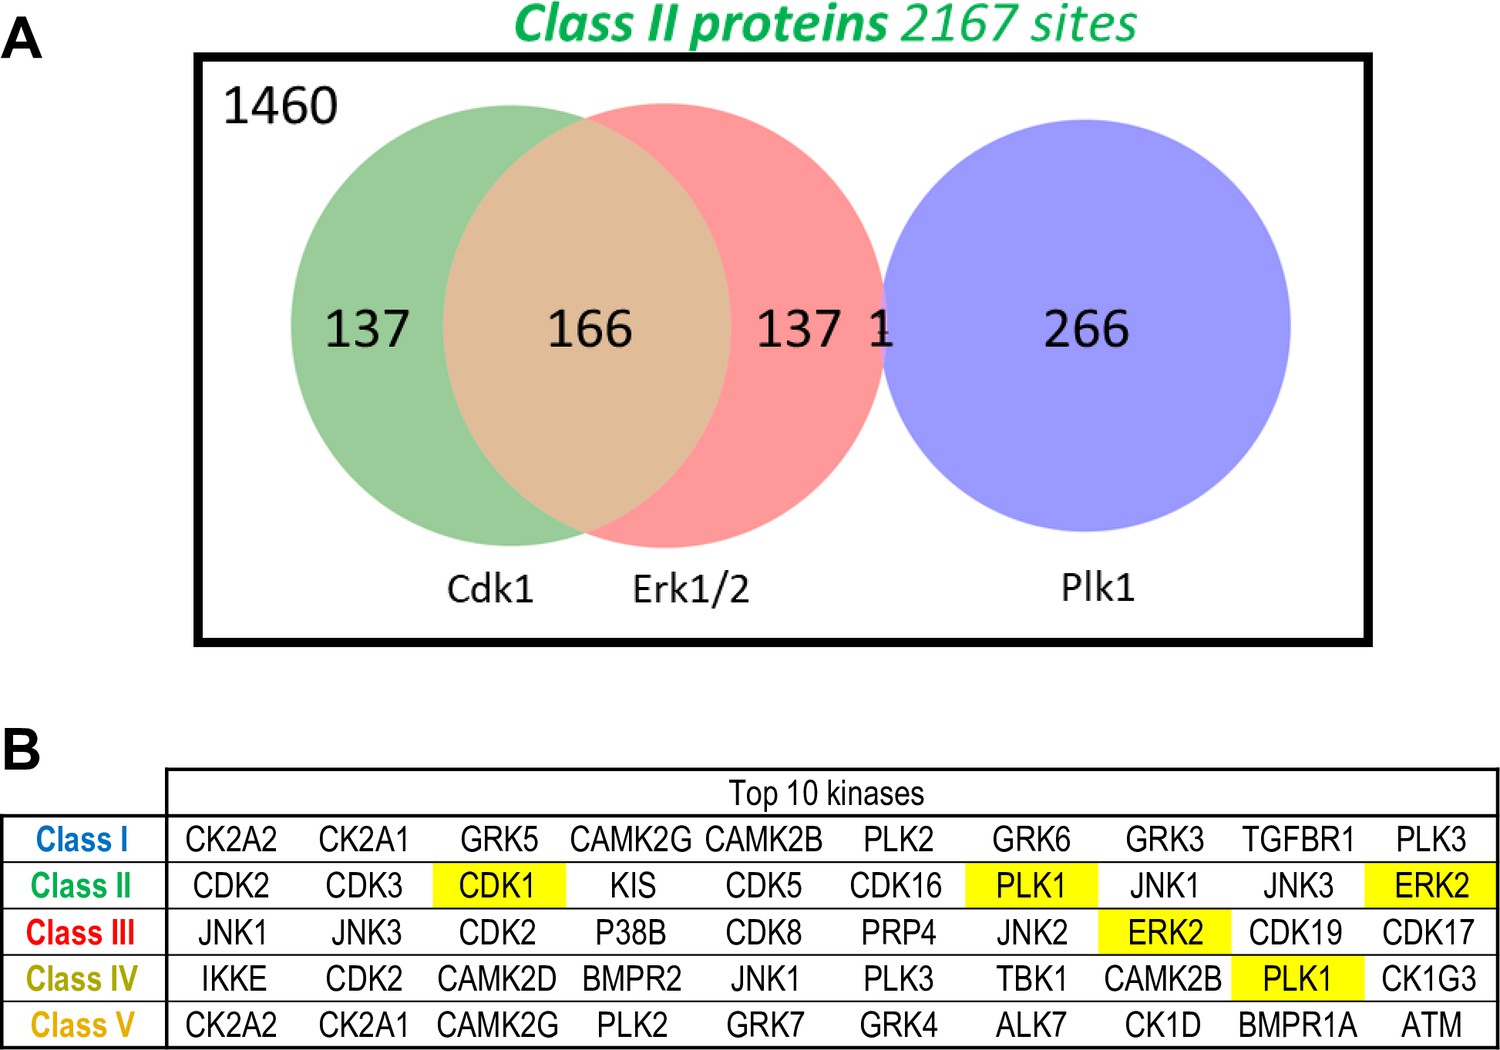
Predicted kinases from the phosphorylation sites.
(A) Venn diagram showing the number of Class II phosphosites predicted to be targeted by Cdk1, Erk1/2, and Plk1. Predictions were made using the kinase scoring tool available at https://kinase-library.phosphosite.org/kinase-library/score-site, applying a 90th percentile threshold. (B) Top 10 kinases whose predicted phosphorylation sites are most enriched in each class (I to V), using the kinase scoring tool available at https://kinase-library.phosphosite.org/kinase-library/score-site.
Figure 4 with 1 supplement

RNA-binding proteins and translation initiation factors are dynamically phosphorylated during meiotic divisions.
(A) Gene ontology enrichment analysis of the biological process ‘translation’ (GO:0006412) among the phosphopeptides found in each class defined in Figure 3A. (B–C) Graphical representation of the phosphorylation dynamics of RNA-binding proteins (RBPs) (B) and translation initiation factors (C) during meiotic divisions. Proteins are color-coded to highlight the changes in protein abundance during meiotic divisions: unchanged = white, decreased = blue, increased = light orange. The phosphorylated sites are color-coded: unchanged, gray; Class I, blue; Class II, green; Class III, red; Class IV, yellow; Class V, orange. The numbering is referred to the iso-allele which has a higher number of phosphorylation sites detected.
Figure 4—figure supplement 1
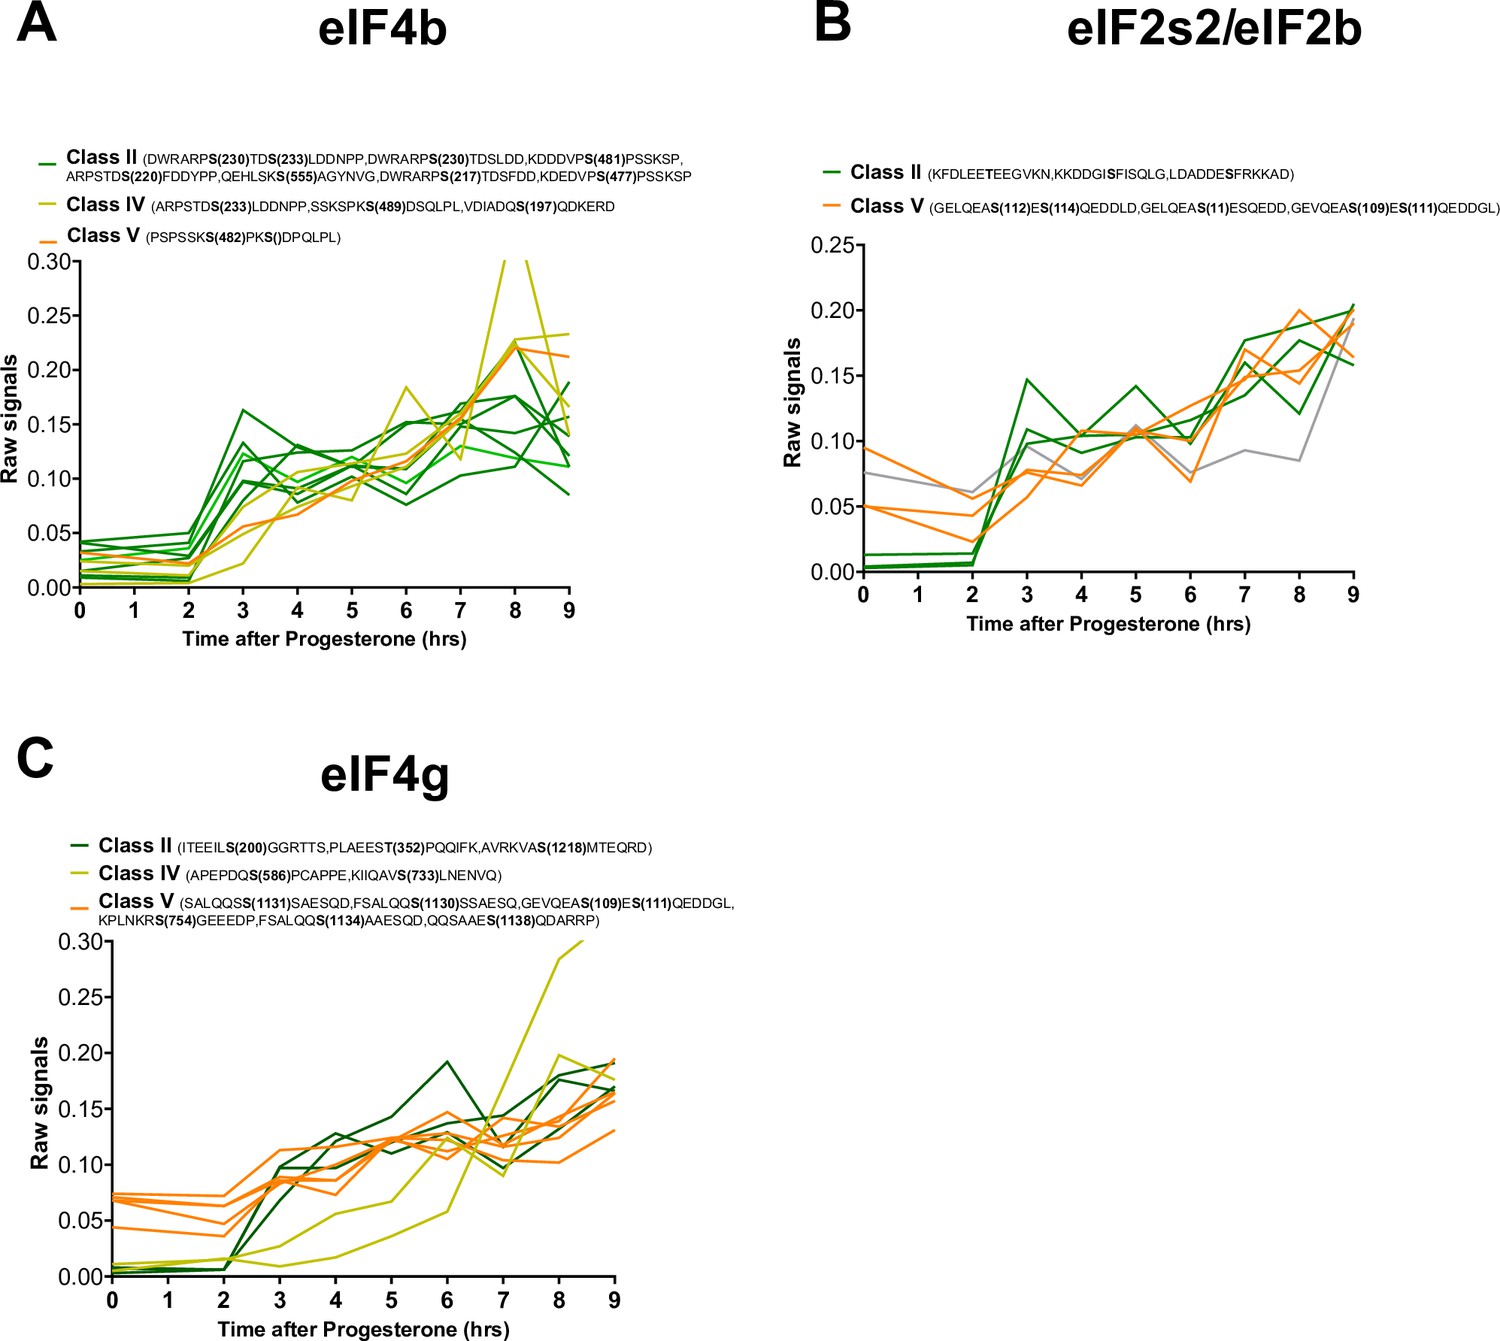
Phosphorylation patterns of components of the initiation translation machinery during meiotic divisions.
(A–C) Levels of phosphorylation sites of eIF4b (A), eIF2s2/eIF2b, (B), and eIF4g (C) during meiotic divisions are plotted. The phosphorylation curves are color-coded: Class II, green; Class IV, yellow; Class V, orange.
Figure 5

E2 and E3 ubiquitin ligases are highly regulated by phosphorylation.
(A) Gene ontology enrichment analysis of the biological process ‘protein polyubiquitination’ (GO:0000209) among the phosphopeptides found in each class defined in Figure 3A. (B–C) Graphical representation of the phosphorylation dynamics of the components of two E3 ubiquitin ligases, the anaphase promoting complex (APC) (B) and the Skp, Cullin, F-box containing complex (SCF) (C) during meiotic divisions. Proteins are color-coded to highlight changes in protein abundance during meiotic divisions: unchanged = white, decreased = blue, increased = light orange. The phosphorylated sites are color-coded: unchanged, gray; Class I, blue; Class II, green; Class III, red; Class IV, yellow; Class V, orange. The numbering is referred to the iso-allele which has a higher number of phosphorylation sites detected.
Figure 6 with 2 supplements
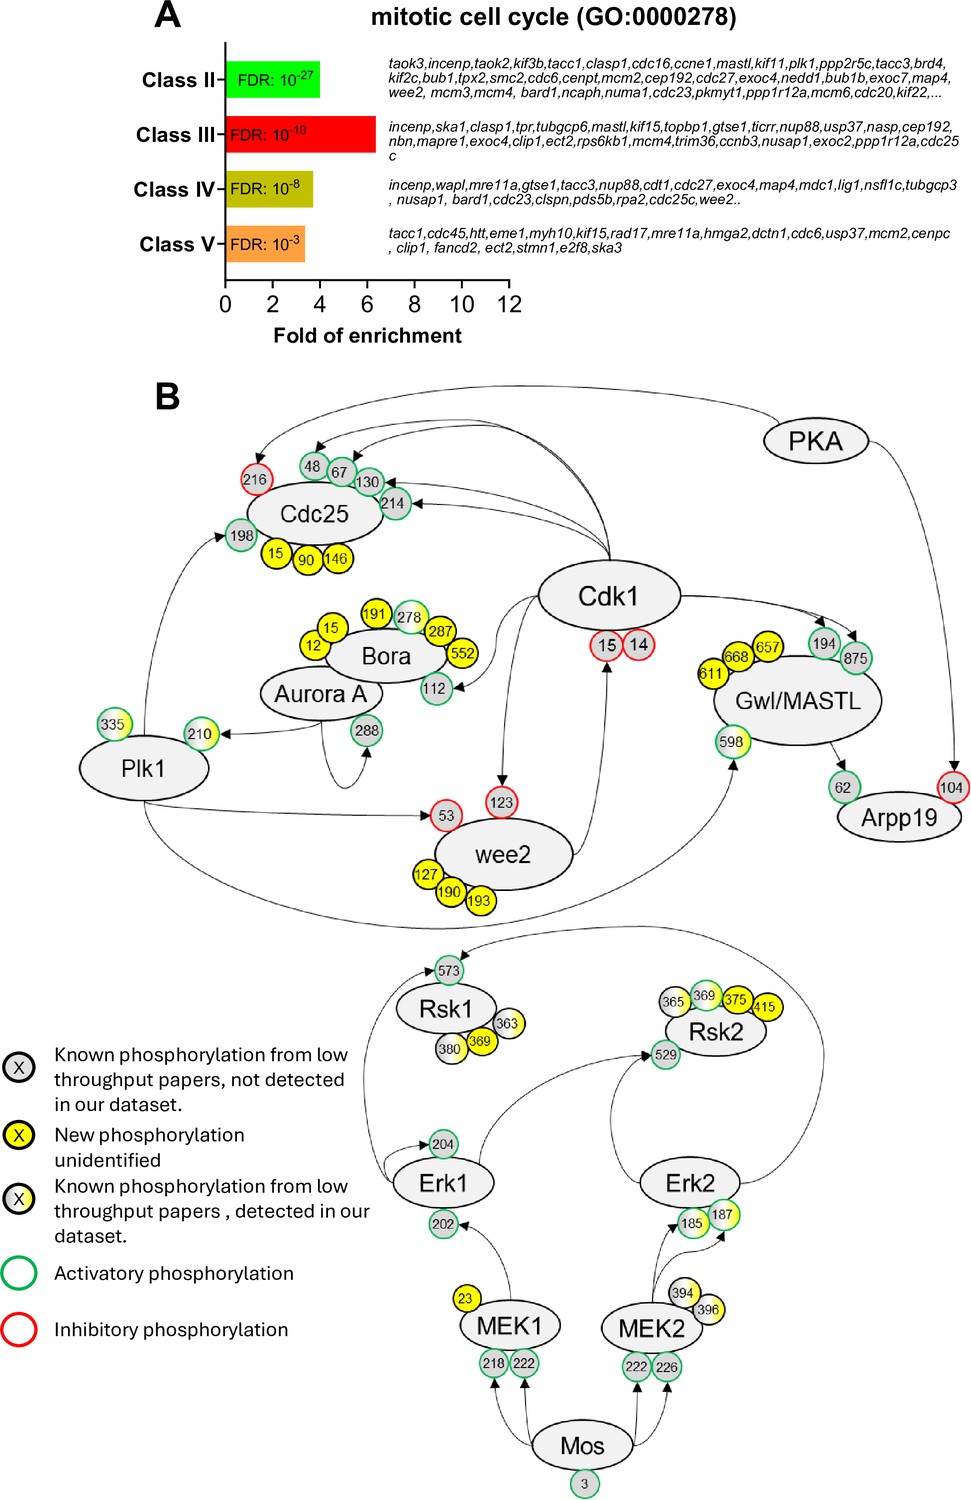
The network of phosphorylations regulating Cdk1 and the Mos/MAPK pathway.
(A) Gene ontology enrichment analysis of the biological process ‘mitotic cell cycle’ (GO:0000278) among the phosphopeptides found in each class defined in Figure 3A. (B) Graphical representation of the network of phosphorylations of cell cycle regulators controlling Cdk1 activation (upper panel) and the Mos/MAPK pathway (lower panel). The human nomenclature numbering has been used for the phospho-sites. The phosphosites are displayed by dots and color-coded: yellow background, new sites identified in this paper and never described elsewhere; gray background, phosphosites already documented in vertebrates by low throughput papers and not identified in this paper; gray-yellow background, phosphosites already documented in vertebrates by low throughput papers and also identified in this paper. The functional effect of the phosphorylation is indicated by the color of the dot contour line: green, activatory; red, inhibitory; black, unknown.
Figure 6—figure supplement 1
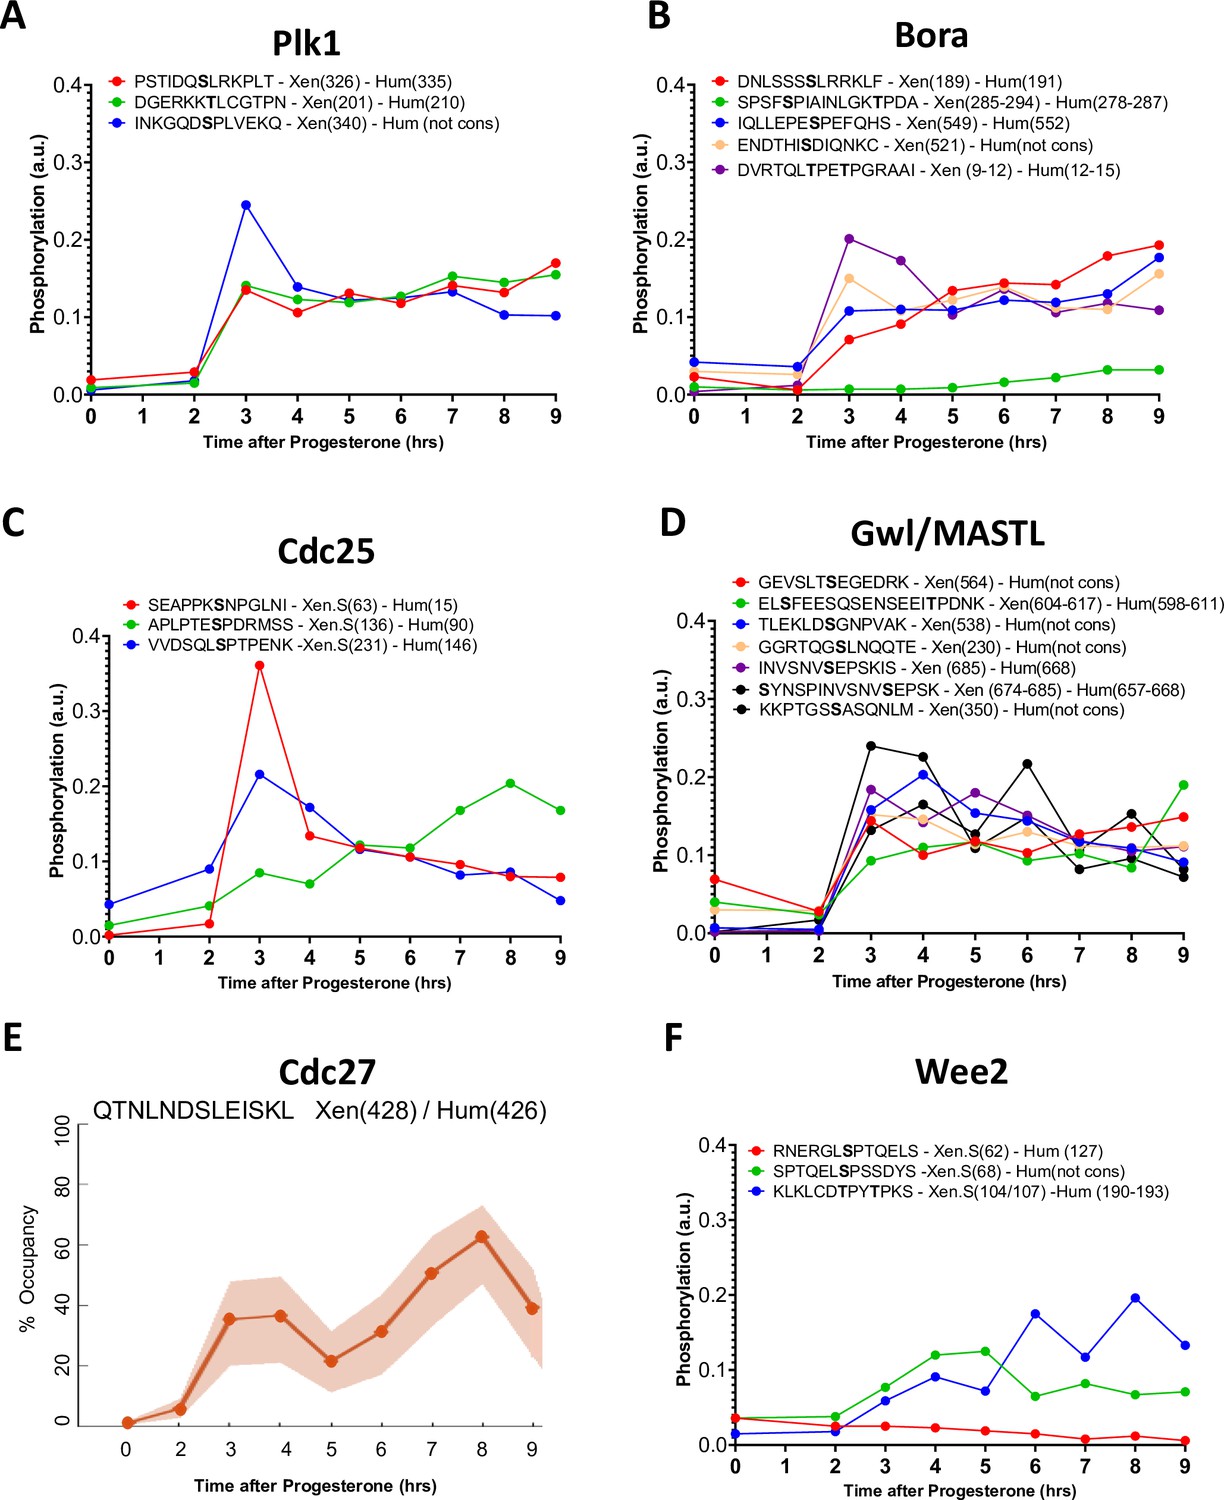
Phosphorylation patterns of Cdk1 regulators during meiotic divisions.
(A–D and F) Levels of phosphorylation sites of Plk1 (A), Bora (B), Cdc25 (C), Gwl/MASTL (D), and Wee2 (F) during meiotic divisions are plotted. The peptide sequences are reported with the phosphorylation sites marked in bold. The number of the residue phosphorylated is reported between breakers according to the Xenopus and human nomenclature. (E) The phosphorylation occupancy for S428 of Cdc27 is plotted with its confidence intervals.
Figure 6—figure supplement 2
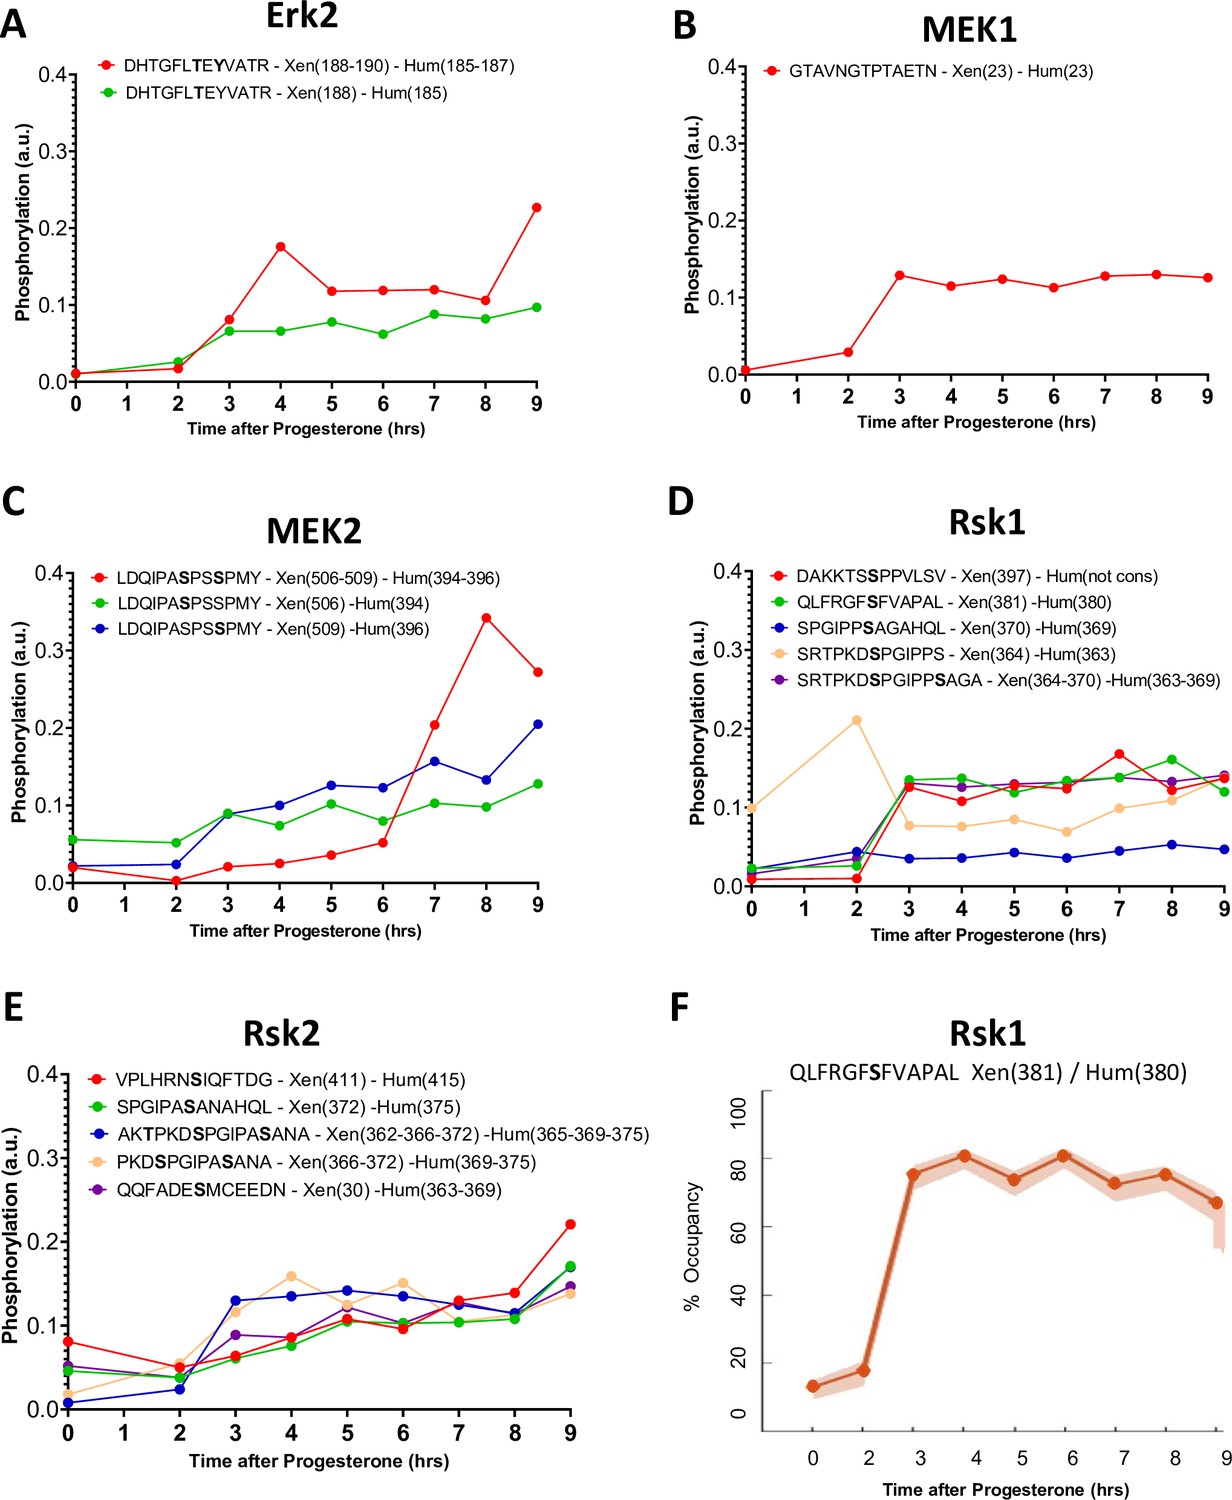
Phosphorylation patterns of the mos/MAPK pathway during meiotic divisions.
(A–E) Levels of phosphorylation sites of Erk1 (A), Bora (B), MEK1 (C), MEK2 (D), and Rsk2 (E) during meiotic divisions are plotted. The peptide sequences are reported with the phosphorylation sites marked in bold. The number of the residue phosphorylated is reported between breakers according to the Xenopus and human nomenclature. (F) The phosphorylation occupancy for S381 of Rsk1 is plotted with its confidence intervals.
Figure 7
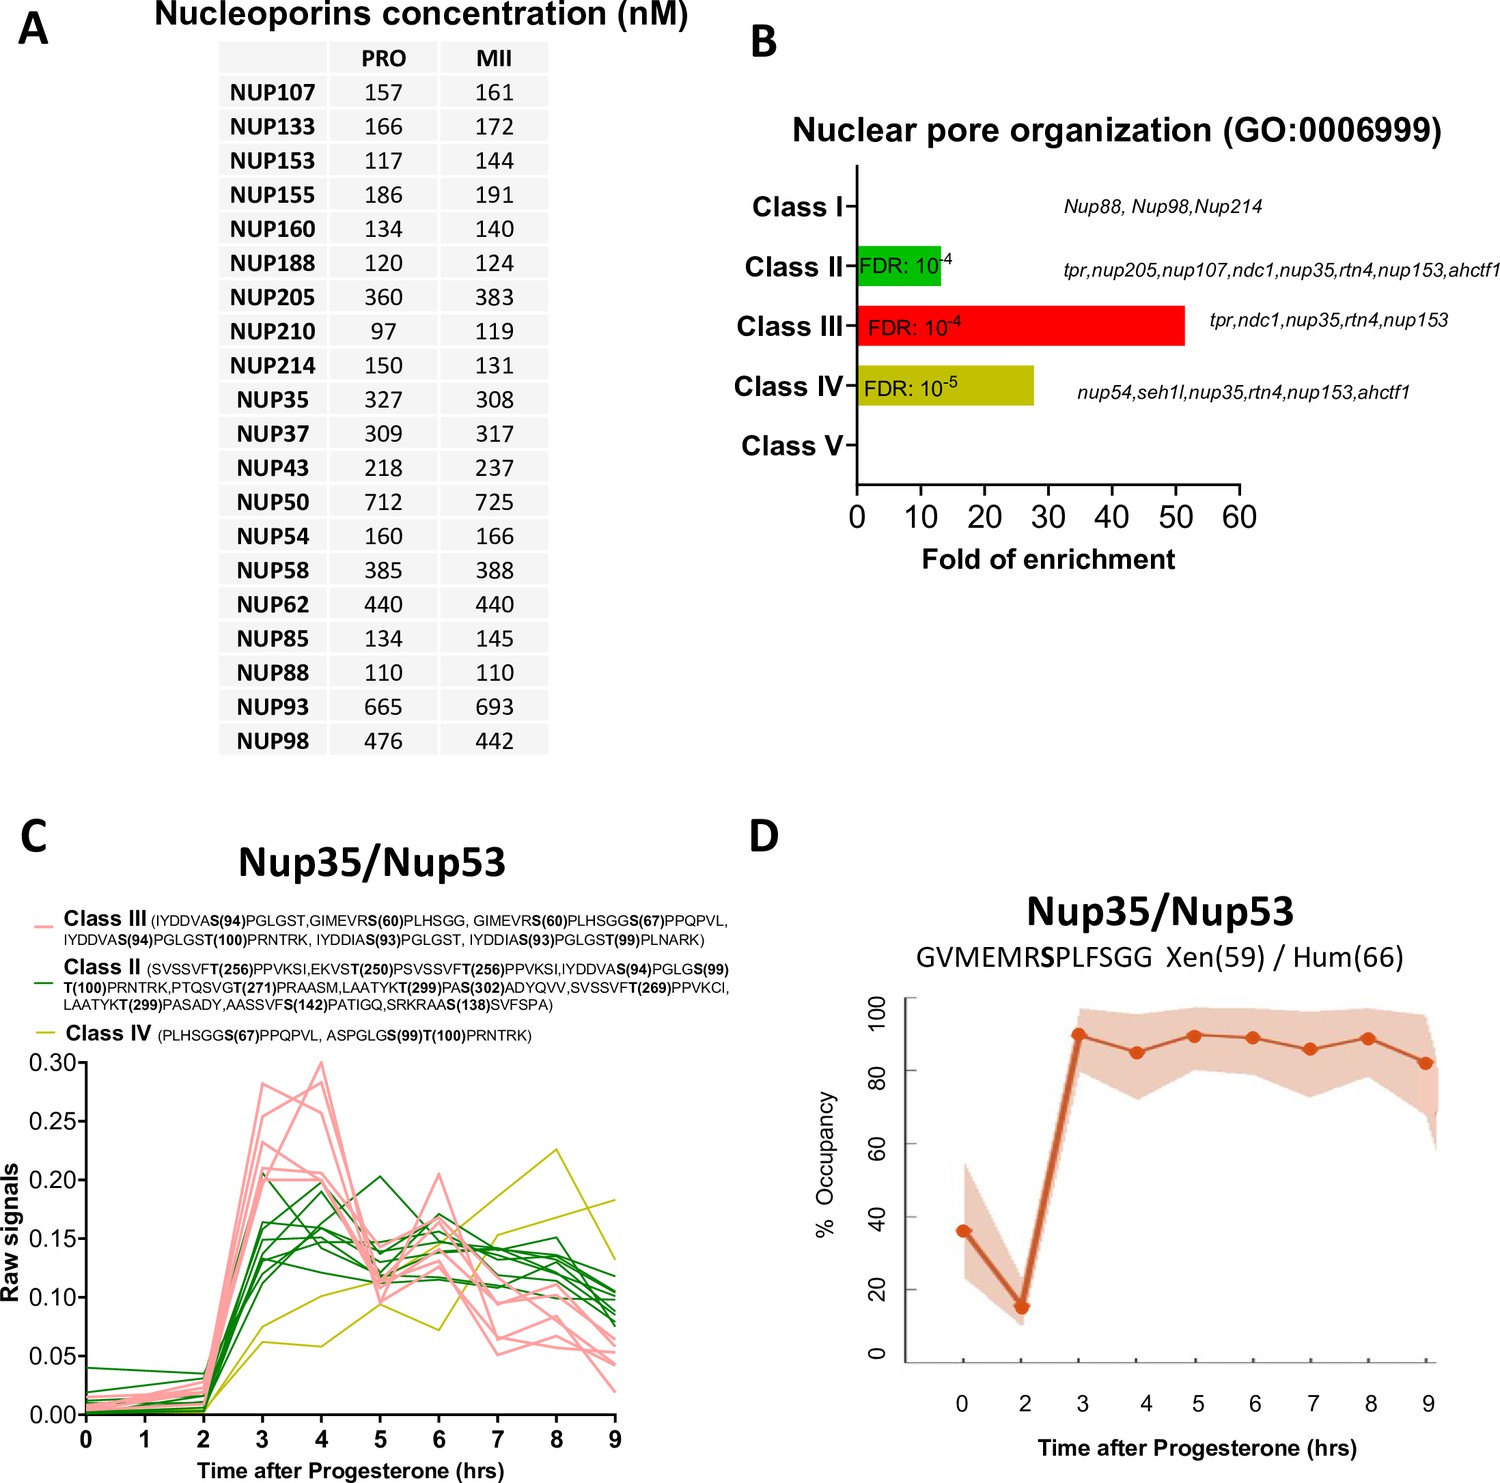
The phosphorylation pattern of nuclear pore components during meiotic divisions.
(A) Absolute concentration (nM) of nucleoporins in prophase (PRO) and metaphase II (MII) oocytes. (B) Gene ontology enrichment analysis of the biological process ‘nuclear pore organization’ (GO:0006999) among the phosphopeptides found in each class defined in Figure 3A. (C) Phosphorylation patterns of Nup35/Nup53. The phosphorylation curves are color-coded: Class II, green; Class III, red; Class IV, yellow. (D) High precision phospho-occupancy calculation of S59 phosphorylation pattern of Nup35/Nup53.
Figure 8 with 1 supplement

Centrosomal components during meiotic divisions.
Expression patterns of the components of the centrioles and the pericentriolar material. The changes in protein abundance are color-coded: unchanged = white, decreased = blue, increased = light orange. The estimation of the protein and mRNA concentrations was derived from published datasets and color-coded on a white-green scale for protein concentrations and on a white-yellow scale for mRNA concentrations.
Figure 8—figure supplement 1
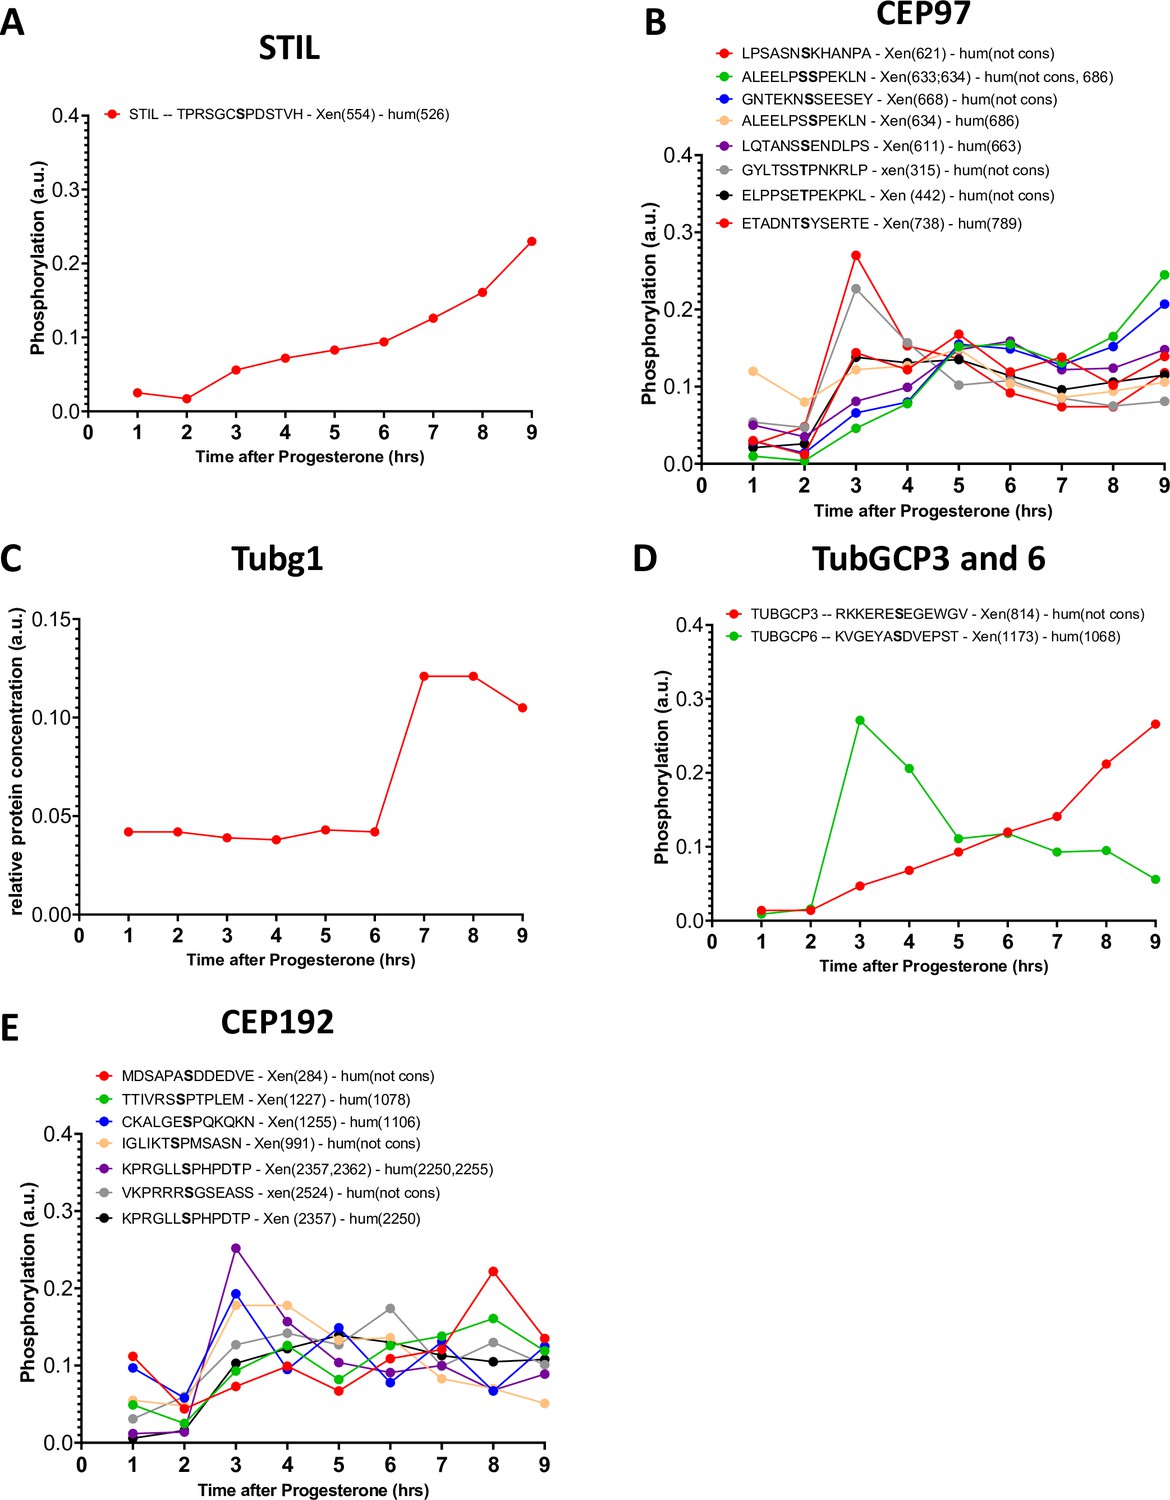
Phosphorylation patterns of centrosomal proteins during meiotic divisions.
(A–E) The levels of phosphorylation sites of STIL (A), CEP97 (B), Tubg1 (C), TubGCP3, and 6 (D) CEP192 (E) during meiotic divisions are plotted. The peptide sequences are reported with the phosphorylation sites marked in bold. The number of the phosphorylated residue is reported between breakers according to the Xenopus and human nomenclature.
Figure 9 with 1 supplement
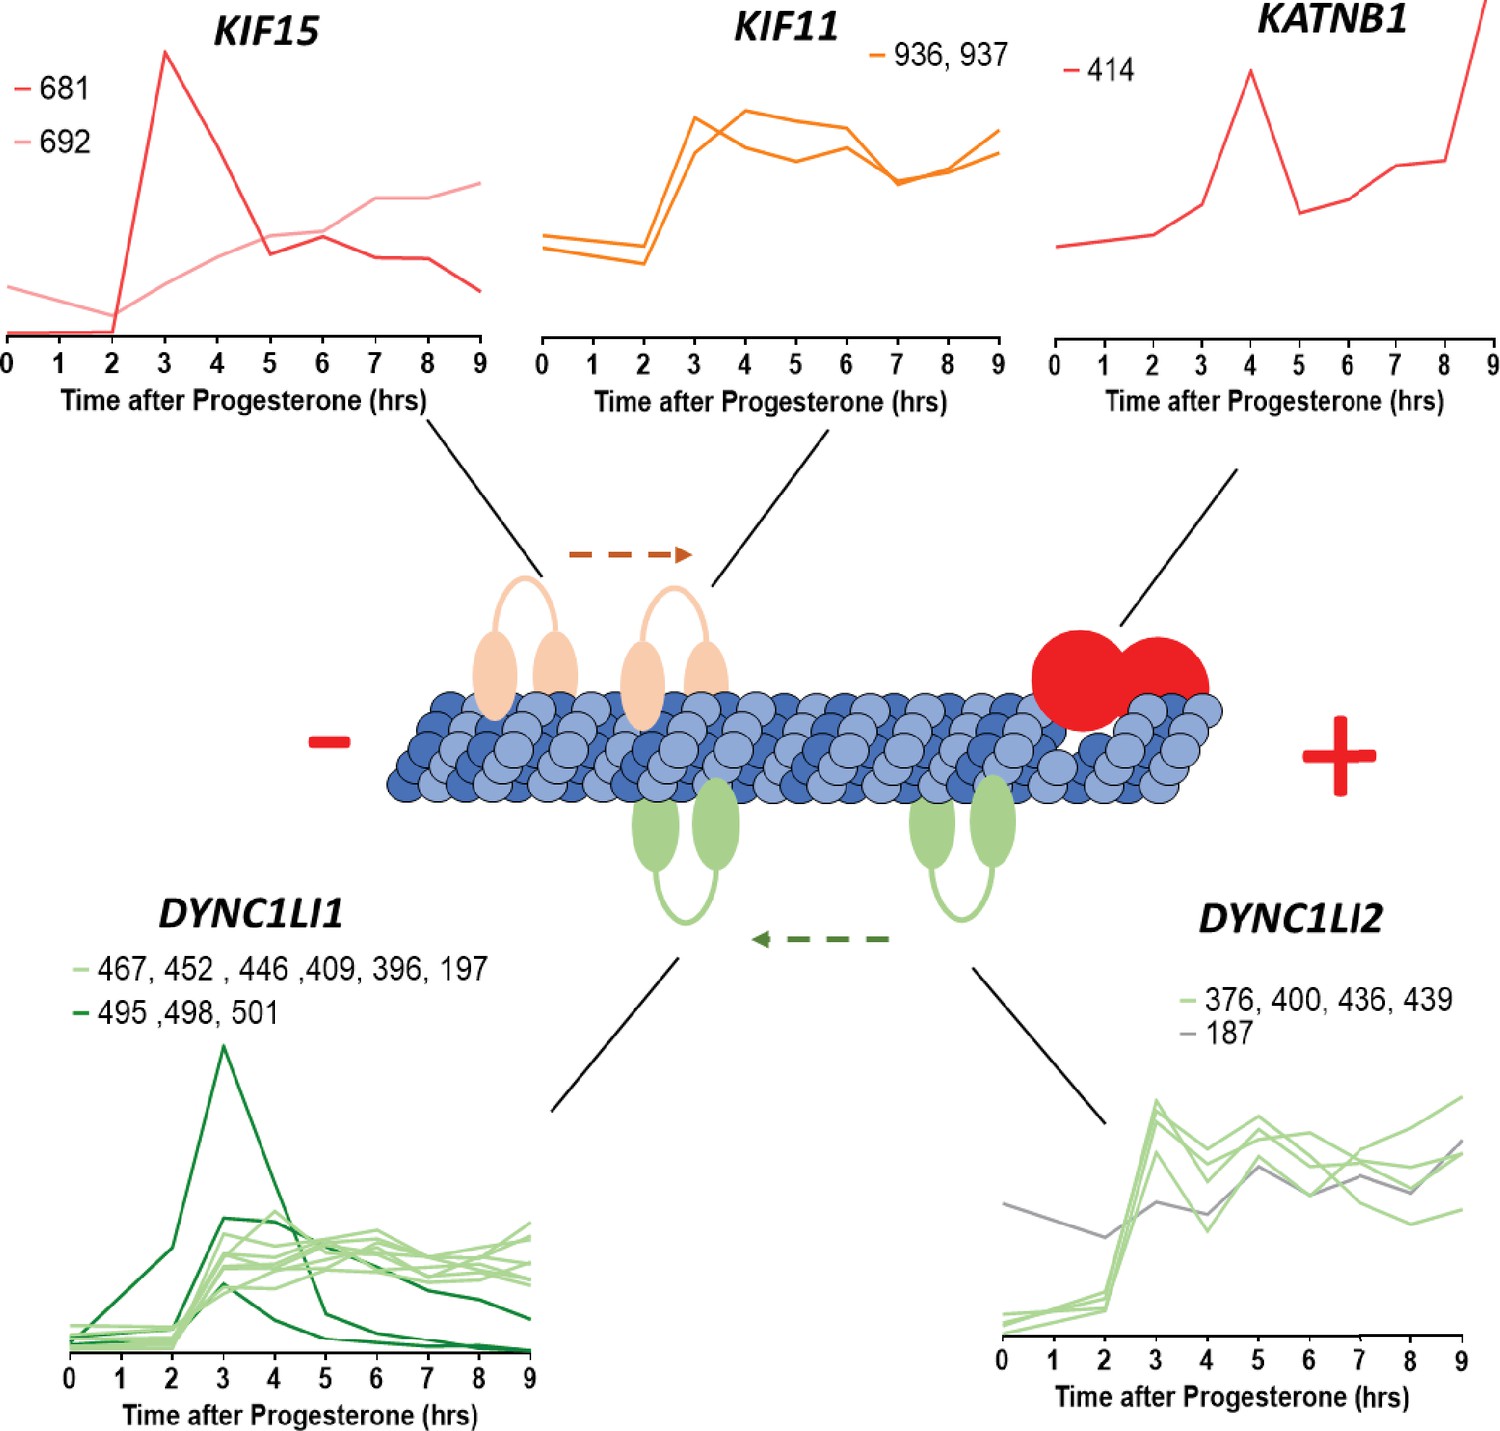
Microtubule-interacting proteins phosphorylation during meiotic divisions.
Graphic representation of the phosphorylation dynamics of kinesins (Kif15, Kif11), dyneins (DYNC1LI1, DYNC1LI2) and katanin (KATNB1) during meiotic divisions. The sites of the phosphorylation detected are marked above each panel.
Figure 9—figure supplement 1
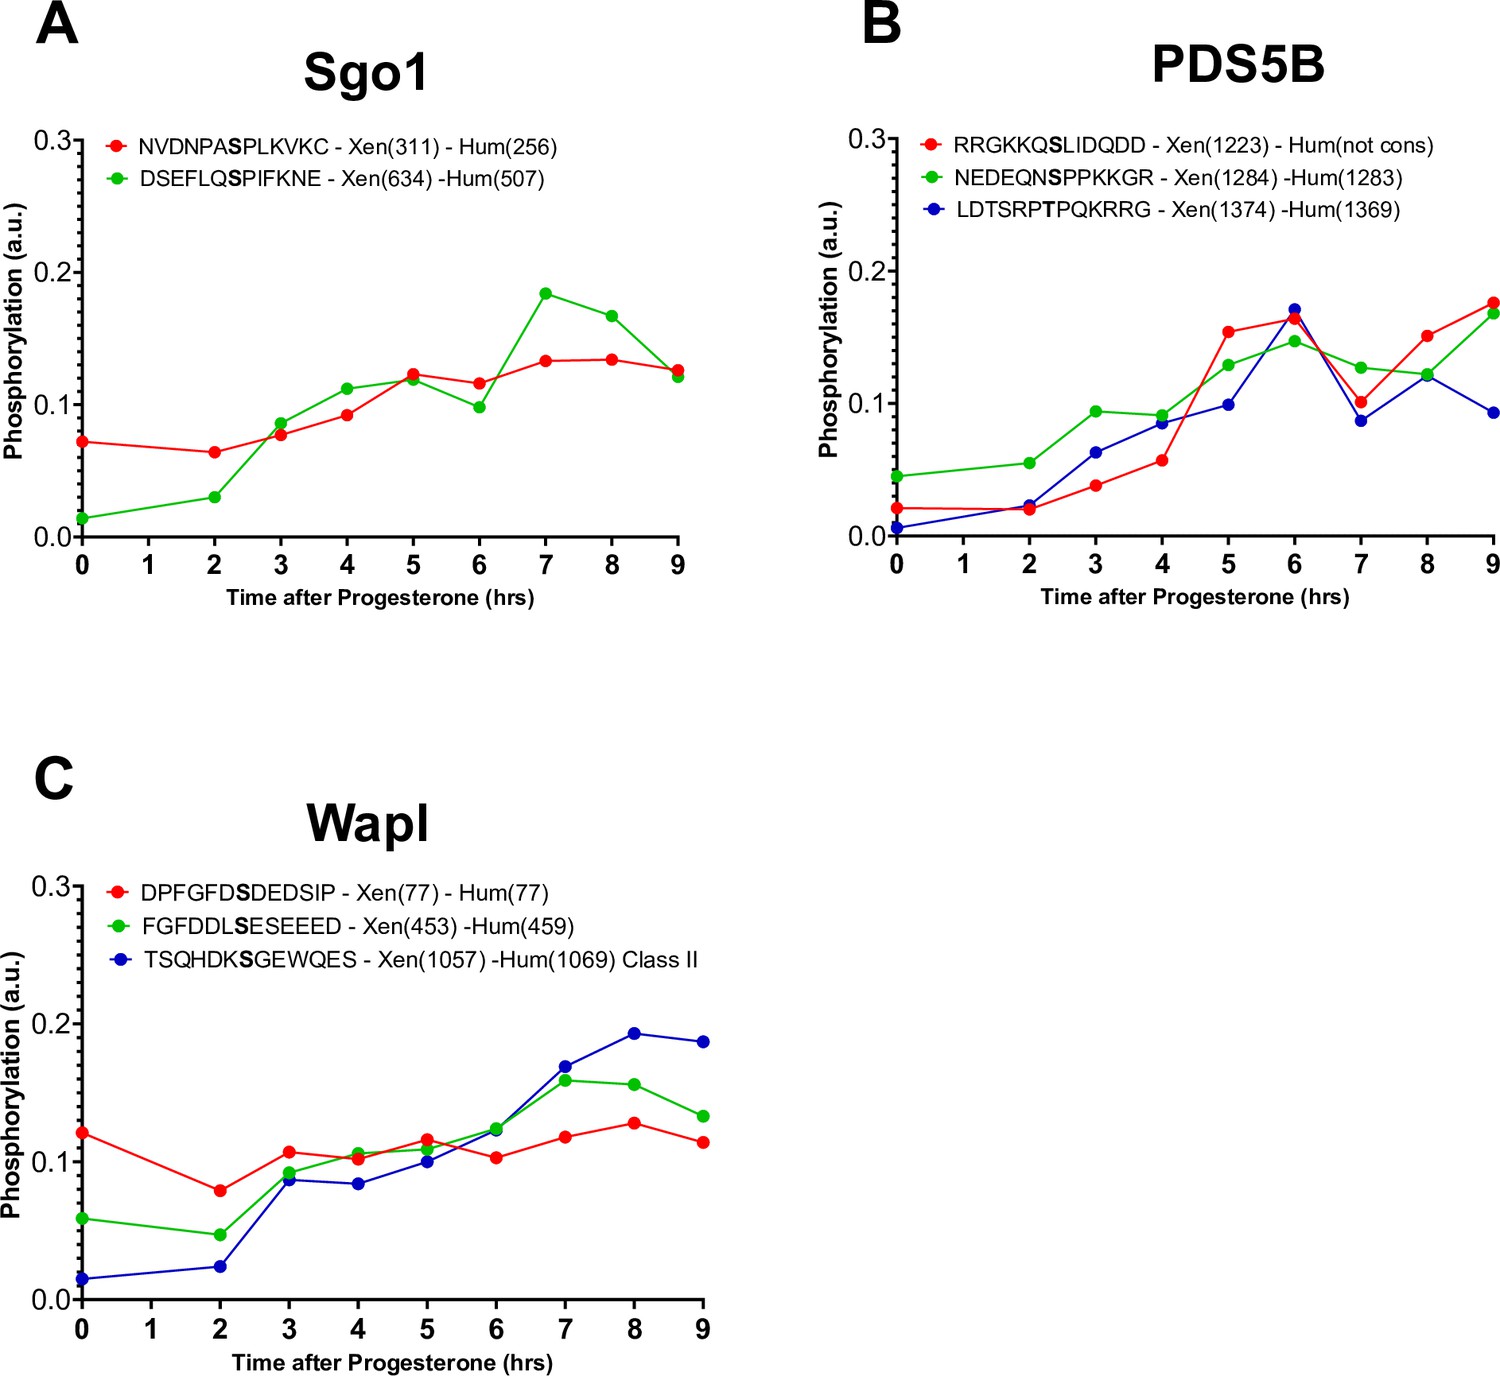
Phosphorylation patterns of cohesins during meiotic divisions.
(A–C) The levels of phosphorylation sites of Sgo1 (A), PDS5B (B), and Wapl (C) during meiotic divisions are plotted. The peptide sequences are reported with the phosphorylation sites marked in bold. The position of the residue phosphorylated is reported in brackets according to the Xenopus and human nomenclature.
Figure 10

Comparison of phosphorylation changes during meiotic divisions in Xenopus and mouse oocytes.
(A) Comparison of phosphorylation changes during meiotic divisions in Xenopus (our dataset) and mouse oocytes (Sun et al., 2024). Log2 fold changes in phosphorylation between prophase (PRO) and metaphase II are plotted. The Pearson correlation (r=0.39, p<0.0001) was calculated. (B) Selected examples of conserved phosphorylation sites between mouse and Xenopus. The kinase that was experimentally identified to phosphorylate the specific site is displayed together with the supporting reference. (C) Oocytes were microinjected with a specific inhibitor of Cdk1, Cip1. After overnight incubation, meiotic maturation was induced by progesterone. Oocytes were collected at different times after progesterone treatment. Karyopherin was used as a loading control. The phosphorylation of Fak1 at S913, Erk2 at T188, Plk1 at T201, and Akts1 at S208 was evaluated by western blot.
-
Figure 10—source data 1
Original files of the full raw uncropped blots of Figure 10C.
- https://cdn.elifesciences.org/articles/104255/elife-104255-fig10-data1-v1.zip
-
Figure 10—source data 2
Original western blots indicating the relevant bands used in Figure 10C.
- https://cdn.elifesciences.org/articles/104255/elife-104255-fig10-data2-v1.zip
Appendix 1—figure 1
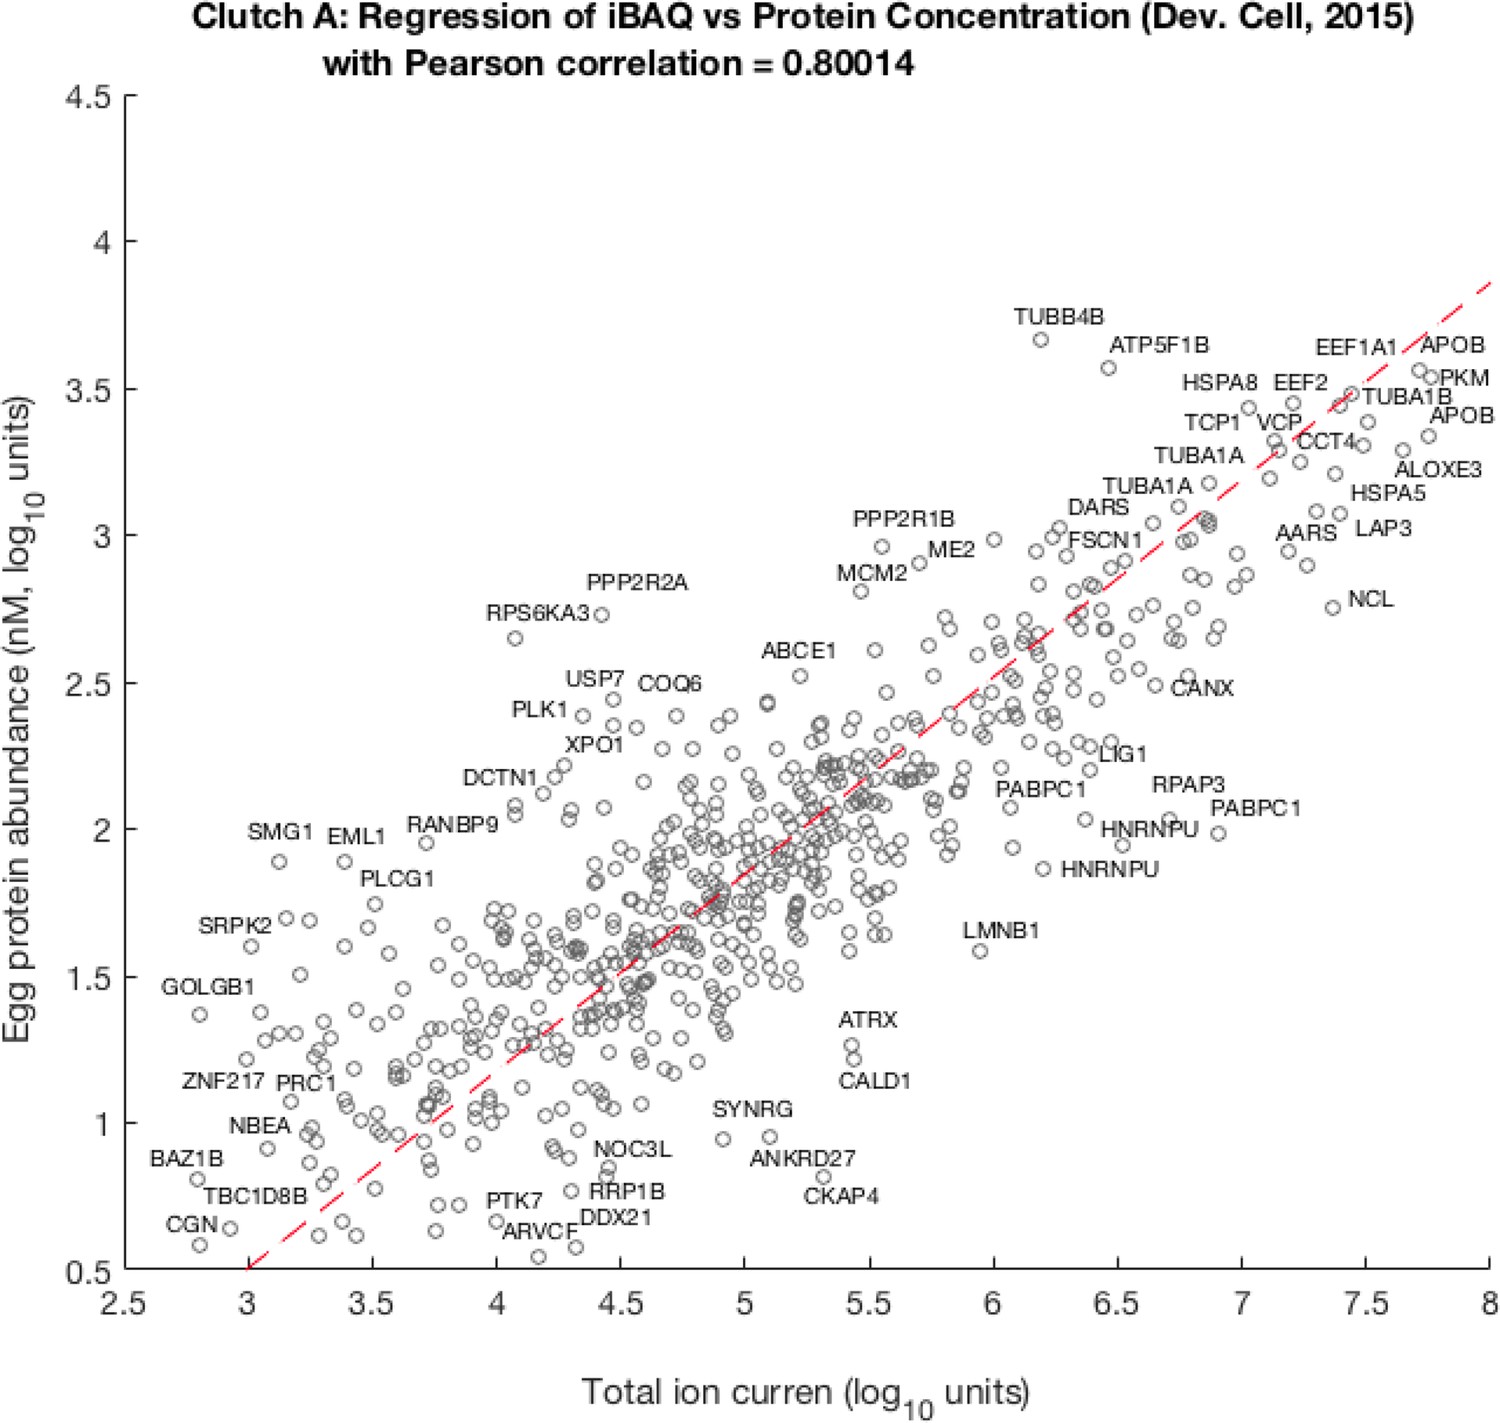
Scatter plot of per-channel pro-rated ion current (isobarically labeled fractions of the total Ι ion current) adjusted by theoretical number of tryptic peptides against egg protein abundance as previously published by Peshkin et al., 2015.
Pearson correlation between these quantities is ca. 0.8, the best linear fit leads to the following relation:
Appendix 1—figure 2

Venn diagram comparing proteins identified in this study to previously published by Wühr et al., 2014.
This study has 800 unique proteins versus 2024 unique proteins in the data by Wühr et al., 2014. There are 5063 proteins in common.
Appendix 1—figure 3

Comparison of average concentration (i.e. mean value of three different oocyte samples) with egg data published previously by Wühr et al., 2014.
The magenta points show the location of proteasome units and the blue points show the ribosomal proteins.
Appendix 1—figure 4

A scatter plot of a relative protein abundance in oocyte against abundance in follicular tissue.
The low abundant proteins are naturally masked in the follicular sample as they are contrasted to 10 oocyte samples, thus severely underrepresented in a pooled sample.
Appendix 1—figure 5

An illustration of occupancy calculation for a single peptide where four phospho-forms are measured.
The dephosphorylated, singly phosphorylated on a serine in one of two alternative positions, and doubly phosphorylated on both serines. All interconversions (A) across four forms are allowed by our calculation. The resulting stoichiometry and respective confidence intervals (B) estimated for each form following Presler et al., 2017 and BACIQ Peshkin et al., 2019. Points 1–9 are the time points post-progesterone stimulation, the two rightmost points are protease-treated samples.
Videos
Video 1
Meiotic maturation of Xenopus oocyte.
Video 2
Activation of Xenopus metaphase II oocytes.
Additional files
-
Supplementary file 1
Absolute concentrations of proteins.
- https://cdn.elifesciences.org/articles/104255/elife-104255-supp1-v1.xlsx
-
Supplementary file 2
Changes in protein abundance during meiotic maturation.
- https://cdn.elifesciences.org/articles/104255/elife-104255-supp2-v1.xlsx
-
Supplementary file 3
Changes in protein phosphorylation during meiotic maturation.
- https://cdn.elifesciences.org/articles/104255/elife-104255-supp3-v1.xlsx
-
Supplementary file 4
List of proteins whose phospho-occupancy was calculated.
- https://cdn.elifesciences.org/articles/104255/elife-104255-supp4-v1.xlsx
-
Supplementary file 5
Common phosphosites between Xenopus (this work) and mouse (Sun et al., 2024) datasets.
- https://cdn.elifesciences.org/articles/104255/elife-104255-supp5-v1.xlsx
-
MDAR checklist
- https://cdn.elifesciences.org/articles/104255/elife-104255-mdarchecklist1-v1.docx
-
Source code 1
MATLAB code to perform k-means clustering of time series.
- https://cdn.elifesciences.org/articles/104255/elife-104255-code1-v1.zip
Download links
A two-part list of links to download the article, or parts of the article, in various formats.
Downloads (link to download the article as PDF)
Open citations (links to open the citations from this article in various online reference manager services)
Cite this article (links to download the citations from this article in formats compatible with various reference manager tools)
Decoding protein phosphorylation during oocyte meiotic divisions using phosphoproteomics
eLife 13:RP104255.
https://doi.org/10.7554/eLife.104255.3


